Zip Codes with the Highest Percentage of Population Employed in Arts, Media & Entertainment in Kansas City, MO

RELATED REPORTS & OPTIONS

Arts, Media & Entertainment
Population
Families and Households
Female Fertility
Female Fertility (Unmarried)
Race (Community Size)
Race (Percentage)
Ancestry (Community Size)
AfghanAfricanAlaska NativeAlbanianAmericanApacheArabArgentineanArmenianAustralianAustrianBahamianBangladeshiBelgianBelizeanBhutaneseBlackfeetBolivianBrazilianBritishBulgarianBurmeseCanadianCelticCentral AmericanCentral American IndianCherokeeChickasawChileanChippewaChoctawColombianComancheCosta RicanCreeCreekCroatianCrowCubanCzechCzechoslovakianDanishDominicanDutchDutch West IndianEastern EuropeanEcuadorianEgyptianEnglishEthiopianEuropeanFijianFilipinoFinnishFrenchFrench American IndianFrench CanadianGermanGerman RussianGhanaianGreekGuamanian / ChamorroGuatemalanGuyaneseHaitianHonduranHungarianIcelanderIndian (Asian)IndonesianIranianIraqiIrishIroquoisIsraeliItalianJamaicanJapaneseJordanianKenyanKoreanLaotianLatvianLebaneseLiberianLithuanianLuxembourgerMalaysianMexicanMexican American IndianMongolianMoroccanNative HawaiianNavajoNew ZealanderNicaraguanNigerianNorthern EuropeanNorwegianOsageOttawaPakistaniPalestinianPanamanianPennsylvania GermanPeruvianPolishPortuguesePotawatomiPuebloPuerto RicanRomanianRussianSalvadoranSamoanScandinavianScotch-IrishScottishSeminoleSerbianShoshoneSierra LeoneanSiouxSlavicSlovakSloveneSomaliSouth AfricanSouth AmericanSouth American IndianSpaniardSpanishSri LankanSubsaharan AfricanSudaneseSwedishSwissSyrianThaiTrinidadian and TobagonianTurkishUgandanUkrainianUruguayanVenezuelanVietnameseWelshWest IndianYugoslavian
Ancestry (Percentage)
AfghanAfricanAlaska NativeAlbanianAmericanApacheArabArgentineanArmenianAustralianAustrianBahamianBangladeshiBelgianBelizeanBhutaneseBlackfeetBolivianBrazilianBritishBulgarianBurmeseCanadianCelticCentral AmericanCentral American IndianCherokeeChickasawChileanChippewaChoctawColombianComancheCosta RicanCreeCreekCroatianCrowCubanCzechCzechoslovakianDanishDominicanDutchDutch West IndianEastern EuropeanEcuadorianEgyptianEnglishEthiopianEuropeanFijianFilipinoFinnishFrenchFrench American IndianFrench CanadianGermanGerman RussianGhanaianGreekGuamanian / ChamorroGuatemalanGuyaneseHaitianHonduranHungarianIcelanderIndian (Asian)IndonesianIranianIraqiIrishIroquoisIsraeliItalianJamaicanJapaneseJordanianKenyanKoreanLaotianLatvianLebaneseLiberianLithuanianLuxembourgerMalaysianMexicanMexican American IndianMongolianMoroccanNative HawaiianNavajoNew ZealanderNicaraguanNigerianNorthern EuropeanNorwegianOsageOttawaPakistaniPalestinianPanamanianPennsylvania GermanPeruvianPolishPortuguesePotawatomiPuebloPuerto RicanRomanianRussianSalvadoranSamoanScandinavianScotch-IrishScottishSeminoleSerbianShoshoneSierra LeoneanSiouxSlavicSlovakSloveneSomaliSouth AfricanSouth AmericanSouth American IndianSpaniardSpanishSri LankanSubsaharan AfricanSudaneseSwedishSwissSyrianThaiTrinidadian and TobagonianTurkishUgandanUkrainianUruguayanVenezuelanVietnameseWelshWest IndianYugoslavian
Immigrant Origin (Total)
AfghanistanAfricaArgentinaAsiaAustraliaBahamasBangladeshBelarusBelgiumBelizeBoliviaBosnia and HerzegovinaBrazilBulgariaBurma / MyanmarCambodiaCameroonCanadaCaribbeanCentral AmericaChileChinaColombiaCongoCosta RicaCubaCzechoslovakiaDenmarkDominican RepublicEastern AfricaEastern AsiaEastern EuropeEcuadorEgyptEl SalvadorEnglandEritreaEthiopiaEuropeFijiFranceGermanyGhanaGreeceGuatemalaGuyanaHaitiHondurasHong KongHungaryIndiaIndonesiaIranIraqIrelandIsraelItalyJamaicaJapanJordanKazakhstanKenyaKoreaKuwaitLaosLatin AmericaLebanonLiberiaMalaysiaMexicoMicronesiaMiddle AfricaMoroccoNepalNetherlandsNicaraguaNigeriaNorthern AfricaNorthern EuropeOceaniaPakistanPeruPhilippinesPolandPortugalRomaniaRussiaSaudi ArabiaScotlandSierra LeoneSomaliaSouth AfricaSouth AmericaSouth Central AsiaSouth Eastern AsiaSouthern EuropeSpainSri LankaSudanSwedenSwitzerlandSyriaTaiwanThailandTrinidad and TobagoTurkeyUgandaUkraineUruguayVenezuelaVietnamWestern AfricaWestern AsiaWestern EuropeZaireZimbabwe
Immigrant Origin (Percentage)
AfghanistanAfricaArgentinaAsiaAustraliaBahamasBangladeshBelarusBelgiumBelizeBoliviaBosnia and HerzegovinaBrazilBulgariaBurma / MyanmarCambodiaCameroonCanadaCaribbeanCentral AmericaChileChinaColombiaCongoCosta RicaCubaCzechoslovakiaDenmarkDominican RepublicEastern AfricaEastern AsiaEastern EuropeEcuadorEgyptEl SalvadorEnglandEritreaEthiopiaEuropeFijiFranceGermanyGhanaGreeceGuatemalaGuyanaHaitiHondurasHong KongHungaryIndiaIndonesiaIranIraqIrelandIsraelItalyJamaicaJapanJordanKazakhstanKenyaKoreaKuwaitLaosLatin AmericaLebanonLiberiaMalaysiaMexicoMicronesiaMiddle AfricaMoroccoNepalNetherlandsNicaraguaNigeriaNorthern AfricaNorthern EuropeOceaniaPakistanPeruPhilippinesPolandPortugalRomaniaRussiaSaudi ArabiaScotlandSierra LeoneSomaliaSouth AfricaSouth AmericaSouth Central AsiaSouth Eastern AsiaSouthern EuropeSpainSri LankaSudanSwedenSwitzerlandSyriaTaiwanThailandTrinidad and TobagoTurkeyUgandaUkraineUruguayVenezuelaVietnamWestern AfricaWestern AsiaWestern EuropeZaireZimbabwe
Income
Income (Families)
Income (Households)
Poverty
Poverty (Families)
Unemployment
Employment Occupations
Employment Industries
Employer Class
Commute Time
Commute Means
School Enrollment
Education by Degree Field
Occupancy
Finances
Physical Characteristics
Kansas City
Compare Zip Codes
Comparison Subject

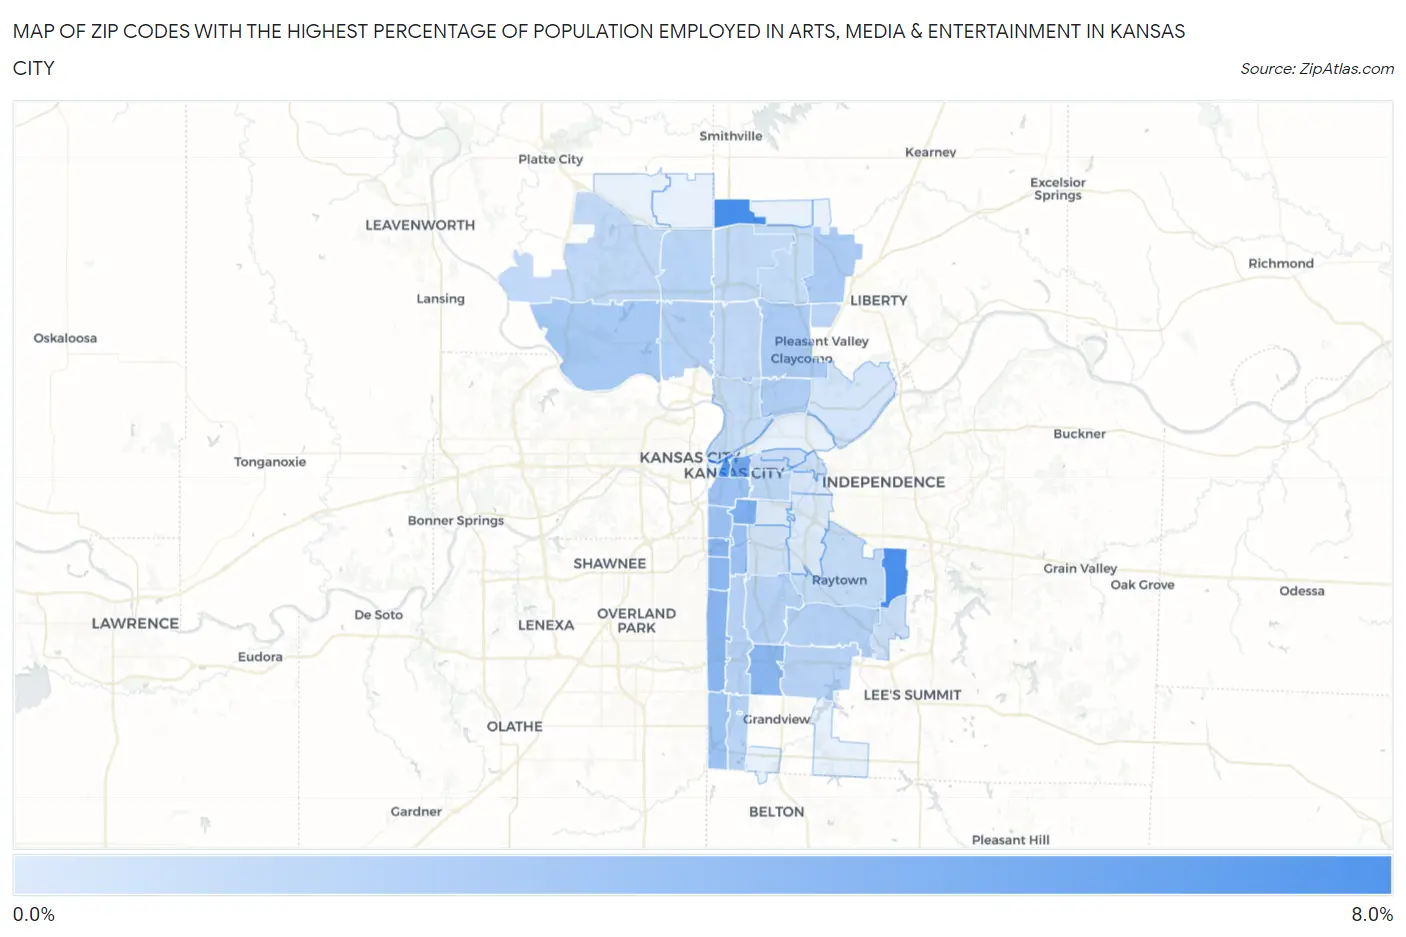
Map of Zip Codes with the Highest Percentage of Population Employed in Arts, Media & Entertainment in Kansas City

0.0%
8.0%
Zip Codes with the Highest Percentage of Population Employed in Arts, Media & Entertainment in Kansas City Map

Zip Codes with the Highest Percentage of Population Employed in Arts, Media & Entertainment in Kansas City, MO

Zip Code % Employed vs State vs National
1.641658.0%1.7%(+6.34)#102.1%(+5.94)#554
2.641367.9%1.7%(+6.22)#112.1%(+5.81)#568
3.641057.3%1.7%(+5.63)#122.1%(+5.23)#692
4.641065.6%1.7%(+3.95)#232.1%(+3.54)#1,195
5.641095.0%1.7%(+3.39)#292.1%(+2.98)#1,473
6.641124.6%1.7%(+2.95)#342.1%(+2.55)#1,772
7.641374.5%1.7%(+2.84)#362.1%(+2.43)#1,858
8.641144.5%1.7%(+2.83)#372.1%(+2.42)#1,865
9.641134.2%1.7%(+2.50)#422.1%(+2.10)#2,181
10.641113.7%1.7%(+2.00)#572.1%(+1.59)#2,828
11.641103.6%1.7%(+1.92)#612.1%(+1.51)#2,954
12.641083.5%1.7%(+1.85)#622.1%(+1.45)#3,058
13.641453.4%1.7%(+1.76)#662.1%(+1.35)#3,214
14.641522.9%1.7%(+1.28)#832.1%(+0.871)#4,255
15.641192.7%1.7%(+0.994)#1002.1%(+0.590)#5,061
16.641572.6%1.7%(+0.983)#1022.1%(+0.579)#5,097
17.641172.4%1.7%(+0.727)#1162.1%(+0.323)#5,993
18.641382.2%1.7%(+0.496)#1402.1%(+0.092)#7,041
19.641512.1%1.7%(+0.481)#1412.1%(+0.076)#7,097
20.641312.1%1.7%(+0.449)#1482.1%(+0.044)#7,253
21.641322.1%1.7%(+0.422)#1502.1%(+0.018)#7,388
22.641342.0%1.7%(+0.376)#1562.1%(-0.029)#7,646
23.641462.0%1.7%(+0.347)#1612.1%(-0.058)#7,804
24.641542.0%1.7%(+0.336)#1652.1%(-0.068)#7,851
25.641582.0%1.7%(+0.304)#1692.1%(-0.100)#8,020
26.641271.8%1.7%(+0.128)#1952.1%(-0.276)#9,070
27.641181.6%1.7%(-0.030)#2202.1%(-0.434)#10,152
28.641531.6%1.7%(-0.047)#2232.1%(-0.452)#10,277
29.641551.5%1.7%(-0.183)#2412.1%(-0.587)#11,158
30.641561.4%1.7%(-0.233)#2522.1%(-0.638)#11,541
31.641161.4%1.7%(-0.241)#2532.1%(-0.645)#11,599
32.641331.4%1.7%(-0.297)#2652.1%(-0.701)#11,996
33.641241.2%1.7%(-0.439)#2882.1%(-0.843)#13,086
34.641251.0%1.7%(-0.614)#3192.1%(-1.02)#14,468
35.641390.97%1.7%(-0.687)#3412.1%(-1.09)#15,068
36.641230.96%1.7%(-0.701)#3432.1%(-1.10)#15,179
37.641300.73%1.7%(-0.924)#3842.1%(-1.33)#16,968
38.641610.71%1.7%(-0.942)#3902.1%(-1.35)#17,118
39.641260.30%1.7%(-1.36)#4982.1%(-1.76)#20,358
40.641280.21%1.7%(-1.44)#5262.1%(-1.85)#20,878
41.641290.21%1.7%(-1.45)#5272.1%(-1.85)#20,902

Common Questions

What are the Top 10 Zip Codes with the Highest Percentage of Population Employed in Arts, Media & Entertainment in Kansas City, MO?
Top 10 Zip Codes with the Highest Percentage of Population Employed in Arts, Media & Entertainment in Kansas City, MO are:
#1
8.0%
#2
7.9%
#3
7.3%
#4
5.6%
#5
5.0%
#6
4.6%
#7
4.5%
#8
4.5%
#9
4.2%
#10
3.7%
What zip code has the Highest Percentage of Population Employed in Arts, Media & Entertainment in Kansas City, MO?
64165 has the Highest Percentage of Population Employed in Arts, Media & Entertainment in Kansas City, MO with 8.0%.
What is the Percentage of Population Employed in Arts, Media & Entertainment in Kansas City, MO?
Percentage of Population Employed in Arts, Media & Entertainment in Kansas City is 2.6%.
What is the Percentage of Population Employed in Arts, Media & Entertainment in Missouri?
Percentage of Population Employed in Arts, Media & Entertainment in Missouri is 1.7%.
What is the Percentage of Population Employed in Arts, Media & Entertainment in the United States?
Percentage of Population Employed in Arts, Media & Entertainment in the United States is 2.1%.