Zip Codes with the Lowest Percentage of Births to Unmarried Women in Kansas City, MO

RELATED REPORTS & OPTIONS

Lowest Illegitimacy | All Women
Population
Families and Households
Female Fertility
Female Fertility (Unmarried)
Race (Community Size)
Race (Percentage)
Ancestry (Community Size)
AfghanAfricanAlaska NativeAlbanianAmericanApacheArabArgentineanArmenianAustralianAustrianBahamianBangladeshiBelgianBelizeanBhutaneseBlackfeetBolivianBrazilianBritishBulgarianBurmeseCanadianCelticCentral AmericanCentral American IndianCherokeeChickasawChileanChippewaChoctawColombianComancheCosta RicanCreeCreekCroatianCrowCubanCzechCzechoslovakianDanishDominicanDutchDutch West IndianEastern EuropeanEcuadorianEgyptianEnglishEthiopianEuropeanFijianFilipinoFinnishFrenchFrench American IndianFrench CanadianGermanGerman RussianGhanaianGreekGuamanian / ChamorroGuatemalanGuyaneseHaitianHonduranHungarianIcelanderIndian (Asian)IndonesianIranianIraqiIrishIroquoisIsraeliItalianJamaicanJapaneseJordanianKenyanKoreanLaotianLatvianLebaneseLiberianLithuanianLuxembourgerMalaysianMexicanMexican American IndianMongolianMoroccanNative HawaiianNavajoNew ZealanderNicaraguanNigerianNorthern EuropeanNorwegianOsageOttawaPakistaniPalestinianPanamanianPennsylvania GermanPeruvianPolishPortuguesePotawatomiPuebloPuerto RicanRomanianRussianSalvadoranSamoanScandinavianScotch-IrishScottishSeminoleSerbianShoshoneSierra LeoneanSiouxSlavicSlovakSloveneSomaliSouth AfricanSouth AmericanSouth American IndianSpaniardSpanishSri LankanSubsaharan AfricanSudaneseSwedishSwissSyrianThaiTrinidadian and TobagonianTurkishUgandanUkrainianUruguayanVenezuelanVietnameseWelshWest IndianYugoslavian
Ancestry (Percentage)
AfghanAfricanAlaska NativeAlbanianAmericanApacheArabArgentineanArmenianAustralianAustrianBahamianBangladeshiBelgianBelizeanBhutaneseBlackfeetBolivianBrazilianBritishBulgarianBurmeseCanadianCelticCentral AmericanCentral American IndianCherokeeChickasawChileanChippewaChoctawColombianComancheCosta RicanCreeCreekCroatianCrowCubanCzechCzechoslovakianDanishDominicanDutchDutch West IndianEastern EuropeanEcuadorianEgyptianEnglishEthiopianEuropeanFijianFilipinoFinnishFrenchFrench American IndianFrench CanadianGermanGerman RussianGhanaianGreekGuamanian / ChamorroGuatemalanGuyaneseHaitianHonduranHungarianIcelanderIndian (Asian)IndonesianIranianIraqiIrishIroquoisIsraeliItalianJamaicanJapaneseJordanianKenyanKoreanLaotianLatvianLebaneseLiberianLithuanianLuxembourgerMalaysianMexicanMexican American IndianMongolianMoroccanNative HawaiianNavajoNew ZealanderNicaraguanNigerianNorthern EuropeanNorwegianOsageOttawaPakistaniPalestinianPanamanianPennsylvania GermanPeruvianPolishPortuguesePotawatomiPuebloPuerto RicanRomanianRussianSalvadoranSamoanScandinavianScotch-IrishScottishSeminoleSerbianShoshoneSierra LeoneanSiouxSlavicSlovakSloveneSomaliSouth AfricanSouth AmericanSouth American IndianSpaniardSpanishSri LankanSubsaharan AfricanSudaneseSwedishSwissSyrianThaiTrinidadian and TobagonianTurkishUgandanUkrainianUruguayanVenezuelanVietnameseWelshWest IndianYugoslavian
Immigrant Origin (Total)
AfghanistanAfricaArgentinaAsiaAustraliaBahamasBangladeshBelarusBelgiumBelizeBoliviaBosnia and HerzegovinaBrazilBulgariaBurma / MyanmarCambodiaCameroonCanadaCaribbeanCentral AmericaChileChinaColombiaCongoCosta RicaCubaCzechoslovakiaDenmarkDominican RepublicEastern AfricaEastern AsiaEastern EuropeEcuadorEgyptEl SalvadorEnglandEritreaEthiopiaEuropeFijiFranceGermanyGhanaGreeceGuatemalaGuyanaHaitiHondurasHong KongHungaryIndiaIndonesiaIranIraqIrelandIsraelItalyJamaicaJapanJordanKazakhstanKenyaKoreaKuwaitLaosLatin AmericaLebanonLiberiaMalaysiaMexicoMicronesiaMiddle AfricaMoroccoNepalNetherlandsNicaraguaNigeriaNorthern AfricaNorthern EuropeOceaniaPakistanPeruPhilippinesPolandPortugalRomaniaRussiaSaudi ArabiaScotlandSierra LeoneSomaliaSouth AfricaSouth AmericaSouth Central AsiaSouth Eastern AsiaSouthern EuropeSpainSri LankaSudanSwedenSwitzerlandSyriaTaiwanThailandTrinidad and TobagoTurkeyUgandaUkraineUruguayVenezuelaVietnamWestern AfricaWestern AsiaWestern EuropeZaireZimbabwe
Immigrant Origin (Percentage)
AfghanistanAfricaArgentinaAsiaAustraliaBahamasBangladeshBelarusBelgiumBelizeBoliviaBosnia and HerzegovinaBrazilBulgariaBurma / MyanmarCambodiaCameroonCanadaCaribbeanCentral AmericaChileChinaColombiaCongoCosta RicaCubaCzechoslovakiaDenmarkDominican RepublicEastern AfricaEastern AsiaEastern EuropeEcuadorEgyptEl SalvadorEnglandEritreaEthiopiaEuropeFijiFranceGermanyGhanaGreeceGuatemalaGuyanaHaitiHondurasHong KongHungaryIndiaIndonesiaIranIraqIrelandIsraelItalyJamaicaJapanJordanKazakhstanKenyaKoreaKuwaitLaosLatin AmericaLebanonLiberiaMalaysiaMexicoMicronesiaMiddle AfricaMoroccoNepalNetherlandsNicaraguaNigeriaNorthern AfricaNorthern EuropeOceaniaPakistanPeruPhilippinesPolandPortugalRomaniaRussiaSaudi ArabiaScotlandSierra LeoneSomaliaSouth AfricaSouth AmericaSouth Central AsiaSouth Eastern AsiaSouthern EuropeSpainSri LankaSudanSwedenSwitzerlandSyriaTaiwanThailandTrinidad and TobagoTurkeyUgandaUkraineUruguayVenezuelaVietnamWestern AfricaWestern AsiaWestern EuropeZaireZimbabwe
Income
Income (Families)
Income (Households)
Poverty
Poverty (Families)
Unemployment
Employment Occupations
Employment Industries
Employer Class
Commute Time
Commute Means
School Enrollment
Education by Degree Field
Occupancy
Finances
Physical Characteristics
Kansas City
Compare Zip Codes
Comparison Subject

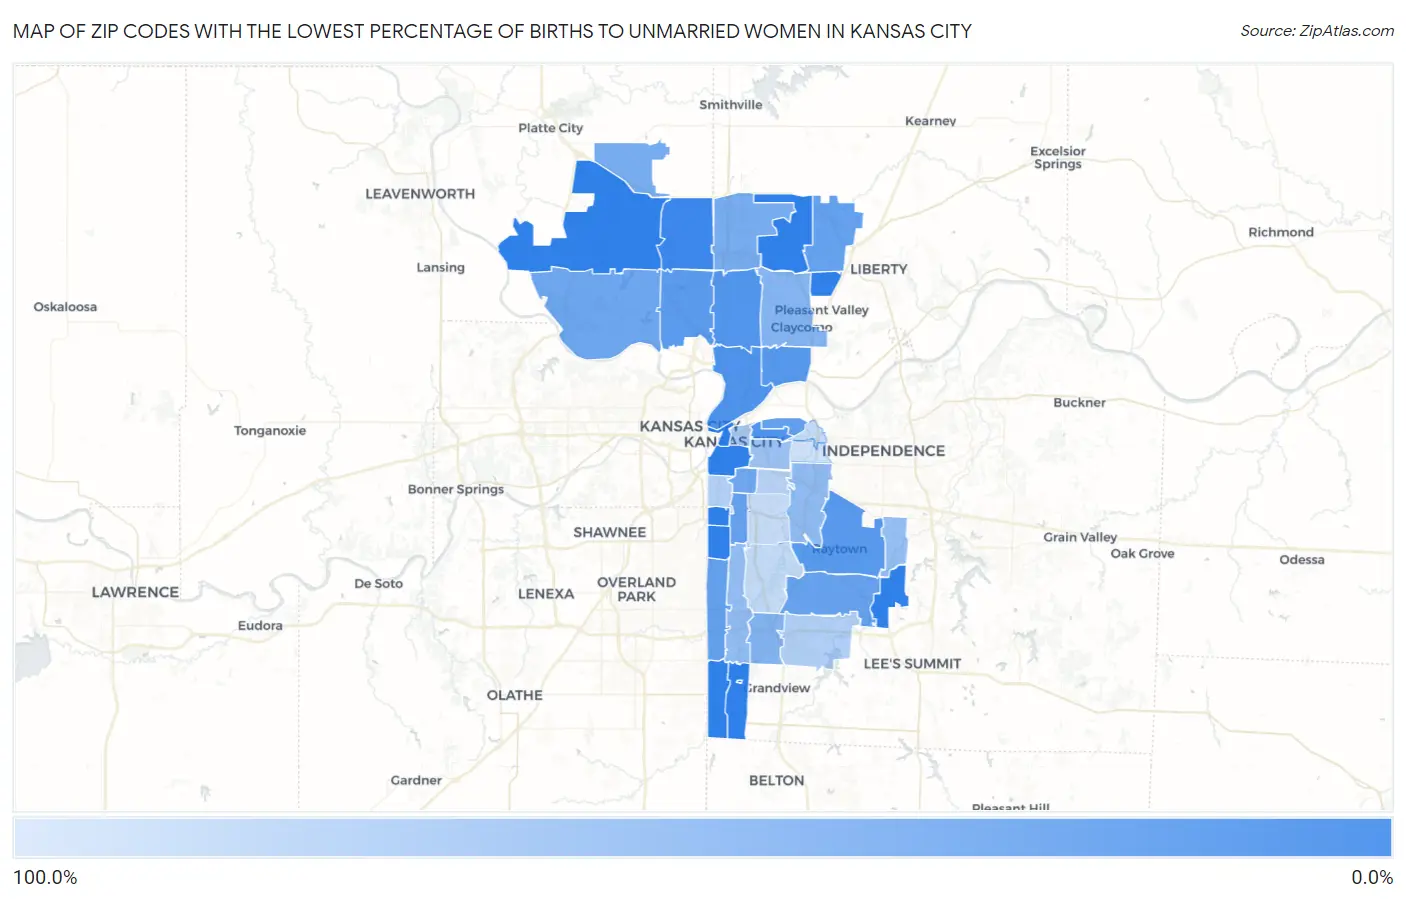
Map of Zip Codes with the Lowest Percentage of Births to Unmarried Women in Kansas City

100.0%
0.0%
Zip Codes with the Lowest Percentage of Births to Unmarried Women in Kansas City Map

Zip Codes with the Lowest Percentage of Births to Unmarried Women in Kansas City, MO

Zip Code % Unmarried vs State vs National
1.641546.6%30.2%(-23.6)#3232.1%(-25.5)#1,015
2.6411613.8%30.2%(-16.4)#6732.1%(-18.3)#2,803
3.6412416.3%30.2%(-13.9)#9032.1%(-15.8)#3,521
4.6411816.4%30.2%(-13.8)#9232.1%(-15.7)#3,537
5.6411717.8%30.2%(-12.4)#10432.1%(-14.3)#3,903
6.6413318.9%30.2%(-11.3)#11432.1%(-13.2)#4,185
7.6415120.3%30.2%(-9.90)#12132.1%(-11.8)#4,593
8.6411424.3%30.2%(-5.90)#15032.1%(-7.80)#5,605
9.6412324.3%30.2%(-5.90)#15132.1%(-7.80)#5,612
10.6415724.6%30.2%(-5.60)#15432.1%(-7.50)#5,683
11.6411024.7%30.2%(-5.50)#15632.1%(-7.40)#5,709
12.6413825.3%30.2%(-4.90)#16532.1%(-6.80)#5,915
13.6415228.0%30.2%(-2.20)#18632.1%(-4.10)#6,552
14.6410929.5%30.2%(-0.700)#20032.1%(-2.60)#6,937
15.6415532.2%30.2%(+2.00)#22332.1%(+0.100)#7,589
16.6416333.3%30.2%(+3.10)#23232.1%(+1.20)#7,949
17.6413738.7%30.2%(+8.50)#24832.1%(+6.60)#9,122
18.6411939.5%30.2%(+9.30)#25732.1%(+7.40)#9,307
19.6412945.2%30.2%(+15.0)#28632.1%(+13.1)#10,556
20.6413147.5%30.2%(+17.3)#30132.1%(+15.4)#11,045
21.6413649.2%30.2%(+19.0)#30832.1%(+17.1)#11,335
22.6412751.6%30.2%(+21.4)#32432.1%(+19.5)#11,814
23.6410657.9%30.2%(+27.7)#34032.1%(+25.8)#12,749
24.6413463.7%30.2%(+33.5)#36232.1%(+31.6)#13,524
25.6411164.9%30.2%(+34.7)#36932.1%(+32.8)#13,669
26.6412868.8%30.2%(+38.6)#37932.1%(+36.7)#14,097
27.6413276.0%30.2%(+45.8)#39732.1%(+43.9)#14,791
28.6412576.9%30.2%(+46.7)#40132.1%(+44.8)#14,887
29.6413078.3%30.2%(+48.1)#40532.1%(+46.2)#15,012
30.6412684.5%30.2%(+54.3)#41532.1%(+52.4)#15,416

Common Questions

What are the Top 10 Zip Codes with the Lowest Percentage of Births to Unmarried Women in Kansas City, MO?
Top 10 Zip Codes with the Lowest Percentage of Births to Unmarried Women in Kansas City, MO are:
#1
0.0%
#2
0.0%
#3
0.0%
#4
0.0%
#5
0.0%
#6
0.0%
#7
0.0%
#8
0.0%
#9
0.0%
#10
0.0%
What zip code has the Lowest Percentage of Births to Unmarried Women in Kansas City, MO?
64154 has the Lowest Percentage of Births to Unmarried Women in Kansas City, MO with 6.6%.
What is the Percentage of Births to Unmarried Women in Kansas City, MO?
Percentage of Births to Unmarried Women in Kansas City is 34.4%.
What is the Percentage of Births to Unmarried Women in Missouri?
Percentage of Births to Unmarried Women in Missouri is 30.2%.
What is the Percentage of Births to Unmarried Women in the United States?
Percentage of Births to Unmarried Women in the United States is 32.1%.