Zip Codes with the Highest Percentage of Households with Income Below $10,000 in Springfield, MO
RELATED REPORTS & OPTIONS
Household Income | $0-10k
Springfield
Compare Zip Codes
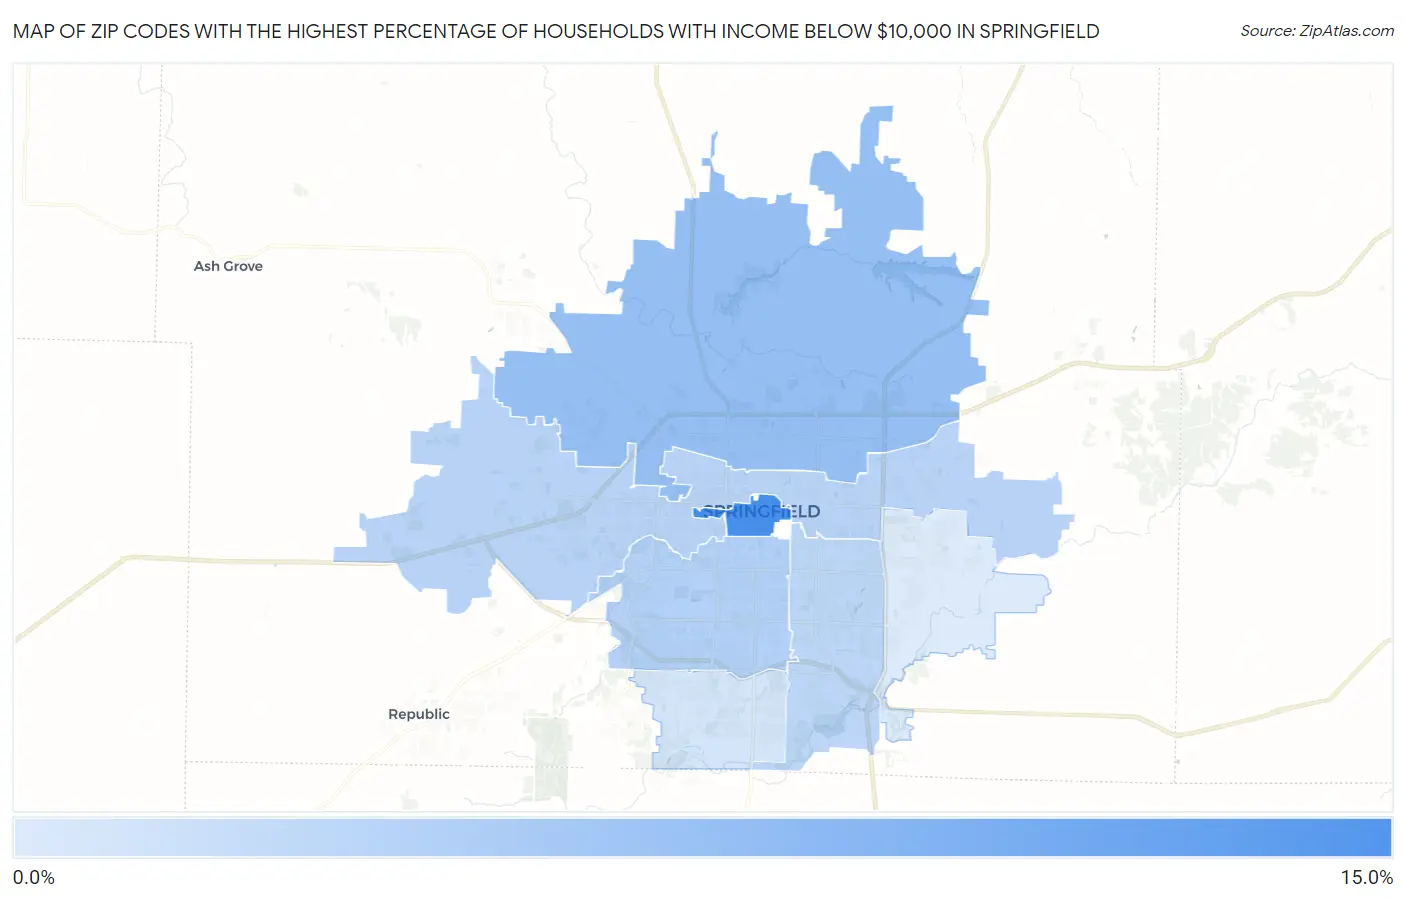
Map of Zip Codes with the Highest Percentage of Households with Income Below $10,000 in Springfield
2.4%
14.6%
Zip Codes with the Highest Percentage of Households with Income Below $10,000 in Springfield, MO
| Zip Code | Households with Income < $10k | vs State | vs National | |
| 1. | 65806 | 14.6% | 5.0%(+9.60)#47 | 4.9%(+9.70)#1,616 |
| 2. | 65803 | 8.1% | 5.0%(+3.10)#194 | 4.9%(+3.20)#5,410 |
| 3. | 65807 | 5.7% | 5.0%(+0.700)#339 | 4.9%(+0.800)#9,690 |
| 4. | 65802 | 5.3% | 5.0%(+0.300)#373 | 4.9%(+0.400)#10,720 |
| 5. | 65804 | 4.9% | 5.0%(-0.100)#425 | 4.9%(=0.000)#11,989 |
| 6. | 65810 | 3.2% | 5.0%(-1.80)#608 | 4.9%(-1.70)#18,550 |
| 7. | 65809 | 2.4% | 5.0%(-2.60)#717 | 4.9%(-2.50)#22,124 |
1
Common Questions
What are the Top 5 Zip Codes with the Highest Percentage of Households with Income Below $10,000 in Springfield, MO?
Top 5 Zip Codes with the Highest Percentage of Households with Income Below $10,000 in Springfield, MO are:
What zip code has the Highest Percentage of Households with Income Below $10,000 in Springfield, MO?
65806 has the Highest Percentage of Households with Income Below $10,000 in Springfield, MO with 14.6%.
What is the Percentage of Households with Income Below $10,000 in Springfield, MO?
Percentage of Households with Income Below $10,000 in Springfield is 7.0%.
What is the Percentage of Households with Income Below $10,000 in Missouri?
Percentage of Households with Income Below $10,000 in Missouri is 5.0%.
What is the Percentage of Households with Income Below $10,000 in the United States?
Percentage of Households with Income Below $10,000 in the United States is 4.9%.