Zip Codes with the Highest Percentage of Households with Income Below $10,000 in Ballwin, MO
RELATED REPORTS & OPTIONS
Household Income | $0-10k
Ballwin
Compare Zip Codes
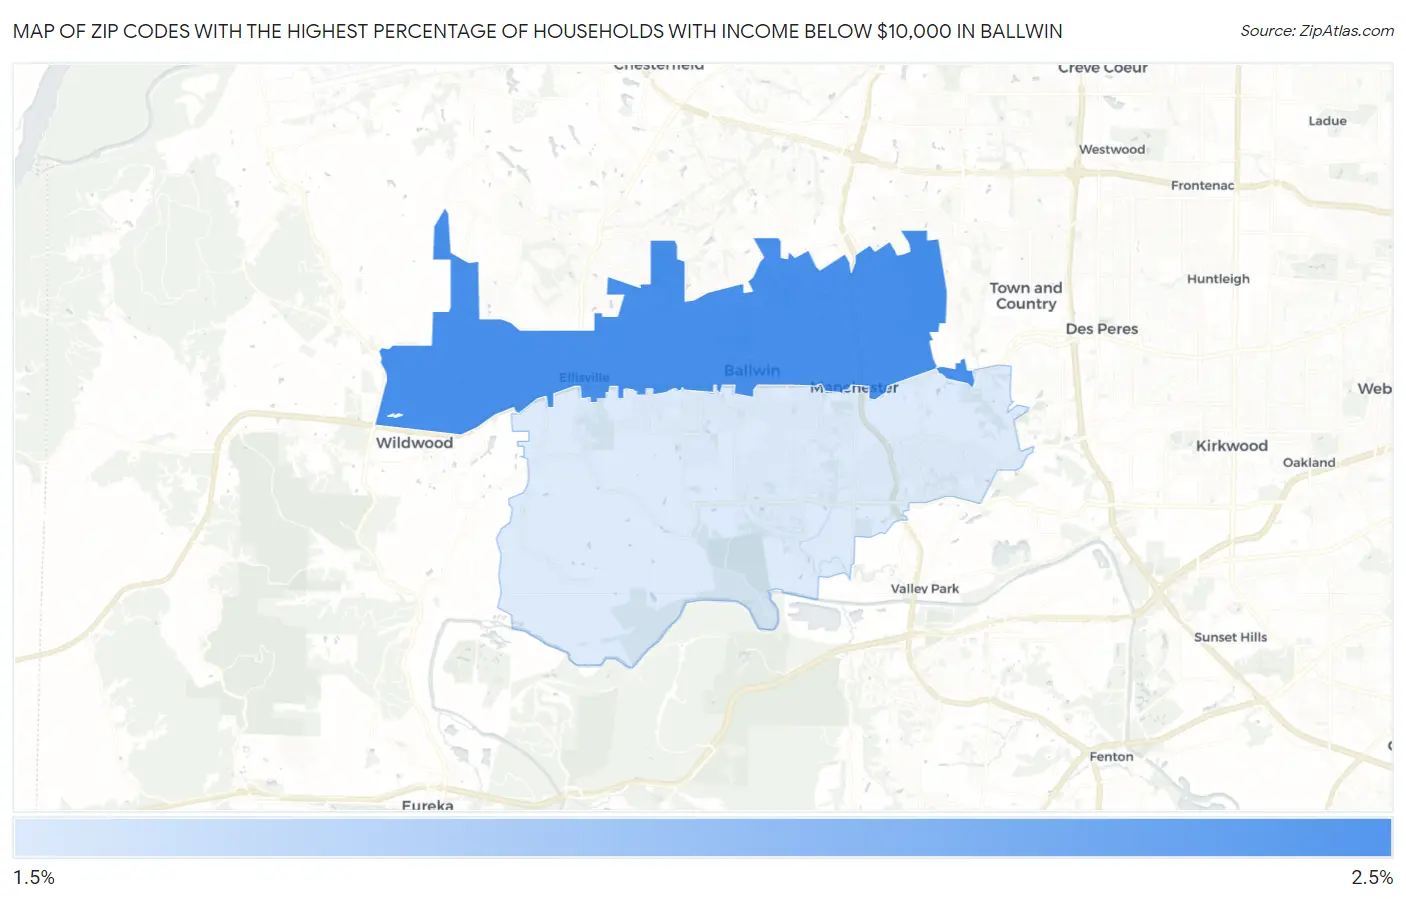
Map of Zip Codes with the Highest Percentage of Households with Income Below $10,000 in Ballwin
1.7%
2.1%
Zip Codes with the Highest Percentage of Households with Income Below $10,000 in Ballwin, MO
| Zip Code | Households with Income < $10k | vs State | vs National | |
| 1. | 63011 | 2.1% | 5.0%(-2.90)#748 | 4.9%(-2.80)#23,231 |
| 2. | 63021 | 1.7% | 5.0%(-3.30)#790 | 4.9%(-3.20)#24,681 |
1
Common Questions
What are the Top Zip Codes with the Highest Percentage of Households with Income Below $10,000 in Ballwin, MO?
Top Zip Codes with the Highest Percentage of Households with Income Below $10,000 in Ballwin, MO are:
What zip code has the Highest Percentage of Households with Income Below $10,000 in Ballwin, MO?
63011 has the Highest Percentage of Households with Income Below $10,000 in Ballwin, MO with 2.1%.
What is the Percentage of Households with Income Below $10,000 in Ballwin, MO?
Percentage of Households with Income Below $10,000 in Ballwin is 1.1%.
What is the Percentage of Households with Income Below $10,000 in Missouri?
Percentage of Households with Income Below $10,000 in Missouri is 5.0%.
What is the Percentage of Households with Income Below $10,000 in the United States?
Percentage of Households with Income Below $10,000 in the United States is 4.9%.