Zip Codes with the Highest Percentage of Population Employed in Office & Administration in Kansas City, MO
RELATED REPORTS & OPTIONS
Office & Administration
Kansas City
Compare Zip Codes
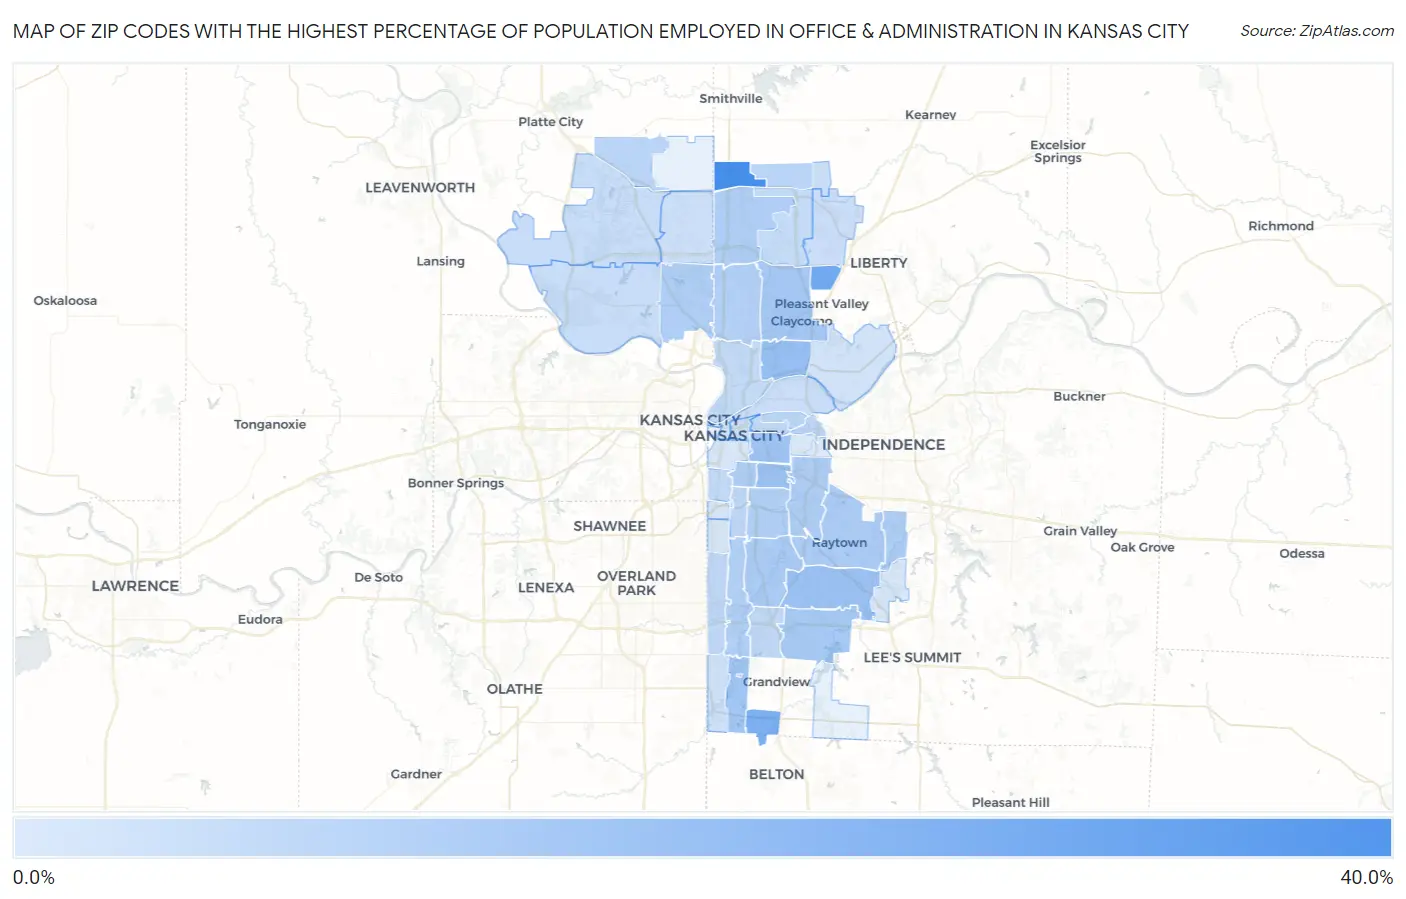
Map of Zip Codes with the Highest Percentage of Population Employed in Office & Administration in Kansas City
6.0%
32.0%
Zip Codes with the Highest Percentage of Population Employed in Office & Administration in Kansas City, MO
| Zip Code | % Employed | vs State | vs National | |
| 1. | 64165 | 32.0% | 11.3%(+20.7)#15 | 10.9%(+21.1)#476 |
| 2. | 64158 | 23.7% | 11.3%(+12.4)#44 | 10.9%(+12.9)#1,065 |
| 3. | 64147 | 22.4% | 11.3%(+11.0)#51 | 10.9%(+11.5)#1,243 |
| 4. | 64117 | 17.2% | 11.3%(+5.90)#109 | 10.9%(+6.39)#2,725 |
| 5. | 64138 | 17.0% | 11.3%(+5.61)#114 | 10.9%(+6.10)#2,871 |
| 6. | 64128 | 16.8% | 11.3%(+5.49)#116 | 10.9%(+5.99)#2,936 |
| 7. | 64127 | 15.8% | 11.3%(+4.48)#153 | 10.9%(+4.98)#3,707 |
| 8. | 64146 | 15.3% | 11.3%(+3.91)#172 | 10.9%(+4.40)#4,259 |
| 9. | 64119 | 15.1% | 11.3%(+3.76)#177 | 10.9%(+4.25)#4,436 |
| 10. | 64134 | 14.5% | 11.3%(+3.19)#203 | 10.9%(+3.68)#5,205 |
| 11. | 64133 | 14.0% | 11.3%(+2.63)#233 | 10.9%(+3.12)#6,061 |
| 12. | 64132 | 13.8% | 11.3%(+2.46)#247 | 10.9%(+2.95)#6,347 |
| 13. | 64129 | 13.6% | 11.3%(+2.23)#260 | 10.9%(+2.72)#6,759 |
| 14. | 64136 | 13.5% | 11.3%(+2.17)#264 | 10.9%(+2.66)#6,883 |
| 15. | 64109 | 13.3% | 11.3%(+1.94)#278 | 10.9%(+2.43)#7,391 |
| 16. | 64155 | 13.0% | 11.3%(+1.61)#303 | 10.9%(+2.10)#8,174 |
| 17. | 64151 | 12.9% | 11.3%(+1.52)#308 | 10.9%(+2.01)#8,386 |
| 18. | 64130 | 12.8% | 11.3%(+1.47)#315 | 10.9%(+1.96)#8,504 |
| 19. | 64131 | 12.8% | 11.3%(+1.46)#316 | 10.9%(+1.95)#8,530 |
| 20. | 64118 | 12.7% | 11.3%(+1.31)#325 | 10.9%(+1.80)#8,886 |
| 21. | 64166 | 11.6% | 11.3%(+0.216)#404 | 10.9%(+0.708)#12,059 |
| 22. | 64163 | 11.5% | 11.3%(+0.143)#411 | 10.9%(+0.636)#12,266 |
| 23. | 64125 | 11.3% | 11.3%(-0.006)#426 | 10.9%(+0.486)#12,747 |
| 24. | 64123 | 11.1% | 11.3%(-0.272)#449 | 10.9%(+0.220)#13,609 |
| 25. | 64110 | 11.0% | 11.3%(-0.377)#457 | 10.9%(+0.115)#13,920 |
| 26. | 64137 | 10.5% | 11.3%(-0.836)#503 | 10.9%(-0.344)#15,431 |
| 27. | 64114 | 10.4% | 11.3%(-0.960)#510 | 10.9%(-0.468)#15,864 |
| 28. | 64111 | 10.2% | 11.3%(-1.18)#526 | 10.9%(-0.692)#16,590 |
| 29. | 64116 | 10.1% | 11.3%(-1.27)#533 | 10.9%(-0.783)#16,889 |
| 30. | 64156 | 9.7% | 11.3%(-1.62)#567 | 10.9%(-1.13)#17,985 |
| 31. | 64124 | 9.7% | 11.3%(-1.69)#575 | 10.9%(-1.20)#18,225 |
| 32. | 64152 | 9.3% | 11.3%(-2.05)#604 | 10.9%(-1.55)#19,363 |
| 33. | 64153 | 9.2% | 11.3%(-2.17)#613 | 10.9%(-1.68)#19,737 |
| 34. | 64167 | 9.1% | 11.3%(-2.26)#618 | 10.9%(-1.77)#19,991 |
| 35. | 64120 | 9.0% | 11.3%(-2.33)#624 | 10.9%(-1.84)#20,209 |
| 36. | 64157 | 8.8% | 11.3%(-2.53)#642 | 10.9%(-2.03)#20,770 |
| 37. | 64106 | 8.7% | 11.3%(-2.62)#653 | 10.9%(-2.13)#21,085 |
| 38. | 64154 | 8.6% | 11.3%(-2.72)#665 | 10.9%(-2.23)#21,354 |
| 39. | 64145 | 8.1% | 11.3%(-3.30)#712 | 10.9%(-2.80)#22,895 |
| 40. | 64161 | 7.9% | 11.3%(-3.49)#728 | 10.9%(-3.00)#23,365 |
| 41. | 64105 | 7.4% | 11.3%(-3.91)#746 | 10.9%(-3.41)#24,306 |
| 42. | 64113 | 6.7% | 11.3%(-4.67)#780 | 10.9%(-4.18)#25,795 |
| 43. | 64108 | 6.6% | 11.3%(-4.76)#784 | 10.9%(-4.27)#25,945 |
| 44. | 64112 | 6.4% | 11.3%(-4.90)#791 | 10.9%(-4.41)#26,186 |
| 45. | 64139 | 6.3% | 11.3%(-5.01)#801 | 10.9%(-4.51)#26,343 |
| 46. | 64126 | 6.0% | 11.3%(-5.30)#818 | 10.9%(-4.81)#26,782 |
1
Common Questions
What are the Top 10 Zip Codes with the Highest Percentage of Population Employed in Office & Administration in Kansas City, MO?
Top 10 Zip Codes with the Highest Percentage of Population Employed in Office & Administration in Kansas City, MO are:
What zip code has the Highest Percentage of Population Employed in Office & Administration in Kansas City, MO?
64165 has the Highest Percentage of Population Employed in Office & Administration in Kansas City, MO with 32.0%.
What is the Percentage of Population Employed in Office & Administration in Kansas City, MO?
Percentage of Population Employed in Office & Administration in Kansas City is 12.1%.
What is the Percentage of Population Employed in Office & Administration in Missouri?
Percentage of Population Employed in Office & Administration in Missouri is 11.3%.
What is the Percentage of Population Employed in Office & Administration in the United States?
Percentage of Population Employed in Office & Administration in the United States is 10.9%.