Zip Codes with the Highest Percentage of Population with a Degree in Communications in Kansas City, MO

RELATED REPORTS & OPTIONS

Communications
Population
Families and Households
Female Fertility
Female Fertility (Unmarried)
Race (Community Size)
Race (Percentage)
Ancestry (Community Size)
AfghanAfricanAlaska NativeAlbanianAmericanApacheArabArgentineanArmenianAustralianAustrianBahamianBangladeshiBelgianBelizeanBhutaneseBlackfeetBolivianBrazilianBritishBulgarianBurmeseCanadianCelticCentral AmericanCentral American IndianCherokeeChickasawChileanChippewaChoctawColombianComancheCosta RicanCreeCreekCroatianCrowCubanCzechCzechoslovakianDanishDominicanDutchDutch West IndianEastern EuropeanEcuadorianEgyptianEnglishEthiopianEuropeanFijianFilipinoFinnishFrenchFrench American IndianFrench CanadianGermanGerman RussianGhanaianGreekGuamanian / ChamorroGuatemalanGuyaneseHaitianHonduranHungarianIcelanderIndian (Asian)IndonesianIranianIraqiIrishIroquoisIsraeliItalianJamaicanJapaneseJordanianKenyanKoreanLaotianLatvianLebaneseLiberianLithuanianLuxembourgerMalaysianMexicanMexican American IndianMongolianMoroccanNative HawaiianNavajoNew ZealanderNicaraguanNigerianNorthern EuropeanNorwegianOsageOttawaPakistaniPalestinianPanamanianPennsylvania GermanPeruvianPolishPortuguesePotawatomiPuebloPuerto RicanRomanianRussianSalvadoranSamoanScandinavianScotch-IrishScottishSeminoleSerbianShoshoneSierra LeoneanSiouxSlavicSlovakSloveneSomaliSouth AfricanSouth AmericanSouth American IndianSpaniardSpanishSri LankanSubsaharan AfricanSudaneseSwedishSwissSyrianThaiTrinidadian and TobagonianTurkishUgandanUkrainianUruguayanVenezuelanVietnameseWelshWest IndianYugoslavian
Ancestry (Percentage)
AfghanAfricanAlaska NativeAlbanianAmericanApacheArabArgentineanArmenianAustralianAustrianBahamianBangladeshiBelgianBelizeanBhutaneseBlackfeetBolivianBrazilianBritishBulgarianBurmeseCanadianCelticCentral AmericanCentral American IndianCherokeeChickasawChileanChippewaChoctawColombianComancheCosta RicanCreeCreekCroatianCrowCubanCzechCzechoslovakianDanishDominicanDutchDutch West IndianEastern EuropeanEcuadorianEgyptianEnglishEthiopianEuropeanFijianFilipinoFinnishFrenchFrench American IndianFrench CanadianGermanGerman RussianGhanaianGreekGuamanian / ChamorroGuatemalanGuyaneseHaitianHonduranHungarianIcelanderIndian (Asian)IndonesianIranianIraqiIrishIroquoisIsraeliItalianJamaicanJapaneseJordanianKenyanKoreanLaotianLatvianLebaneseLiberianLithuanianLuxembourgerMalaysianMexicanMexican American IndianMongolianMoroccanNative HawaiianNavajoNew ZealanderNicaraguanNigerianNorthern EuropeanNorwegianOsageOttawaPakistaniPalestinianPanamanianPennsylvania GermanPeruvianPolishPortuguesePotawatomiPuebloPuerto RicanRomanianRussianSalvadoranSamoanScandinavianScotch-IrishScottishSeminoleSerbianShoshoneSierra LeoneanSiouxSlavicSlovakSloveneSomaliSouth AfricanSouth AmericanSouth American IndianSpaniardSpanishSri LankanSubsaharan AfricanSudaneseSwedishSwissSyrianThaiTrinidadian and TobagonianTurkishUgandanUkrainianUruguayanVenezuelanVietnameseWelshWest IndianYugoslavian
Immigrant Origin (Total)
AfghanistanAfricaArgentinaAsiaAustraliaBahamasBangladeshBelarusBelgiumBelizeBoliviaBosnia and HerzegovinaBrazilBulgariaBurma / MyanmarCambodiaCameroonCanadaCaribbeanCentral AmericaChileChinaColombiaCongoCosta RicaCubaCzechoslovakiaDenmarkDominican RepublicEastern AfricaEastern AsiaEastern EuropeEcuadorEgyptEl SalvadorEnglandEritreaEthiopiaEuropeFijiFranceGermanyGhanaGreeceGuatemalaGuyanaHaitiHondurasHong KongHungaryIndiaIndonesiaIranIraqIrelandIsraelItalyJamaicaJapanJordanKazakhstanKenyaKoreaKuwaitLaosLatin AmericaLebanonLiberiaMalaysiaMexicoMicronesiaMiddle AfricaMoroccoNepalNetherlandsNicaraguaNigeriaNorthern AfricaNorthern EuropeOceaniaPakistanPeruPhilippinesPolandPortugalRomaniaRussiaSaudi ArabiaScotlandSierra LeoneSomaliaSouth AfricaSouth AmericaSouth Central AsiaSouth Eastern AsiaSouthern EuropeSpainSri LankaSudanSwedenSwitzerlandSyriaTaiwanThailandTrinidad and TobagoTurkeyUgandaUkraineUruguayVenezuelaVietnamWestern AfricaWestern AsiaWestern EuropeZaireZimbabwe
Immigrant Origin (Percentage)
AfghanistanAfricaArgentinaAsiaAustraliaBahamasBangladeshBelarusBelgiumBelizeBoliviaBosnia and HerzegovinaBrazilBulgariaBurma / MyanmarCambodiaCameroonCanadaCaribbeanCentral AmericaChileChinaColombiaCongoCosta RicaCubaCzechoslovakiaDenmarkDominican RepublicEastern AfricaEastern AsiaEastern EuropeEcuadorEgyptEl SalvadorEnglandEritreaEthiopiaEuropeFijiFranceGermanyGhanaGreeceGuatemalaGuyanaHaitiHondurasHong KongHungaryIndiaIndonesiaIranIraqIrelandIsraelItalyJamaicaJapanJordanKazakhstanKenyaKoreaKuwaitLaosLatin AmericaLebanonLiberiaMalaysiaMexicoMicronesiaMiddle AfricaMoroccoNepalNetherlandsNicaraguaNigeriaNorthern AfricaNorthern EuropeOceaniaPakistanPeruPhilippinesPolandPortugalRomaniaRussiaSaudi ArabiaScotlandSierra LeoneSomaliaSouth AfricaSouth AmericaSouth Central AsiaSouth Eastern AsiaSouthern EuropeSpainSri LankaSudanSwedenSwitzerlandSyriaTaiwanThailandTrinidad and TobagoTurkeyUgandaUkraineUruguayVenezuelaVietnamWestern AfricaWestern AsiaWestern EuropeZaireZimbabwe
Income
Income (Families)
Income (Households)
Poverty
Poverty (Families)
Unemployment
Employment Occupations
Employment Industries
Employer Class
Commute Time
Commute Means
School Enrollment
Education by Degree Field
Occupancy
Finances
Physical Characteristics
Kansas City
Compare Zip Codes
Comparison Subject

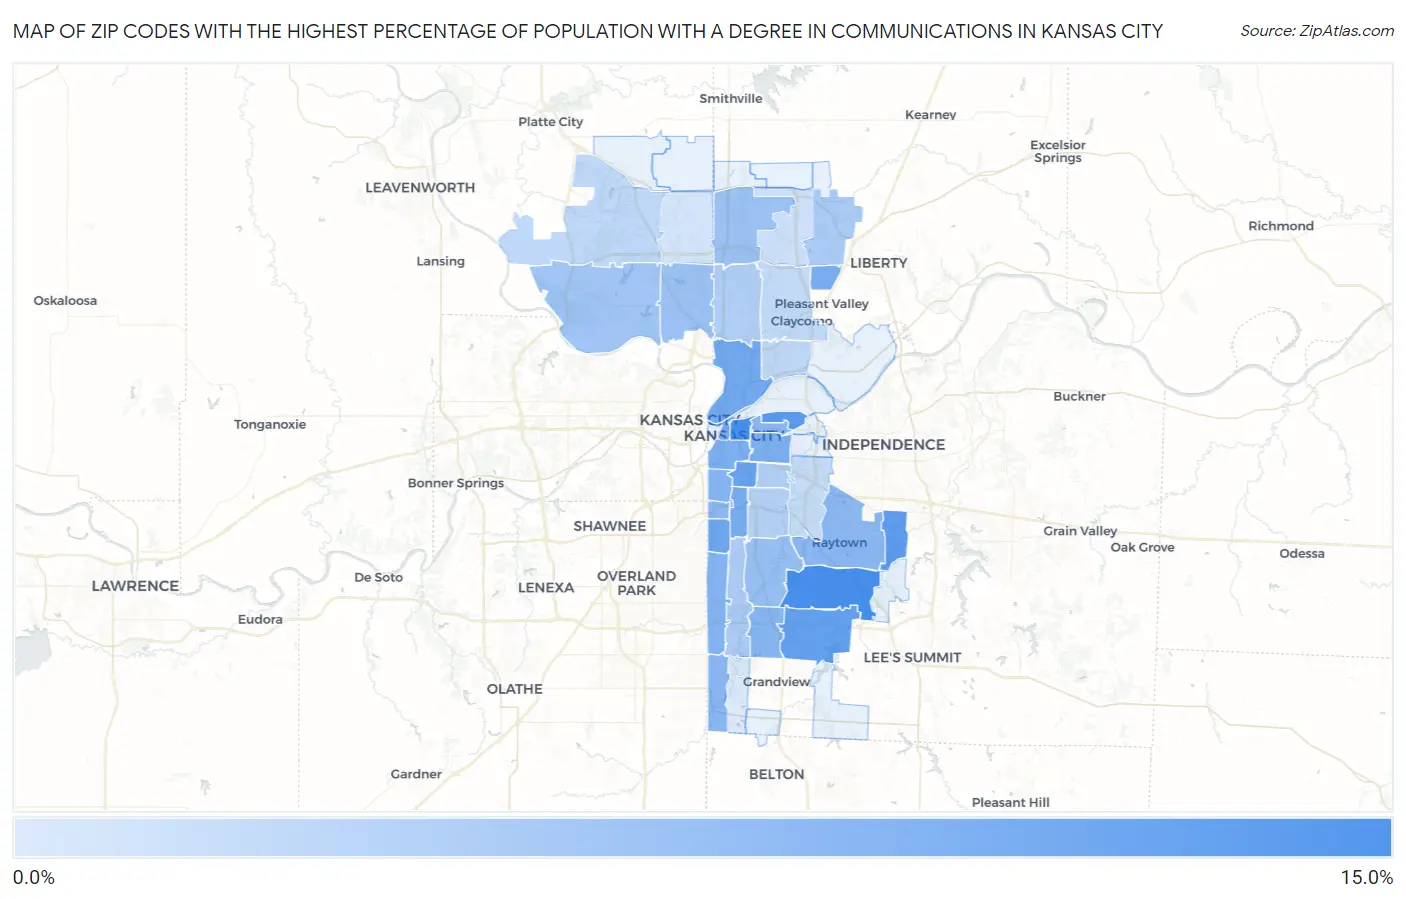
Map of Zip Codes with the Highest Percentage of Population with a Degree in Communications in Kansas City

0.0%
15.0%
Zip Codes with the Highest Percentage of Population with a Degree in Communications in Kansas City Map

Zip Codes with the Highest Percentage of Population with a Degree in Communications in Kansas City, MO

Zip Code % Graduates vs State vs National
1.6410610.1%4.4%(+5.72)#454.1%(+5.96)#1,118
2.6413810.0%4.4%(+5.66)#474.1%(+5.90)#1,128
3.641239.1%4.4%(+4.71)#514.1%(+4.95)#1,408
4.641368.7%4.4%(+4.29)#534.1%(+4.53)#1,569
5.641348.4%4.4%(+3.99)#574.1%(+4.24)#1,688
6.641098.0%4.4%(+3.66)#614.1%(+3.91)#1,858
7.641137.6%4.4%(+3.21)#694.1%(+3.45)#2,142
8.641167.3%4.4%(+2.95)#744.1%(+3.19)#2,323
9.641057.1%4.4%(+2.77)#794.1%(+3.01)#2,470
10.641107.0%4.4%(+2.67)#814.1%(+2.91)#2,556
11.641586.9%4.4%(+2.50)#864.1%(+2.74)#2,730
12.641086.8%4.4%(+2.46)#884.1%(+2.70)#2,757
13.641276.8%4.4%(+2.43)#914.1%(+2.68)#2,786
14.641146.1%4.4%(+1.76)#1134.1%(+2.01)#3,561
15.641376.1%4.4%(+1.74)#1144.1%(+1.99)#3,598
16.641116.1%4.4%(+1.74)#1154.1%(+1.98)#3,609
17.641246.0%4.4%(+1.62)#1204.1%(+1.86)#3,793
18.641335.9%4.4%(+1.56)#1254.1%(+1.80)#3,883
19.641455.9%4.4%(+1.51)#1274.1%(+1.75)#3,955
20.641125.8%4.4%(+1.42)#1314.1%(+1.66)#4,124
21.641325.1%4.4%(+0.768)#1564.1%(+1.01)#5,363
22.641555.0%4.4%(+0.609)#1634.1%(+0.851)#5,734
23.641514.7%4.4%(+0.359)#1824.1%(+0.601)#6,327
24.641524.6%4.4%(+0.200)#1924.1%(+0.442)#6,755
25.641573.9%4.4%(-0.469)#2404.1%(-0.227)#8,881
26.641313.8%4.4%(-0.534)#2454.1%(-0.292)#9,129
27.641183.6%4.4%(-0.814)#2634.1%(-0.572)#10,091
28.641283.4%4.4%(-0.989)#2744.1%(-0.747)#10,747
29.641303.3%4.4%(-1.12)#2834.1%(-0.881)#11,242
30.641172.8%4.4%(-1.62)#3224.1%(-1.38)#13,188
31.641532.7%4.4%(-1.71)#3294.1%(-1.47)#13,552
32.641192.5%4.4%(-1.90)#3384.1%(-1.66)#14,232
33.641292.3%4.4%(-2.05)#3504.1%(-1.81)#14,733
34.641561.9%4.4%(-2.53)#3864.1%(-2.28)#16,405
35.641541.5%4.4%(-2.89)#4174.1%(-2.65)#17,577
36.641460.96%4.4%(-3.41)#4594.1%(-3.17)#19,095

Common Questions

What are the Top 10 Zip Codes with the Highest Percentage of Population with a Degree in Communications in Kansas City, MO?
Top 10 Zip Codes with the Highest Percentage of Population with a Degree in Communications in Kansas City, MO are:
#1
10.1%
#2
10.0%
#3
9.1%
#4
8.7%
#5
8.4%
#6
8.0%
#7
7.6%
#8
7.3%
#9
7.1%
#10
7.0%
What zip code has the Highest Percentage of Population with a Degree in Communications in Kansas City, MO?
64106 has the Highest Percentage of Population with a Degree in Communications in Kansas City, MO with 10.1%.
What is the Percentage of Population with a Degree in Communications in Kansas City, MO?
Percentage of Population with a Degree in Communications in Kansas City is 5.4%.
What is the Percentage of Population with a Degree in Communications in Missouri?
Percentage of Population with a Degree in Communications in Missouri is 4.4%.
What is the Percentage of Population with a Degree in Communications in the United States?
Percentage of Population with a Degree in Communications in the United States is 4.1%.