Zip Codes with the Highest Percentage of Population Employed in Food Preparation & Serving in Kansas City, MO
RELATED REPORTS & OPTIONS
Food Preparation & Serving
Kansas City
Compare Zip Codes
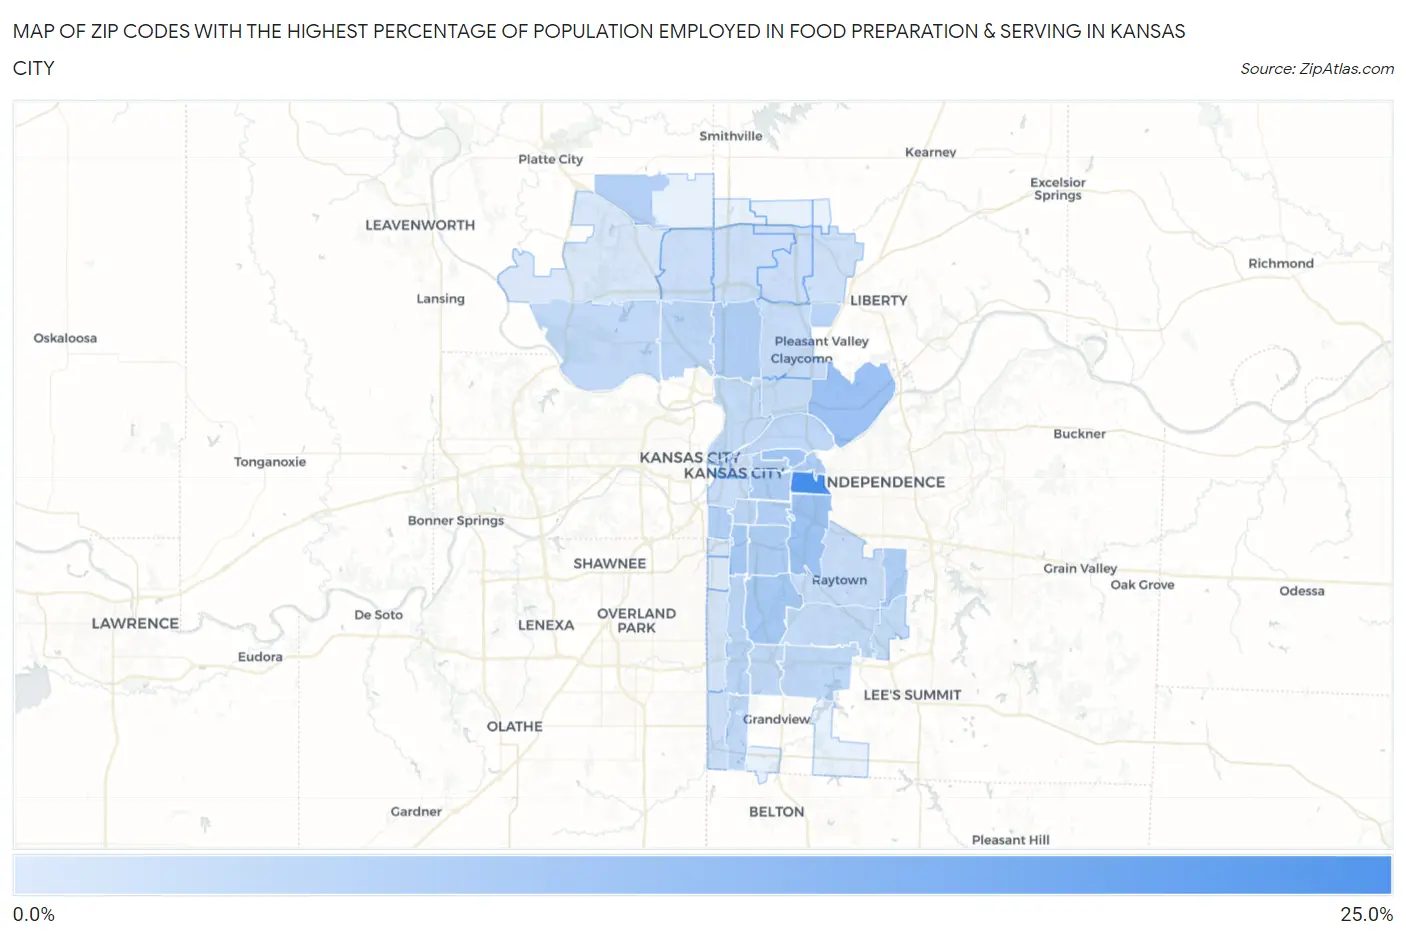
Map of Zip Codes with the Highest Percentage of Population Employed in Food Preparation & Serving in Kansas City
1.7%
21.8%
Zip Codes with the Highest Percentage of Population Employed in Food Preparation & Serving in Kansas City, MO
| Zip Code | % Employed | vs State | vs National | |
| 1. | 64126 | 21.8% | 5.2%(+16.6)#18 | 5.3%(+16.5)#425 |
| 2. | 64161 | 10.0% | 5.2%(+4.76)#90 | 5.3%(+4.71)#2,638 |
| 3. | 64129 | 9.5% | 5.2%(+4.25)#103 | 5.3%(+4.20)#3,072 |
| 4. | 64123 | 8.9% | 5.2%(+3.64)#121 | 5.3%(+3.59)#3,642 |
| 5. | 64110 | 8.4% | 5.2%(+3.13)#141 | 5.3%(+3.08)#4,225 |
| 6. | 64132 | 8.3% | 5.2%(+3.04)#144 | 5.3%(+2.99)#4,347 |
| 7. | 64127 | 7.6% | 5.2%(+2.33)#175 | 5.3%(+2.28)#5,439 |
| 8. | 64118 | 7.4% | 5.2%(+2.17)#184 | 5.3%(+2.12)#5,727 |
| 9. | 64136 | 7.3% | 5.2%(+2.11)#193 | 5.3%(+2.06)#5,846 |
| 10. | 64125 | 7.3% | 5.2%(+2.07)#195 | 5.3%(+2.02)#5,919 |
| 11. | 64130 | 7.1% | 5.2%(+1.89)#207 | 5.3%(+1.84)#6,286 |
| 12. | 64163 | 7.1% | 5.2%(+1.82)#214 | 5.3%(+1.77)#6,429 |
| 13. | 64111 | 6.9% | 5.2%(+1.70)#223 | 5.3%(+1.65)#6,734 |
| 14. | 64128 | 6.8% | 5.2%(+1.58)#230 | 5.3%(+1.53)#7,038 |
| 15. | 64124 | 6.8% | 5.2%(+1.54)#231 | 5.3%(+1.49)#7,128 |
| 16. | 64158 | 6.0% | 5.2%(+0.801)#291 | 5.3%(+0.751)#9,222 |
| 17. | 64131 | 5.8% | 5.2%(+0.595)#306 | 5.3%(+0.545)#9,932 |
| 18. | 64109 | 5.8% | 5.2%(+0.516)#313 | 5.3%(+0.466)#10,175 |
| 19. | 64151 | 5.7% | 5.2%(+0.478)#317 | 5.3%(+0.428)#10,293 |
| 20. | 64134 | 5.4% | 5.2%(+0.150)#338 | 5.3%(+0.099)#11,456 |
| 21. | 64120 | 5.3% | 5.2%(+0.069)#348 | 5.3%(+0.019)#11,745 |
| 22. | 64152 | 5.2% | 5.2%(-0.068)#367 | 5.3%(-0.118)#12,288 |
| 23. | 64137 | 5.1% | 5.2%(-0.109)#370 | 5.3%(-0.160)#12,444 |
| 24. | 64146 | 5.1% | 5.2%(-0.151)#378 | 5.3%(-0.201)#12,596 |
| 25. | 64116 | 4.9% | 5.2%(-0.300)#390 | 5.3%(-0.350)#13,204 |
| 26. | 64138 | 4.9% | 5.2%(-0.358)#399 | 5.3%(-0.408)#13,460 |
| 27. | 64139 | 4.6% | 5.2%(-0.654)#427 | 5.3%(-0.705)#14,688 |
| 28. | 64117 | 4.5% | 5.2%(-0.728)#436 | 5.3%(-0.779)#15,001 |
| 29. | 64108 | 4.4% | 5.2%(-0.811)#445 | 5.3%(-0.862)#15,316 |
| 30. | 64119 | 4.3% | 5.2%(-0.912)#460 | 5.3%(-0.963)#15,772 |
| 31. | 64133 | 4.2% | 5.2%(-1.06)#486 | 5.3%(-1.11)#16,417 |
| 32. | 64154 | 4.1% | 5.2%(-1.10)#491 | 5.3%(-1.15)#16,576 |
| 33. | 64156 | 3.9% | 5.2%(-1.32)#510 | 5.3%(-1.37)#17,477 |
| 34. | 64155 | 3.8% | 5.2%(-1.39)#519 | 5.3%(-1.44)#17,770 |
| 35. | 64105 | 3.7% | 5.2%(-1.51)#535 | 5.3%(-1.56)#18,244 |
| 36. | 64145 | 3.6% | 5.2%(-1.64)#553 | 5.3%(-1.69)#18,805 |
| 37. | 64157 | 3.6% | 5.2%(-1.67)#558 | 5.3%(-1.73)#18,948 |
| 38. | 64106 | 3.1% | 5.2%(-2.13)#623 | 5.3%(-2.18)#20,860 |
| 39. | 64114 | 3.0% | 5.2%(-2.25)#636 | 5.3%(-2.30)#21,303 |
| 40. | 64153 | 2.4% | 5.2%(-2.86)#700 | 5.3%(-2.91)#23,543 |
| 41. | 64112 | 2.3% | 5.2%(-2.97)#708 | 5.3%(-3.02)#23,891 |
| 42. | 64113 | 1.7% | 5.2%(-3.52)#754 | 5.3%(-3.57)#25,489 |
1
Common Questions
What are the Top 10 Zip Codes with the Highest Percentage of Population Employed in Food Preparation & Serving in Kansas City, MO?
Top 10 Zip Codes with the Highest Percentage of Population Employed in Food Preparation & Serving in Kansas City, MO are:
What zip code has the Highest Percentage of Population Employed in Food Preparation & Serving in Kansas City, MO?
64126 has the Highest Percentage of Population Employed in Food Preparation & Serving in Kansas City, MO with 21.8%.
What is the Percentage of Population Employed in Food Preparation & Serving in Kansas City, MO?
Percentage of Population Employed in Food Preparation & Serving in Kansas City is 5.4%.
What is the Percentage of Population Employed in Food Preparation & Serving in Missouri?
Percentage of Population Employed in Food Preparation & Serving in Missouri is 5.2%.
What is the Percentage of Population Employed in Food Preparation & Serving in the United States?
Percentage of Population Employed in Food Preparation & Serving in the United States is 5.3%.