Zip Codes with the Highest Percentage of Population Employed in Health Diagnosing & Treating in Kansas City, MO
RELATED REPORTS & OPTIONS
Health Diagnosing & Treating
Kansas City
Compare Zip Codes
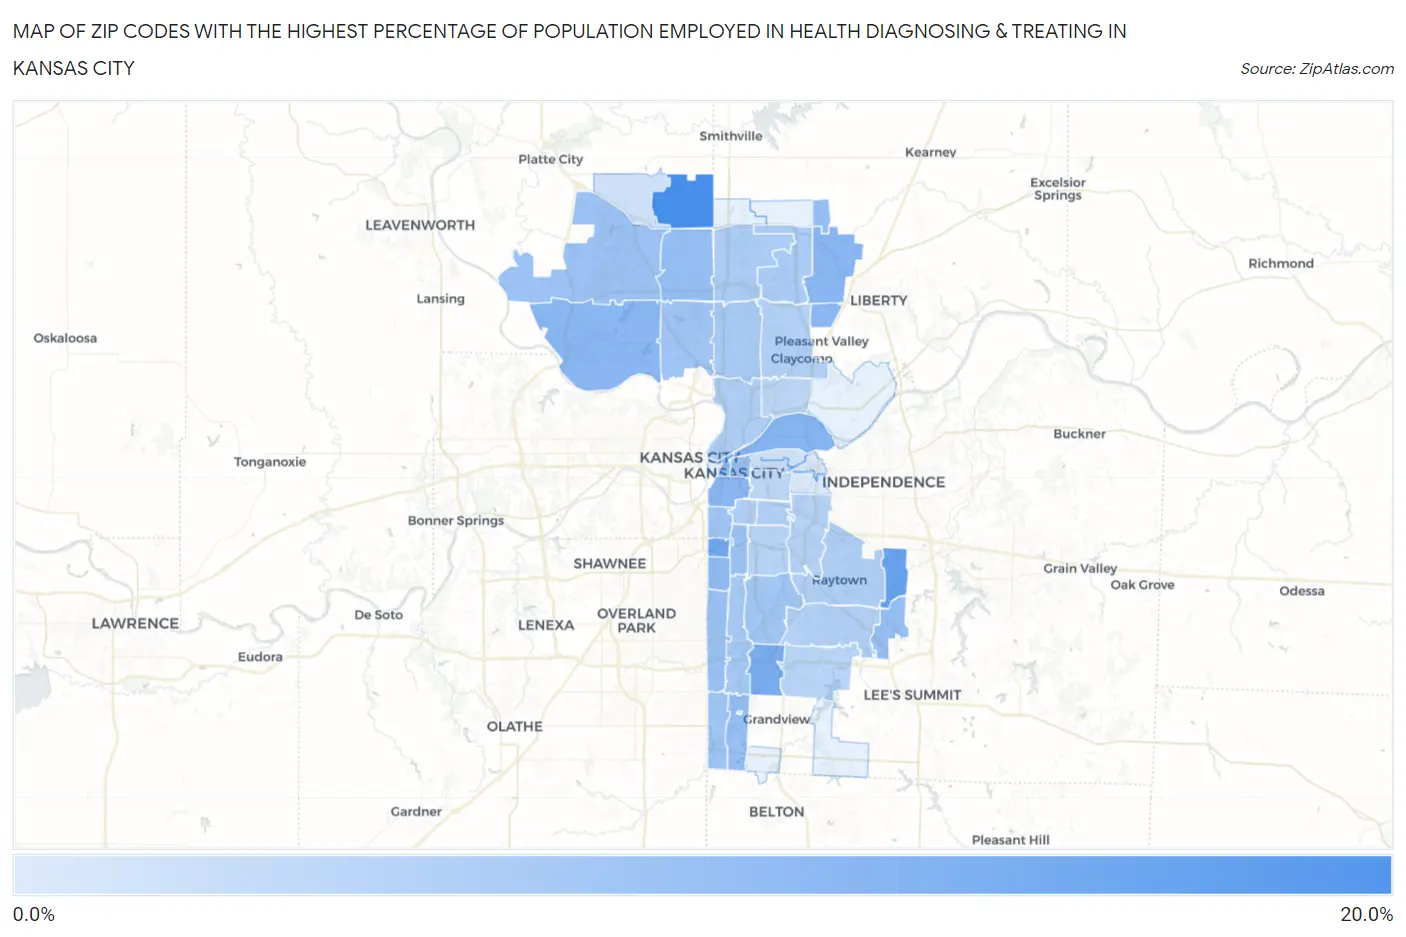
Map of Zip Codes with the Highest Percentage of Population Employed in Health Diagnosing & Treating in Kansas City
0.72%
17.5%
Zip Codes with the Highest Percentage of Population Employed in Health Diagnosing & Treating in Kansas City, MO
| Zip Code | % Employed | vs State | vs National | |
| 1. | 64164 | 17.5% | 6.9%(+10.6)#31 | 6.2%(+11.3)#762 |
| 2. | 64136 | 13.8% | 6.9%(+6.86)#54 | 6.2%(+7.53)#1,480 |
| 3. | 64112 | 12.4% | 6.9%(+5.53)#71 | 6.2%(+6.20)#1,982 |
| 4. | 64137 | 11.6% | 6.9%(+4.73)#90 | 6.2%(+5.40)#2,419 |
| 5. | 64120 | 10.3% | 6.9%(+3.43)#127 | 6.2%(+4.10)#3,469 |
| 6. | 64157 | 9.8% | 6.9%(+2.92)#143 | 6.2%(+3.59)#4,076 |
| 7. | 64152 | 9.8% | 6.9%(+2.91)#145 | 6.2%(+3.58)#4,088 |
| 8. | 64108 | 9.7% | 6.9%(+2.76)#150 | 6.2%(+3.43)#4,278 |
| 9. | 64158 | 9.5% | 6.9%(+2.58)#161 | 6.2%(+3.25)#4,548 |
| 10. | 64105 | 9.3% | 6.9%(+2.37)#174 | 6.2%(+3.04)#4,891 |
| 11. | 64113 | 9.0% | 6.9%(+2.09)#187 | 6.2%(+2.76)#5,375 |
| 12. | 64154 | 8.5% | 6.9%(+1.62)#207 | 6.2%(+2.29)#6,277 |
| 13. | 64167 | 8.3% | 6.9%(+1.39)#229 | 6.2%(+2.06)#6,774 |
| 14. | 64146 | 8.2% | 6.9%(+1.25)#239 | 6.2%(+1.92)#7,093 |
| 15. | 64139 | 8.1% | 6.9%(+1.19)#244 | 6.2%(+1.86)#7,240 |
| 16. | 64114 | 8.0% | 6.9%(+1.06)#258 | 6.2%(+1.73)#7,567 |
| 17. | 64110 | 7.9% | 6.9%(+1.03)#261 | 6.2%(+1.70)#7,657 |
| 18. | 64153 | 7.6% | 6.9%(+0.651)#282 | 6.2%(+1.32)#8,603 |
| 19. | 64106 | 7.5% | 6.9%(+0.631)#283 | 6.2%(+1.30)#8,673 |
| 20. | 64145 | 7.2% | 6.9%(+0.319)#315 | 6.2%(+0.989)#9,609 |
| 21. | 64111 | 7.1% | 6.9%(+0.202)#321 | 6.2%(+0.872)#9,975 |
| 22. | 64151 | 7.1% | 6.9%(+0.175)#325 | 6.2%(+0.845)#10,078 |
| 23. | 64132 | 7.0% | 6.9%(+0.086)#332 | 6.2%(+0.757)#10,349 |
| 24. | 64118 | 6.4% | 6.9%(-0.513)#388 | 6.2%(+0.157)#12,372 |
| 25. | 64131 | 6.4% | 6.9%(-0.524)#392 | 6.2%(+0.146)#12,414 |
| 26. | 64156 | 6.1% | 6.9%(-0.795)#419 | 6.2%(-0.125)#13,464 |
| 27. | 64155 | 5.8% | 6.9%(-1.07)#444 | 6.2%(-0.396)#14,420 |
| 28. | 64116 | 5.5% | 6.9%(-1.41)#477 | 6.2%(-0.743)#15,775 |
| 29. | 64109 | 5.4% | 6.9%(-1.50)#486 | 6.2%(-0.828)#16,107 |
| 30. | 64133 | 5.3% | 6.9%(-1.59)#500 | 6.2%(-0.921)#16,465 |
| 31. | 64128 | 5.2% | 6.9%(-1.71)#518 | 6.2%(-1.04)#16,909 |
| 32. | 64119 | 5.1% | 6.9%(-1.80)#528 | 6.2%(-1.13)#17,283 |
| 33. | 64138 | 5.1% | 6.9%(-1.83)#530 | 6.2%(-1.16)#17,367 |
| 34. | 64129 | 4.8% | 6.9%(-2.13)#560 | 6.2%(-1.46)#18,565 |
| 35. | 64134 | 4.4% | 6.9%(-2.49)#591 | 6.2%(-1.82)#19,931 |
| 36. | 64130 | 4.4% | 6.9%(-2.52)#596 | 6.2%(-1.85)#20,013 |
| 37. | 64117 | 4.2% | 6.9%(-2.70)#617 | 6.2%(-2.03)#20,634 |
| 38. | 64127 | 4.0% | 6.9%(-2.92)#632 | 6.2%(-2.25)#21,390 |
| 39. | 64124 | 2.8% | 6.9%(-4.16)#755 | 6.2%(-3.49)#24,923 |
| 40. | 64163 | 2.2% | 6.9%(-4.70)#783 | 6.2%(-4.03)#26,083 |
| 41. | 64123 | 1.9% | 6.9%(-5.00)#800 | 6.2%(-4.33)#26,616 |
| 42. | 64125 | 1.3% | 6.9%(-5.61)#829 | 6.2%(-4.94)#27,456 |
| 43. | 64126 | 0.72% | 6.9%(-6.20)#856 | 6.2%(-5.53)#28,135 |
1
Common Questions
What are the Top 10 Zip Codes with the Highest Percentage of Population Employed in Health Diagnosing & Treating in Kansas City, MO?
Top 10 Zip Codes with the Highest Percentage of Population Employed in Health Diagnosing & Treating in Kansas City, MO are:
What zip code has the Highest Percentage of Population Employed in Health Diagnosing & Treating in Kansas City, MO?
64164 has the Highest Percentage of Population Employed in Health Diagnosing & Treating in Kansas City, MO with 17.5%.
What is the Percentage of Population Employed in Health Diagnosing & Treating in Kansas City, MO?
Percentage of Population Employed in Health Diagnosing & Treating in Kansas City is 6.8%.
What is the Percentage of Population Employed in Health Diagnosing & Treating in Missouri?
Percentage of Population Employed in Health Diagnosing & Treating in Missouri is 6.9%.
What is the Percentage of Population Employed in Health Diagnosing & Treating in the United States?
Percentage of Population Employed in Health Diagnosing & Treating in the United States is 6.2%.