Zip Codes with the Highest Percentage of Households Heated by Fuel Oil / Kerosene in Kansas City, MO
RELATED REPORTS & OPTIONS
Fuel Oil Heating
Kansas City
Compare Zip Codes
Map of Zip Codes with the Highest Percentage of Households Heated by Fuel Oil / Kerosene in Kansas City
0.10%
1.2%
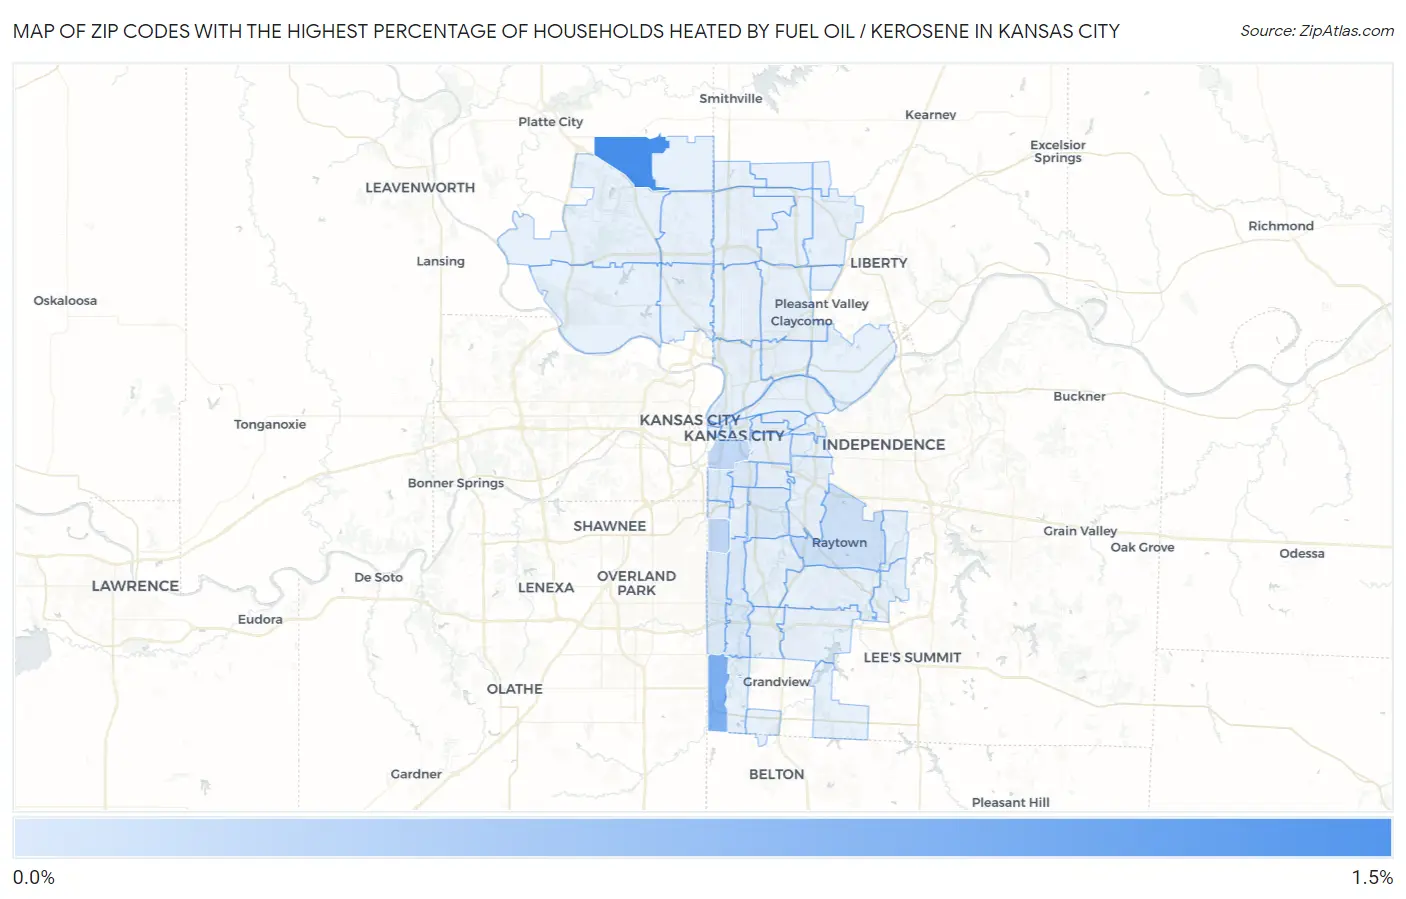
Zip Codes with the Highest Percentage of Households Heated by Fuel Oil / Kerosene in Kansas City, MO
| Zip Code | Fuel Oil Heating | vs State | vs National | |
| 1. | 64163 | 1.2% | 0.20%(+1.000)#76 | 4.2%(-3.00)#12,428 |
| 2. | 64145 | 0.80% | 0.20%(+0.600)#102 | 4.2%(-3.40)#13,398 |
| 3. | 64113 | 0.30% | 0.20%(+0.100)#161 | 4.2%(-3.90)#15,582 |
| 4. | 64108 | 0.30% | 0.20%(+0.100)#164 | 4.2%(-3.90)#15,626 |
| 5. | 64133 | 0.20% | 0.20%(=0.000)#186 | 4.2%(-4.00)#16,028 |
| 6. | 64114 | 0.10% | 0.20%(-0.100)#227 | 4.2%(-4.10)#17,329 |
| 7. | 64131 | 0.10% | 0.20%(-0.100)#228 | 4.2%(-4.10)#17,401 |
| 8. | 64130 | 0.10% | 0.20%(-0.100)#233 | 4.2%(-4.10)#17,473 |
| 9. | 64111 | 0.10% | 0.20%(-0.100)#234 | 4.2%(-4.10)#17,518 |
| 10. | 64109 | 0.10% | 0.20%(-0.100)#240 | 4.2%(-4.10)#17,625 |
1
Common Questions
What are the Top 10 Zip Codes with the Highest Percentage of Households Heated by Fuel Oil / Kerosene in Kansas City, MO?
Top 10 Zip Codes with the Highest Percentage of Households Heated by Fuel Oil / Kerosene in Kansas City, MO are:
What zip code has the Highest Percentage of Households Heated by Fuel Oil / Kerosene in Kansas City, MO?
64163 has the Highest Percentage of Households Heated by Fuel Oil / Kerosene in Kansas City, MO with 1.2%.
What is the Percentage of Households Heated by Fuel Oil / Kerosene in Kansas City, MO?
Percentage of Households Heated by Fuel Oil / Kerosene in Kansas City is 0.10%.
What is the Percentage of Households Heated by Fuel Oil / Kerosene in Missouri?
Percentage of Households Heated by Fuel Oil / Kerosene in Missouri is 0.20%.
What is the Percentage of Households Heated by Fuel Oil / Kerosene in the United States?
Percentage of Households Heated by Fuel Oil / Kerosene in the United States is 4.2%.