Zip Codes with the Highest Percentage of Households with Income Below $10,000 in Florissant, MO
RELATED REPORTS & OPTIONS
Household Income | $0-10k
Florissant
Compare Zip Codes
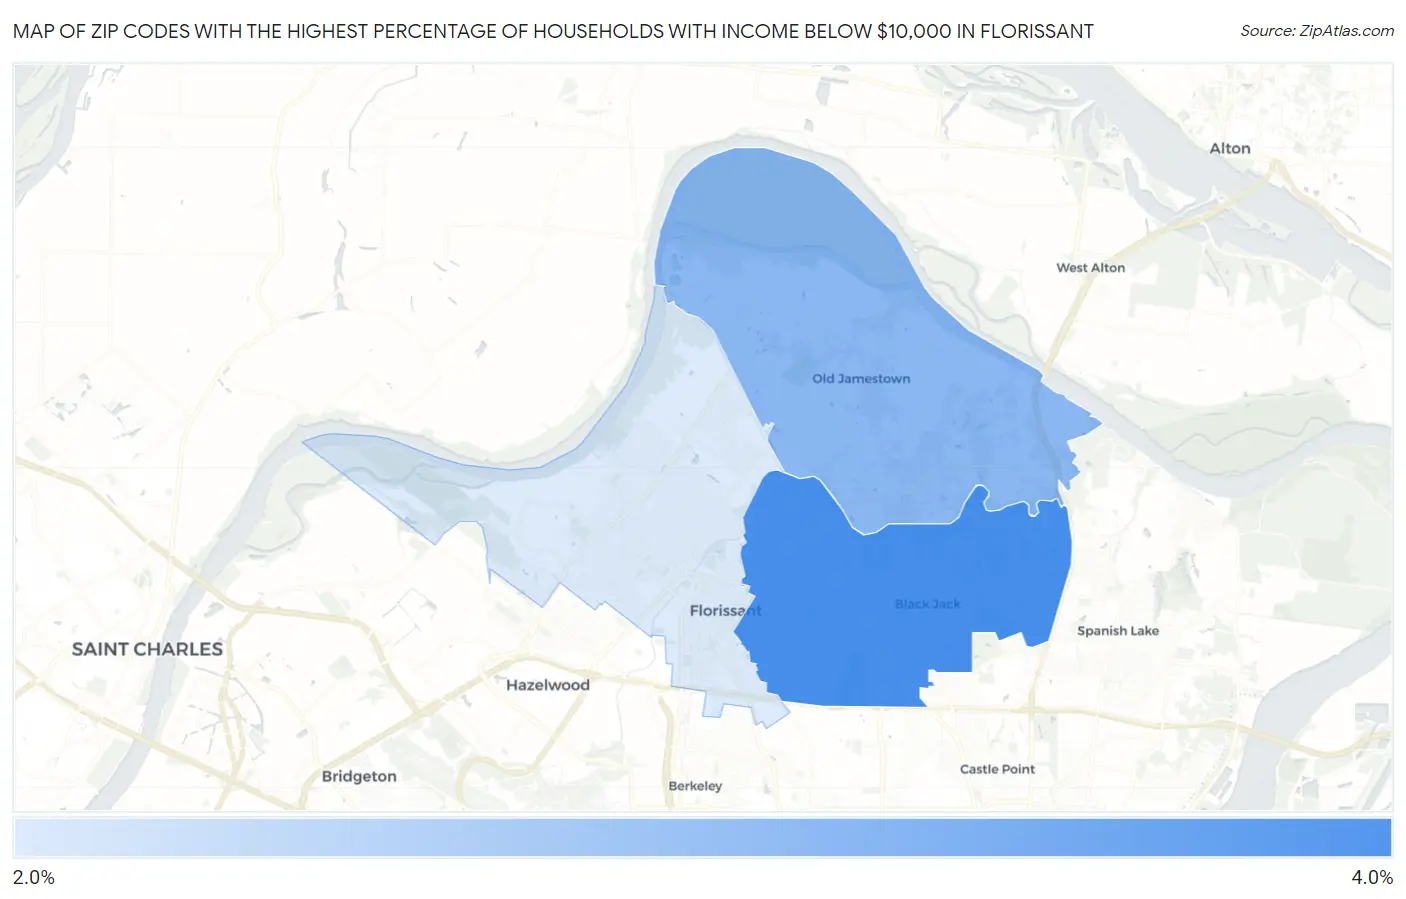
Map of Zip Codes with the Highest Percentage of Households with Income Below $10,000 in Florissant
2.5%
3.4%
Zip Codes with the Highest Percentage of Households with Income Below $10,000 in Florissant, MO
| Zip Code | Households with Income < $10k | vs State | vs National | |
| 1. | 63033 | 3.4% | 5.0%(-1.60)#586 | 4.9%(-1.50)#17,634 |
| 2. | 63034 | 3.0% | 5.0%(-2.00)#637 | 4.9%(-1.90)#19,415 |
| 3. | 63031 | 2.5% | 5.0%(-2.50)#701 | 4.9%(-2.40)#21,536 |
1
Common Questions
What are the Top Zip Codes with the Highest Percentage of Households with Income Below $10,000 in Florissant, MO?
Top Zip Codes with the Highest Percentage of Households with Income Below $10,000 in Florissant, MO are:
What zip code has the Highest Percentage of Households with Income Below $10,000 in Florissant, MO?
63033 has the Highest Percentage of Households with Income Below $10,000 in Florissant, MO with 3.4%.
What is the Percentage of Households with Income Below $10,000 in Florissant, MO?
Percentage of Households with Income Below $10,000 in Florissant is 3.0%.
What is the Percentage of Households with Income Below $10,000 in Missouri?
Percentage of Households with Income Below $10,000 in Missouri is 5.0%.
What is the Percentage of Households with Income Below $10,000 in the United States?
Percentage of Households with Income Below $10,000 in the United States is 4.9%.