Versailles, MO Map & Demographics
Versailles Map
Versailles Overview
$20,858
PER CAPITA INCOME
$57,986
AVG FAMILY INCOME
$27,202
AVG HOUSEHOLD INCOME
28.3%
WAGE / INCOME GAP [ % ]
71.7¢/ $1
WAGE / INCOME GAP [ $ ]
0.47
INEQUALITY / GINI INDEX
2,549
TOTAL POPULATION
1,161
MALE POPULATION
1,388
FEMALE POPULATION
83.65
MALES / 100 FEMALES
119.55
FEMALES / 100 MALES
45.1
MEDIAN AGE
3.0
AVG FAMILY SIZE
2.1
AVG HOUSEHOLD SIZE
1,000
LABOR FORCE [ PEOPLE ]
47.8%
PERCENT IN LABOR FORCE
5.6%
UNEMPLOYMENT RATE
Versailles Zip Codes
Versailles Area Codes
Income in Versailles
Income Overview in Versailles
Per Capita Income in Versailles is $20,858, while median incomes of families and households are $57,986 and $27,202 respectively.
| Characteristic | Number | Measure |
| Per Capita Income | 2,549 | $20,858 |
| Median Family Income | 566 | $57,986 |
| Mean Family Income | 566 | $63,117 |
| Median Household Income | 1,070 | $27,202 |
| Mean Household Income | 1,070 | $43,872 |
| Income Deficit | 566 | $0 |
| Wage / Income Gap (%) | 2,549 | 28.33% |
| Wage / Income Gap ($) | 2,549 | 71.67¢ per $1 |
| Gini / Inequality Index | 2,549 | 0.47 |
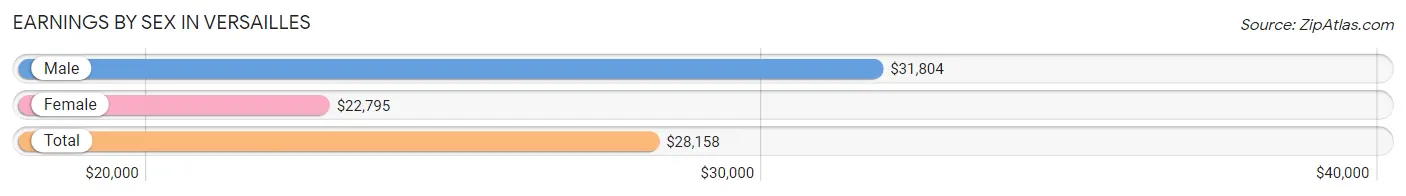
Earnings by Sex in Versailles
Average Earnings in Versailles are $28,158, $31,804 for men and $22,795 for women, a difference of 28.3%.
| Sex | Number | Average Earnings |
| Male | 503 (46.8%) | $31,804 |
| Female | 573 (53.2%) | $22,795 |
| Total | 1,076 (100.0%) | $28,158 |
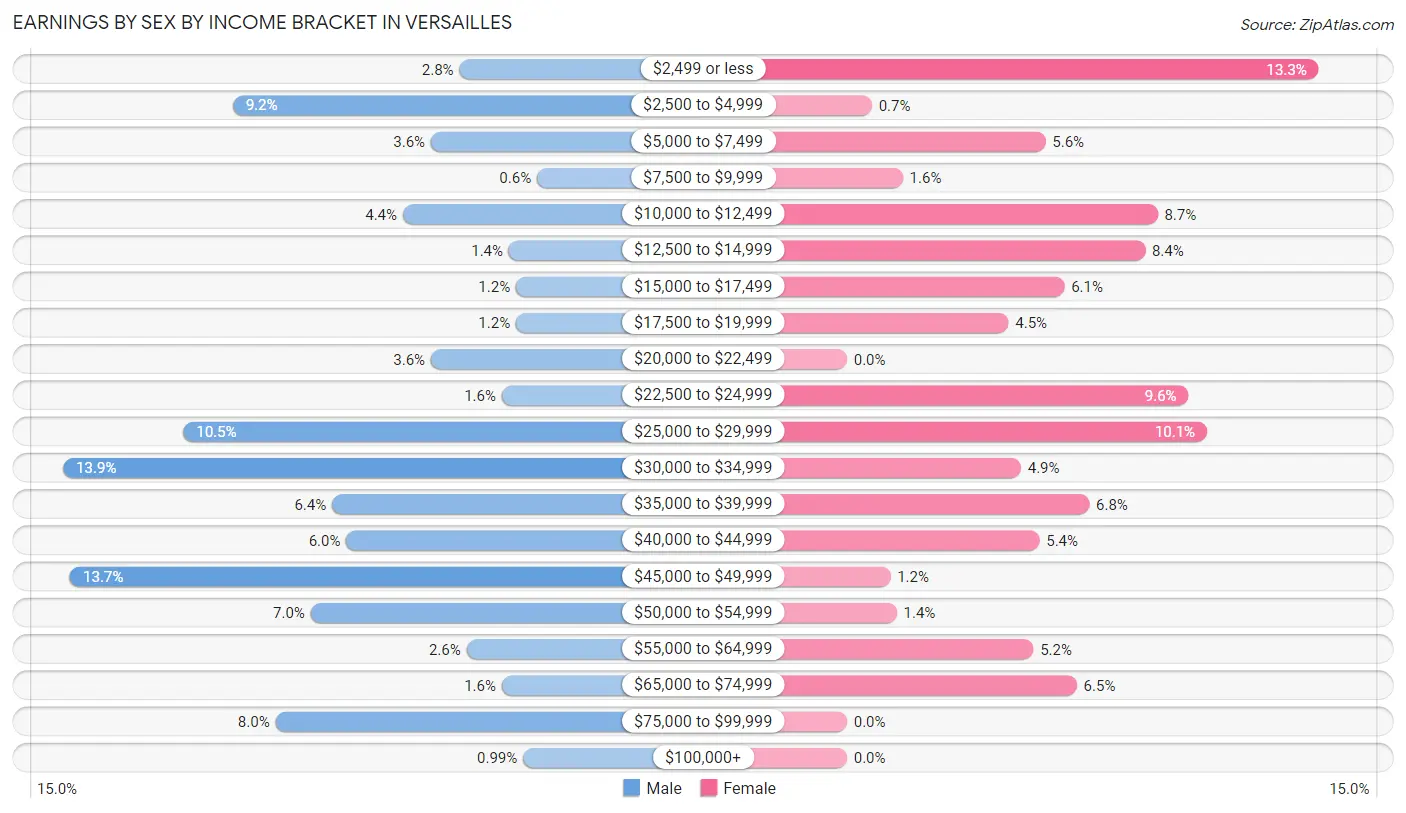
Earnings by Sex by Income Bracket in Versailles
The most common earnings brackets in Versailles are $30,000 to $34,999 for men (70 | 13.9%) and $2,499 or less for women (76 | 13.3%).
| Income | Male | Female |
| $2,499 or less | 14 (2.8%) | 76 (13.3%) |
| $2,500 to $4,999 | 46 (9.1%) | 4 (0.7%) |
| $5,000 to $7,499 | 18 (3.6%) | 32 (5.6%) |
| $7,500 to $9,999 | 3 (0.6%) | 9 (1.6%) |
| $10,000 to $12,499 | 22 (4.4%) | 50 (8.7%) |
| $12,500 to $14,999 | 7 (1.4%) | 48 (8.4%) |
| $15,000 to $17,499 | 6 (1.2%) | 35 (6.1%) |
| $17,500 to $19,999 | 6 (1.2%) | 26 (4.5%) |
| $20,000 to $22,499 | 18 (3.6%) | 0 (0.0%) |
| $22,500 to $24,999 | 8 (1.6%) | 55 (9.6%) |
| $25,000 to $29,999 | 53 (10.5%) | 58 (10.1%) |
| $30,000 to $34,999 | 70 (13.9%) | 28 (4.9%) |
| $35,000 to $39,999 | 32 (6.4%) | 39 (6.8%) |
| $40,000 to $44,999 | 30 (6.0%) | 31 (5.4%) |
| $45,000 to $49,999 | 69 (13.7%) | 7 (1.2%) |
| $50,000 to $54,999 | 35 (7.0%) | 8 (1.4%) |
| $55,000 to $64,999 | 13 (2.6%) | 30 (5.2%) |
| $65,000 to $74,999 | 8 (1.6%) | 37 (6.5%) |
| $75,000 to $99,999 | 40 (8.0%) | 0 (0.0%) |
| $100,000+ | 5 (1.0%) | 0 (0.0%) |
| Total | 503 (100.0%) | 573 (100.0%) |
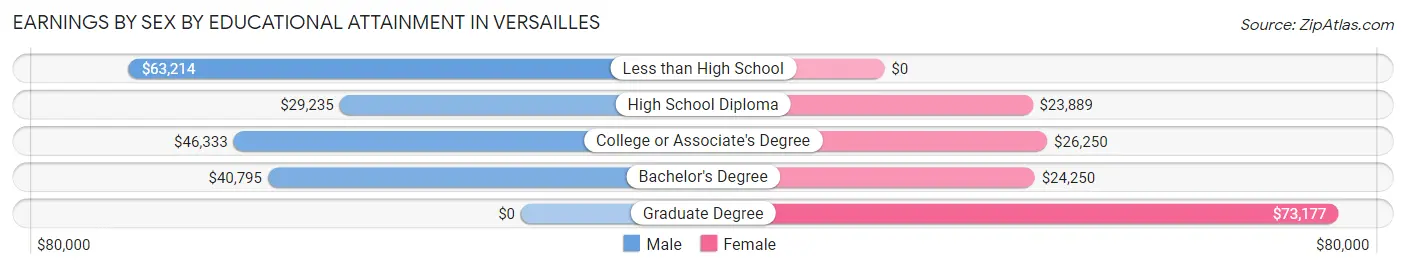
Earnings by Sex by Educational Attainment in Versailles
Average earnings in Versailles are $32,250 for men and $24,591 for women, a difference of 23.7%. Men with an educational attainment of less than high school enjoy the highest average annual earnings of $63,214, while those with high school diploma education earn the least with $29,235. Women with an educational attainment of graduate degree earn the most with the average annual earnings of $73,177, while those with high school diploma education have the smallest earnings of $23,889.
| Educational Attainment | Male Income | Female Income |
| Less than High School | $63,214 | $0 |
| High School Diploma | $29,235 | $23,889 |
| College or Associate's Degree | $46,333 | $26,250 |
| Bachelor's Degree | $40,795 | $24,250 |
| Graduate Degree | - | - |
| Total | $32,250 | $24,591 |
Family Income in Versailles
Family Income Brackets in Versailles
According to the Versailles family income data, there are 118 families falling into the $10,000 to $14,999 income range, which is the most common income bracket and makes up 20.8% of all families.
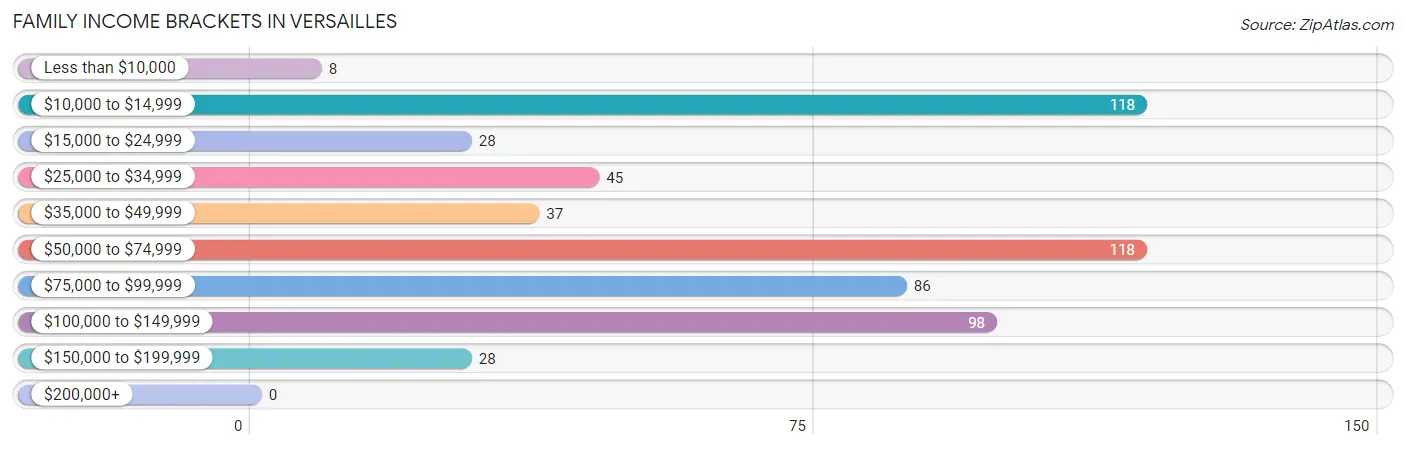
| Income Bracket | # Families | % Families |
| Less than $10,000 | 8 | 1.4% |
| $10,000 to $14,999 | 118 | 20.8% |
| $15,000 to $24,999 | 28 | 4.9% |
| $25,000 to $34,999 | 45 | 8.0% |
| $35,000 to $49,999 | 37 | 6.5% |
| $50,000 to $74,999 | 118 | 20.8% |
| $75,000 to $99,999 | 86 | 15.2% |
| $100,000 to $149,999 | 98 | 17.3% |
| $150,000 to $199,999 | 28 | 4.9% |
| $200,000+ | 0 | 0.0% |
Family Income by Famaliy Size in Versailles
7+ person families (23 | 4.1%) account for the highest median family income in Versailles with $144,219 per family, while 3-person families (40 | 7.1%) have the highest median income of $24,583 per family member.
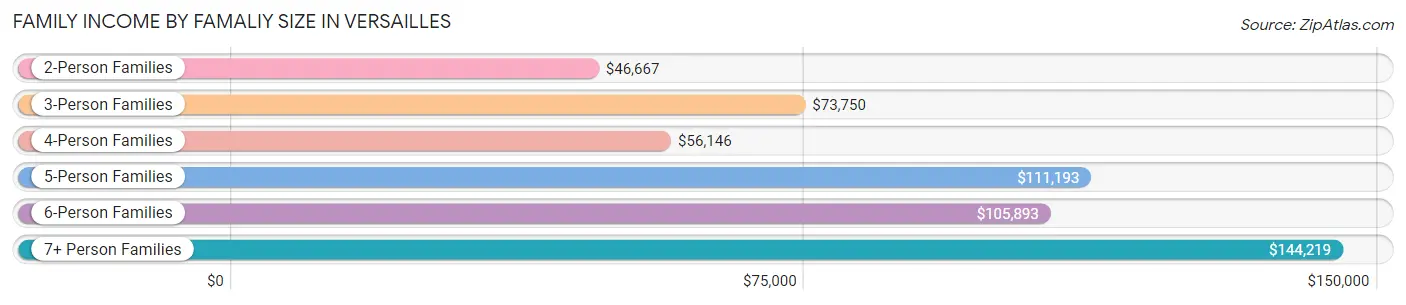
| Income Bracket | # Families | Median Income |
| 2-Person Families | 390 (68.9%) | $46,667 |
| 3-Person Families | 40 (7.1%) | $73,750 |
| 4-Person Families | 73 (12.9%) | $56,146 |
| 5-Person Families | 27 (4.8%) | $111,193 |
| 6-Person Families | 13 (2.3%) | $105,893 |
| 7+ Person Families | 23 (4.1%) | $144,219 |
| Total | 566 (100.0%) | $57,986 |
Family Income by Number of Earners in Versailles
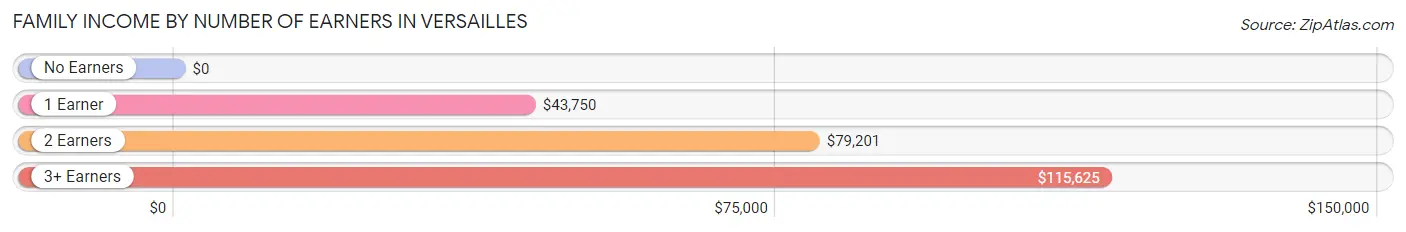
| Number of Earners | # Families | Median Income |
| No Earners | 193 (34.1%) | $0 |
| 1 Earner | 128 (22.6%) | $43,750 |
| 2 Earners | 209 (36.9%) | $79,201 |
| 3+ Earners | 36 (6.4%) | $115,625 |
| Total | 566 (100.0%) | $57,986 |
Household Income in Versailles
Household Income Brackets in Versailles
With 213 households falling in the category, the $15,000 to $24,999 income range is the most frequent in Versailles, accounting for 19.9% of all households.
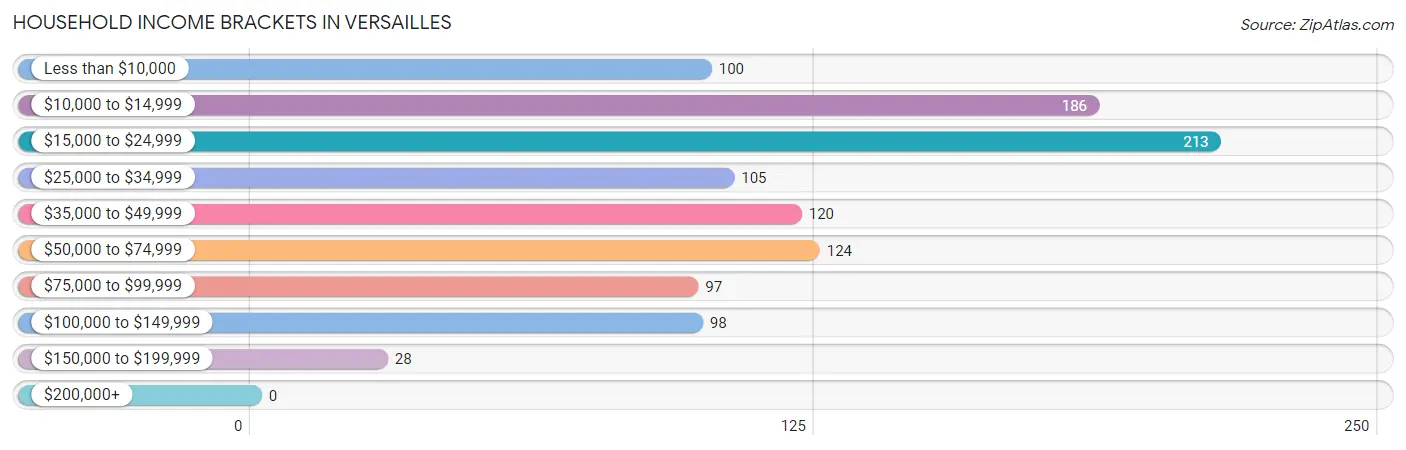
| Income Bracket | # Households | % Households |
| Less than $10,000 | 100 | 9.3% |
| $10,000 to $14,999 | 186 | 17.4% |
| $15,000 to $24,999 | 213 | 19.9% |
| $25,000 to $34,999 | 105 | 9.8% |
| $35,000 to $49,999 | 120 | 11.2% |
| $50,000 to $74,999 | 124 | 11.6% |
| $75,000 to $99,999 | 97 | 9.1% |
| $100,000 to $149,999 | 98 | 9.2% |
| $150,000 to $199,999 | 28 | 2.6% |
| $200,000+ | 0 | 0.0% |
Household Income by Householder Age in Versailles
The median household income in Versailles is $27,202, with the highest median household income of $40,905 found in the 25 to 44 years age bracket for the primary householder. A total of 263 households (24.6%) fall into this category. Meanwhile, the 15 to 24 years age bracket for the primary householder has the lowest median household income of $2,499, with 20 households (1.9%) in this group.
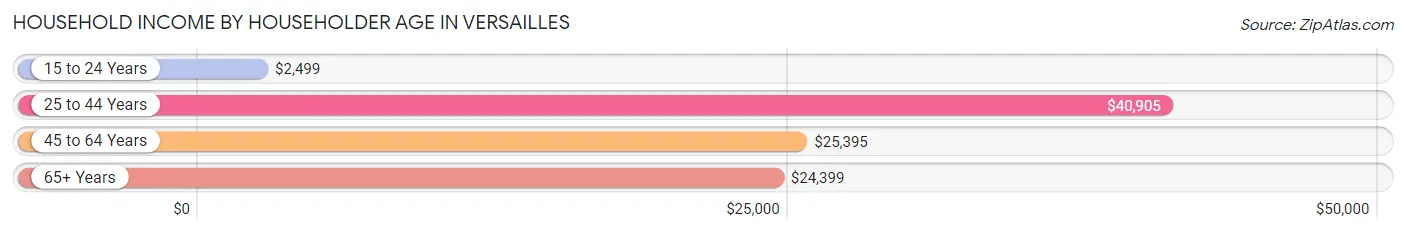
| Income Bracket | # Households | Median Income |
| 15 to 24 Years | 20 (1.9%) | $2,499 |
| 25 to 44 Years | 263 (24.6%) | $40,905 |
| 45 to 64 Years | 458 (42.8%) | $25,395 |
| 65+ Years | 329 (30.7%) | $24,399 |
| Total | 1,070 (100.0%) | $27,202 |
Poverty in Versailles
Income Below Poverty by Sex and Age in Versailles
With 19.0% poverty level for males and 27.6% for females among the residents of Versailles, 5 year old males and 5 year old females are the most vulnerable to poverty, with 3 males (100.0%) and 13 females (100.0%) in their respective age groups living below the poverty level.
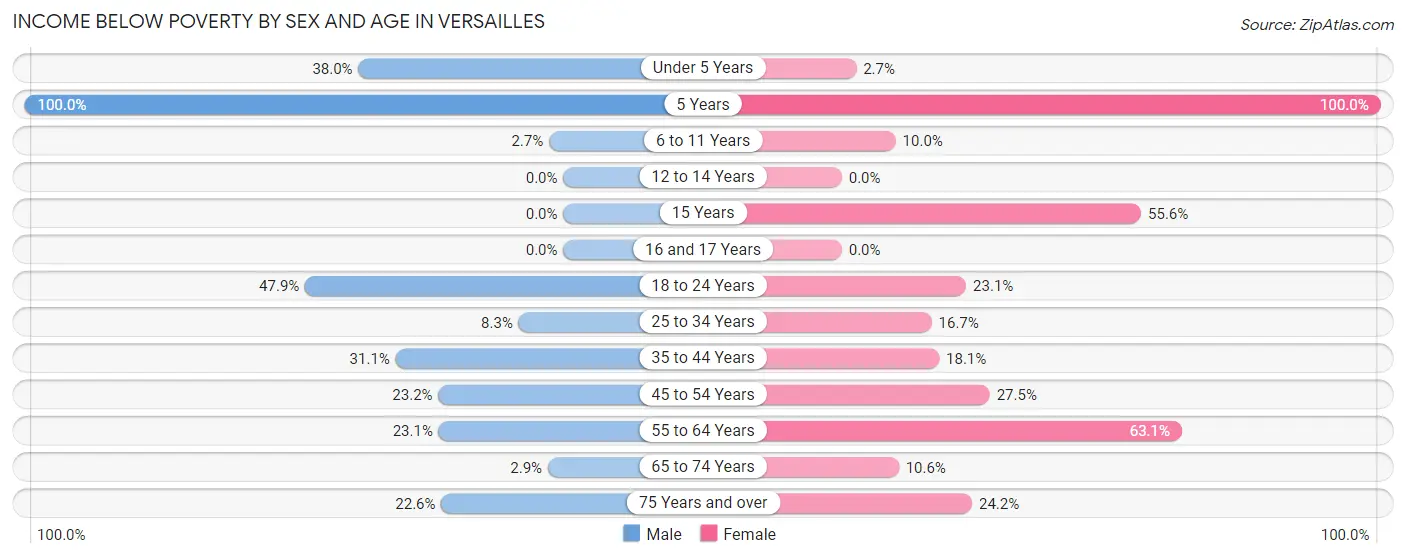
| Age Bracket | Male | Female |
| Under 5 Years | 27 (38.0%) | 2 (2.7%) |
| 5 Years | 3 (100.0%) | 13 (100.0%) |
| 6 to 11 Years | 3 (2.6%) | 7 (10.0%) |
| 12 to 14 Years | 0 (0.0%) | 0 (0.0%) |
| 15 Years | 0 (0.0%) | 20 (55.6%) |
| 16 and 17 Years | 0 (0.0%) | 0 (0.0%) |
| 18 to 24 Years | 23 (47.9%) | 18 (23.1%) |
| 25 to 34 Years | 13 (8.3%) | 22 (16.7%) |
| 35 to 44 Years | 33 (31.1%) | 28 (18.1%) |
| 45 to 54 Years | 32 (23.2%) | 39 (27.5%) |
| 55 to 64 Years | 31 (23.1%) | 159 (63.1%) |
| 65 to 74 Years | 3 (2.9%) | 15 (10.6%) |
| 75 Years and over | 24 (22.6%) | 29 (24.2%) |
| Total | 192 (19.0%) | 352 (27.6%) |
Income Above Poverty by Sex and Age in Versailles
According to the poverty statistics in Versailles, males aged 12 to 14 years and females aged 12 to 14 years are the age groups that are most secure financially, with 100.0% of males and 100.0% of females in these age groups living above the poverty line.
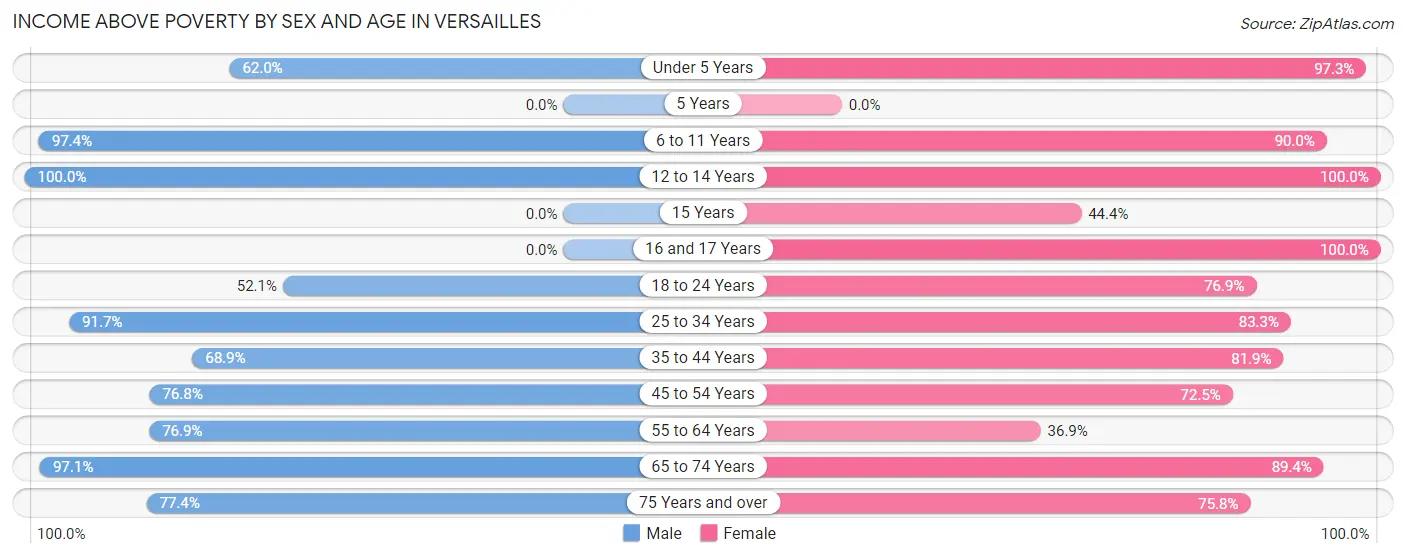
| Age Bracket | Male | Female |
| Under 5 Years | 44 (62.0%) | 73 (97.3%) |
| 5 Years | 0 (0.0%) | 0 (0.0%) |
| 6 to 11 Years | 110 (97.4%) | 63 (90.0%) |
| 12 to 14 Years | 29 (100.0%) | 28 (100.0%) |
| 15 Years | 0 (0.0%) | 16 (44.4%) |
| 16 and 17 Years | 0 (0.0%) | 33 (100.0%) |
| 18 to 24 Years | 25 (52.1%) | 60 (76.9%) |
| 25 to 34 Years | 144 (91.7%) | 110 (83.3%) |
| 35 to 44 Years | 73 (68.9%) | 127 (81.9%) |
| 45 to 54 Years | 106 (76.8%) | 103 (72.5%) |
| 55 to 64 Years | 103 (76.9%) | 93 (36.9%) |
| 65 to 74 Years | 102 (97.1%) | 127 (89.4%) |
| 75 Years and over | 82 (77.4%) | 91 (75.8%) |
| Total | 818 (81.0%) | 924 (72.4%) |
Income Below Poverty Among Married-Couple Families in Versailles
The poverty statistics for married-couple families in Versailles show that 1.0% or 3 of the total 305 families live below the poverty line. Families with 3 or 4 children have the highest poverty rate of 15.8%, comprising of 3 families. On the other hand, families with no children have the lowest poverty rate of 0.0%, which includes 0 families.
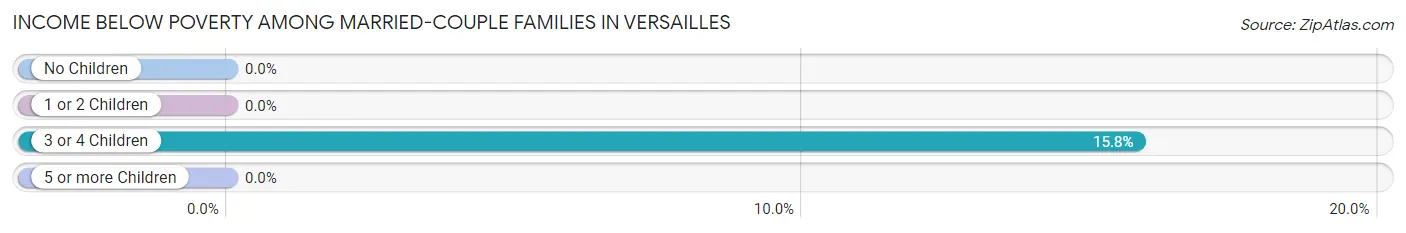
| Children | Above Poverty | Below Poverty |
| No Children | 177 (100.0%) | 0 (0.0%) |
| 1 or 2 Children | 95 (100.0%) | 0 (0.0%) |
| 3 or 4 Children | 16 (84.2%) | 3 (15.8%) |
| 5 or more Children | 14 (100.0%) | 0 (0.0%) |
| Total | 302 (99.0%) | 3 (1.0%) |
Income Below Poverty Among Single-Parent Households in Versailles
According to the poverty data in Versailles, 35.6% or 31 single-father households and 78.7% or 137 single-mother households are living below the poverty line. Among single-father households, those with 1 or 2 children have the highest poverty rate, with 25 households (55.6%) experiencing poverty. Likewise, among single-mother households, those with 3 or 4 children have the highest poverty rate, with 19 households (100.0%) falling below the poverty line.
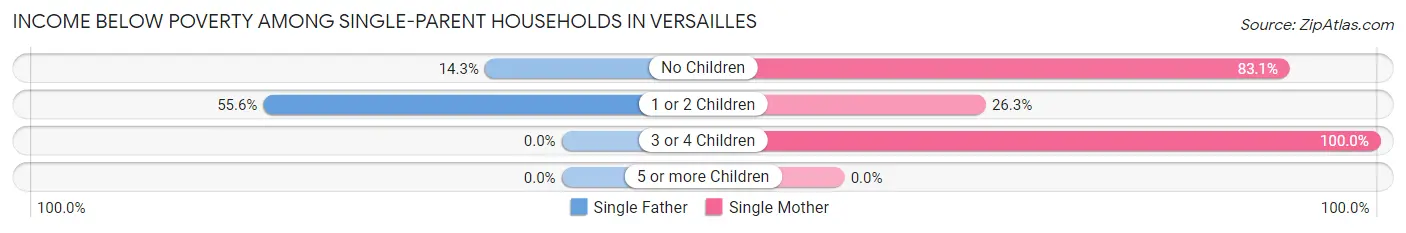
| Children | Single Father | Single Mother |
| No Children | 6 (14.3%) | 113 (83.1%) |
| 1 or 2 Children | 25 (55.6%) | 5 (26.3%) |
| 3 or 4 Children | 0 (0.0%) | 19 (100.0%) |
| 5 or more Children | 0 (0.0%) | 0 (0.0%) |
| Total | 31 (35.6%) | 137 (78.7%) |
Income Below Poverty Among Married-Couple vs Single-Parent Households in Versailles
The poverty data for Versailles shows that 3 of the married-couple family households (1.0%) and 168 of the single-parent households (64.4%) are living below the poverty level. Within the married-couple family households, those with 3 or 4 children have the highest poverty rate, with 3 households (15.8%) falling below the poverty line. Among the single-parent households, those with 3 or 4 children have the highest poverty rate, with 19 household (100.0%) living below poverty.
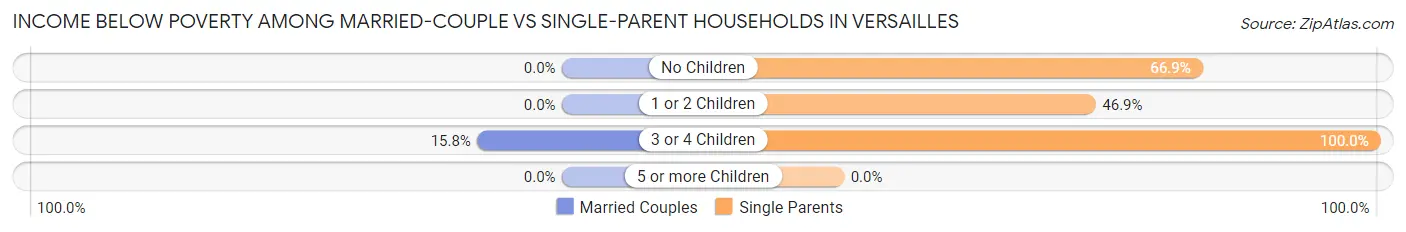
| Children | Married-Couple Families | Single-Parent Households |
| No Children | 0 (0.0%) | 119 (66.8%) |
| 1 or 2 Children | 0 (0.0%) | 30 (46.9%) |
| 3 or 4 Children | 3 (15.8%) | 19 (100.0%) |
| 5 or more Children | 0 (0.0%) | 0 (0.0%) |
| Total | 3 (1.0%) | 168 (64.4%) |
Race in Versailles
The most populous races in Versailles are White / Caucasian (2,298 | 90.1%), Two or more Races (190 | 7.4%), and Hispanic or Latino (156 | 6.1%).
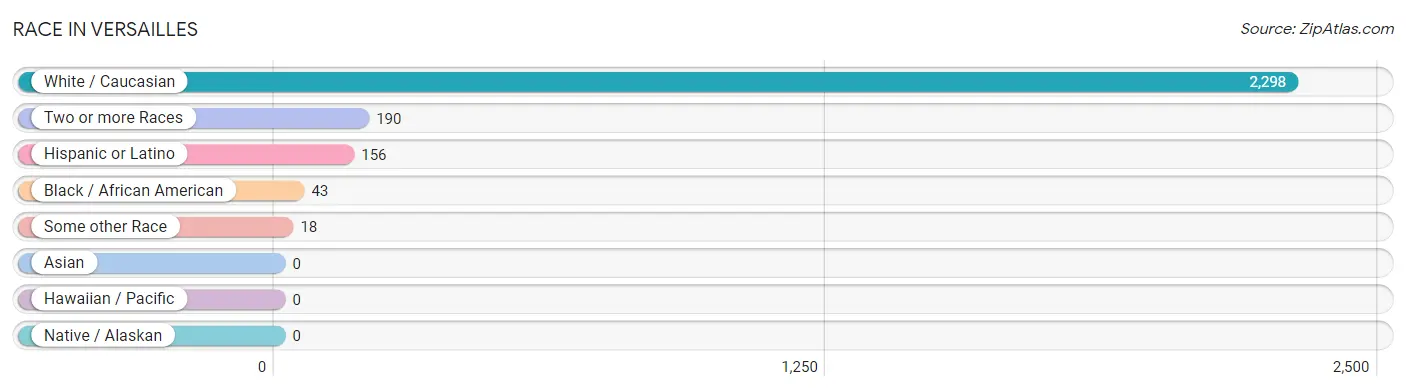
| Race | # Population | % Population |
| Asian | 0 | 0.0% |
| Black / African American | 43 | 1.7% |
| Hawaiian / Pacific | 0 | 0.0% |
| Hispanic or Latino | 156 | 6.1% |
| Native / Alaskan | 0 | 0.0% |
| White / Caucasian | 2,298 | 90.1% |
| Two or more Races | 190 | 7.4% |
| Some other Race | 18 | 0.7% |
| Total | 2,549 | 100.0% |
Ancestry in Versailles
The most populous ancestries reported in Versailles are American (449 | 17.6%), German (395 | 15.5%), English (283 | 11.1%), Irish (206 | 8.1%), and Mexican (127 | 5.0%), together accounting for 57.3% of all Versailles residents.
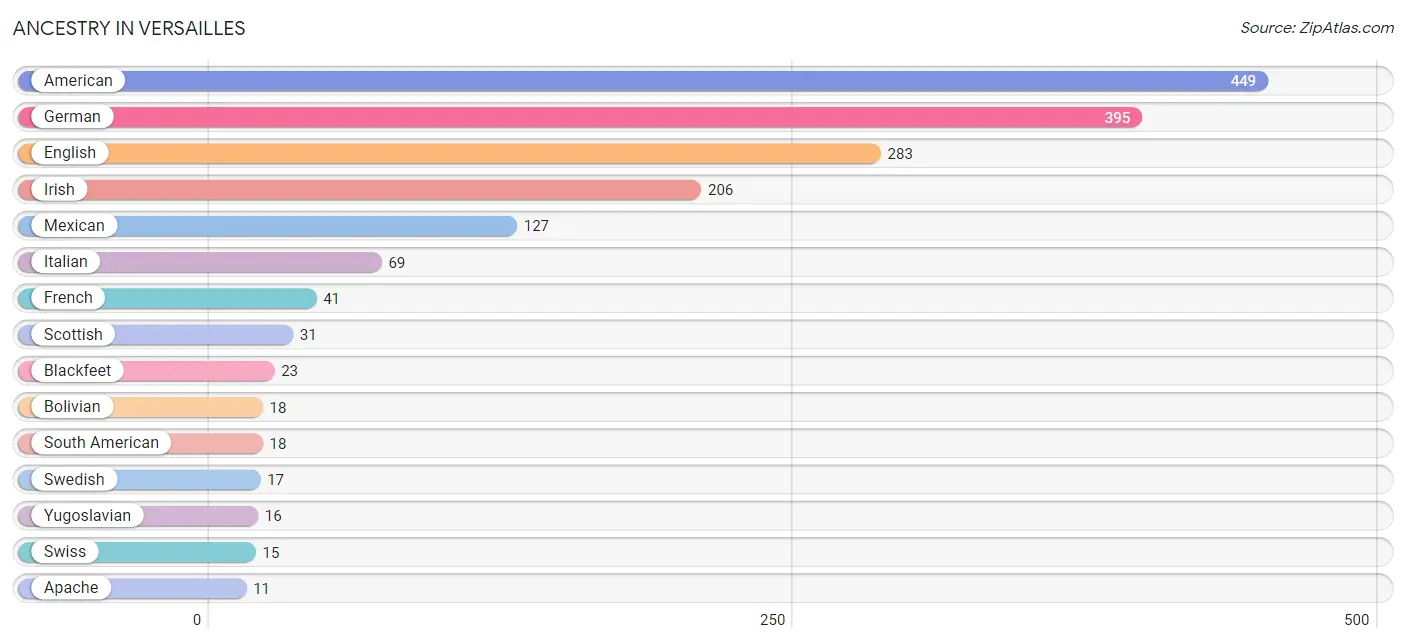
| Ancestry | # Population | % Population |
| American | 449 | 17.6% |
| Apache | 11 | 0.4% |
| Armenian | 2 | 0.1% |
| Blackfeet | 23 | 0.9% |
| Bolivian | 18 | 0.7% |
| Celtic | 7 | 0.3% |
| Cherokee | 2 | 0.1% |
| Danish | 3 | 0.1% |
| English | 283 | 11.1% |
| French | 41 | 1.6% |
| German | 395 | 15.5% |
| Irish | 206 | 8.1% |
| Italian | 69 | 2.7% |
| Korean | 3 | 0.1% |
| Mexican | 127 | 5.0% |
| Norwegian | 6 | 0.2% |
| Pennsylvania German | 6 | 0.2% |
| Scottish | 31 | 1.2% |
| Sioux | 2 | 0.1% |
| South American | 18 | 0.7% |
| Swedish | 17 | 0.7% |
| Swiss | 15 | 0.6% |
| Welsh | 3 | 0.1% |
| Yugoslavian | 16 | 0.6% | View All 24 Rows |
Immigrants in Versailles

| Immigration Origin | # Population | % Population | View All 0 Rows |
Sex and Age in Versailles
Sex and Age in Versailles
The most populous age groups in Versailles are 25 to 29 Years (144 | 12.4%) for men and 55 to 59 Years (195 | 14.1%) for women.
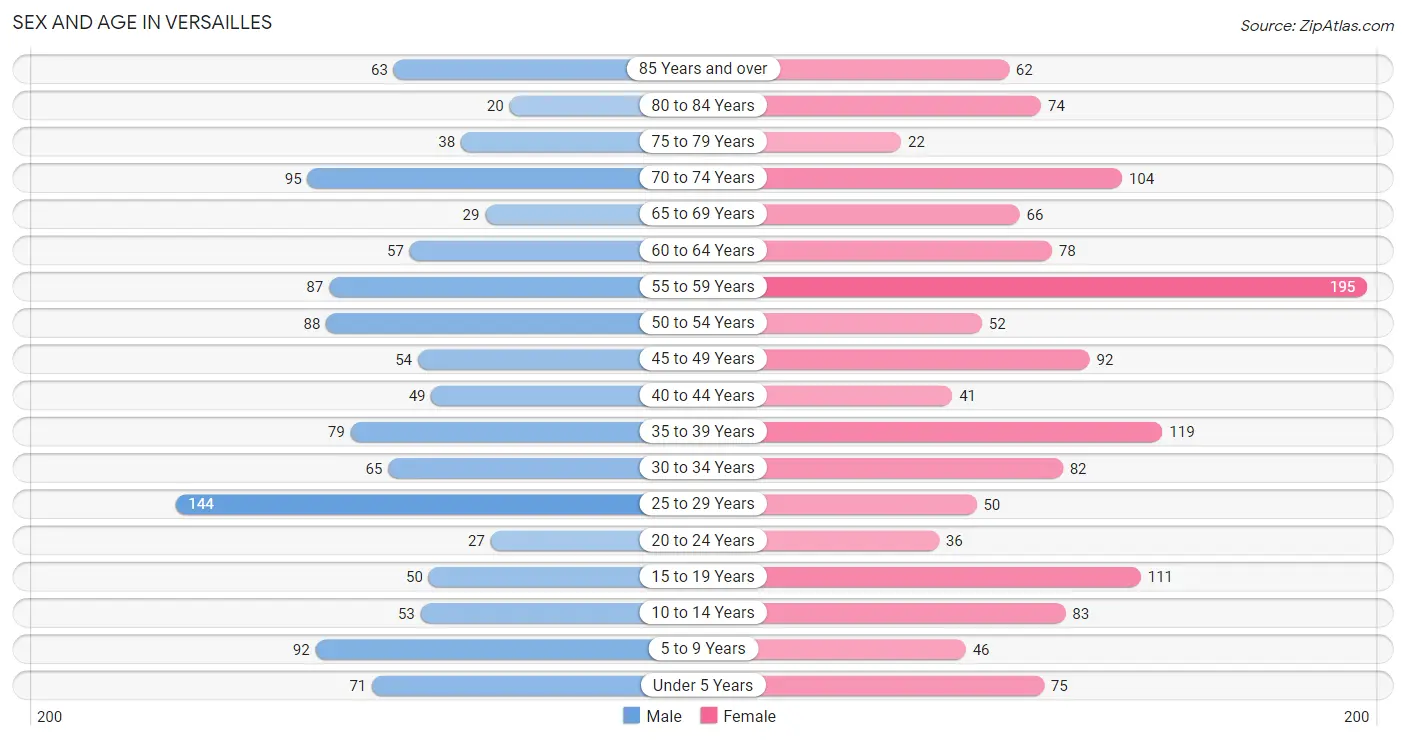
| Age Bracket | Male | Female |
| Under 5 Years | 71 (6.1%) | 75 (5.4%) |
| 5 to 9 Years | 92 (7.9%) | 46 (3.3%) |
| 10 to 14 Years | 53 (4.6%) | 83 (6.0%) |
| 15 to 19 Years | 50 (4.3%) | 111 (8.0%) |
| 20 to 24 Years | 27 (2.3%) | 36 (2.6%) |
| 25 to 29 Years | 144 (12.4%) | 50 (3.6%) |
| 30 to 34 Years | 65 (5.6%) | 82 (5.9%) |
| 35 to 39 Years | 79 (6.8%) | 119 (8.6%) |
| 40 to 44 Years | 49 (4.2%) | 41 (2.9%) |
| 45 to 49 Years | 54 (4.6%) | 92 (6.6%) |
| 50 to 54 Years | 88 (7.6%) | 52 (3.7%) |
| 55 to 59 Years | 87 (7.5%) | 195 (14.1%) |
| 60 to 64 Years | 57 (4.9%) | 78 (5.6%) |
| 65 to 69 Years | 29 (2.5%) | 66 (4.8%) |
| 70 to 74 Years | 95 (8.2%) | 104 (7.5%) |
| 75 to 79 Years | 38 (3.3%) | 22 (1.6%) |
| 80 to 84 Years | 20 (1.7%) | 74 (5.3%) |
| 85 Years and over | 63 (5.4%) | 62 (4.5%) |
| Total | 1,161 (100.0%) | 1,388 (100.0%) |
Families and Households in Versailles
Median Family Size in Versailles
The median family size in Versailles is 2.99 persons per family, with married-couple families (305 | 53.9%) accounting for the largest median family size of 3.64 persons per family. On the other hand, single female/mother families (174 | 30.7%) represent the smallest median family size with 1.99 persons per family.
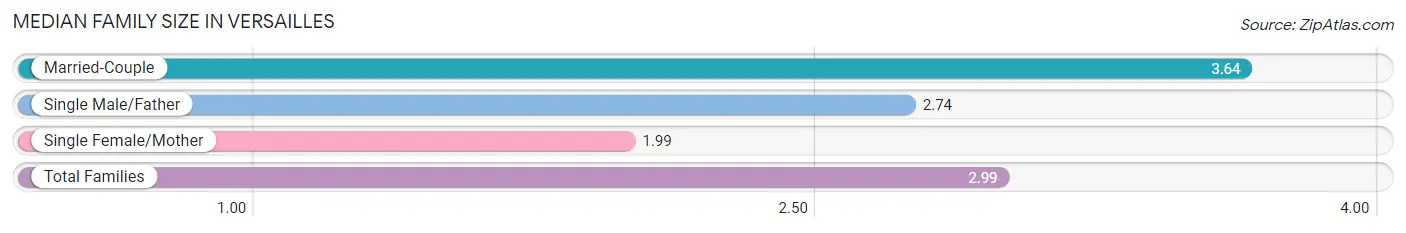
| Family Type | # Families | Family Size |
| Married-Couple | 305 (53.9%) | 3.64 |
| Single Male/Father | 87 (15.4%) | 2.74 |
| Single Female/Mother | 174 (30.7%) | 1.99 |
| Total Families | 566 (100.0%) | 2.99 |
Median Household Size in Versailles
The median household size in Versailles is 2.13 persons per household, with married-couple households (305 | 28.5%) accounting for the largest median household size of 3.64 persons per household. non-family households (504 | 47.1%) represent the smallest median household size with 1.06 persons per household.
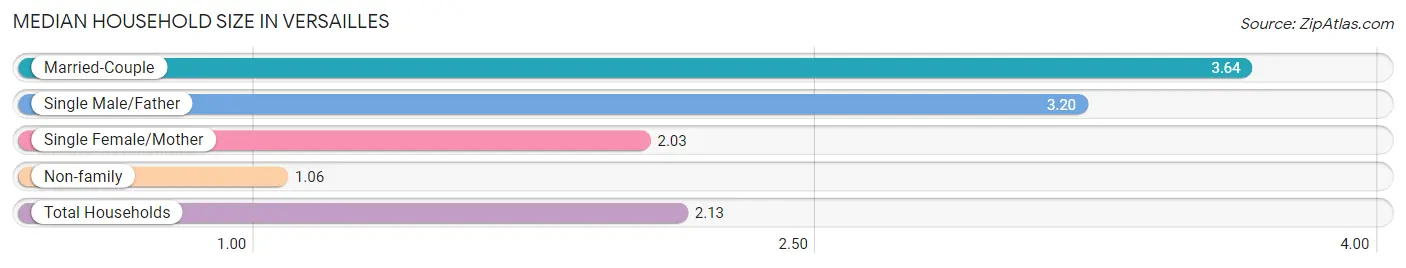
| Household Type | # Households | Household Size |
| Married-Couple | 305 (28.5%) | 3.64 |
| Single Male/Father | 87 (8.1%) | 3.20 |
| Single Female/Mother | 174 (16.3%) | 2.03 |
| Non-family | 504 (47.1%) | 1.06 |
| Total Households | 1,070 (100.0%) | 2.13 |
Household Size by Marriage Status in Versailles
Out of a total of 1,070 households in Versailles, 566 (52.9%) are family households, while 504 (47.1%) are nonfamily households. The most numerous type of family households are 2-person households, comprising 380, and the most common type of nonfamily households are 1-person households, comprising 488.
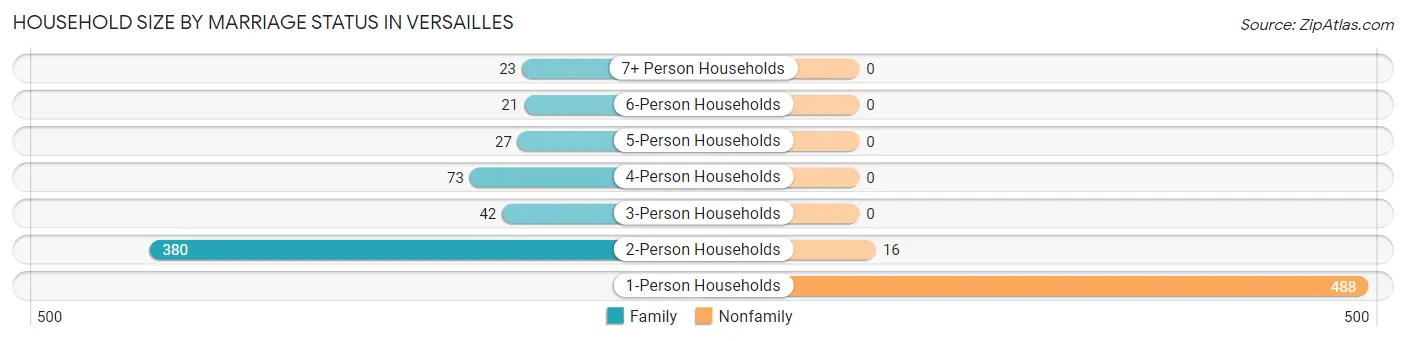
| Household Size | Family Households | Nonfamily Households |
| 1-Person Households | - | 488 (45.6%) |
| 2-Person Households | 380 (35.5%) | 16 (1.5%) |
| 3-Person Households | 42 (3.9%) | 0 (0.0%) |
| 4-Person Households | 73 (6.8%) | 0 (0.0%) |
| 5-Person Households | 27 (2.5%) | 0 (0.0%) |
| 6-Person Households | 21 (2.0%) | 0 (0.0%) |
| 7+ Person Households | 23 (2.1%) | 0 (0.0%) |
| Total | 566 (52.9%) | 504 (47.1%) |
Female Fertility in Versailles
Fertility by Age in Versailles
Average fertility rate in Versailles is 51.0 births per 1,000 women. Women in the age bracket of 20 to 34 years have the highest fertility rate with 161.0 births per 1,000 women. Women in the age bracket of 20 to 34 years acount for 100.0% of all women with births.
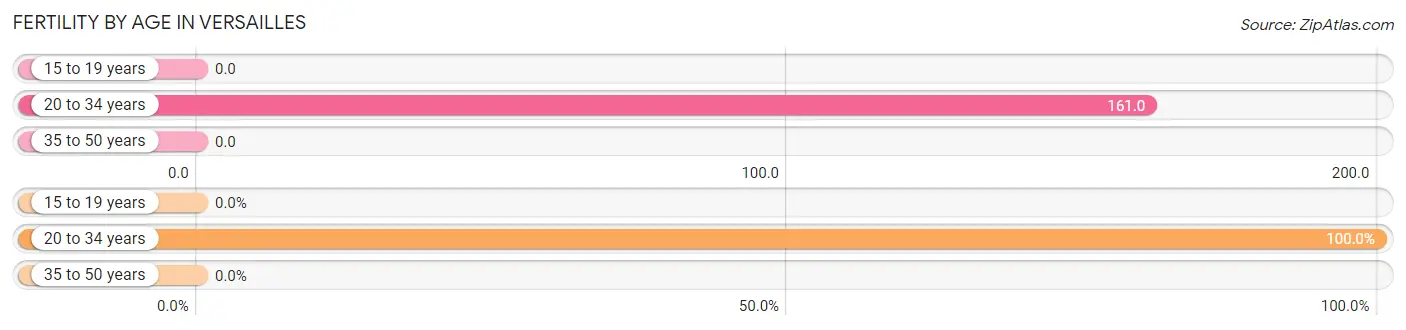
| Age Bracket | Women with Births | Births / 1,000 Women |
| 15 to 19 years | 0 (0.0%) | 0.0 |
| 20 to 34 years | 27 (100.0%) | 161.0 |
| 35 to 50 years | 0 (0.0%) | 0.0 |
| Total | 27 (100.0%) | 51.0 |
Fertility by Age by Marriage Status in Versailles
33.3% of women with births (27) in Versailles are married. The highest percentage of unmarried women with births falls into 20 to 34 years age bracket with 66.7% of them unmarried at the time of birth, while the lowest percentage of unmarried women with births belong to 20 to 34 years age bracket with 66.7% of them unmarried.
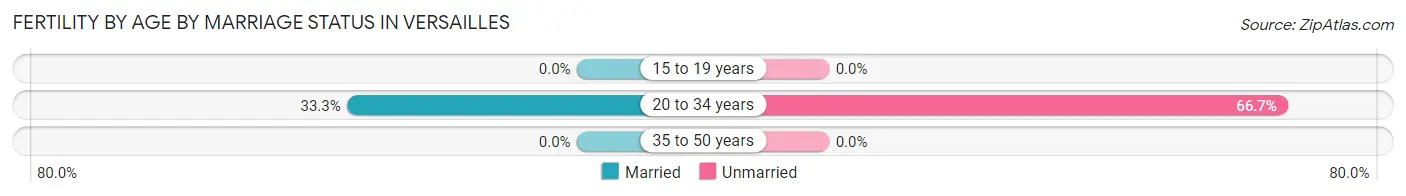
| Age Bracket | Married | Unmarried |
| 15 to 19 years | 0 (0.0%) | 0 (0.0%) |
| 20 to 34 years | 9 (33.3%) | 18 (66.7%) |
| 35 to 50 years | 0 (0.0%) | 0 (0.0%) |
| Total | 9 (33.3%) | 18 (66.7%) |
Fertility by Education in Versailles
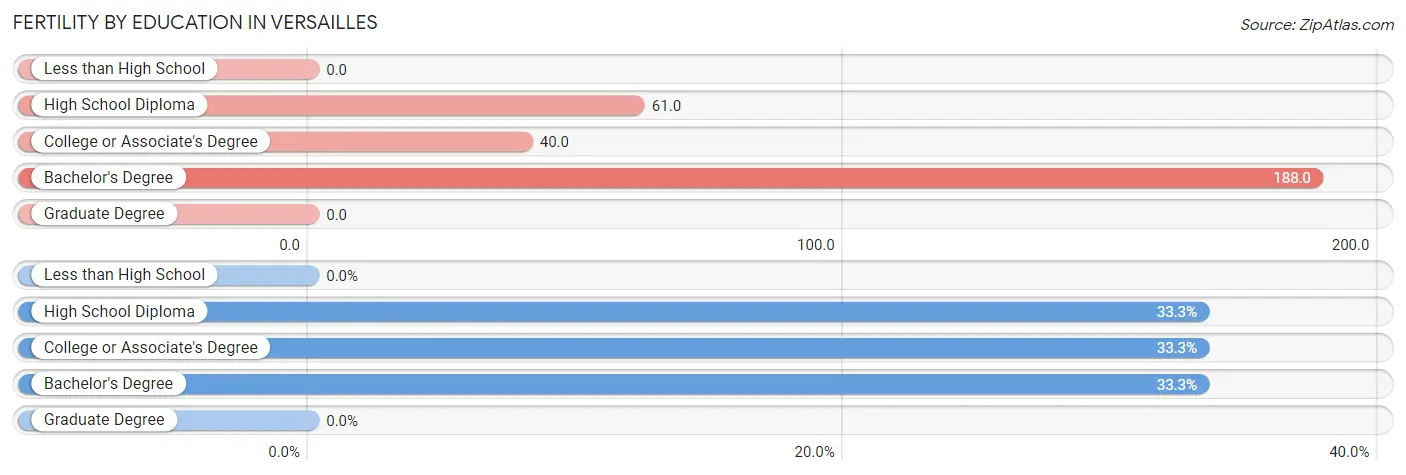
| Educational Attainment | Women with Births | Births / 1,000 Women |
| Less than High School | 0 (0.0%) | 0.0 |
| High School Diploma | 9 (33.3%) | 61.0 |
| College or Associate's Degree | 9 (33.3%) | 40.0 |
| Bachelor's Degree | 9 (33.3%) | 188.0 |
| Graduate Degree | 0 (0.0%) | 0.0 |
| Total | 27 (100.0%) | 51.0 |
Fertility by Education by Marriage Status in Versailles
66.7% of women with births in Versailles are unmarried. Women with the educational attainment of bachelor's degree are most likely to be married with 100.0% of them married at childbirth, while women with the educational attainment of high school diploma are least likely to be married with 100.0% of them unmarried at childbirth.
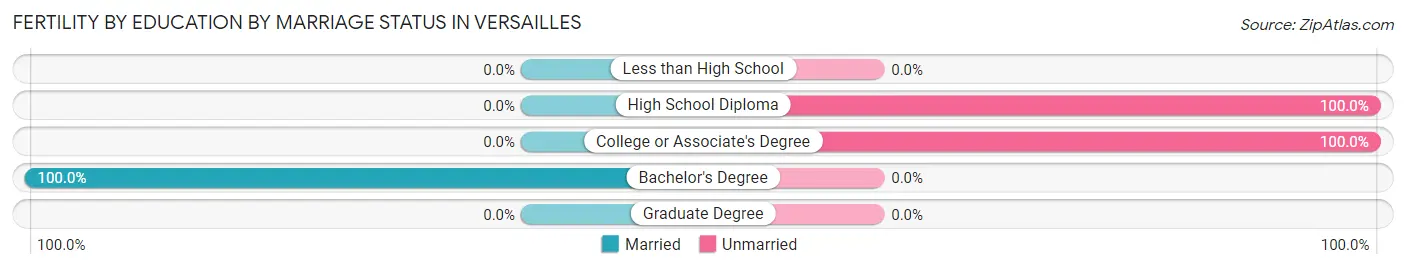
| Educational Attainment | Married | Unmarried |
| Less than High School | 0 (0.0%) | 0 (0.0%) |
| High School Diploma | 0 (0.0%) | 9 (100.0%) |
| College or Associate's Degree | 0 (0.0%) | 9 (100.0%) |
| Bachelor's Degree | 9 (100.0%) | 0 (0.0%) |
| Graduate Degree | 0 (0.0%) | 0 (0.0%) |
| Total | 9 (33.3%) | 18 (66.7%) |
Employment Characteristics in Versailles
Employment by Class of Employer in Versailles
Among the 938 employed individuals in Versailles, private company employees (676 | 72.1%), local government employees (88 | 9.4%), and not-for-profit organizations (61 | 6.5%) make up the most common classes of employment.
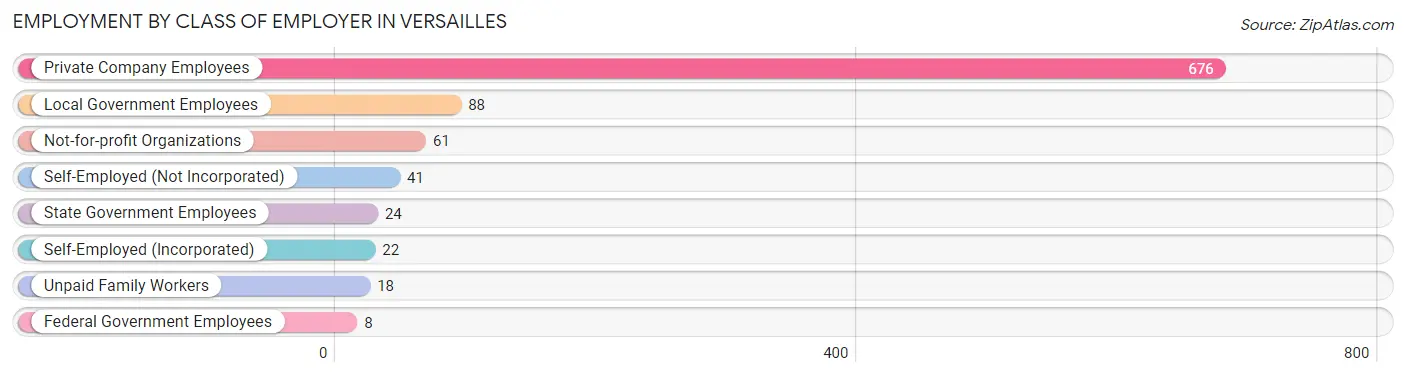
| Employer Class | # Employees | % Employees |
| Private Company Employees | 676 | 72.1% |
| Self-Employed (Incorporated) | 22 | 2.4% |
| Self-Employed (Not Incorporated) | 41 | 4.4% |
| Not-for-profit Organizations | 61 | 6.5% |
| Local Government Employees | 88 | 9.4% |
| State Government Employees | 24 | 2.6% |
| Federal Government Employees | 8 | 0.9% |
| Unpaid Family Workers | 18 | 1.9% |
| Total | 938 | 100.0% |
Employment Status by Age in Versailles
According to the labor force statistics for Versailles, out of the total population over 16 years of age (2,093), 47.8% or 1,000 individuals are in the labor force, with 5.6% or 56 of them unemployed. The age group with the highest labor force participation rate is 25 to 29 years, with 79.4% or 154 individuals in the labor force. Within the labor force, the 20 to 24 years age range has the highest percentage of unemployed individuals, with 61.1% or 22 of them being unemployed.
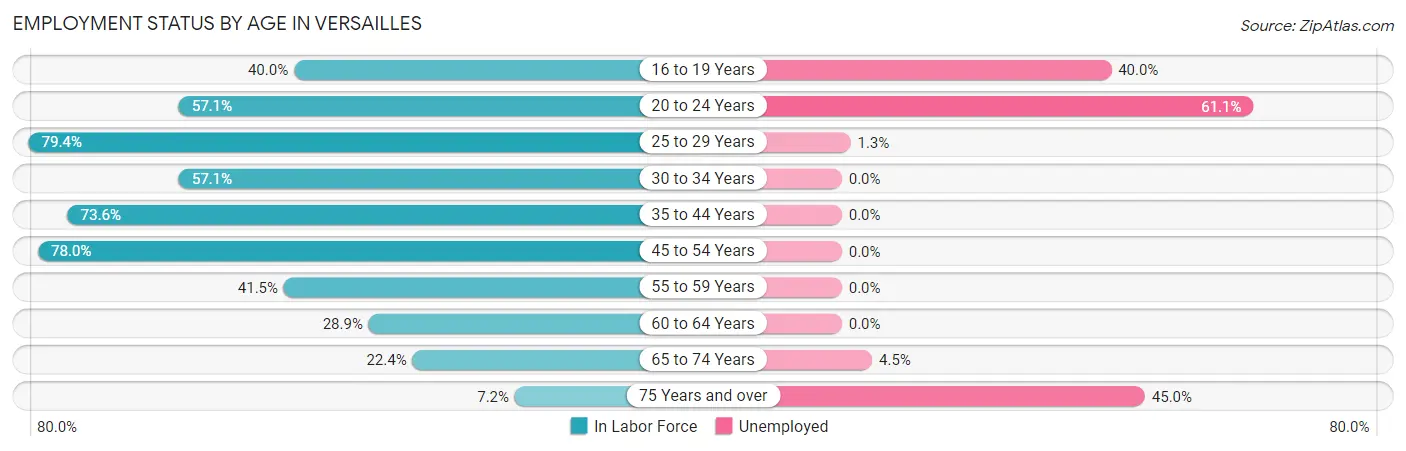
| Age Bracket | In Labor Force | Unemployed |
| 16 to 19 Years | 50 (40.0%) | 20 (40.0%) |
| 20 to 24 Years | 36 (57.1%) | 22 (61.1%) |
| 25 to 29 Years | 154 (79.4%) | 2 (1.3%) |
| 30 to 34 Years | 84 (57.1%) | 0 (0.0%) |
| 35 to 44 Years | 212 (73.6%) | 0 (0.0%) |
| 45 to 54 Years | 223 (78.0%) | 0 (0.0%) |
| 55 to 59 Years | 117 (41.5%) | 0 (0.0%) |
| 60 to 64 Years | 39 (28.9%) | 0 (0.0%) |
| 65 to 74 Years | 66 (22.4%) | 3 (4.5%) |
| 75 Years and over | 20 (7.2%) | 9 (45.0%) |
| Total | 1,000 (47.8%) | 56 (5.6%) |
Employment Status by Educational Attainment in Versailles
According to labor force statistics for Versailles, 62.2% of individuals (829) out of the total population between 25 and 64 years of age (1,332) are in the labor force, with 0.2% or 2 of them being unemployed. The group with the highest labor force participation rate are those with the educational attainment of bachelor's degree or higher, with 79.9% or 151 individuals in the labor force. Within the labor force, individuals with college / associate degree education have the highest percentage of unemployment, with 0.8% or 2 of them being unemployed.
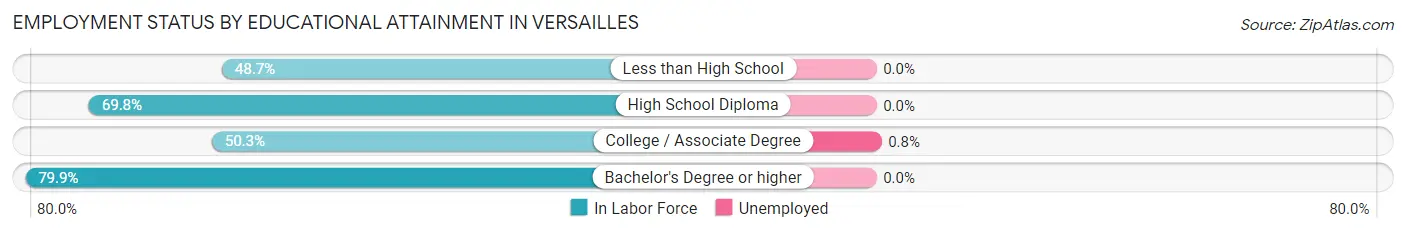
| Educational Attainment | In Labor Force | Unemployed |
| Less than High School | 57 (48.7%) | 0 (0.0%) |
| High School Diploma | 376 (69.8%) | 0 (0.0%) |
| College / Associate Degree | 245 (50.3%) | 4 (0.8%) |
| Bachelor's Degree or higher | 151 (79.9%) | 0 (0.0%) |
| Total | 829 (62.2%) | 3 (0.2%) |
Employment Occupations by Sex in Versailles
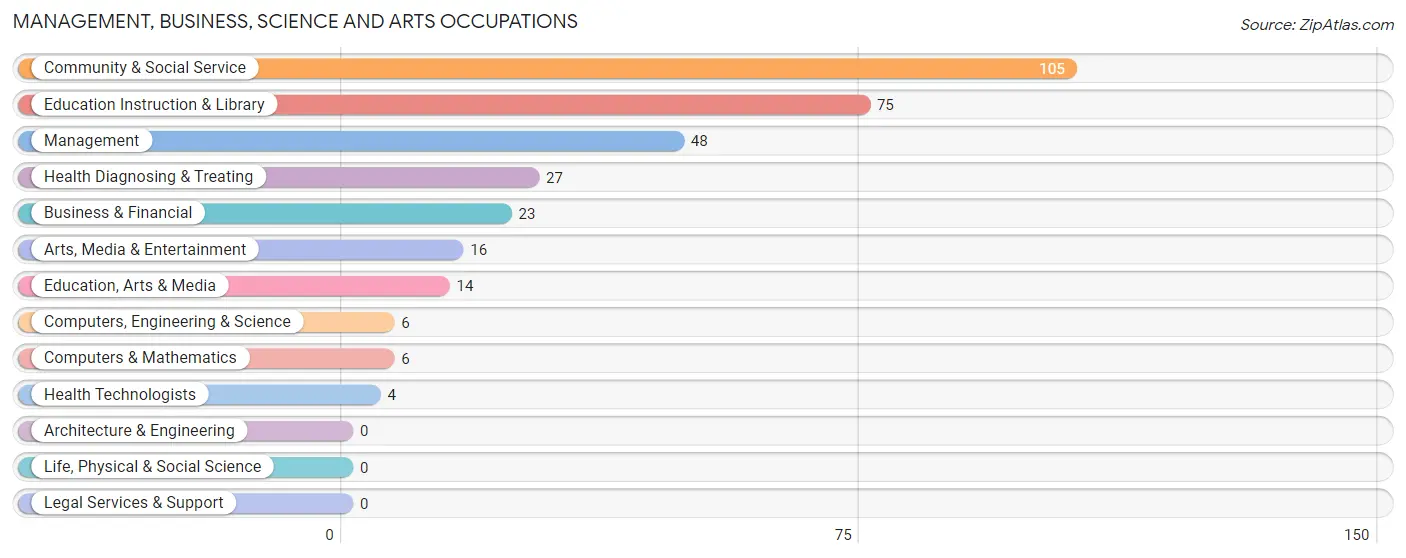
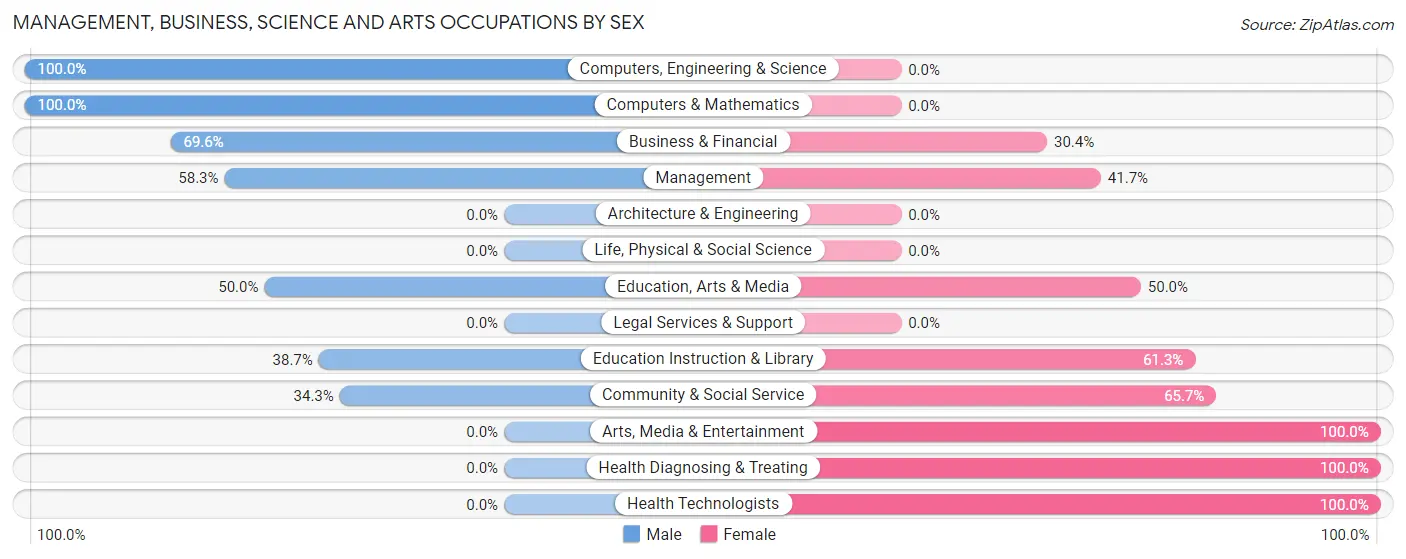
Management, Business, Science and Arts Occupations
The most common Management, Business, Science and Arts occupations in Versailles are Community & Social Service (105 | 11.1%), Education Instruction & Library (75 | 7.9%), Management (48 | 5.1%), Health Diagnosing & Treating (27 | 2.9%), and Business & Financial (23 | 2.4%).
Management, Business, Science and Arts Occupations by Sex
Within the Management, Business, Science and Arts occupations in Versailles, the most male-oriented occupations are Computers, Engineering & Science (100.0%), Computers & Mathematics (100.0%), and Business & Financial (69.6%), while the most female-oriented occupations are Arts, Media & Entertainment (100.0%), Health Diagnosing & Treating (100.0%), and Health Technologists (100.0%).
| Occupation | Male | Female |
| Management | 28 (58.3%) | 20 (41.7%) |
| Business & Financial | 16 (69.6%) | 7 (30.4%) |
| Computers, Engineering & Science | 6 (100.0%) | 0 (0.0%) |
| Computers & Mathematics | 6 (100.0%) | 0 (0.0%) |
| Architecture & Engineering | 0 (0.0%) | 0 (0.0%) |
| Life, Physical & Social Science | 0 (0.0%) | 0 (0.0%) |
| Community & Social Service | 36 (34.3%) | 69 (65.7%) |
| Education, Arts & Media | 7 (50.0%) | 7 (50.0%) |
| Legal Services & Support | 0 (0.0%) | 0 (0.0%) |
| Education Instruction & Library | 29 (38.7%) | 46 (61.3%) |
| Arts, Media & Entertainment | 0 (0.0%) | 16 (100.0%) |
| Health Diagnosing & Treating | 0 (0.0%) | 27 (100.0%) |
| Health Technologists | 0 (0.0%) | 4 (100.0%) |
| Total (Category) | 86 (41.1%) | 123 (58.9%) |
| Total (Overall) | 463 (49.0%) | 482 (51.0%) |
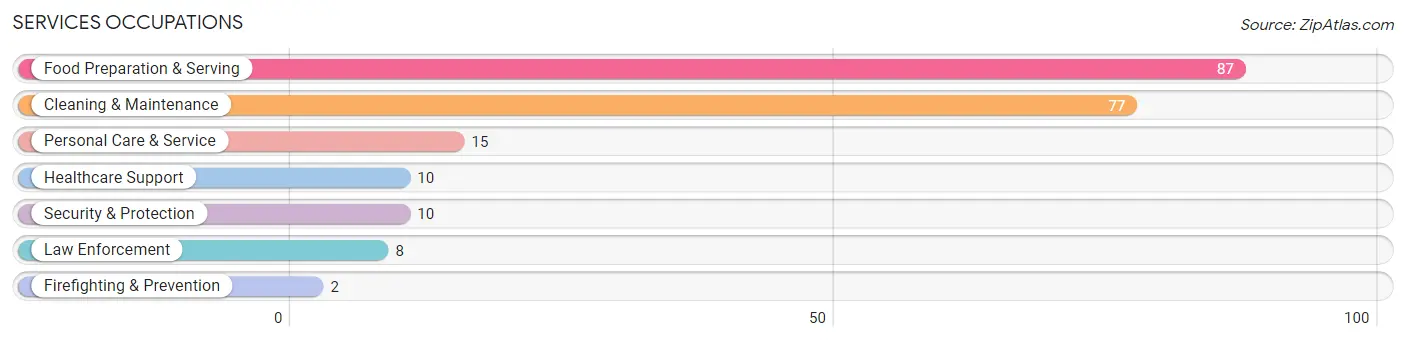
Services Occupations
The most common Services occupations in Versailles are Food Preparation & Serving (87 | 9.2%), Cleaning & Maintenance (77 | 8.2%), Personal Care & Service (15 | 1.6%), Healthcare Support (10 | 1.1%), and Security & Protection (10 | 1.1%).
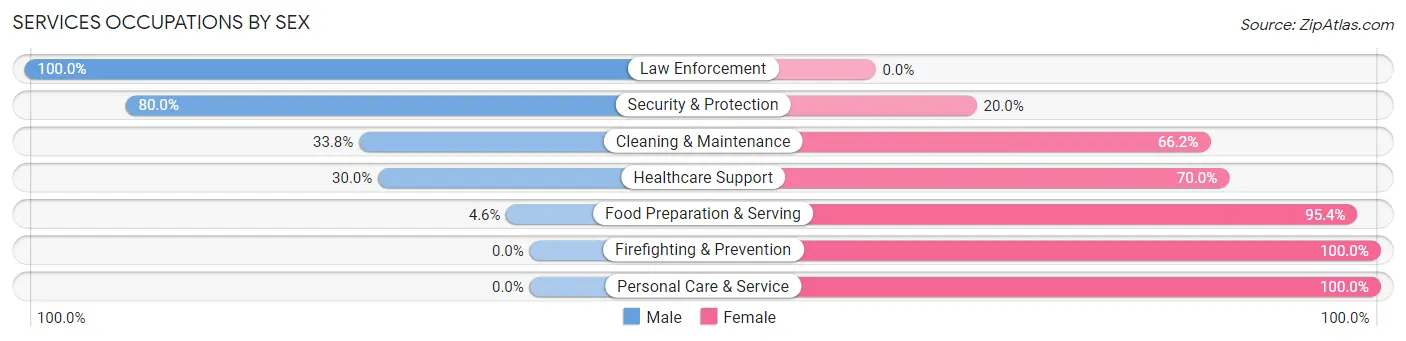
Services Occupations by Sex
Within the Services occupations in Versailles, the most male-oriented occupations are Law Enforcement (100.0%), Security & Protection (80.0%), and Cleaning & Maintenance (33.8%), while the most female-oriented occupations are Firefighting & Prevention (100.0%), Personal Care & Service (100.0%), and Food Preparation & Serving (95.4%).
| Occupation | Male | Female |
| Healthcare Support | 3 (30.0%) | 7 (70.0%) |
| Security & Protection | 8 (80.0%) | 2 (20.0%) |
| Firefighting & Prevention | 0 (0.0%) | 2 (100.0%) |
| Law Enforcement | 8 (100.0%) | 0 (0.0%) |
| Food Preparation & Serving | 4 (4.6%) | 83 (95.4%) |
| Cleaning & Maintenance | 26 (33.8%) | 51 (66.2%) |
| Personal Care & Service | 0 (0.0%) | 15 (100.0%) |
| Total (Category) | 41 (20.6%) | 158 (79.4%) |
| Total (Overall) | 463 (49.0%) | 482 (51.0%) |
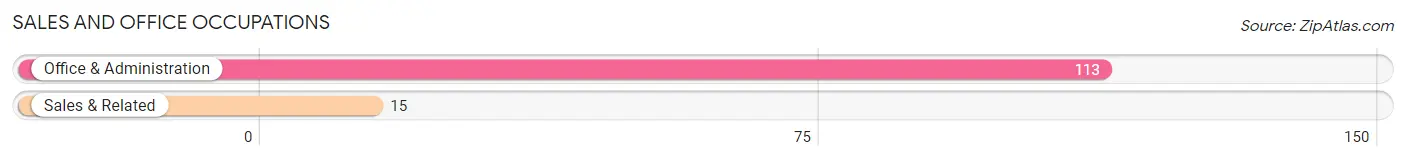
Sales and Office Occupations
The most common Sales and Office occupations in Versailles are Office & Administration (113 | 12.0%), and Sales & Related (15 | 1.6%).
Sales and Office Occupations by Sex
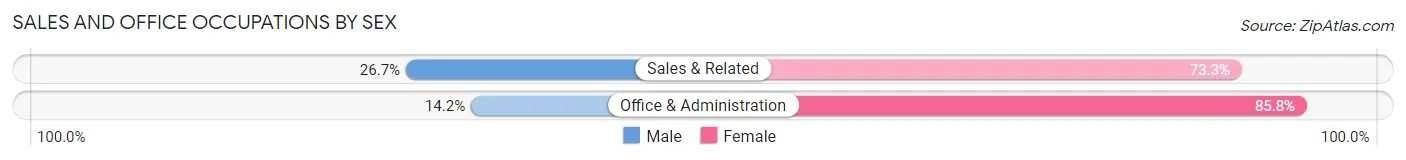
| Occupation | Male | Female |
| Sales & Related | 4 (26.7%) | 11 (73.3%) |
| Office & Administration | 16 (14.2%) | 97 (85.8%) |
| Total (Category) | 20 (15.6%) | 108 (84.4%) |
| Total (Overall) | 463 (49.0%) | 482 (51.0%) |
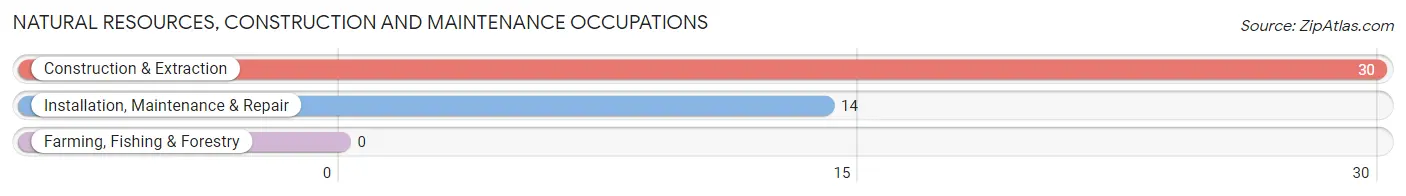
Natural Resources, Construction and Maintenance Occupations
The most common Natural Resources, Construction and Maintenance occupations in Versailles are Construction & Extraction (30 | 3.2%), and Installation, Maintenance & Repair (14 | 1.5%).
Natural Resources, Construction and Maintenance Occupations by Sex
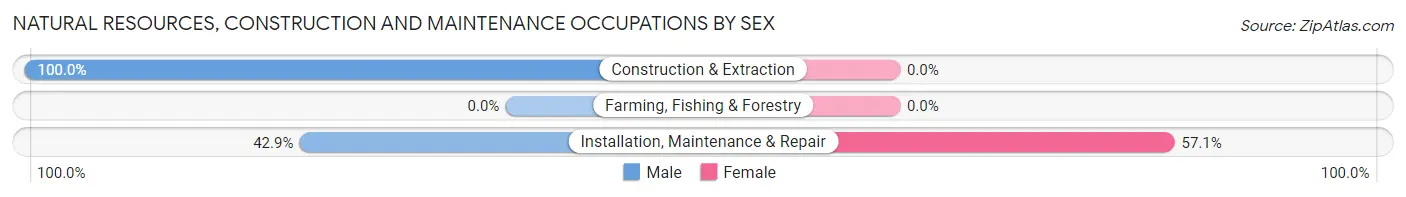
| Occupation | Male | Female |
| Farming, Fishing & Forestry | 0 (0.0%) | 0 (0.0%) |
| Construction & Extraction | 30 (100.0%) | 0 (0.0%) |
| Installation, Maintenance & Repair | 6 (42.9%) | 8 (57.1%) |
| Total (Category) | 36 (81.8%) | 8 (18.2%) |
| Total (Overall) | 463 (49.0%) | 482 (51.0%) |
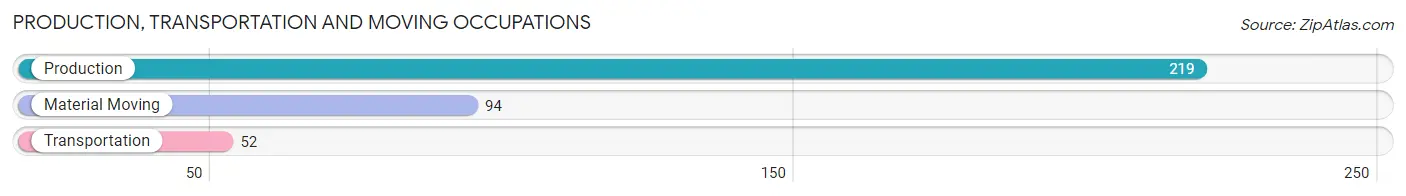
Production, Transportation and Moving Occupations
The most common Production, Transportation and Moving occupations in Versailles are Production (219 | 23.2%), Material Moving (94 | 10.0%), and Transportation (52 | 5.5%).
Production, Transportation and Moving Occupations by Sex
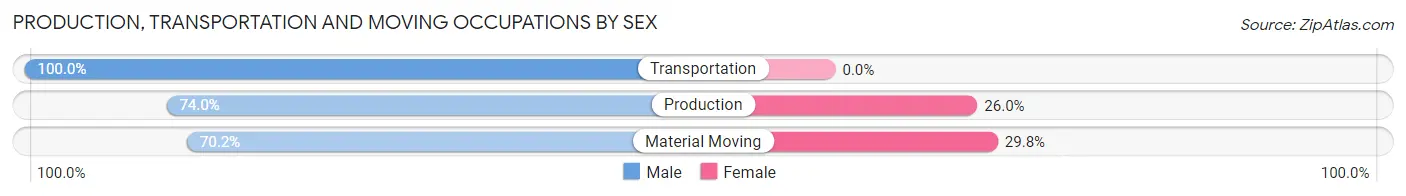
| Occupation | Male | Female |
| Production | 162 (74.0%) | 57 (26.0%) |
| Transportation | 52 (100.0%) | 0 (0.0%) |
| Material Moving | 66 (70.2%) | 28 (29.8%) |
| Total (Category) | 280 (76.7%) | 85 (23.3%) |
| Total (Overall) | 463 (49.0%) | 482 (51.0%) |
Employment Industries by Sex in Versailles
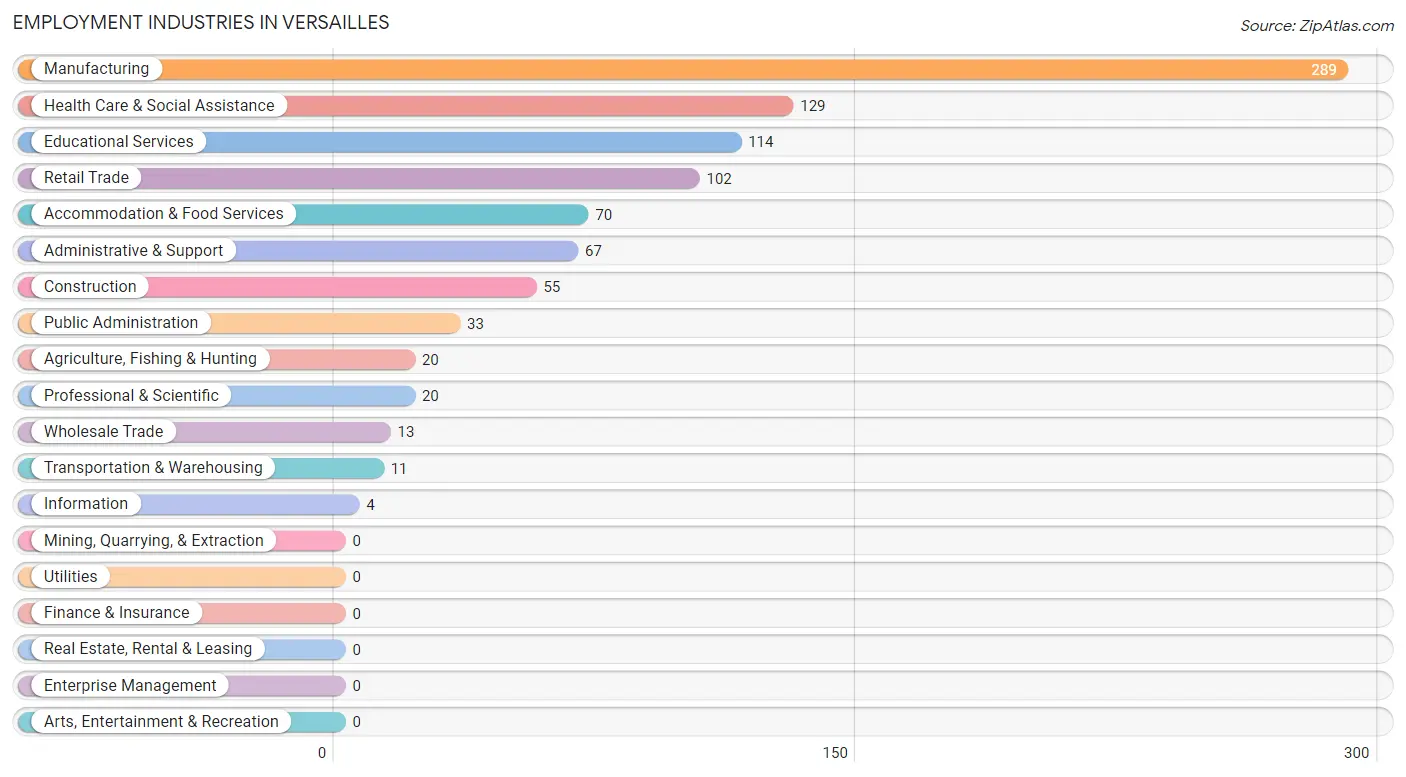
Employment Industries in Versailles
The major employment industries in Versailles include Manufacturing (289 | 30.6%), Health Care & Social Assistance (129 | 13.7%), Educational Services (114 | 12.1%), Retail Trade (102 | 10.8%), and Accommodation & Food Services (70 | 7.4%).
Employment Industries by Sex in Versailles
The Versailles industries that see more men than women are Agriculture, Fishing & Hunting (100.0%), Construction (100.0%), and Wholesale Trade (100.0%), whereas the industries that tend to have a higher number of women are Professional & Scientific (100.0%), Accommodation & Food Services (100.0%), and Retail Trade (70.6%).
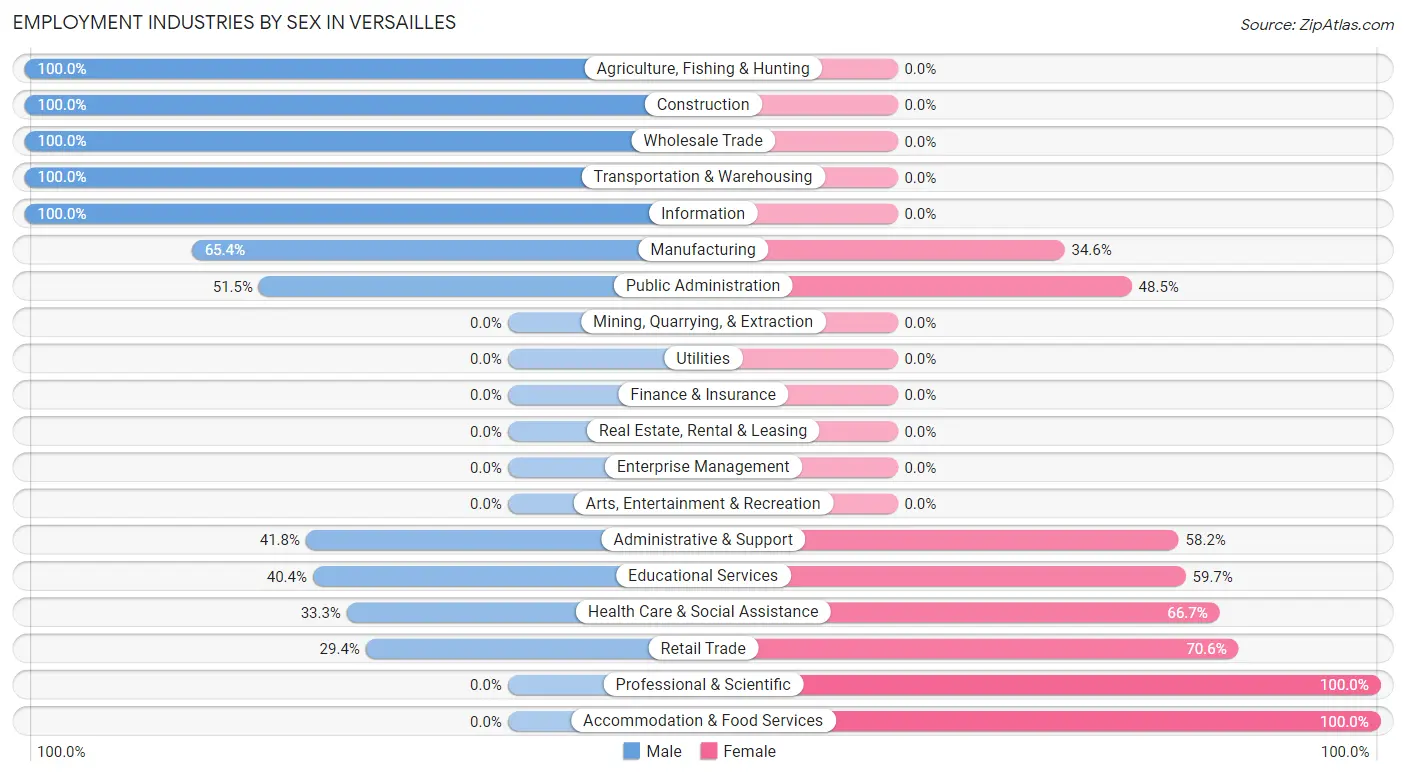
| Industry | Male | Female |
| Agriculture, Fishing & Hunting | 20 (100.0%) | 0 (0.0%) |
| Mining, Quarrying, & Extraction | 0 (0.0%) | 0 (0.0%) |
| Construction | 55 (100.0%) | 0 (0.0%) |
| Manufacturing | 189 (65.4%) | 100 (34.6%) |
| Wholesale Trade | 13 (100.0%) | 0 (0.0%) |
| Retail Trade | 30 (29.4%) | 72 (70.6%) |
| Transportation & Warehousing | 11 (100.0%) | 0 (0.0%) |
| Utilities | 0 (0.0%) | 0 (0.0%) |
| Information | 4 (100.0%) | 0 (0.0%) |
| Finance & Insurance | 0 (0.0%) | 0 (0.0%) |
| Real Estate, Rental & Leasing | 0 (0.0%) | 0 (0.0%) |
| Professional & Scientific | 0 (0.0%) | 20 (100.0%) |
| Enterprise Management | 0 (0.0%) | 0 (0.0%) |
| Administrative & Support | 28 (41.8%) | 39 (58.2%) |
| Educational Services | 46 (40.4%) | 68 (59.7%) |
| Health Care & Social Assistance | 43 (33.3%) | 86 (66.7%) |
| Arts, Entertainment & Recreation | 0 (0.0%) | 0 (0.0%) |
| Accommodation & Food Services | 0 (0.0%) | 70 (100.0%) |
| Public Administration | 17 (51.5%) | 16 (48.5%) |
| Total | 463 (49.0%) | 482 (51.0%) |
Education in Versailles
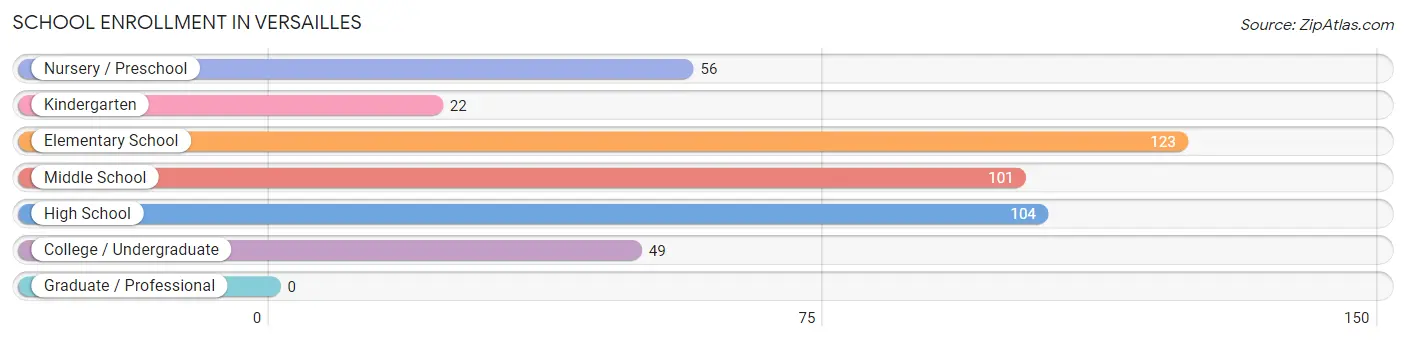
School Enrollment in Versailles
The most common levels of schooling among the 455 students in Versailles are elementary school (123 | 27.0%), high school (104 | 22.9%), and middle school (101 | 22.2%).
| School Level | # Students | % Students |
| Nursery / Preschool | 56 | 12.3% |
| Kindergarten | 22 | 4.8% |
| Elementary School | 123 | 27.0% |
| Middle School | 101 | 22.2% |
| High School | 104 | 22.9% |
| College / Undergraduate | 49 | 10.8% |
| Graduate / Professional | 0 | 0.0% |
| Total | 455 | 100.0% |
School Enrollment by Age by Funding Source in Versailles
Out of a total of 455 students who are enrolled in schools in Versailles, 41 (9.0%) attend a private institution, while the remaining 414 (91.0%) are enrolled in public schools. The age group of 20 to 24 year olds has the highest likelihood of being enrolled in private schools, with 10 (100.0% in the age bracket) enrolled. Conversely, the age group of 3 to 4 year olds has the lowest likelihood of being enrolled in a private school, with 56 (100.0% in the age bracket) attending a public institution.
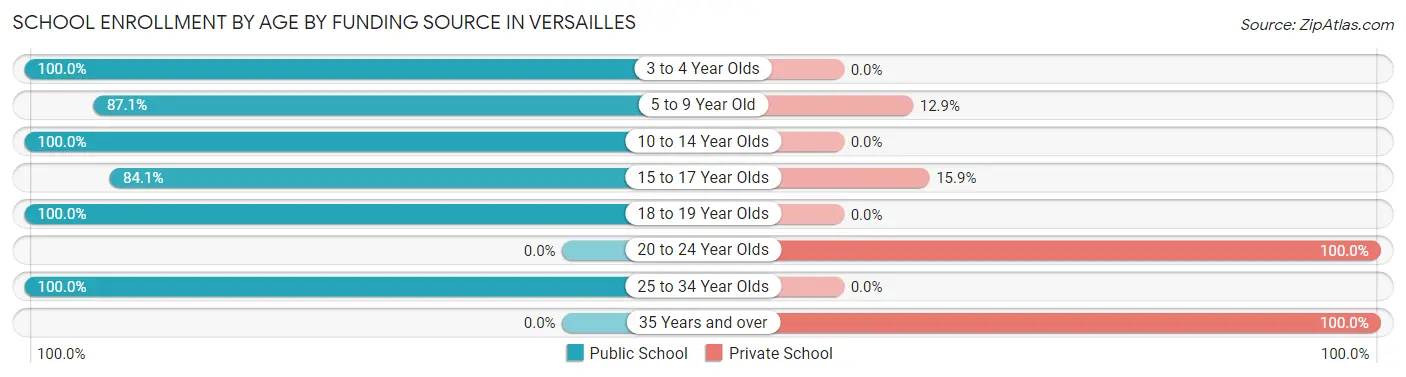
| Age Bracket | Public School | Private School |
| 3 to 4 Year Olds | 56 (100.0%) | 0 (0.0%) |
| 5 to 9 Year Old | 115 (87.1%) | 17 (12.9%) |
| 10 to 14 Year Olds | 136 (100.0%) | 0 (0.0%) |
| 15 to 17 Year Olds | 58 (84.1%) | 11 (15.9%) |
| 18 to 19 Year Olds | 40 (100.0%) | 0 (0.0%) |
| 20 to 24 Year Olds | 0 (0.0%) | 10 (100.0%) |
| 25 to 34 Year Olds | 9 (100.0%) | 0 (0.0%) |
| 35 Years and over | 0 (0.0%) | 3 (100.0%) |
| Total | 414 (91.0%) | 41 (9.0%) |
Educational Attainment by Field of Study in Versailles
Education (89 | 38.9%), science & technology (32 | 14.0%), liberal arts & history (25 | 10.9%), business (24 | 10.5%), and arts & humanities (23 | 10.0%) are the most common fields of study among 229 individuals in Versailles who have obtained a bachelor's degree or higher.
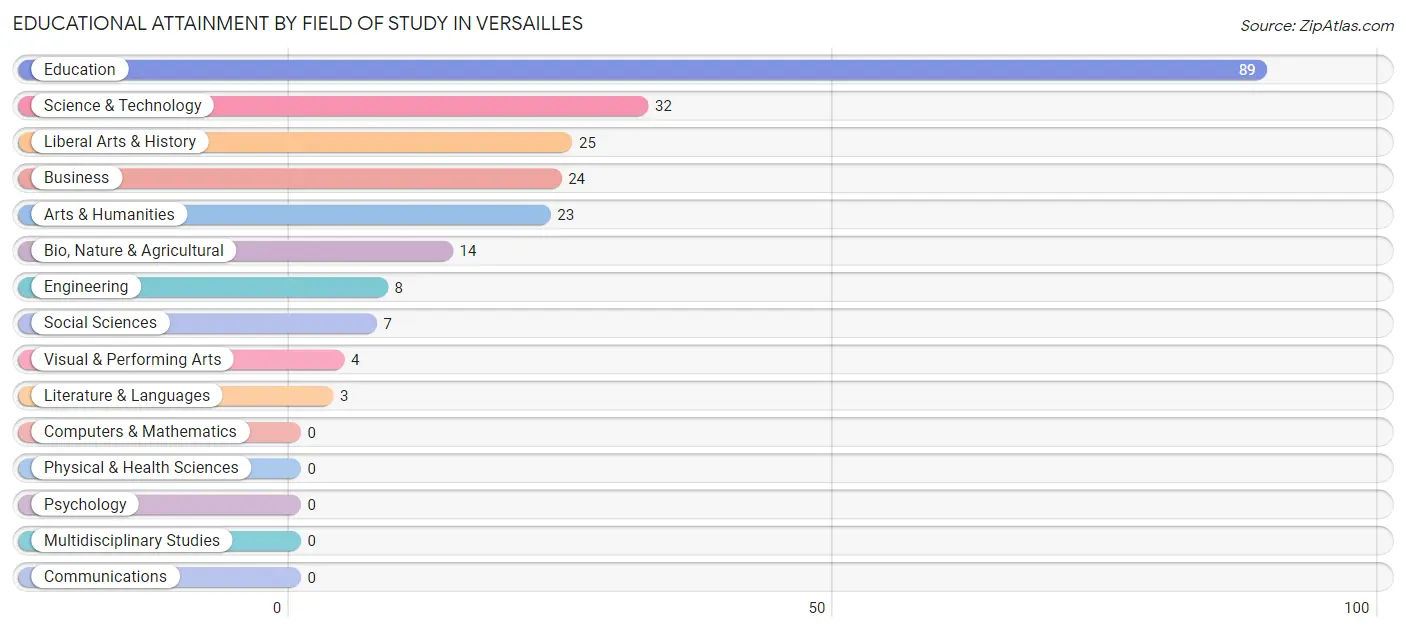
| Field of Study | # Graduates | % Graduates |
| Computers & Mathematics | 0 | 0.0% |
| Bio, Nature & Agricultural | 14 | 6.1% |
| Physical & Health Sciences | 0 | 0.0% |
| Psychology | 0 | 0.0% |
| Social Sciences | 7 | 3.1% |
| Engineering | 8 | 3.5% |
| Multidisciplinary Studies | 0 | 0.0% |
| Science & Technology | 32 | 14.0% |
| Business | 24 | 10.5% |
| Education | 89 | 38.9% |
| Literature & Languages | 3 | 1.3% |
| Liberal Arts & History | 25 | 10.9% |
| Visual & Performing Arts | 4 | 1.8% |
| Communications | 0 | 0.0% |
| Arts & Humanities | 23 | 10.0% |
| Total | 229 | 100.0% |
Transportation & Commute in Versailles
Vehicle Availability by Sex in Versailles
The most prevalent vehicle ownership categories in Versailles are males with 2 vehicles (247, accounting for 54.2%) and females with 2 vehicles (197, making up 51.2%).
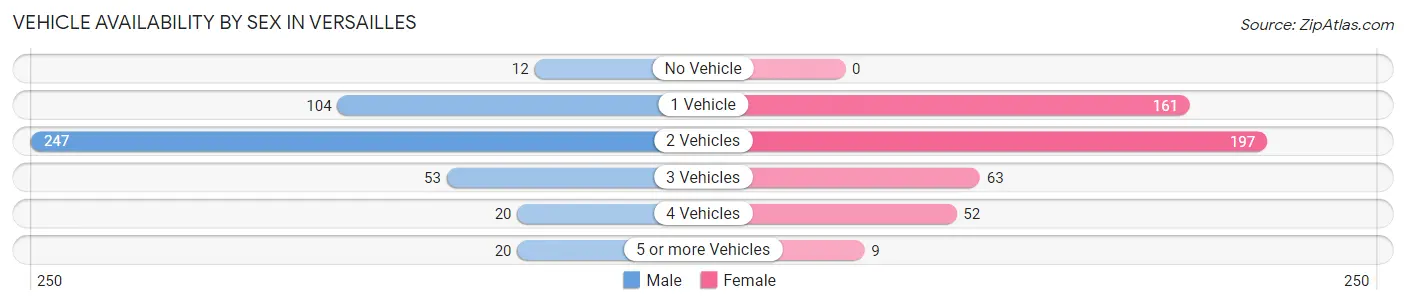
| Vehicles Available | Male | Female |
| No Vehicle | 12 (2.6%) | 0 (0.0%) |
| 1 Vehicle | 104 (22.8%) | 161 (33.4%) |
| 2 Vehicles | 247 (54.2%) | 197 (40.9%) |
| 3 Vehicles | 53 (11.6%) | 63 (13.1%) |
| 4 Vehicles | 20 (4.4%) | 52 (10.8%) |
| 5 or more Vehicles | 20 (4.4%) | 9 (1.9%) |
| Total | 456 (100.0%) | 482 (100.0%) |
Commute Time in Versailles
The most frequently occuring commute durations in Versailles are 5 to 9 minutes (423 commuters, 46.8%), 10 to 14 minutes (116 commuters, 12.8%), and less than 5 minutes (111 commuters, 12.3%).
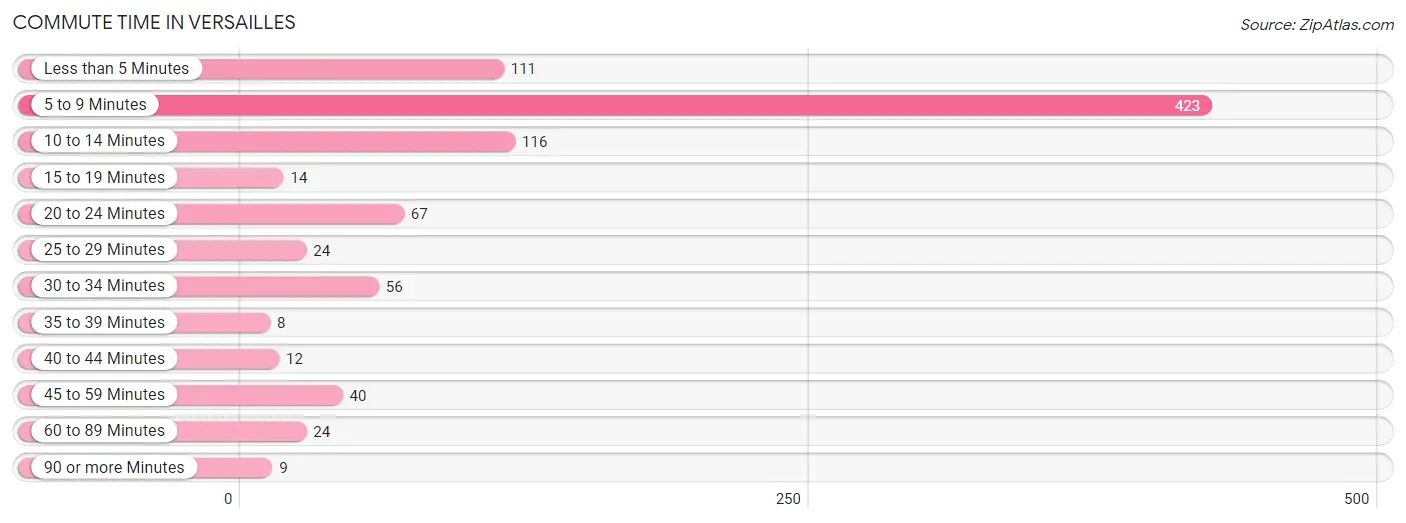
| Commute Time | # Commuters | % Commuters |
| Less than 5 Minutes | 111 | 12.3% |
| 5 to 9 Minutes | 423 | 46.8% |
| 10 to 14 Minutes | 116 | 12.8% |
| 15 to 19 Minutes | 14 | 1.5% |
| 20 to 24 Minutes | 67 | 7.4% |
| 25 to 29 Minutes | 24 | 2.6% |
| 30 to 34 Minutes | 56 | 6.2% |
| 35 to 39 Minutes | 8 | 0.9% |
| 40 to 44 Minutes | 12 | 1.3% |
| 45 to 59 Minutes | 40 | 4.4% |
| 60 to 89 Minutes | 24 | 2.6% |
| 90 or more Minutes | 9 | 1.0% |
Commute Time by Sex in Versailles
The most common commute times in Versailles are 5 to 9 minutes (218 commuters, 49.4%) for males and 5 to 9 minutes (205 commuters, 44.3%) for females.
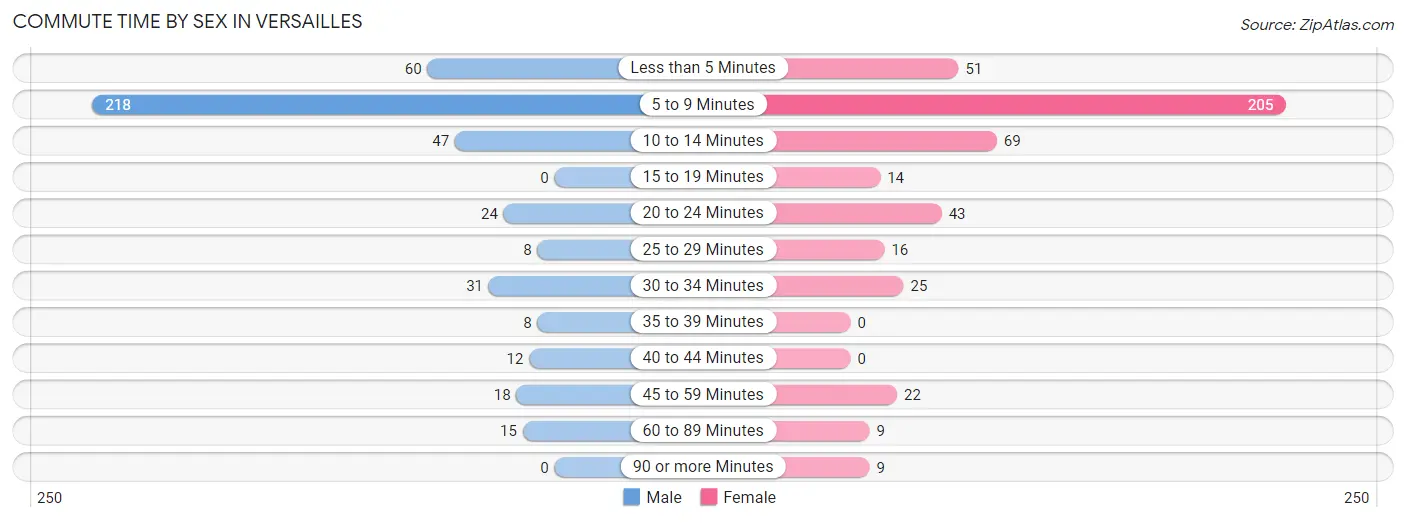
| Commute Time | Male | Female |
| Less than 5 Minutes | 60 (13.6%) | 51 (11.0%) |
| 5 to 9 Minutes | 218 (49.4%) | 205 (44.3%) |
| 10 to 14 Minutes | 47 (10.7%) | 69 (14.9%) |
| 15 to 19 Minutes | 0 (0.0%) | 14 (3.0%) |
| 20 to 24 Minutes | 24 (5.4%) | 43 (9.3%) |
| 25 to 29 Minutes | 8 (1.8%) | 16 (3.5%) |
| 30 to 34 Minutes | 31 (7.0%) | 25 (5.4%) |
| 35 to 39 Minutes | 8 (1.8%) | 0 (0.0%) |
| 40 to 44 Minutes | 12 (2.7%) | 0 (0.0%) |
| 45 to 59 Minutes | 18 (4.1%) | 22 (4.8%) |
| 60 to 89 Minutes | 15 (3.4%) | 9 (1.9%) |
| 90 or more Minutes | 0 (0.0%) | 9 (1.9%) |
Time of Departure to Work by Sex in Versailles
The most frequent times of departure to work in Versailles are 4:00 PM to 11:59 PM (101, 22.9%) for males and 7:30 AM to 7:59 AM (118, 25.5%) for females.
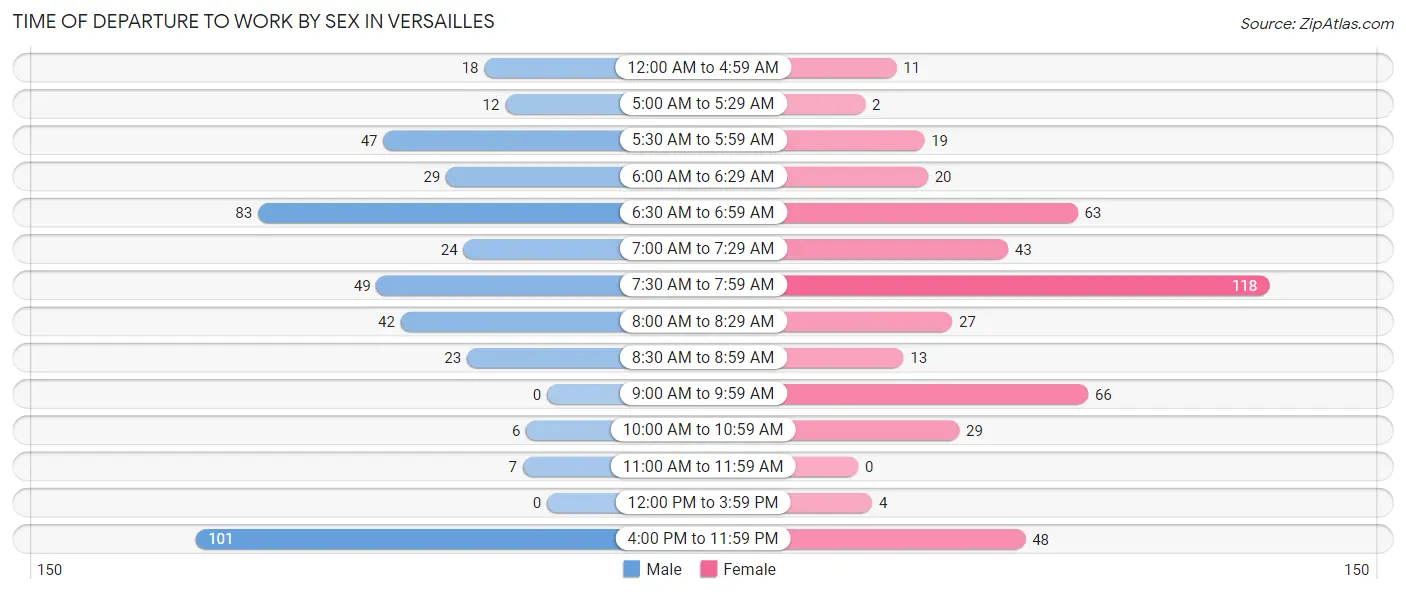
| Time of Departure | Male | Female |
| 12:00 AM to 4:59 AM | 18 (4.1%) | 11 (2.4%) |
| 5:00 AM to 5:29 AM | 12 (2.7%) | 2 (0.4%) |
| 5:30 AM to 5:59 AM | 47 (10.7%) | 19 (4.1%) |
| 6:00 AM to 6:29 AM | 29 (6.6%) | 20 (4.3%) |
| 6:30 AM to 6:59 AM | 83 (18.8%) | 63 (13.6%) |
| 7:00 AM to 7:29 AM | 24 (5.4%) | 43 (9.3%) |
| 7:30 AM to 7:59 AM | 49 (11.1%) | 118 (25.5%) |
| 8:00 AM to 8:29 AM | 42 (9.5%) | 27 (5.8%) |
| 8:30 AM to 8:59 AM | 23 (5.2%) | 13 (2.8%) |
| 9:00 AM to 9:59 AM | 0 (0.0%) | 66 (14.2%) |
| 10:00 AM to 10:59 AM | 6 (1.4%) | 29 (6.3%) |
| 11:00 AM to 11:59 AM | 7 (1.6%) | 0 (0.0%) |
| 12:00 PM to 3:59 PM | 0 (0.0%) | 4 (0.9%) |
| 4:00 PM to 11:59 PM | 101 (22.9%) | 48 (10.4%) |
| Total | 441 (100.0%) | 463 (100.0%) |
Housing Occupancy in Versailles
Occupancy by Ownership in Versailles
Of the total 1,070 dwellings in Versailles, owner-occupied units account for 583 (54.5%), while renter-occupied units make up 487 (45.5%).
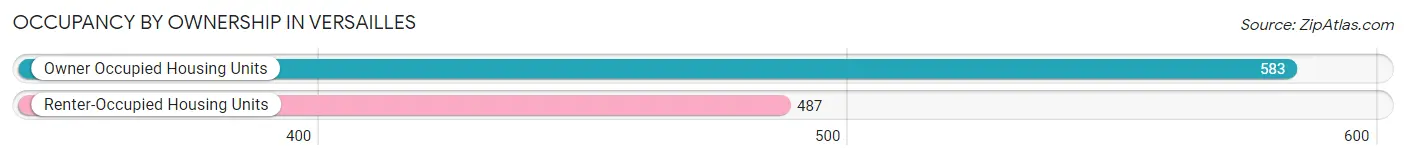
| Occupancy | # Housing Units | % Housing Units |
| Owner Occupied Housing Units | 583 | 54.5% |
| Renter-Occupied Housing Units | 487 | 45.5% |
| Total Occupied Housing Units | 1,070 | 100.0% |
Occupancy by Household Size in Versailles
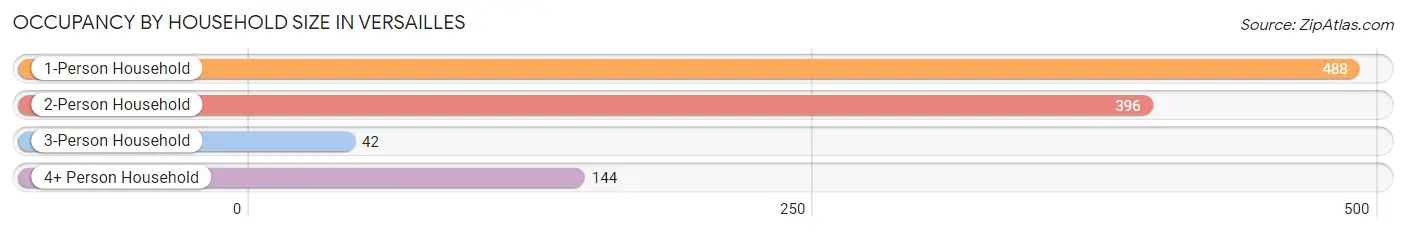
| Household Size | # Housing Units | % Housing Units |
| 1-Person Household | 488 | 45.6% |
| 2-Person Household | 396 | 37.0% |
| 3-Person Household | 42 | 3.9% |
| 4+ Person Household | 144 | 13.5% |
| Total Housing Units | 1,070 | 100.0% |
Occupancy by Ownership by Household Size in Versailles
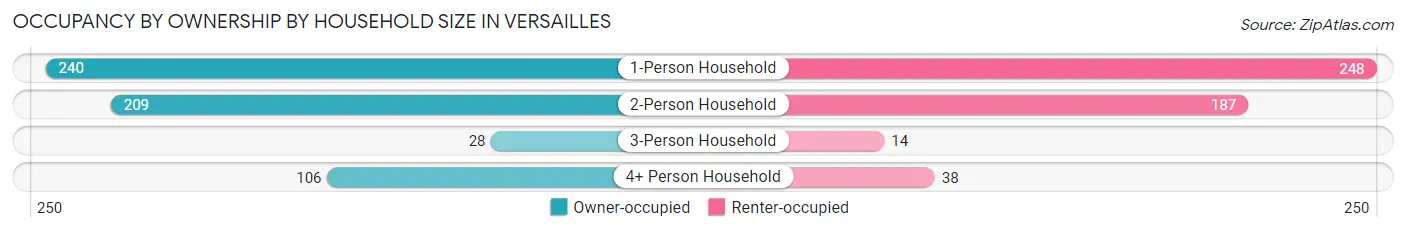
| Household Size | Owner-occupied | Renter-occupied |
| 1-Person Household | 240 (49.2%) | 248 (50.8%) |
| 2-Person Household | 209 (52.8%) | 187 (47.2%) |
| 3-Person Household | 28 (66.7%) | 14 (33.3%) |
| 4+ Person Household | 106 (73.6%) | 38 (26.4%) |
| Total Housing Units | 583 (54.5%) | 487 (45.5%) |
Occupancy by Educational Attainment in Versailles
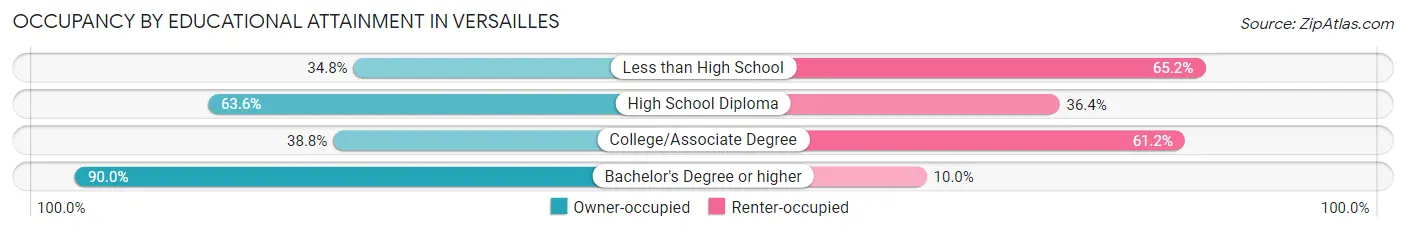
| Household Size | Owner-occupied | Renter-occupied |
| Less than High School | 47 (34.8%) | 88 (65.2%) |
| High School Diploma | 273 (63.6%) | 156 (36.4%) |
| College/Associate Degree | 146 (38.8%) | 230 (61.2%) |
| Bachelor's Degree or higher | 117 (90.0%) | 13 (10.0%) |
Occupancy by Age of Householder in Versailles
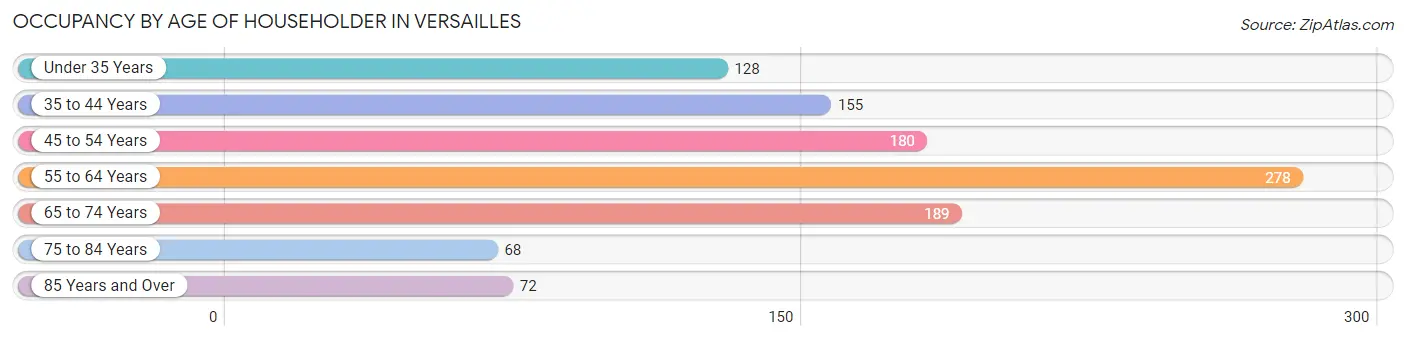
| Age Bracket | # Households | % Households |
| Under 35 Years | 128 | 12.0% |
| 35 to 44 Years | 155 | 14.5% |
| 45 to 54 Years | 180 | 16.8% |
| 55 to 64 Years | 278 | 26.0% |
| 65 to 74 Years | 189 | 17.7% |
| 75 to 84 Years | 68 | 6.4% |
| 85 Years and Over | 72 | 6.7% |
| Total | 1,070 | 100.0% |
Housing Finances in Versailles
Median Income by Occupancy in Versailles
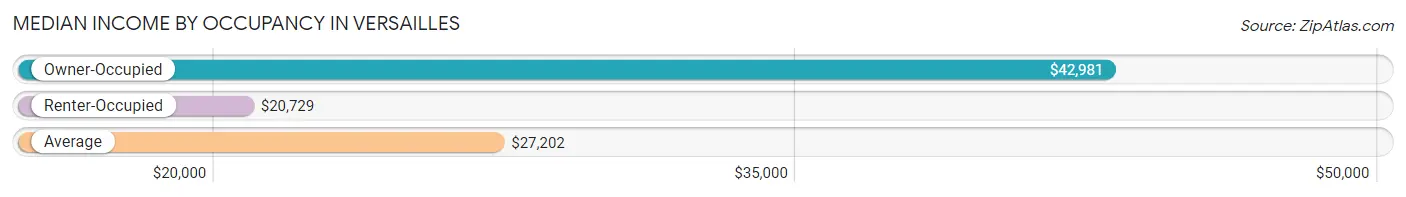
| Occupancy Type | # Households | Median Income |
| Owner-Occupied | 583 (54.5%) | $42,981 |
| Renter-Occupied | 487 (45.5%) | $20,729 |
| Average | 1,070 (100.0%) | $27,202 |
Occupancy by Householder Income Bracket in Versailles
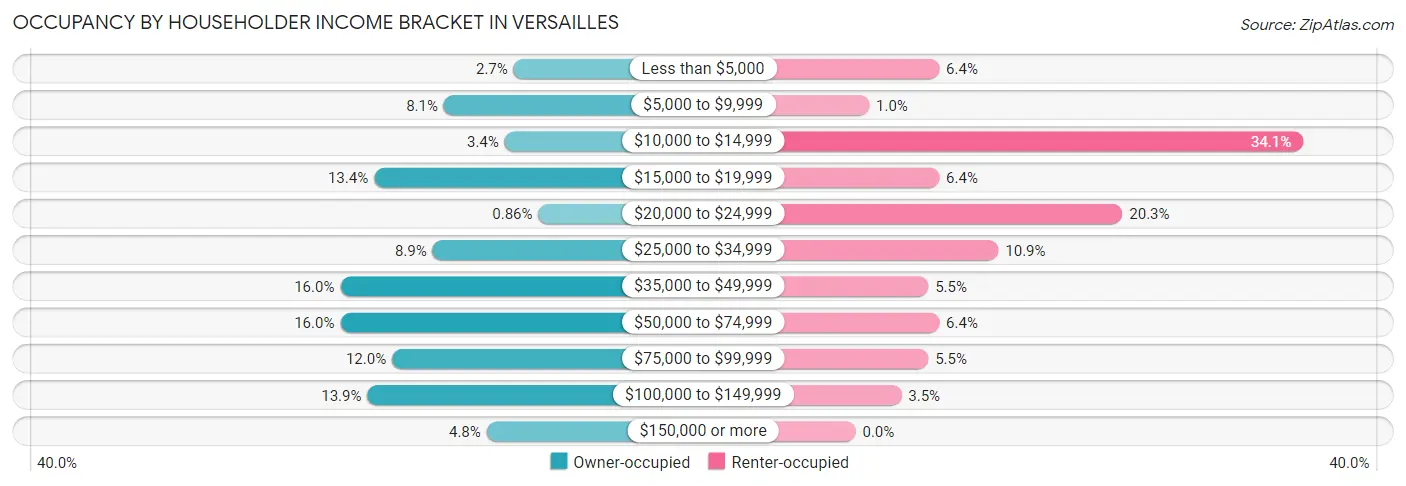
| Income Bracket | Owner-occupied | Renter-occupied |
| Less than $5,000 | 16 (2.7%) | 31 (6.4%) |
| $5,000 to $9,999 | 47 (8.1%) | 5 (1.0%) |
| $10,000 to $14,999 | 20 (3.4%) | 166 (34.1%) |
| $15,000 to $19,999 | 78 (13.4%) | 31 (6.4%) |
| $20,000 to $24,999 | 5 (0.9%) | 99 (20.3%) |
| $25,000 to $34,999 | 52 (8.9%) | 53 (10.9%) |
| $35,000 to $49,999 | 93 (16.0%) | 27 (5.5%) |
| $50,000 to $74,999 | 93 (16.0%) | 31 (6.4%) |
| $75,000 to $99,999 | 70 (12.0%) | 27 (5.5%) |
| $100,000 to $149,999 | 81 (13.9%) | 17 (3.5%) |
| $150,000 or more | 28 (4.8%) | 0 (0.0%) |
| Total | 583 (100.0%) | 487 (100.0%) |
Monthly Housing Cost Tiers in Versailles
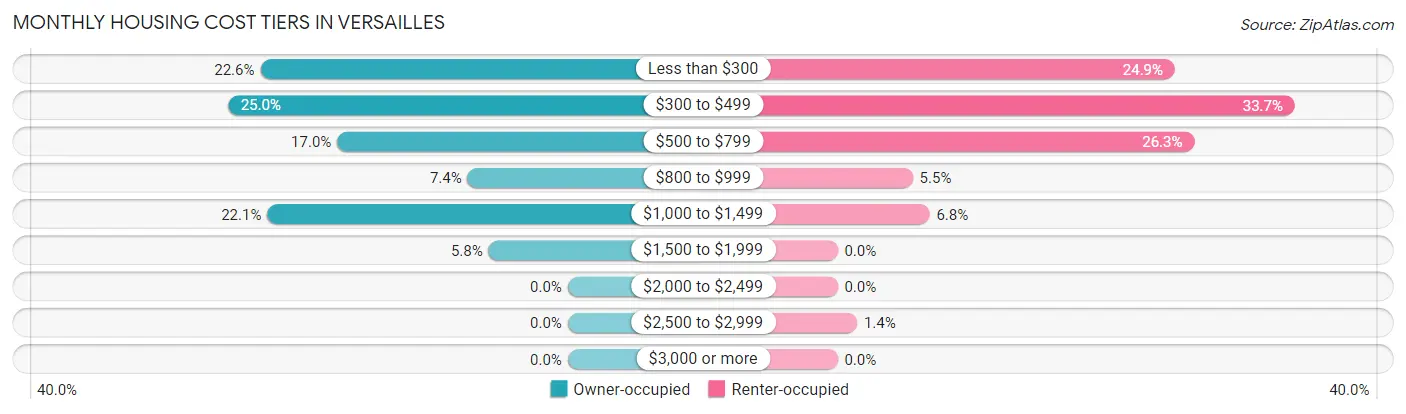
| Monthly Cost | Owner-occupied | Renter-occupied |
| Less than $300 | 132 (22.6%) | 121 (24.8%) |
| $300 to $499 | 146 (25.0%) | 164 (33.7%) |
| $500 to $799 | 99 (17.0%) | 128 (26.3%) |
| $800 to $999 | 43 (7.4%) | 27 (5.5%) |
| $1,000 to $1,499 | 129 (22.1%) | 33 (6.8%) |
| $1,500 to $1,999 | 34 (5.8%) | 0 (0.0%) |
| $2,000 to $2,499 | 0 (0.0%) | 0 (0.0%) |
| $2,500 to $2,999 | 0 (0.0%) | 7 (1.4%) |
| $3,000 or more | 0 (0.0%) | 0 (0.0%) |
| Total | 583 (100.0%) | 487 (100.0%) |
Physical Housing Characteristics in Versailles
Housing Structures in Versailles
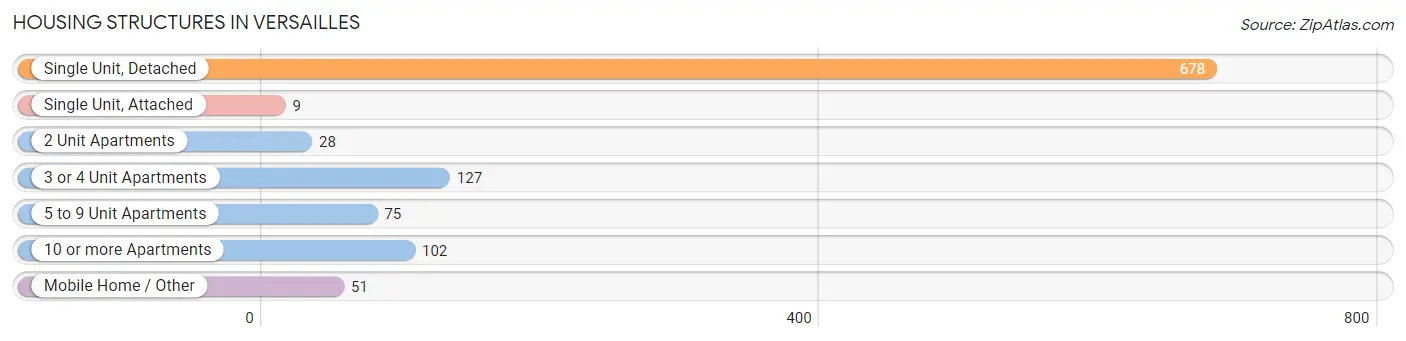
| Structure Type | # Housing Units | % Housing Units |
| Single Unit, Detached | 678 | 63.4% |
| Single Unit, Attached | 9 | 0.8% |
| 2 Unit Apartments | 28 | 2.6% |
| 3 or 4 Unit Apartments | 127 | 11.9% |
| 5 to 9 Unit Apartments | 75 | 7.0% |
| 10 or more Apartments | 102 | 9.5% |
| Mobile Home / Other | 51 | 4.8% |
| Total | 1,070 | 100.0% |
Housing Structures by Occupancy in Versailles
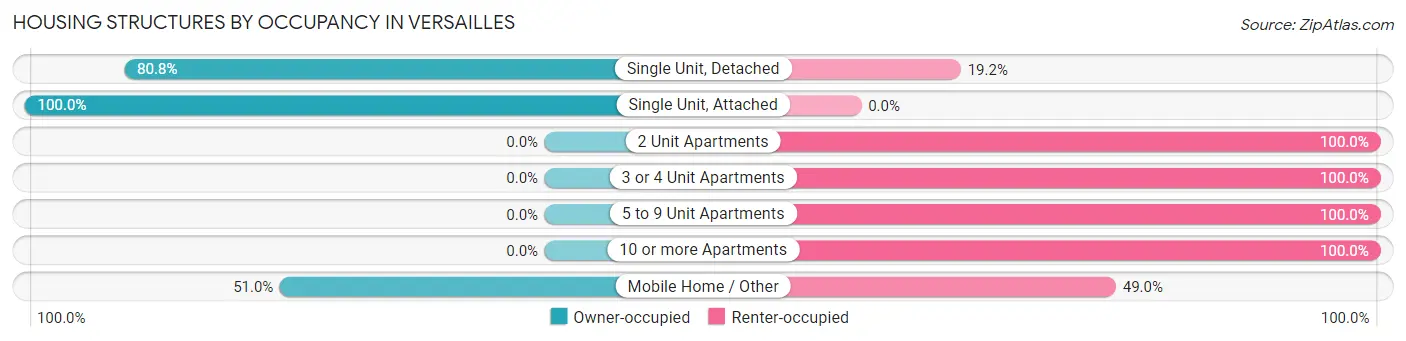
| Structure Type | Owner-occupied | Renter-occupied |
| Single Unit, Detached | 548 (80.8%) | 130 (19.2%) |
| Single Unit, Attached | 9 (100.0%) | 0 (0.0%) |
| 2 Unit Apartments | 0 (0.0%) | 28 (100.0%) |
| 3 or 4 Unit Apartments | 0 (0.0%) | 127 (100.0%) |
| 5 to 9 Unit Apartments | 0 (0.0%) | 75 (100.0%) |
| 10 or more Apartments | 0 (0.0%) | 102 (100.0%) |
| Mobile Home / Other | 26 (51.0%) | 25 (49.0%) |
| Total | 583 (54.5%) | 487 (45.5%) |
Housing Structures by Number of Rooms in Versailles
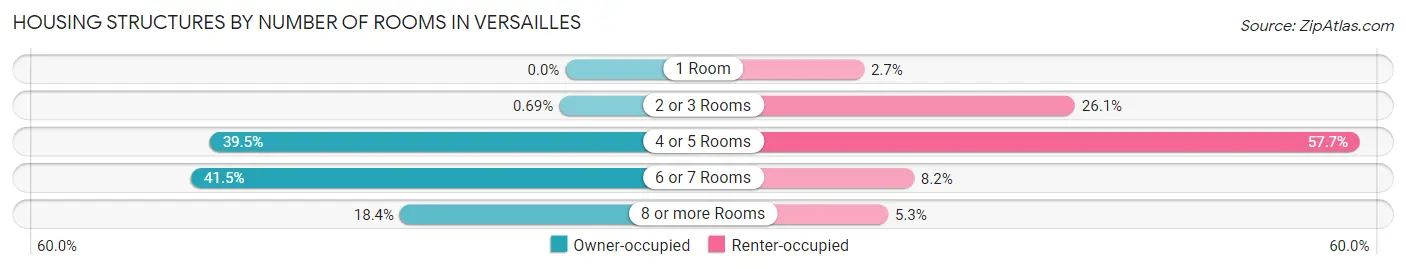
| Number of Rooms | Owner-occupied | Renter-occupied |
| 1 Room | 0 (0.0%) | 13 (2.7%) |
| 2 or 3 Rooms | 4 (0.7%) | 127 (26.1%) |
| 4 or 5 Rooms | 230 (39.5%) | 281 (57.7%) |
| 6 or 7 Rooms | 242 (41.5%) | 40 (8.2%) |
| 8 or more Rooms | 107 (18.3%) | 26 (5.3%) |
| Total | 583 (100.0%) | 487 (100.0%) |
Housing Structure by Heating Type in Versailles
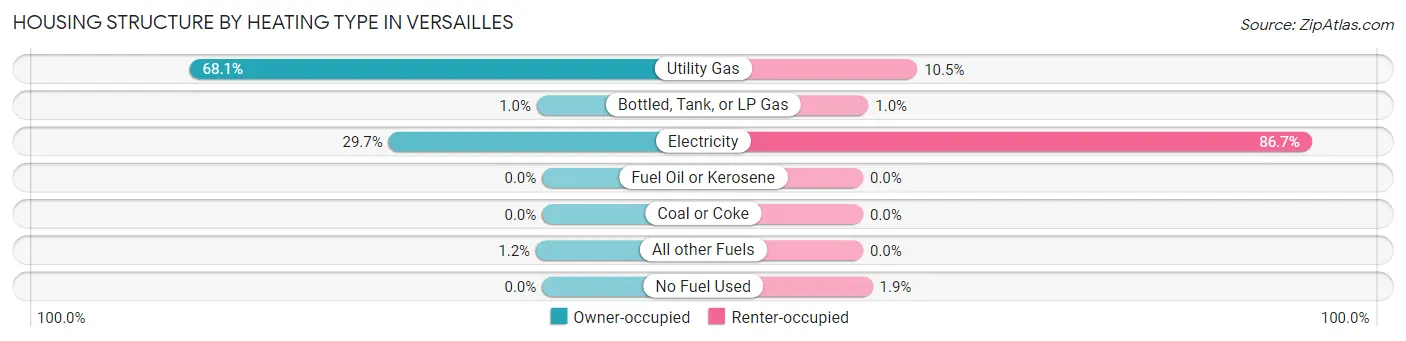
| Heating Type | Owner-occupied | Renter-occupied |
| Utility Gas | 397 (68.1%) | 51 (10.5%) |
| Bottled, Tank, or LP Gas | 6 (1.0%) | 5 (1.0%) |
| Electricity | 173 (29.7%) | 422 (86.7%) |
| Fuel Oil or Kerosene | 0 (0.0%) | 0 (0.0%) |
| Coal or Coke | 0 (0.0%) | 0 (0.0%) |
| All other Fuels | 7 (1.2%) | 0 (0.0%) |
| No Fuel Used | 0 (0.0%) | 9 (1.8%) |
| Total | 583 (100.0%) | 487 (100.0%) |
Household Vehicle Usage in Versailles
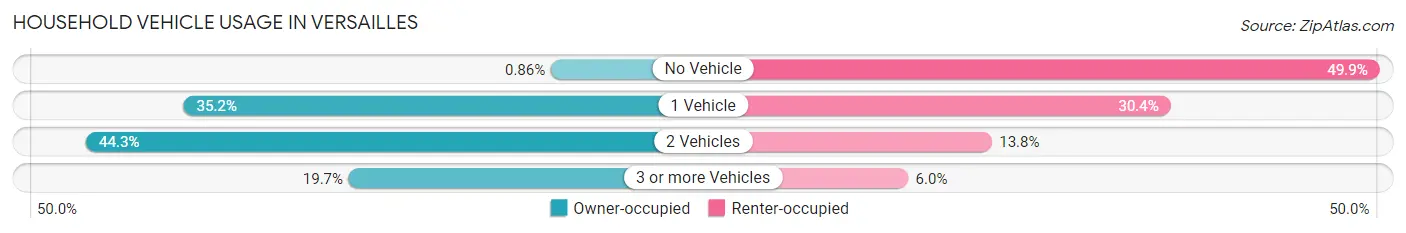
| Vehicles per Household | Owner-occupied | Renter-occupied |
| No Vehicle | 5 (0.9%) | 243 (49.9%) |
| 1 Vehicle | 205 (35.2%) | 148 (30.4%) |
| 2 Vehicles | 258 (44.3%) | 67 (13.8%) |
| 3 or more Vehicles | 115 (19.7%) | 29 (5.9%) |
| Total | 583 (100.0%) | 487 (100.0%) |
Real Estate & Mortgages in Versailles
Real Estate and Mortgage Overview in Versailles
| Characteristic | Without Mortgage | With Mortgage |
| Housing Units | 310 | 273 |
| Median Property Value | $75,000 | $119,100 |
| Median Household Income | $40,000 | $0 |
| Monthly Housing Costs | $324 | $0 |
| Real Estate Taxes | $531 | $14 |
Property Value by Mortgage Status in Versailles
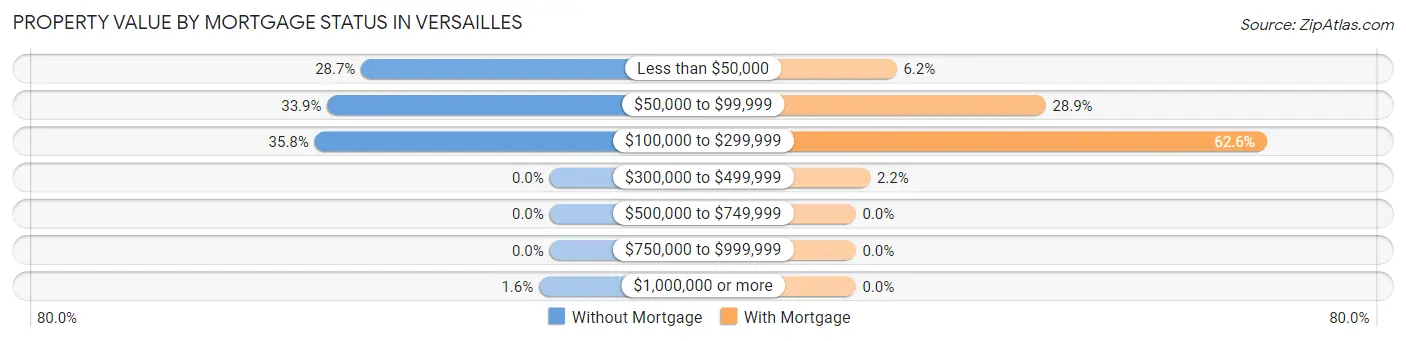
| Property Value | Without Mortgage | With Mortgage |
| Less than $50,000 | 89 (28.7%) | 17 (6.2%) |
| $50,000 to $99,999 | 105 (33.9%) | 79 (28.9%) |
| $100,000 to $299,999 | 111 (35.8%) | 171 (62.6%) |
| $300,000 to $499,999 | 0 (0.0%) | 6 (2.2%) |
| $500,000 to $749,999 | 0 (0.0%) | 0 (0.0%) |
| $750,000 to $999,999 | 0 (0.0%) | 0 (0.0%) |
| $1,000,000 or more | 5 (1.6%) | 0 (0.0%) |
| Total | 310 (100.0%) | 273 (100.0%) |
Household Income by Mortgage Status in Versailles
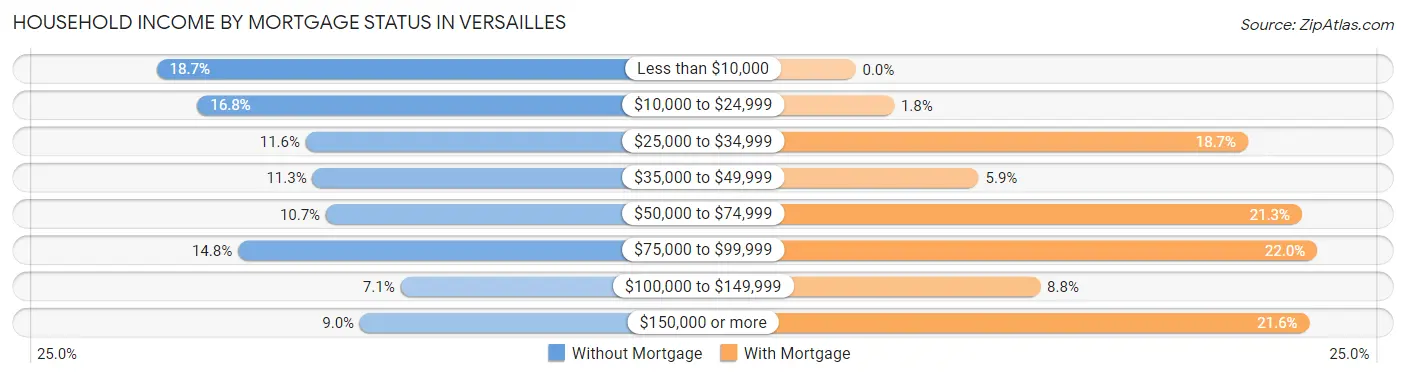
| Household Income | Without Mortgage | With Mortgage |
| Less than $10,000 | 58 (18.7%) | 0 (0.0%) |
| $10,000 to $24,999 | 52 (16.8%) | 5 (1.8%) |
| $25,000 to $34,999 | 36 (11.6%) | 51 (18.7%) |
| $35,000 to $49,999 | 35 (11.3%) | 16 (5.9%) |
| $50,000 to $74,999 | 33 (10.6%) | 58 (21.2%) |
| $75,000 to $99,999 | 46 (14.8%) | 60 (22.0%) |
| $100,000 to $149,999 | 22 (7.1%) | 24 (8.8%) |
| $150,000 or more | 28 (9.0%) | 59 (21.6%) |
| Total | 310 (100.0%) | 273 (100.0%) |
Property Value to Household Income Ratio in Versailles
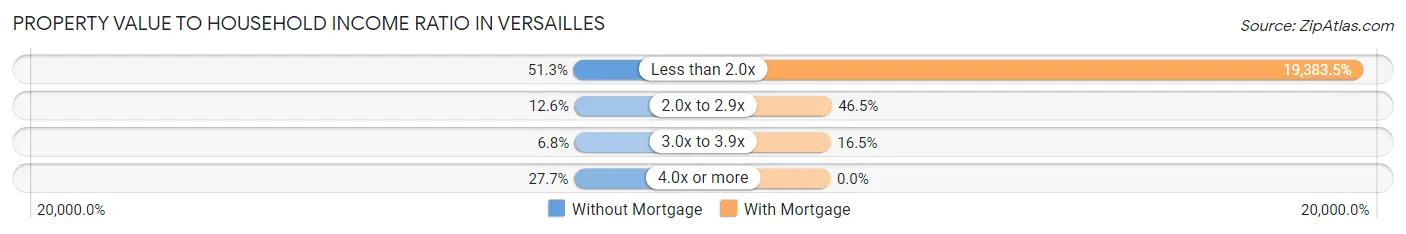
| Value-to-Income Ratio | Without Mortgage | With Mortgage |
| Less than 2.0x | 159 (51.3%) | 52,917 (19,383.5%) |
| 2.0x to 2.9x | 39 (12.6%) | 127 (46.5%) |
| 3.0x to 3.9x | 21 (6.8%) | 45 (16.5%) |
| 4.0x or more | 86 (27.7%) | 0 (0.0%) |
| Total | 310 (100.0%) | 273 (100.0%) |
Real Estate Taxes by Mortgage Status in Versailles
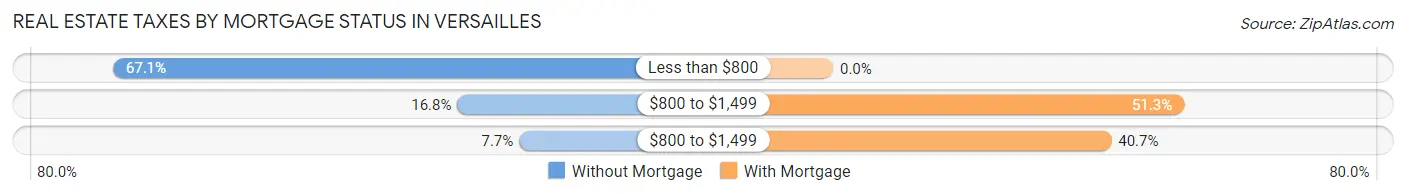
| Property Taxes | Without Mortgage | With Mortgage |
| Less than $800 | 208 (67.1%) | 0 (0.0%) |
| $800 to $1,499 | 52 (16.8%) | 140 (51.3%) |
| $800 to $1,499 | 24 (7.7%) | 111 (40.7%) |
| Total | 310 (100.0%) | 273 (100.0%) |
Health & Disability in Versailles
Health Insurance Coverage by Age in Versailles
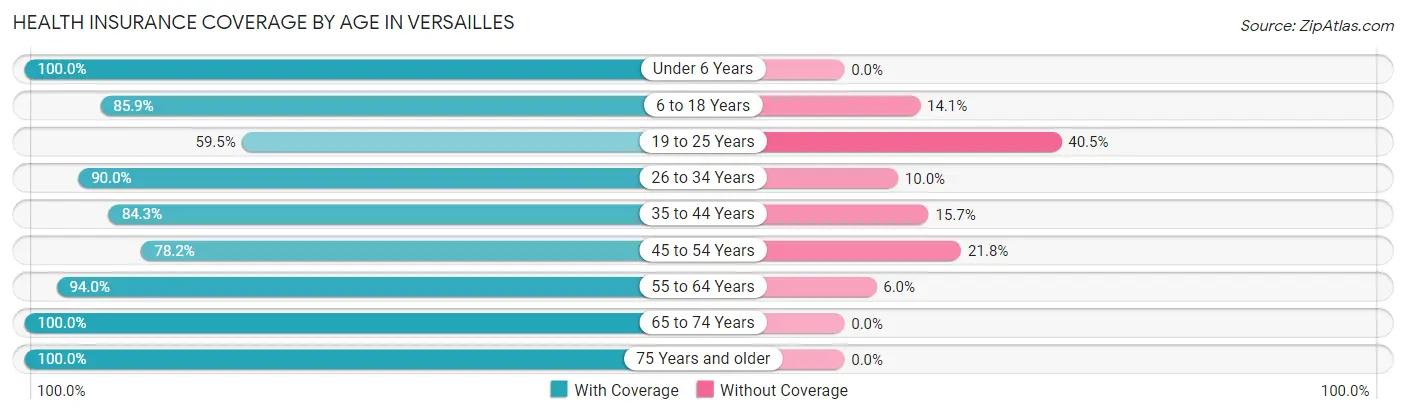
| Age Bracket | With Coverage | Without Coverage |
| Under 6 Years | 162 (100.0%) | 0 (0.0%) |
| 6 to 18 Years | 310 (85.9%) | 51 (14.1%) |
| 19 to 25 Years | 78 (59.5%) | 53 (40.5%) |
| 26 to 34 Years | 225 (90.0%) | 25 (10.0%) |
| 35 to 44 Years | 220 (84.3%) | 41 (15.7%) |
| 45 to 54 Years | 219 (78.2%) | 61 (21.8%) |
| 55 to 64 Years | 363 (94.0%) | 23 (6.0%) |
| 65 to 74 Years | 247 (100.0%) | 0 (0.0%) |
| 75 Years and older | 226 (100.0%) | 0 (0.0%) |
| Total | 2,050 (89.0%) | 254 (11.0%) |
Health Insurance Coverage by Citizenship Status in Versailles
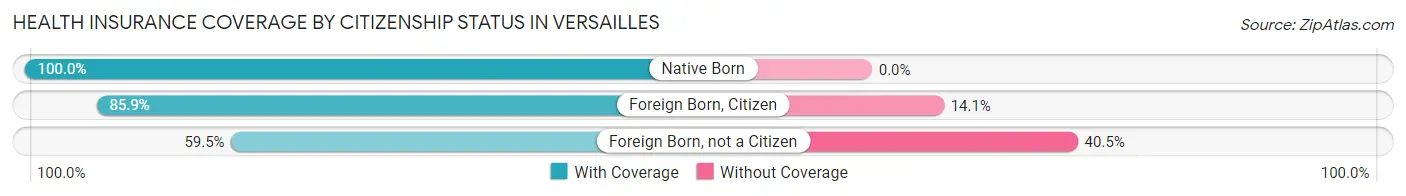
| Citizenship Status | With Coverage | Without Coverage |
| Native Born | 162 (100.0%) | 0 (0.0%) |
| Foreign Born, Citizen | 310 (85.9%) | 51 (14.1%) |
| Foreign Born, not a Citizen | 78 (59.5%) | 53 (40.5%) |
Health Insurance Coverage by Household Income in Versailles
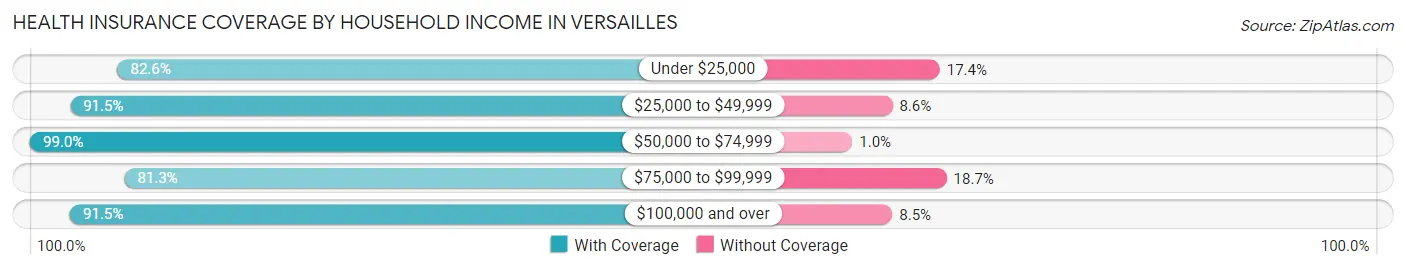
| Household Income | With Coverage | Without Coverage |
| Under $25,000 | 512 (82.6%) | 108 (17.4%) |
| $25,000 to $49,999 | 353 (91.4%) | 33 (8.6%) |
| $50,000 to $74,999 | 379 (99.0%) | 4 (1.0%) |
| $75,000 to $99,999 | 265 (81.3%) | 61 (18.7%) |
| $100,000 and over | 515 (91.5%) | 48 (8.5%) |
Public vs Private Health Insurance Coverage by Age in Versailles
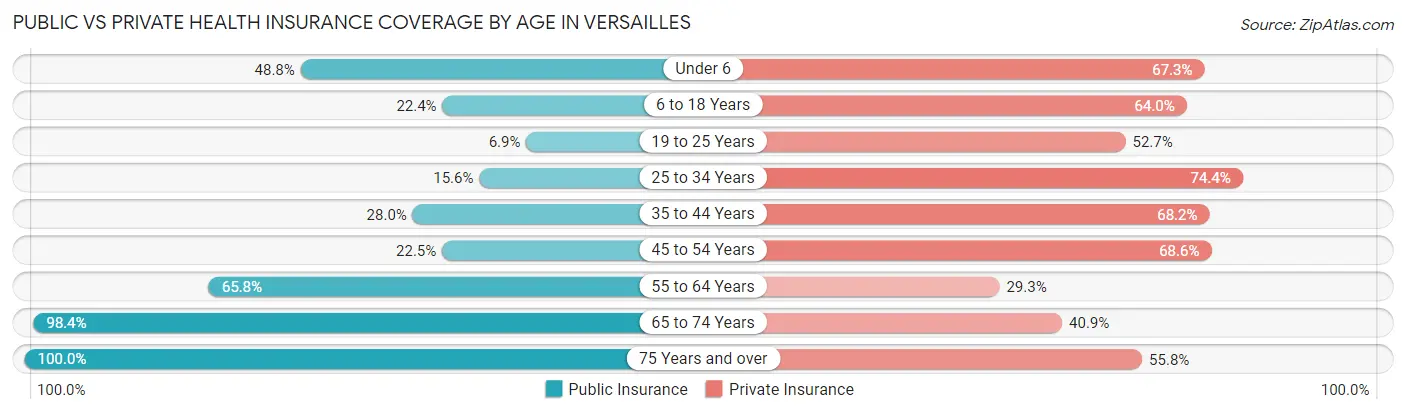
| Age Bracket | Public Insurance | Private Insurance |
| Under 6 | 79 (48.8%) | 109 (67.3%) |
| 6 to 18 Years | 81 (22.4%) | 231 (64.0%) |
| 19 to 25 Years | 9 (6.9%) | 69 (52.7%) |
| 25 to 34 Years | 39 (15.6%) | 186 (74.4%) |
| 35 to 44 Years | 73 (28.0%) | 178 (68.2%) |
| 45 to 54 Years | 63 (22.5%) | 192 (68.6%) |
| 55 to 64 Years | 254 (65.8%) | 113 (29.3%) |
| 65 to 74 Years | 243 (98.4%) | 101 (40.9%) |
| 75 Years and over | 226 (100.0%) | 126 (55.7%) |
| Total | 1,067 (46.3%) | 1,305 (56.6%) |
Disability Status by Sex by Age in Versailles
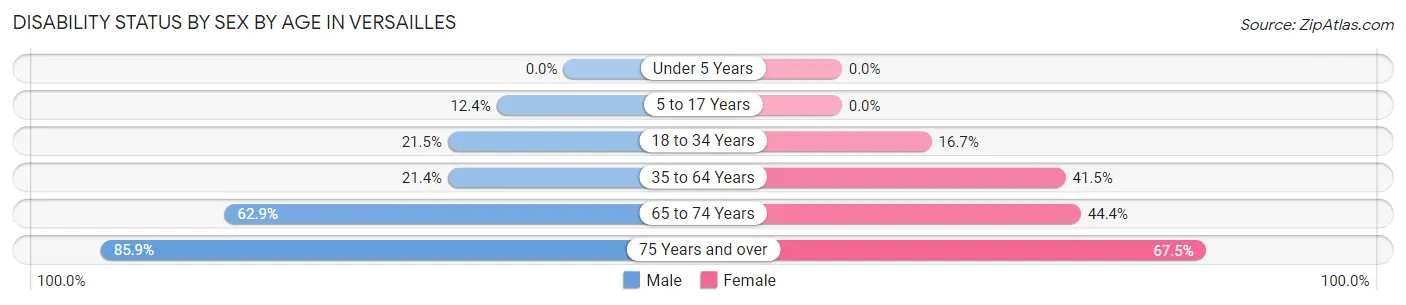
| Age Bracket | Male | Female |
| Under 5 Years | 0 (0.0%) | 0 (0.0%) |
| 5 to 17 Years | 18 (12.4%) | 0 (0.0%) |
| 18 to 34 Years | 44 (21.5%) | 35 (16.7%) |
| 35 to 64 Years | 81 (21.4%) | 228 (41.5%) |
| 65 to 74 Years | 66 (62.9%) | 63 (44.4%) |
| 75 Years and over | 91 (85.9%) | 81 (67.5%) |
Disability Class by Sex by Age in Versailles
Disability Class: Hearing Difficulty
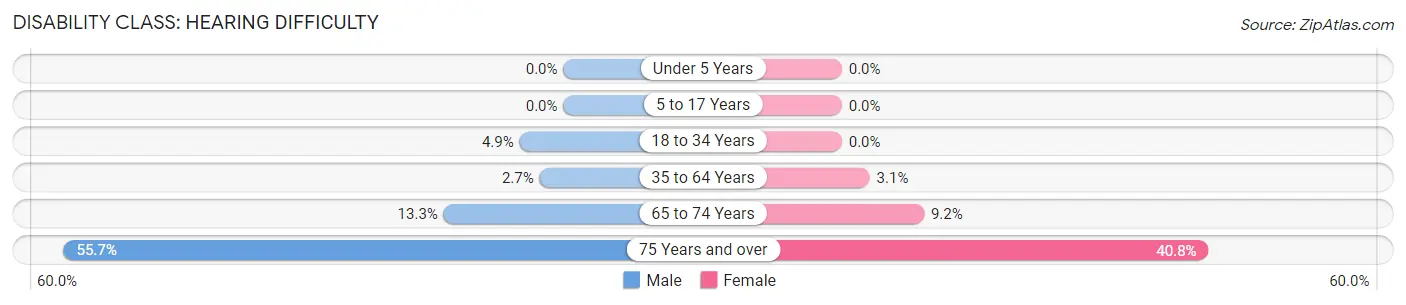
| Age Bracket | Male | Female |
| Under 5 Years | 0 (0.0%) | 0 (0.0%) |
| 5 to 17 Years | 0 (0.0%) | 0 (0.0%) |
| 18 to 34 Years | 10 (4.9%) | 0 (0.0%) |
| 35 to 64 Years | 10 (2.6%) | 17 (3.1%) |
| 65 to 74 Years | 14 (13.3%) | 13 (9.1%) |
| 75 Years and over | 59 (55.7%) | 49 (40.8%) |
Disability Class: Vision Difficulty
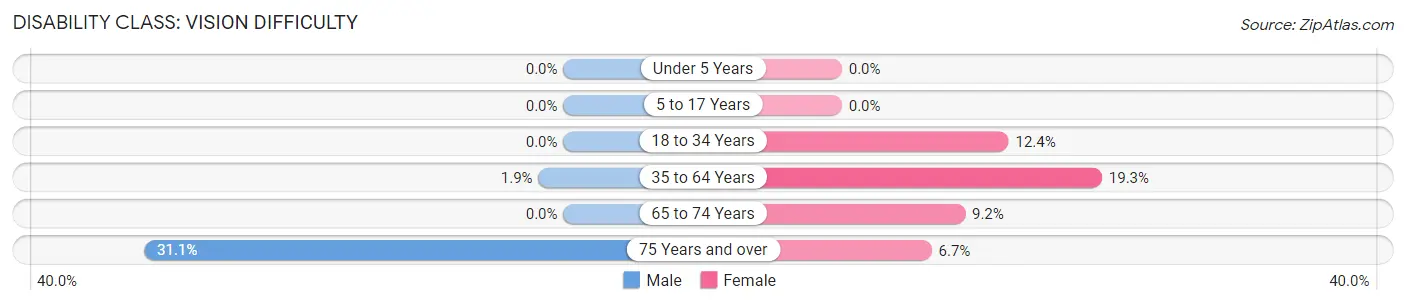
| Age Bracket | Male | Female |
| Under 5 Years | 0 (0.0%) | 0 (0.0%) |
| 5 to 17 Years | 0 (0.0%) | 0 (0.0%) |
| 18 to 34 Years | 0 (0.0%) | 26 (12.4%) |
| 35 to 64 Years | 7 (1.8%) | 106 (19.3%) |
| 65 to 74 Years | 0 (0.0%) | 13 (9.1%) |
| 75 Years and over | 33 (31.1%) | 8 (6.7%) |
Disability Class: Cognitive Difficulty
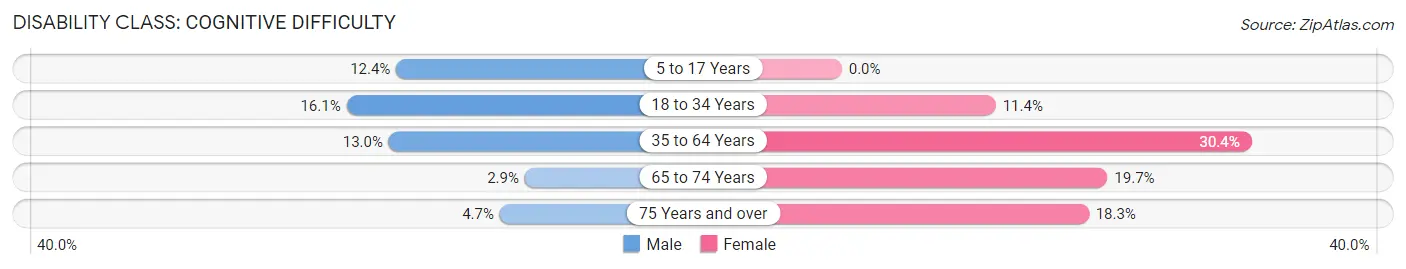
| Age Bracket | Male | Female |
| 5 to 17 Years | 18 (12.4%) | 0 (0.0%) |
| 18 to 34 Years | 33 (16.1%) | 24 (11.4%) |
| 35 to 64 Years | 49 (13.0%) | 167 (30.4%) |
| 65 to 74 Years | 3 (2.9%) | 28 (19.7%) |
| 75 Years and over | 5 (4.7%) | 22 (18.3%) |
Disability Class: Ambulatory Difficulty
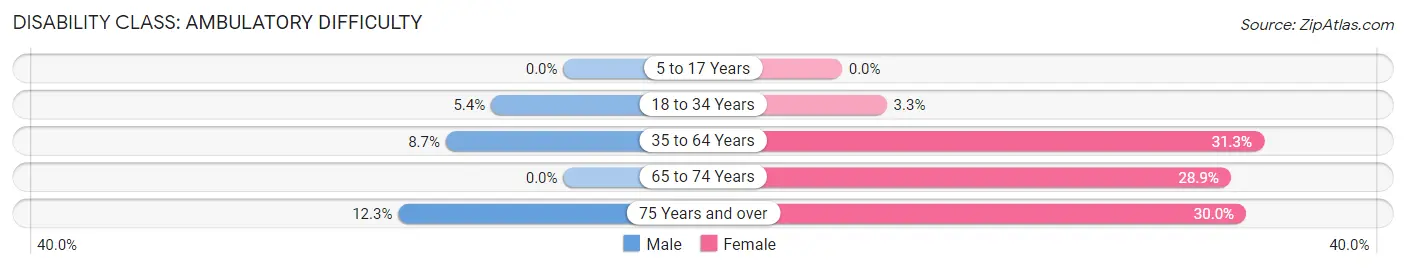
| Age Bracket | Male | Female |
| 5 to 17 Years | 0 (0.0%) | 0 (0.0%) |
| 18 to 34 Years | 11 (5.4%) | 7 (3.3%) |
| 35 to 64 Years | 33 (8.7%) | 172 (31.3%) |
| 65 to 74 Years | 0 (0.0%) | 41 (28.9%) |
| 75 Years and over | 13 (12.3%) | 36 (30.0%) |
Disability Class: Self-Care Difficulty
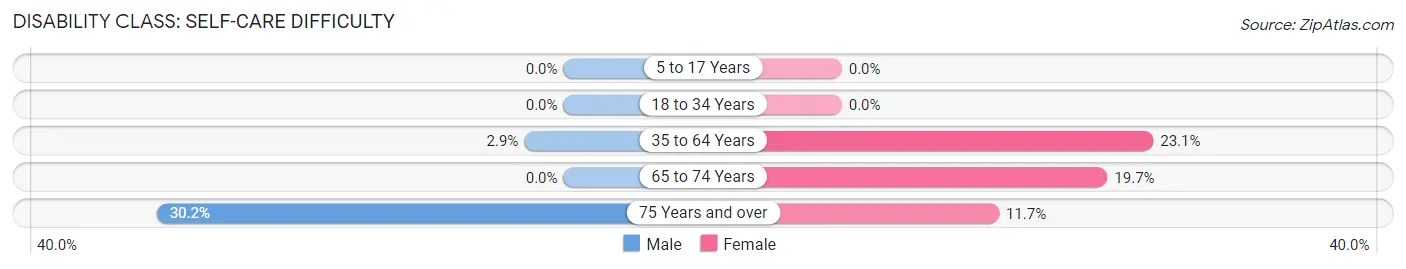
| Age Bracket | Male | Female |
| 5 to 17 Years | 0 (0.0%) | 0 (0.0%) |
| 18 to 34 Years | 0 (0.0%) | 0 (0.0%) |
| 35 to 64 Years | 11 (2.9%) | 127 (23.1%) |
| 65 to 74 Years | 0 (0.0%) | 28 (19.7%) |
| 75 Years and over | 32 (30.2%) | 14 (11.7%) |
Technology Access in Versailles
Computing Device Access in Versailles
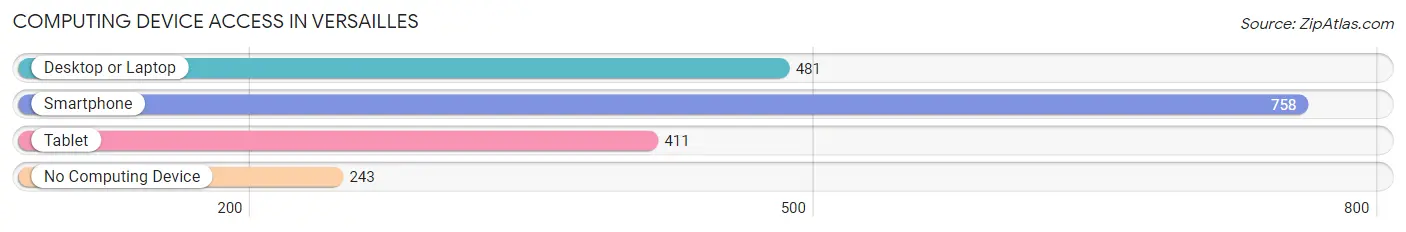
| Device Type | # Households | % Households |
| Desktop or Laptop | 481 | 45.0% |
| Smartphone | 758 | 70.8% |
| Tablet | 411 | 38.4% |
| No Computing Device | 243 | 22.7% |
| Total | 1,070 | 100.0% |
Internet Access in Versailles
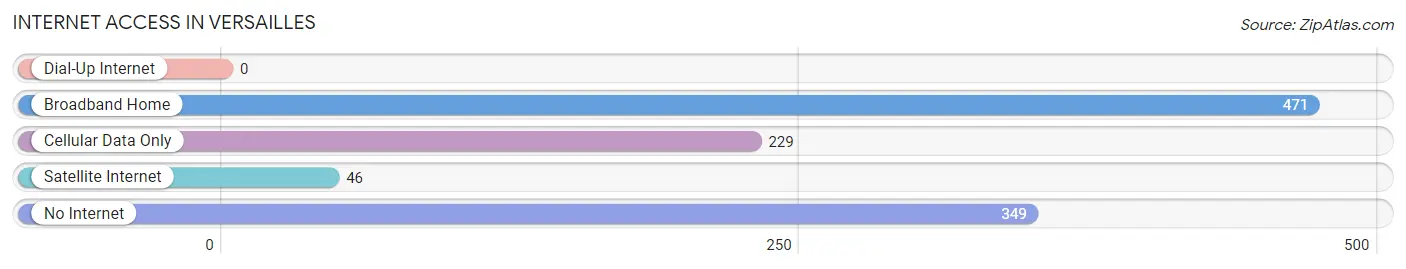
| Internet Type | # Households | % Households |
| Dial-Up Internet | 0 | 0.0% |
| Broadband Home | 471 | 44.0% |
| Cellular Data Only | 229 | 21.4% |
| Satellite Internet | 46 | 4.3% |
| No Internet | 349 | 32.6% |
| Total | 1,070 | 100.0% |
Versailles Summary
Versailles, Missouri is a small town located in the heart of the Ozarks in Morgan County. It is situated on the banks of the Osage River and is surrounded by rolling hills and lush forests. The town has a population of approximately 2,000 people and is known for its rural charm and friendly atmosphere.
History
The area that is now Versailles was first settled in the early 1800s by French settlers who named the area after the Palace of Versailles in France. The town was officially incorporated in 1871 and quickly became a popular destination for tourists and outdoor enthusiasts. The town was also home to a number of businesses, including a sawmill, a gristmill, and a blacksmith shop.
In the early 1900s, the town experienced a period of growth and development. The railroad arrived in 1906, bringing with it new opportunities for commerce and industry. The town also became a popular destination for tourists, who came to enjoy the area’s natural beauty and outdoor activities.
Geography
Versailles is located in the Ozark Mountains of central Missouri. The town is situated on the banks of the Osage River and is surrounded by rolling hills and lush forests. The town is located approximately 50 miles south of the state capital of Jefferson City and is within easy driving distance of several major cities, including St. Louis, Kansas City, and Springfield.
The climate in Versailles is generally mild, with hot summers and cold winters. The average annual temperature is around 55 degrees Fahrenheit, with temperatures ranging from the low 30s in the winter to the mid-80s in the summer. The area receives an average of 45 inches of precipitation per year, with most of it falling in the form of rain.
Economy
The economy of Versailles is largely based on tourism and agriculture. The town is home to several tourist attractions, including the historic Palace of Versailles, the Ozark National Scenic Riverways, and the Mark Twain National Forest. The town also hosts a number of festivals and events throughout the year, including the annual Versailles Apple Festival.
Agriculture is also an important part of the local economy. The area is home to a number of farms, which produce a variety of crops, including corn, soybeans, wheat, and hay. Livestock production is also an important part of the local economy, with cattle, hogs, and poultry being raised in the area.
Demographics
As of the 2010 census, the population of Versailles was 2,039. The racial makeup of the town was 95.3% White, 0.7% African American, 0.3% Native American, 0.3% Asian, 0.1% Pacific Islander, and 2.3% from other races. The median household income was $37,917, and the median family income was $45,938. The per capita income was $19,945.
The town is served by the Versailles R-III School District, which includes an elementary school, a middle school, and a high school. The town also has a public library and a number of churches. The town is home to a number of businesses, including restaurants, retail stores, and service providers.
Overall, Versailles is a small town with a rich history and a friendly atmosphere. The town is known for its rural charm and its proximity to a number of outdoor activities. The town’s economy is largely based on tourism and agriculture, and the town is served by a number of businesses and organizations. The town has a diverse population and is a great place to live and work.
Common Questions
What is Per Capita Income in Versailles?
Per Capita income in Versailles is $20,858.
What is the Median Family Income in Versailles?
Median Family Income in Versailles is $57,986.
What is the Median Household income in Versailles?
Median Household Income in Versailles is $27,202.
What is Income or Wage Gap in Versailles?
Income or Wage Gap in Versailles is 28.3%.
Women in Versailles earn 71.7 cents for every dollar earned by a man.
What is Inequality or Gini Index in Versailles?
Inequality or Gini Index in Versailles is 0.47.
What is the Total Population of Versailles?
Total Population of Versailles is 2,549.
What is the Total Male Population of Versailles?
Total Male Population of Versailles is 1,161.
What is the Total Female Population of Versailles?
Total Female Population of Versailles is 1,388.
What is the Ratio of Males per 100 Females in Versailles?
There are 83.65 Males per 100 Females in Versailles.
What is the Ratio of Females per 100 Males in Versailles?
There are 119.55 Females per 100 Males in Versailles.
What is the Median Population Age in Versailles?
Median Population Age in Versailles is 45.1 Years.
What is the Average Family Size in Versailles
Average Family Size in Versailles is 3.0 People.
What is the Average Household Size in Versailles
Average Household Size in Versailles is 2.1 People.
How Large is the Labor Force in Versailles?
There are 1,000 People in the Labor Forcein in Versailles.
What is the Percentage of People in the Labor Force in Versailles?
47.8% of People are in the Labor Force in Versailles.
What is the Unemployment Rate in Versailles?
Unemployment Rate in Versailles is 5.6%.