Ellington, MO Map & Demographics
Ellington Map
Ellington Overview
$22,464
PER CAPITA INCOME
$55,227
AVG FAMILY INCOME
$40,000
AVG HOUSEHOLD INCOME
15.9%
WAGE / INCOME GAP [ % ]
84.1¢/ $1
WAGE / INCOME GAP [ $ ]
$16,543
FAMILY INCOME DEFICIT
0.39
INEQUALITY / GINI INDEX
1,302
TOTAL POPULATION
599
MALE POPULATION
703
FEMALE POPULATION
85.21
MALES / 100 FEMALES
117.36
FEMALES / 100 MALES
36.6
MEDIAN AGE
4.2
AVG FAMILY SIZE
3.1
AVG HOUSEHOLD SIZE
600
LABOR FORCE [ PEOPLE ]
59.1%
PERCENT IN LABOR FORCE
26.2%
UNEMPLOYMENT RATE
Ellington Zip Codes
Ellington Area Codes
Income in Ellington
Income Overview in Ellington
Per Capita Income in Ellington is $22,464, while median incomes of families and households are $55,227 and $40,000 respectively.
| Characteristic | Number | Measure |
| Per Capita Income | 1,302 | $22,464 |
| Median Family Income | 230 | $55,227 |
| Mean Family Income | 230 | $56,873 |
| Median Household Income | 412 | $40,000 |
| Mean Household Income | 412 | $46,603 |
| Income Deficit | 230 | $16,543 |
| Wage / Income Gap (%) | 1,302 | 15.94% |
| Wage / Income Gap ($) | 1,302 | 84.06¢ per $1 |
| Gini / Inequality Index | 1,302 | 0.39 |
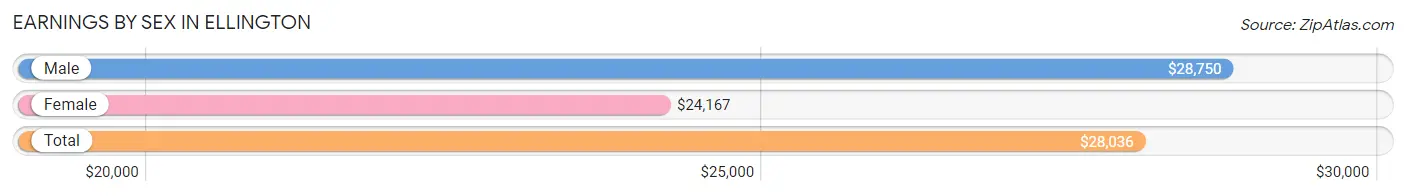
Earnings by Sex in Ellington
Average Earnings in Ellington are $28,036, $28,750 for men and $24,167 for women, a difference of 15.9%.
| Sex | Number | Average Earnings |
| Male | 266 (41.3%) | $28,750 |
| Female | 378 (58.7%) | $24,167 |
| Total | 644 (100.0%) | $28,036 |
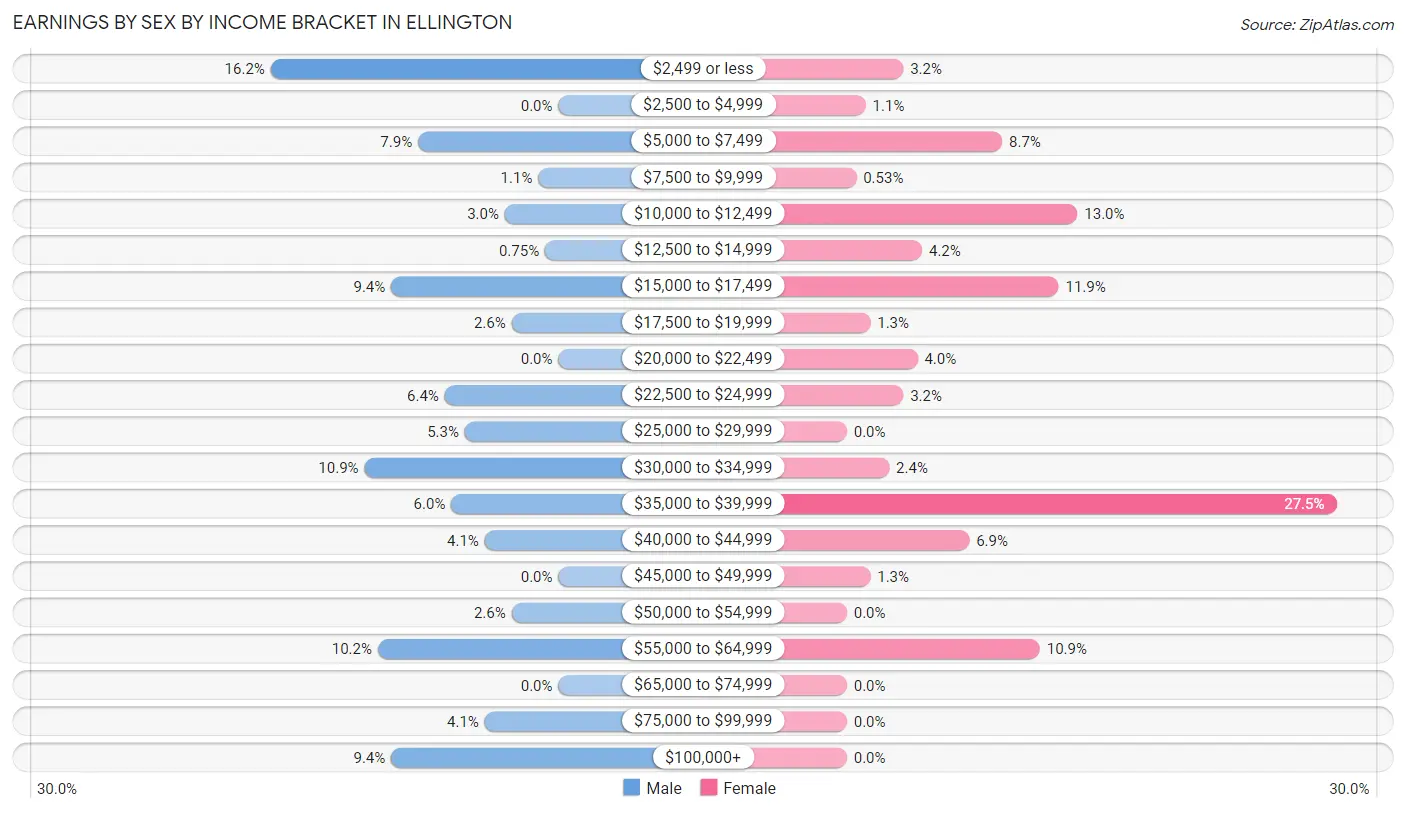
Earnings by Sex by Income Bracket in Ellington
The most common earnings brackets in Ellington are $2,499 or less for men (43 | 16.2%) and $35,000 to $39,999 for women (104 | 27.5%).
| Income | Male | Female |
| $2,499 or less | 43 (16.2%) | 12 (3.2%) |
| $2,500 to $4,999 | 0 (0.0%) | 4 (1.1%) |
| $5,000 to $7,499 | 21 (7.9%) | 33 (8.7%) |
| $7,500 to $9,999 | 3 (1.1%) | 2 (0.5%) |
| $10,000 to $12,499 | 8 (3.0%) | 49 (13.0%) |
| $12,500 to $14,999 | 2 (0.7%) | 16 (4.2%) |
| $15,000 to $17,499 | 25 (9.4%) | 45 (11.9%) |
| $17,500 to $19,999 | 7 (2.6%) | 5 (1.3%) |
| $20,000 to $22,499 | 0 (0.0%) | 15 (4.0%) |
| $22,500 to $24,999 | 17 (6.4%) | 12 (3.2%) |
| $25,000 to $29,999 | 14 (5.3%) | 0 (0.0%) |
| $30,000 to $34,999 | 29 (10.9%) | 9 (2.4%) |
| $35,000 to $39,999 | 16 (6.0%) | 104 (27.5%) |
| $40,000 to $44,999 | 11 (4.1%) | 26 (6.9%) |
| $45,000 to $49,999 | 0 (0.0%) | 5 (1.3%) |
| $50,000 to $54,999 | 7 (2.6%) | 0 (0.0%) |
| $55,000 to $64,999 | 27 (10.2%) | 41 (10.8%) |
| $65,000 to $74,999 | 0 (0.0%) | 0 (0.0%) |
| $75,000 to $99,999 | 11 (4.1%) | 0 (0.0%) |
| $100,000+ | 25 (9.4%) | 0 (0.0%) |
| Total | 266 (100.0%) | 378 (100.0%) |
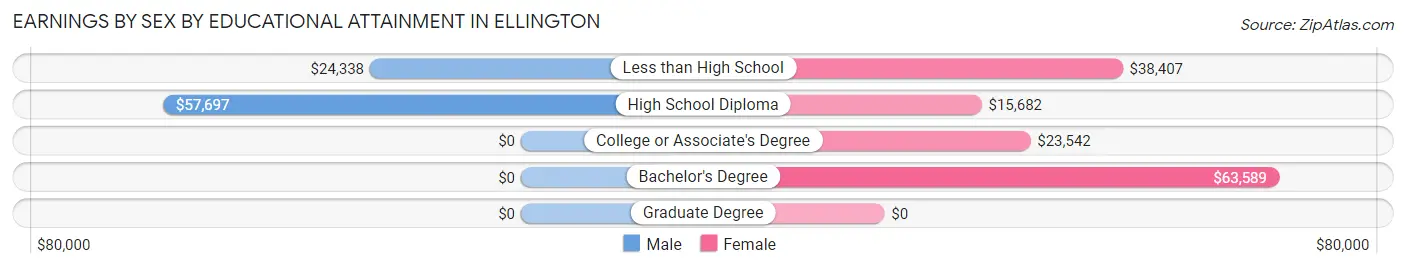
Earnings by Sex by Educational Attainment in Ellington
Average earnings in Ellington are $34,286 for men and $37,909 for women, a difference of 9.6%. Men with an educational attainment of high school diploma enjoy the highest average annual earnings of $57,697, while those with less than high school education earn the least with $24,338. Women with an educational attainment of bachelor's degree earn the most with the average annual earnings of $63,589, while those with high school diploma education have the smallest earnings of $15,682.
| Educational Attainment | Male Income | Female Income |
| Less than High School | $24,338 | $38,407 |
| High School Diploma | $57,697 | $15,682 |
| College or Associate's Degree | - | - |
| Bachelor's Degree | - | - |
| Graduate Degree | - | - |
| Total | $34,286 | $37,909 |
Family Income in Ellington
Family Income Brackets in Ellington
According to the Ellington family income data, there are 55 families falling into the $75,000 to $99,999 income range, which is the most common income bracket and makes up 23.9% of all families.
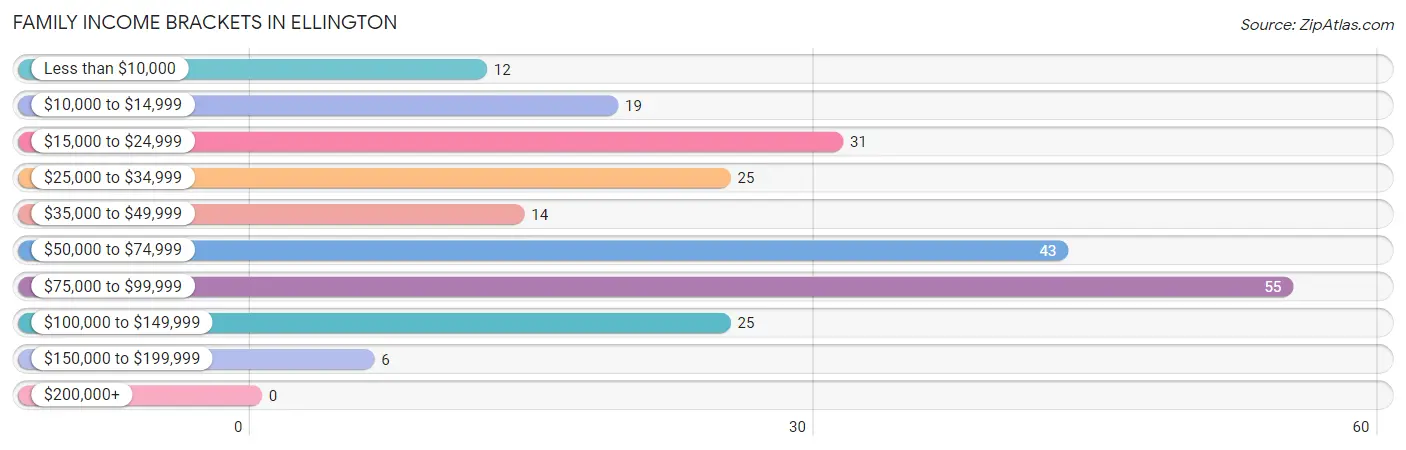
| Income Bracket | # Families | % Families |
| Less than $10,000 | 12 | 5.2% |
| $10,000 to $14,999 | 19 | 8.3% |
| $15,000 to $24,999 | 31 | 13.5% |
| $25,000 to $34,999 | 25 | 10.9% |
| $35,000 to $49,999 | 14 | 6.1% |
| $50,000 to $74,999 | 43 | 18.7% |
| $75,000 to $99,999 | 55 | 23.9% |
| $100,000 to $149,999 | 25 | 10.9% |
| $150,000 to $199,999 | 6 | 2.6% |
| $200,000+ | 0 | 0.0% |
Family Income by Famaliy Size in Ellington
4-person families (56 | 24.3%) account for the highest median family income in Ellington with $75,568 per family, while 2-person families (96 | 41.7%) have the highest median income of $27,614 per family member.
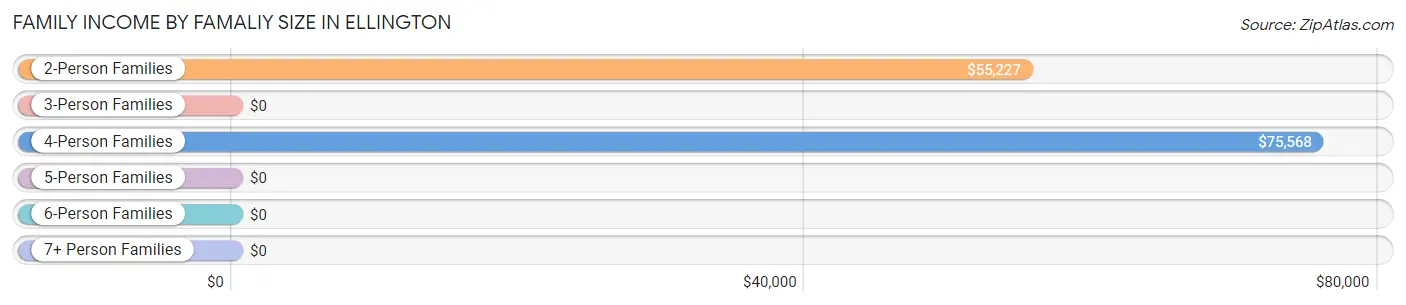
| Income Bracket | # Families | Median Income |
| 2-Person Families | 96 (41.7%) | $55,227 |
| 3-Person Families | 45 (19.6%) | $0 |
| 4-Person Families | 56 (24.3%) | $75,568 |
| 5-Person Families | 21 (9.1%) | $0 |
| 6-Person Families | 12 (5.2%) | $0 |
| 7+ Person Families | 0 (0.0%) | $0 |
| Total | 230 (100.0%) | $55,227 |
Family Income by Number of Earners in Ellington
The median family income in Ellington is $55,227, with families comprising 3+ earners (9) having the highest median family income of $85,893, while families with no earners (27) have the lowest median family income of $30,313, accounting for 3.9% and 11.7% of families, respectively.
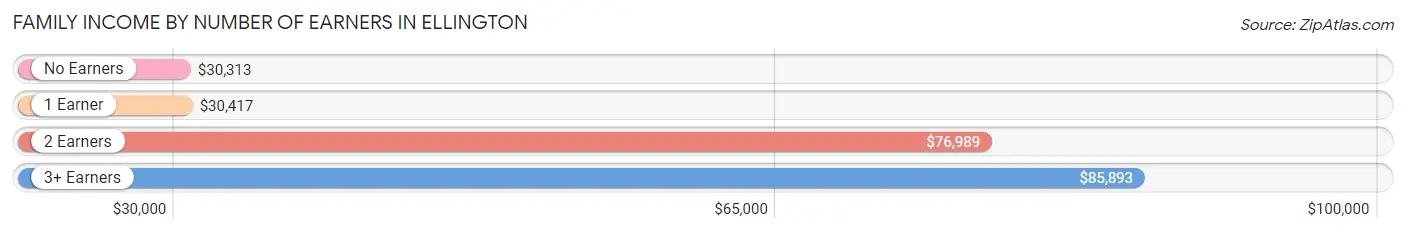
| Number of Earners | # Families | Median Income |
| No Earners | 27 (11.7%) | $30,313 |
| 1 Earner | 109 (47.4%) | $30,417 |
| 2 Earners | 85 (37.0%) | $76,989 |
| 3+ Earners | 9 (3.9%) | $85,893 |
| Total | 230 (100.0%) | $55,227 |
Household Income in Ellington
Household Income Brackets in Ellington
With 102 households falling in the category, the $15,000 to $24,999 income range is the most frequent in Ellington, accounting for 24.8% of all households.
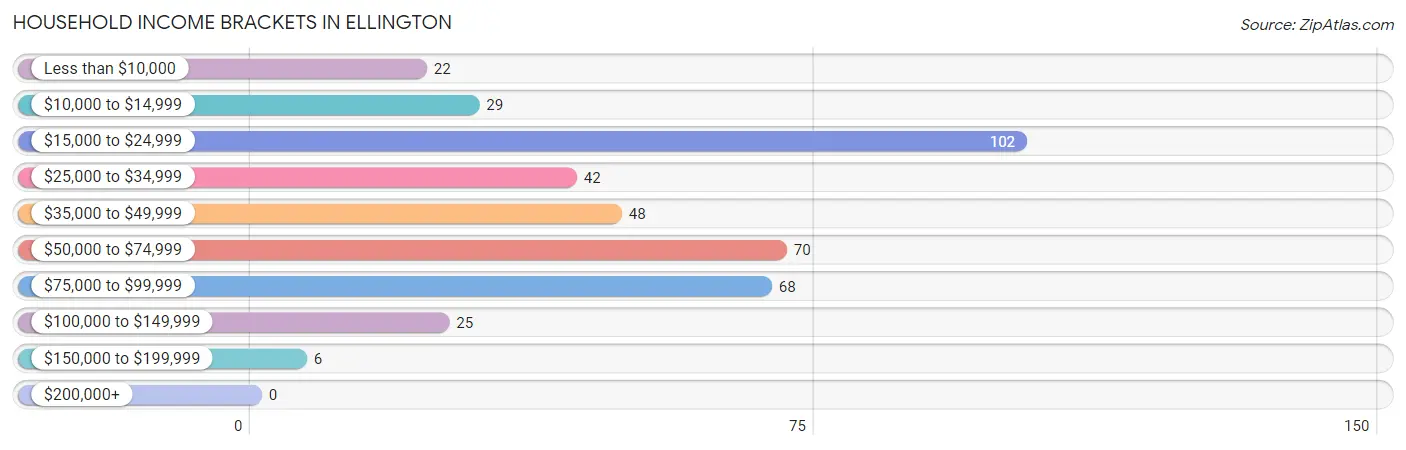
| Income Bracket | # Households | % Households |
| Less than $10,000 | 22 | 5.3% |
| $10,000 to $14,999 | 29 | 7.0% |
| $15,000 to $24,999 | 102 | 24.8% |
| $25,000 to $34,999 | 42 | 10.2% |
| $35,000 to $49,999 | 48 | 11.7% |
| $50,000 to $74,999 | 70 | 17.0% |
| $75,000 to $99,999 | 68 | 16.5% |
| $100,000 to $149,999 | 25 | 6.1% |
| $150,000 to $199,999 | 6 | 1.5% |
| $200,000+ | 0 | 0.0% |
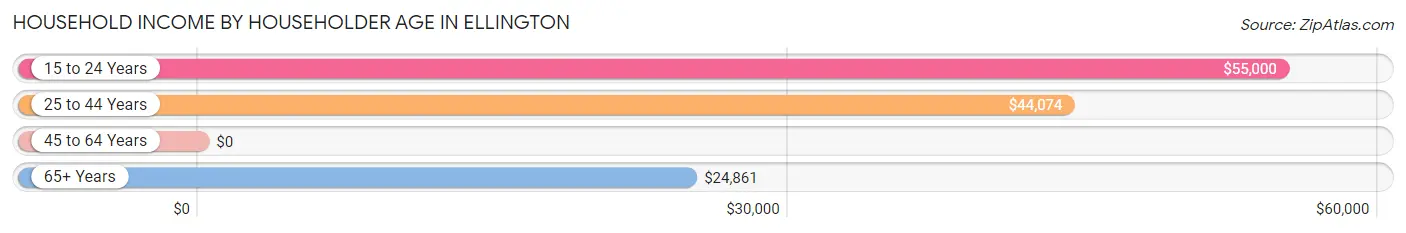
Household Income by Householder Age in Ellington
The median household income in Ellington is $40,000, with the highest median household income of $55,000 found in the 15 to 24 years age bracket for the primary householder. A total of 24 households (5.8%) fall into this category. Meanwhile, the 45 to 64 years age bracket for the primary householder has the lowest median household income of $0, with 107 households (26.0%) in this group.
| Income Bracket | # Households | Median Income |
| 15 to 24 Years | 24 (5.8%) | $55,000 |
| 25 to 44 Years | 146 (35.4%) | $44,074 |
| 45 to 64 Years | 107 (26.0%) | $0 |
| 65+ Years | 135 (32.8%) | $24,861 |
| Total | 412 (100.0%) | $40,000 |
Poverty in Ellington
Income Below Poverty by Sex and Age in Ellington
With 24.9% poverty level for males and 29.2% for females among the residents of Ellington, under 5 year old males and 6 to 11 year old females are the most vulnerable to poverty, with 46 males (100.0%) and 41 females (85.4%) in their respective age groups living below the poverty level.
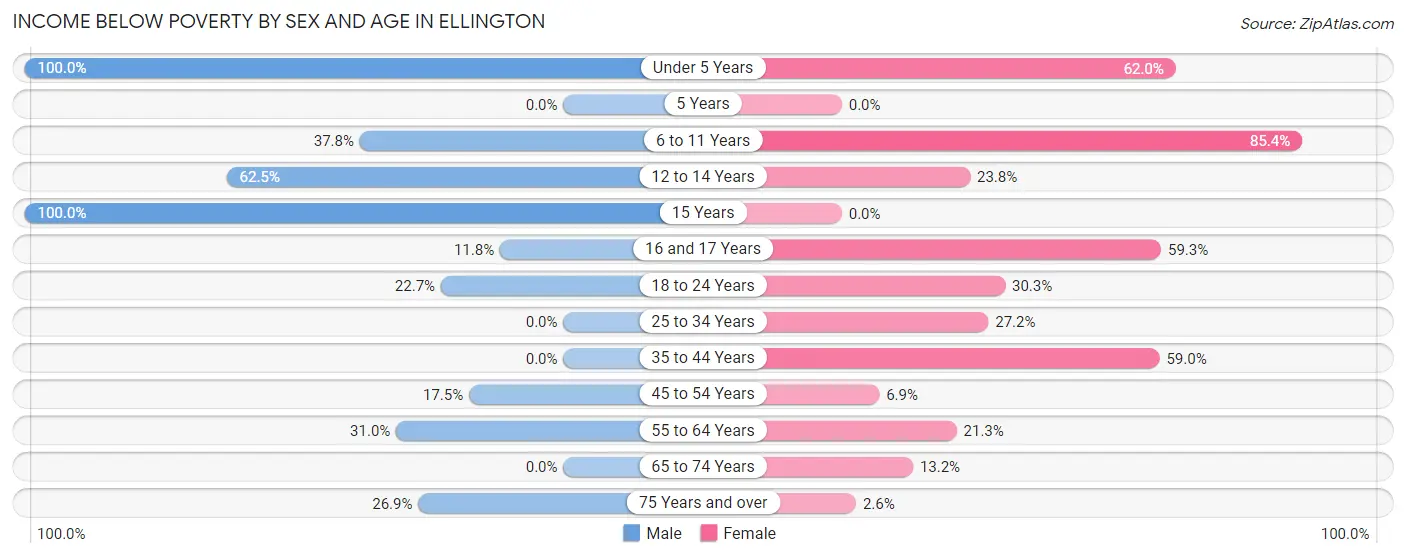
| Age Bracket | Male | Female |
| Under 5 Years | 46 (100.0%) | 44 (62.0%) |
| 5 Years | 0 (0.0%) | 0 (0.0%) |
| 6 to 11 Years | 17 (37.8%) | 41 (85.4%) |
| 12 to 14 Years | 15 (62.5%) | 5 (23.8%) |
| 15 Years | 5 (100.0%) | 0 (0.0%) |
| 16 and 17 Years | 4 (11.8%) | 16 (59.3%) |
| 18 to 24 Years | 15 (22.7%) | 10 (30.3%) |
| 25 to 34 Years | 0 (0.0%) | 31 (27.2%) |
| 35 to 44 Years | 0 (0.0%) | 23 (59.0%) |
| 45 to 54 Years | 7 (17.5%) | 10 (6.9%) |
| 55 to 64 Years | 27 (31.0%) | 13 (21.3%) |
| 65 to 74 Years | 0 (0.0%) | 7 (13.2%) |
| 75 Years and over | 7 (26.9%) | 2 (2.6%) |
| Total | 143 (24.9%) | 202 (29.2%) |
Income Above Poverty by Sex and Age in Ellington
According to the poverty statistics in Ellington, males aged 5 years and females aged 15 years are the age groups that are most secure financially, with 100.0% of males and 100.0% of females in these age groups living above the poverty line.
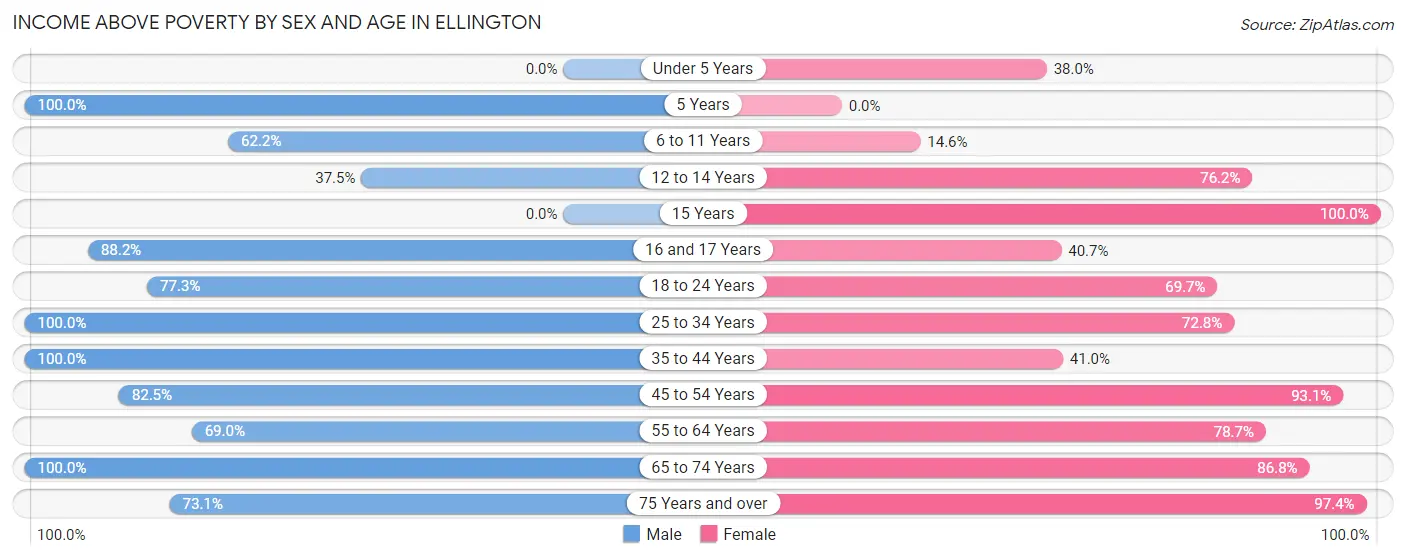
| Age Bracket | Male | Female |
| Under 5 Years | 0 (0.0%) | 27 (38.0%) |
| 5 Years | 3 (100.0%) | 0 (0.0%) |
| 6 to 11 Years | 28 (62.2%) | 7 (14.6%) |
| 12 to 14 Years | 9 (37.5%) | 16 (76.2%) |
| 15 Years | 0 (0.0%) | 5 (100.0%) |
| 16 and 17 Years | 30 (88.2%) | 11 (40.7%) |
| 18 to 24 Years | 51 (77.3%) | 23 (69.7%) |
| 25 to 34 Years | 38 (100.0%) | 83 (72.8%) |
| 35 to 44 Years | 95 (100.0%) | 16 (41.0%) |
| 45 to 54 Years | 33 (82.5%) | 134 (93.1%) |
| 55 to 64 Years | 60 (69.0%) | 48 (78.7%) |
| 65 to 74 Years | 65 (100.0%) | 46 (86.8%) |
| 75 Years and over | 19 (73.1%) | 74 (97.4%) |
| Total | 431 (75.1%) | 490 (70.8%) |
Income Below Poverty Among Married-Couple Families in Ellington
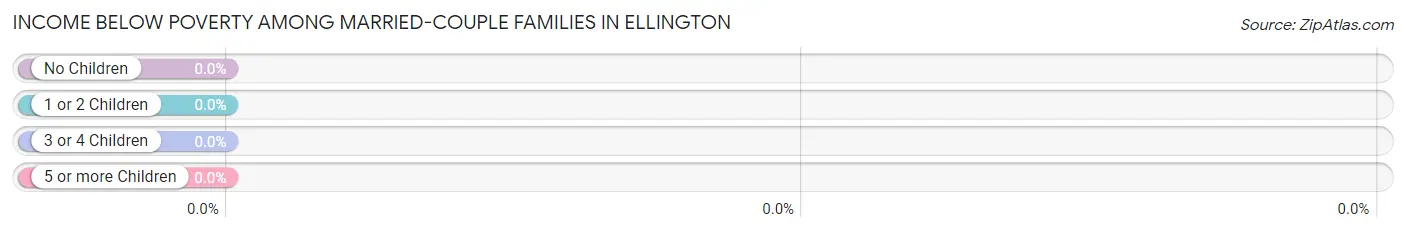
| Children | Above Poverty | Below Poverty |
| No Children | 67 (100.0%) | 0 (0.0%) |
| 1 or 2 Children | 51 (100.0%) | 0 (0.0%) |
| 3 or 4 Children | 0 (0.0%) | 0 (0.0%) |
| 5 or more Children | 0 (0.0%) | 0 (0.0%) |
| Total | 118 (100.0%) | 0 (0.0%) |
Income Below Poverty Among Single-Parent Households in Ellington
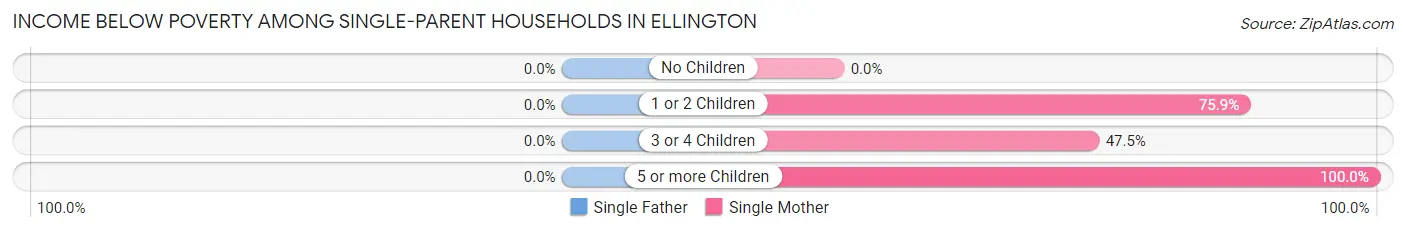
| Children | Single Father | Single Mother |
| No Children | 0 (0.0%) | 0 (0.0%) |
| 1 or 2 Children | 0 (0.0%) | 22 (75.9%) |
| 3 or 4 Children | 0 (0.0%) | 19 (47.5%) |
| 5 or more Children | 0 (0.0%) | 12 (100.0%) |
| Total | 0 (0.0%) | 53 (61.6%) |
Income Below Poverty Among Married-Couple vs Single-Parent Households in Ellington
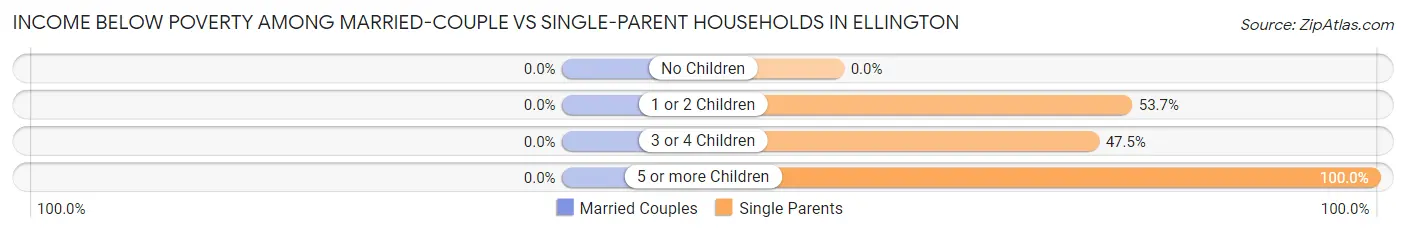
| Children | Married-Couple Families | Single-Parent Households |
| No Children | 0 (0.0%) | 0 (0.0%) |
| 1 or 2 Children | 0 (0.0%) | 22 (53.7%) |
| 3 or 4 Children | 0 (0.0%) | 19 (47.5%) |
| 5 or more Children | 0 (0.0%) | 12 (100.0%) |
| Total | 0 (0.0%) | 53 (47.3%) |
Race in Ellington
The most populous races in Ellington are White / Caucasian (1,238 | 95.1%), Two or more Races (40 | 3.1%), and Black / African American (16 | 1.2%).
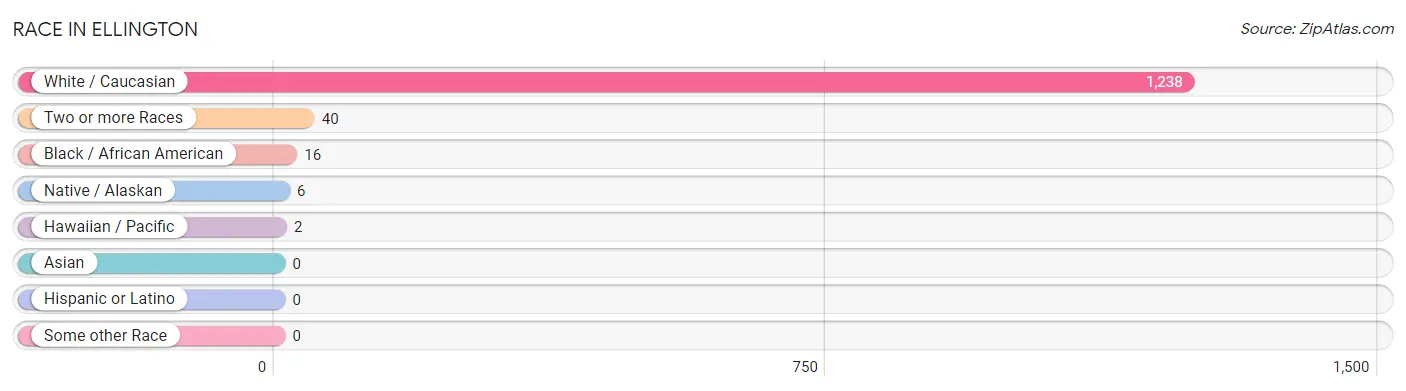
| Race | # Population | % Population |
| Asian | 0 | 0.0% |
| Black / African American | 16 | 1.2% |
| Hawaiian / Pacific | 2 | 0.2% |
| Hispanic or Latino | 0 | 0.0% |
| Native / Alaskan | 6 | 0.5% |
| White / Caucasian | 1,238 | 95.1% |
| Two or more Races | 40 | 3.1% |
| Some other Race | 0 | 0.0% |
| Total | 1,302 | 100.0% |
Ancestry in Ellington
The most populous ancestries reported in Ellington are German (223 | 17.1%), American (124 | 9.5%), Irish (120 | 9.2%), English (62 | 4.8%), and Cherokee (28 | 2.1%), together accounting for 42.8% of all Ellington residents.
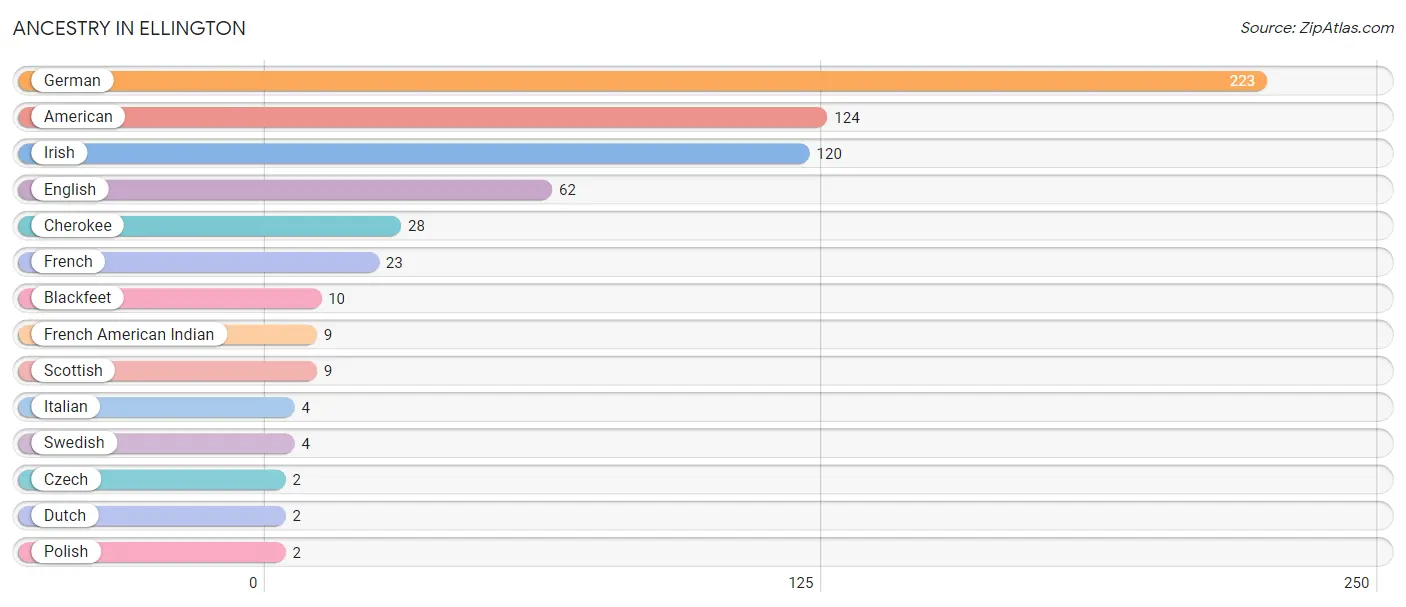
| Ancestry | # Population | % Population |
| American | 124 | 9.5% |
| Blackfeet | 10 | 0.8% |
| Cherokee | 28 | 2.1% |
| Czech | 2 | 0.2% |
| Dutch | 2 | 0.2% |
| English | 62 | 4.8% |
| French | 23 | 1.8% |
| French American Indian | 9 | 0.7% |
| German | 223 | 17.1% |
| Irish | 120 | 9.2% |
| Italian | 4 | 0.3% |
| Polish | 2 | 0.2% |
| Scottish | 9 | 0.7% |
| Swedish | 4 | 0.3% | View All 14 Rows |
Immigrants in Ellington

| Immigration Origin | # Population | % Population | View All 0 Rows |
Sex and Age in Ellington
Sex and Age in Ellington
The most populous age groups in Ellington are 35 to 39 Years (70 | 11.7%) for men and 45 to 49 Years (119 | 16.9%) for women.
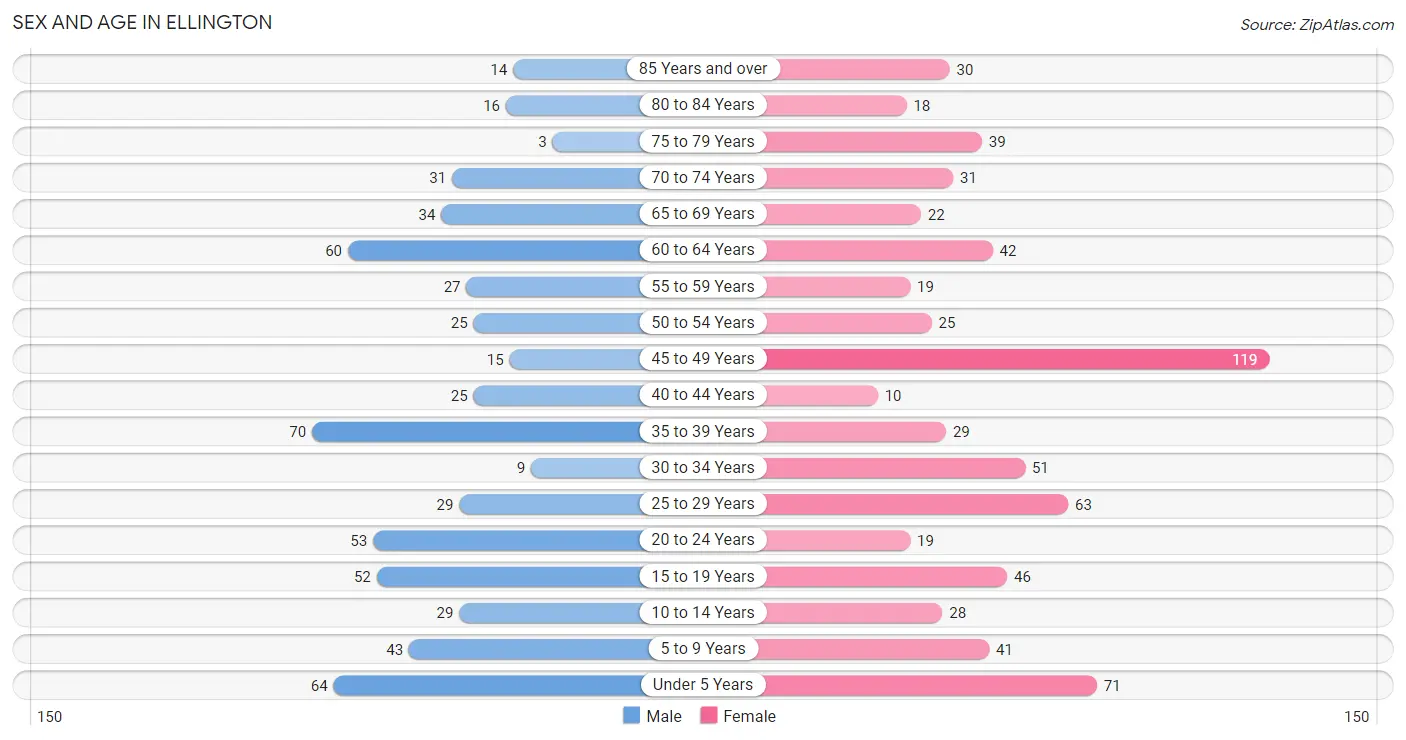
| Age Bracket | Male | Female |
| Under 5 Years | 64 (10.7%) | 71 (10.1%) |
| 5 to 9 Years | 43 (7.2%) | 41 (5.8%) |
| 10 to 14 Years | 29 (4.8%) | 28 (4.0%) |
| 15 to 19 Years | 52 (8.7%) | 46 (6.5%) |
| 20 to 24 Years | 53 (8.8%) | 19 (2.7%) |
| 25 to 29 Years | 29 (4.8%) | 63 (9.0%) |
| 30 to 34 Years | 9 (1.5%) | 51 (7.2%) |
| 35 to 39 Years | 70 (11.7%) | 29 (4.1%) |
| 40 to 44 Years | 25 (4.2%) | 10 (1.4%) |
| 45 to 49 Years | 15 (2.5%) | 119 (16.9%) |
| 50 to 54 Years | 25 (4.2%) | 25 (3.6%) |
| 55 to 59 Years | 27 (4.5%) | 19 (2.7%) |
| 60 to 64 Years | 60 (10.0%) | 42 (6.0%) |
| 65 to 69 Years | 34 (5.7%) | 22 (3.1%) |
| 70 to 74 Years | 31 (5.2%) | 31 (4.4%) |
| 75 to 79 Years | 3 (0.5%) | 39 (5.6%) |
| 80 to 84 Years | 16 (2.7%) | 18 (2.6%) |
| 85 Years and over | 14 (2.3%) | 30 (4.3%) |
| Total | 599 (100.0%) | 703 (100.0%) |
Families and Households in Ellington
Median Family Size in Ellington
The median family size in Ellington is 4.16 persons per family, with single female/mother families (86 | 37.4%) accounting for the largest median family size of 4.81 persons per family. On the other hand, married-couple families (118 | 51.3%) represent the smallest median family size with 3.70 persons per family.
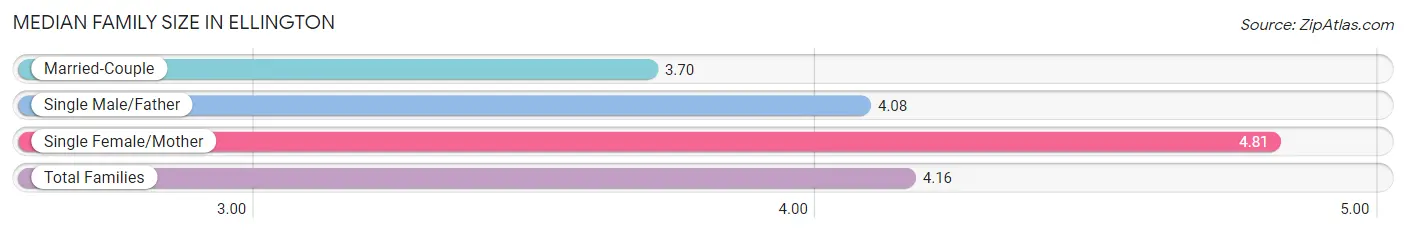
| Family Type | # Families | Family Size |
| Married-Couple | 118 (51.3%) | 3.70 |
| Single Male/Father | 26 (11.3%) | 4.08 |
| Single Female/Mother | 86 (37.4%) | 4.81 |
| Total Families | 230 (100.0%) | 4.16 |
Median Household Size in Ellington
The median household size in Ellington is 3.08 persons per household, with single female/mother households (86 | 20.9%) accounting for the largest median household size of 5.3 persons per household. non-family households (182 | 44.2%) represent the smallest median household size with 1.41 persons per household.
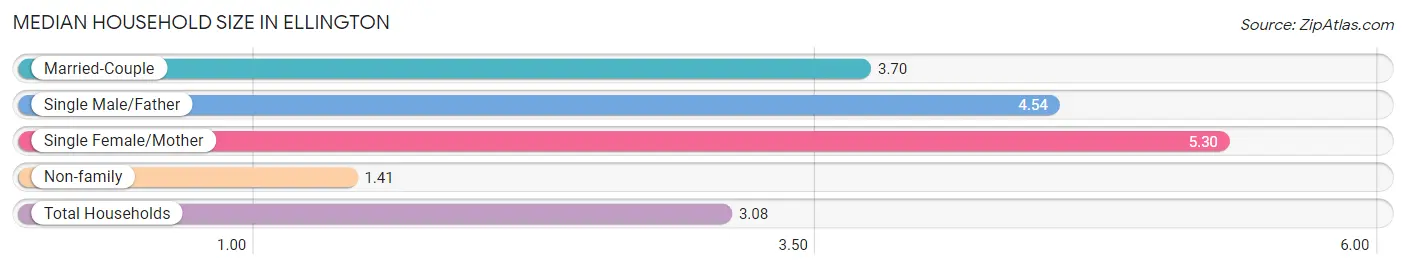
| Household Type | # Households | Household Size |
| Married-Couple | 118 (28.6%) | 3.70 |
| Single Male/Father | 26 (6.3%) | 4.54 |
| Single Female/Mother | 86 (20.9%) | 5.30 |
| Non-family | 182 (44.2%) | 1.41 |
| Total Households | 412 (100.0%) | 3.08 |
Household Size by Marriage Status in Ellington
Out of a total of 412 households in Ellington, 230 (55.8%) are family households, while 182 (44.2%) are nonfamily households. The most numerous type of family households are 2-person households, comprising 87, and the most common type of nonfamily households are 1-person households, comprising 145.
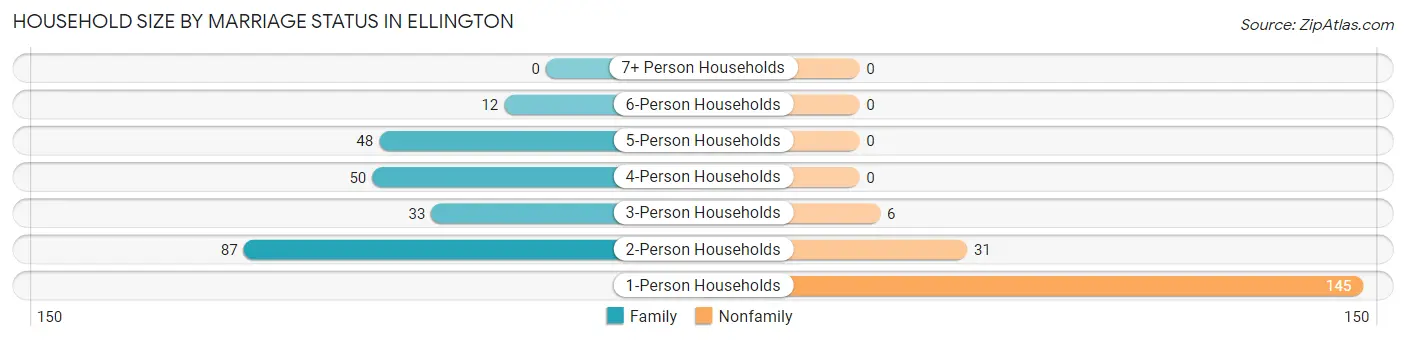
| Household Size | Family Households | Nonfamily Households |
| 1-Person Households | - | 145 (35.2%) |
| 2-Person Households | 87 (21.1%) | 31 (7.5%) |
| 3-Person Households | 33 (8.0%) | 6 (1.5%) |
| 4-Person Households | 50 (12.1%) | 0 (0.0%) |
| 5-Person Households | 48 (11.7%) | 0 (0.0%) |
| 6-Person Households | 12 (2.9%) | 0 (0.0%) |
| 7+ Person Households | 0 (0.0%) | 0 (0.0%) |
| Total | 230 (55.8%) | 182 (44.2%) |
Female Fertility in Ellington
Fertility by Age in Ellington
Average fertility rate in Ellington is 65.0 births per 1,000 women. Women in the age bracket of 35 to 50 years have the highest fertility rate with 76.0 births per 1,000 women. Women in the age bracket of 35 to 50 years acount for 54.5% of all women with births.
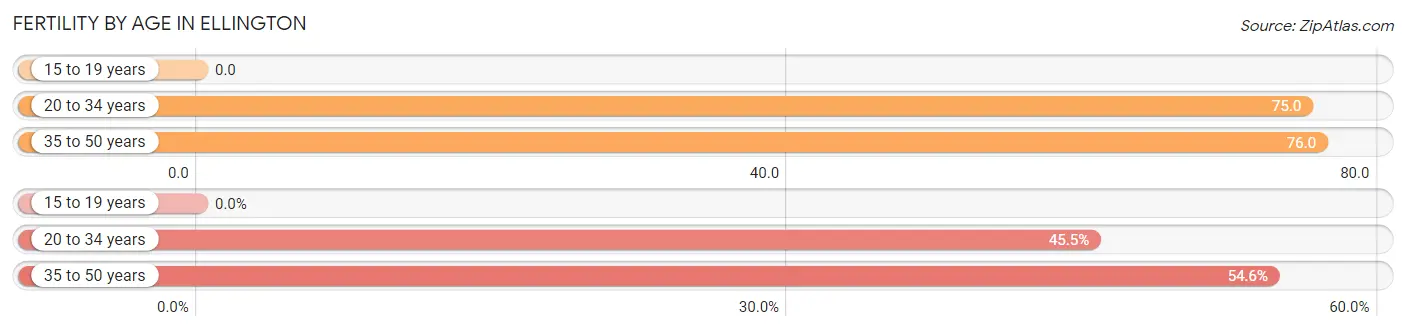
| Age Bracket | Women with Births | Births / 1,000 Women |
| 15 to 19 years | 0 (0.0%) | 0.0 |
| 20 to 34 years | 10 (45.5%) | 75.0 |
| 35 to 50 years | 12 (54.5%) | 76.0 |
| Total | 22 (100.0%) | 65.0 |
Fertility by Age by Marriage Status in Ellington
54.5% of women with births (22) in Ellington are married. The highest percentage of unmarried women with births falls into 20 to 34 years age bracket with 100.0% of them unmarried at the time of birth, while the lowest percentage of unmarried women with births belong to 35 to 50 years age bracket with 0.0% of them unmarried.
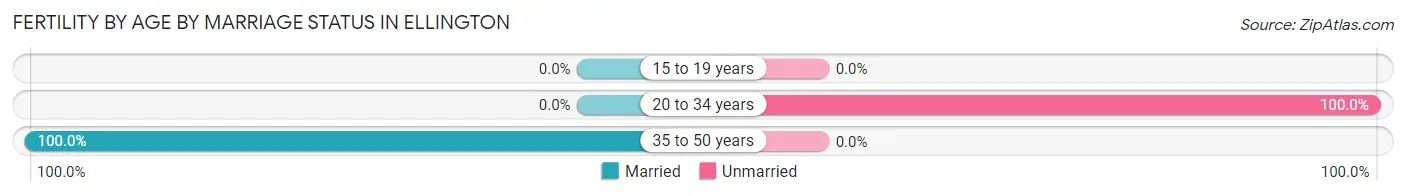
| Age Bracket | Married | Unmarried |
| 15 to 19 years | 0 (0.0%) | 0 (0.0%) |
| 20 to 34 years | 0 (0.0%) | 10 (100.0%) |
| 35 to 50 years | 12 (100.0%) | 0 (0.0%) |
| Total | 12 (54.5%) | 10 (45.5%) |
Fertility by Education in Ellington
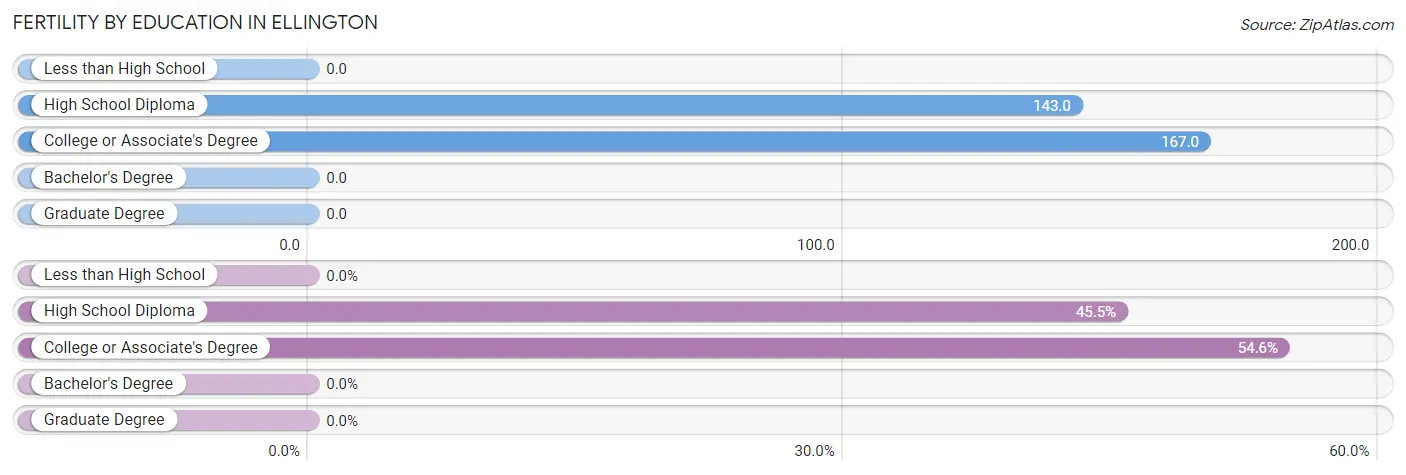
| Educational Attainment | Women with Births | Births / 1,000 Women |
| Less than High School | 0 (0.0%) | 0.0 |
| High School Diploma | 10 (45.5%) | 143.0 |
| College or Associate's Degree | 12 (54.5%) | 167.0 |
| Bachelor's Degree | 0 (0.0%) | 0.0 |
| Graduate Degree | 0 (0.0%) | 0.0 |
| Total | 22 (100.0%) | 65.0 |
Fertility by Education by Marriage Status in Ellington
45.5% of women with births in Ellington are unmarried. Women with the educational attainment of college or associate's degree are most likely to be married with 100.0% of them married at childbirth, while women with the educational attainment of high school diploma are least likely to be married with 100.0% of them unmarried at childbirth.
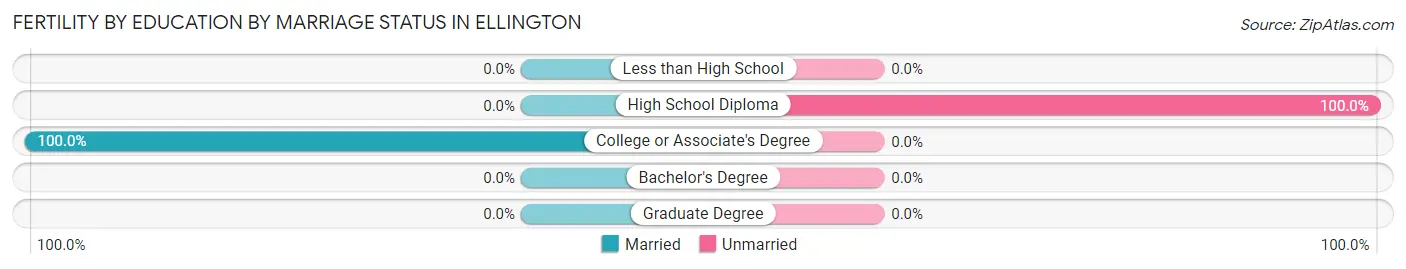
| Educational Attainment | Married | Unmarried |
| Less than High School | 0 (0.0%) | 0 (0.0%) |
| High School Diploma | 0 (0.0%) | 10 (100.0%) |
| College or Associate's Degree | 12 (100.0%) | 0 (0.0%) |
| Bachelor's Degree | 0 (0.0%) | 0 (0.0%) |
| Graduate Degree | 0 (0.0%) | 0 (0.0%) |
| Total | 12 (54.5%) | 10 (45.5%) |
Employment Characteristics in Ellington
Employment by Class of Employer in Ellington
Among the 437 employed individuals in Ellington, private company employees (290 | 66.4%), local government employees (56 | 12.8%), and not-for-profit organizations (31 | 7.1%) make up the most common classes of employment.
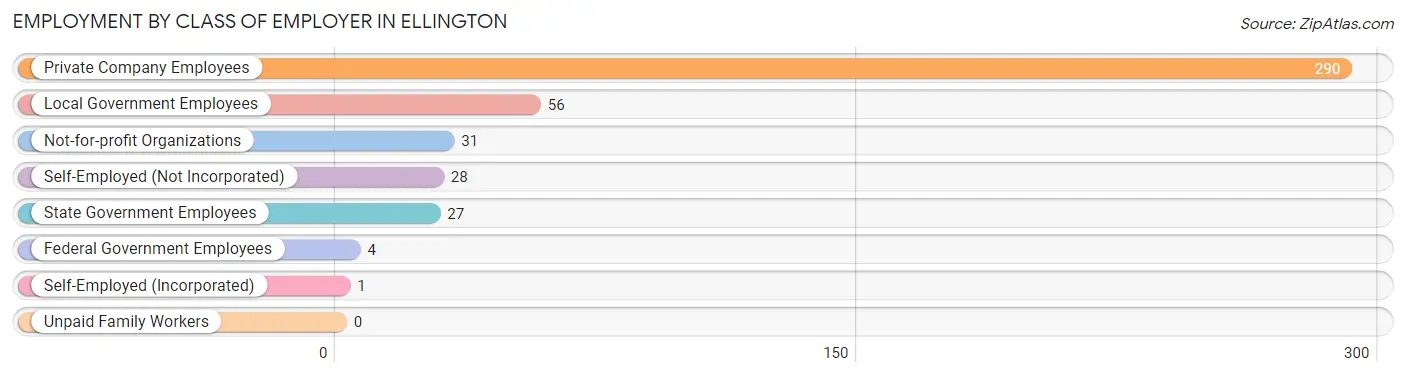
| Employer Class | # Employees | % Employees |
| Private Company Employees | 290 | 66.4% |
| Self-Employed (Incorporated) | 1 | 0.2% |
| Self-Employed (Not Incorporated) | 28 | 6.4% |
| Not-for-profit Organizations | 31 | 7.1% |
| Local Government Employees | 56 | 12.8% |
| State Government Employees | 27 | 6.2% |
| Federal Government Employees | 4 | 0.9% |
| Unpaid Family Workers | 0 | 0.0% |
| Total | 437 | 100.0% |
Employment Status by Age in Ellington
According to the labor force statistics for Ellington, out of the total population over 16 years of age (1,016), 59.1% or 600 individuals are in the labor force, with 26.2% or 157 of them unemployed. The age group with the highest labor force participation rate is 30 to 34 years, with 100.0% or 60 individuals in the labor force. Within the labor force, the 45 to 54 years age range has the highest percentage of unemployed individuals, with 61.7% or 103 of them being unemployed.
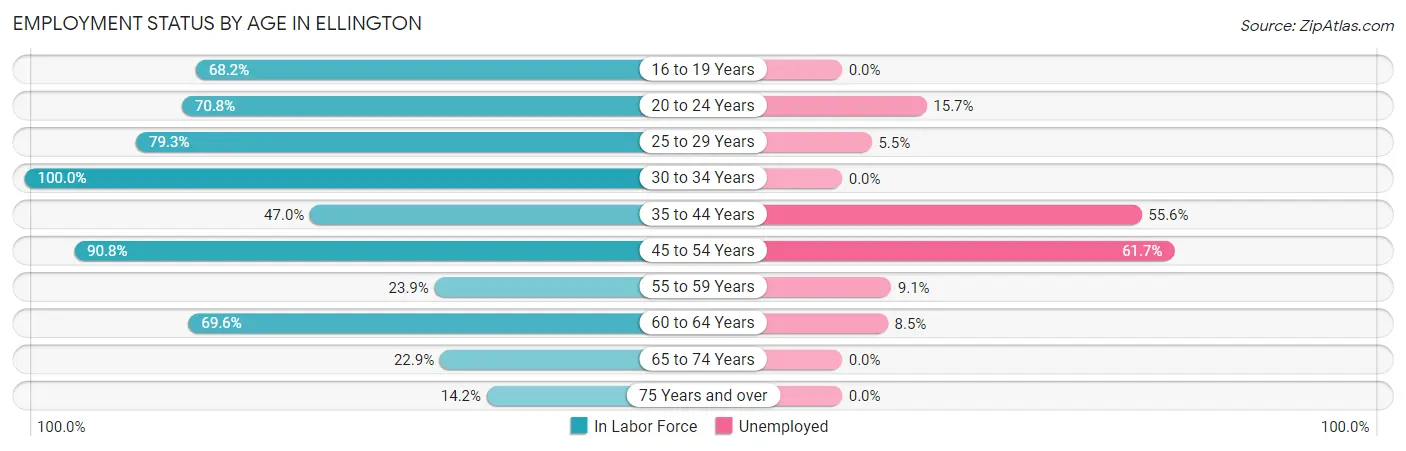
| Age Bracket | In Labor Force | Unemployed |
| 16 to 19 Years | 60 (68.2%) | 0 (0.0%) |
| 20 to 24 Years | 51 (70.8%) | 8 (15.7%) |
| 25 to 29 Years | 73 (79.3%) | 4 (5.5%) |
| 30 to 34 Years | 60 (100.0%) | 0 (0.0%) |
| 35 to 44 Years | 63 (47.0%) | 35 (55.6%) |
| 45 to 54 Years | 167 (90.8%) | 103 (61.7%) |
| 55 to 59 Years | 11 (23.9%) | 1 (9.1%) |
| 60 to 64 Years | 71 (69.6%) | 6 (8.5%) |
| 65 to 74 Years | 27 (22.9%) | 0 (0.0%) |
| 75 Years and over | 17 (14.2%) | 0 (0.0%) |
| Total | 600 (59.1%) | 157 (26.2%) |
Employment Status by Educational Attainment in Ellington
According to labor force statistics for Ellington, 72.0% of individuals (445) out of the total population between 25 and 64 years of age (618) are in the labor force, with 33.5% or 149 of them being unemployed. The group with the highest labor force participation rate are those with the educational attainment of less than high school, with 90.8% or 198 individuals in the labor force. Within the labor force, individuals with less than high school education have the highest percentage of unemployment, with 67.7% or 134 of them being unemployed.
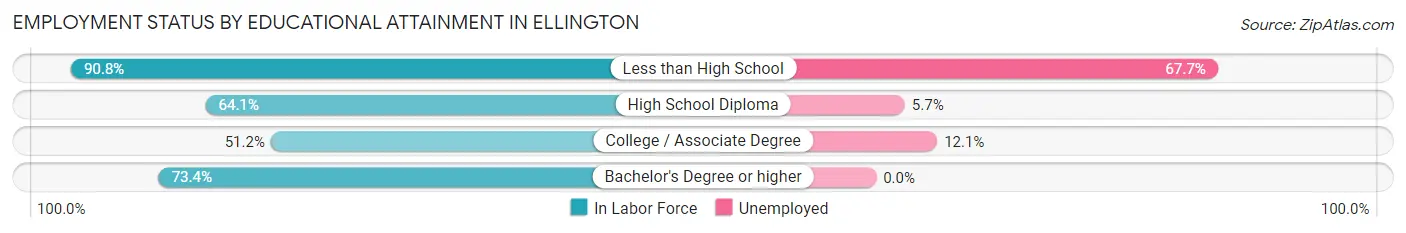
| Educational Attainment | In Labor Force | Unemployed |
| Less than High School | 198 (90.8%) | 148 (67.7%) |
| High School Diploma | 123 (64.1%) | 11 (5.7%) |
| College / Associate Degree | 66 (51.2%) | 16 (12.1%) |
| Bachelor's Degree or higher | 58 (73.4%) | 0 (0.0%) |
| Total | 445 (72.0%) | 207 (33.5%) |
Employment Occupations by Sex in Ellington
Management, Business, Science and Arts Occupations
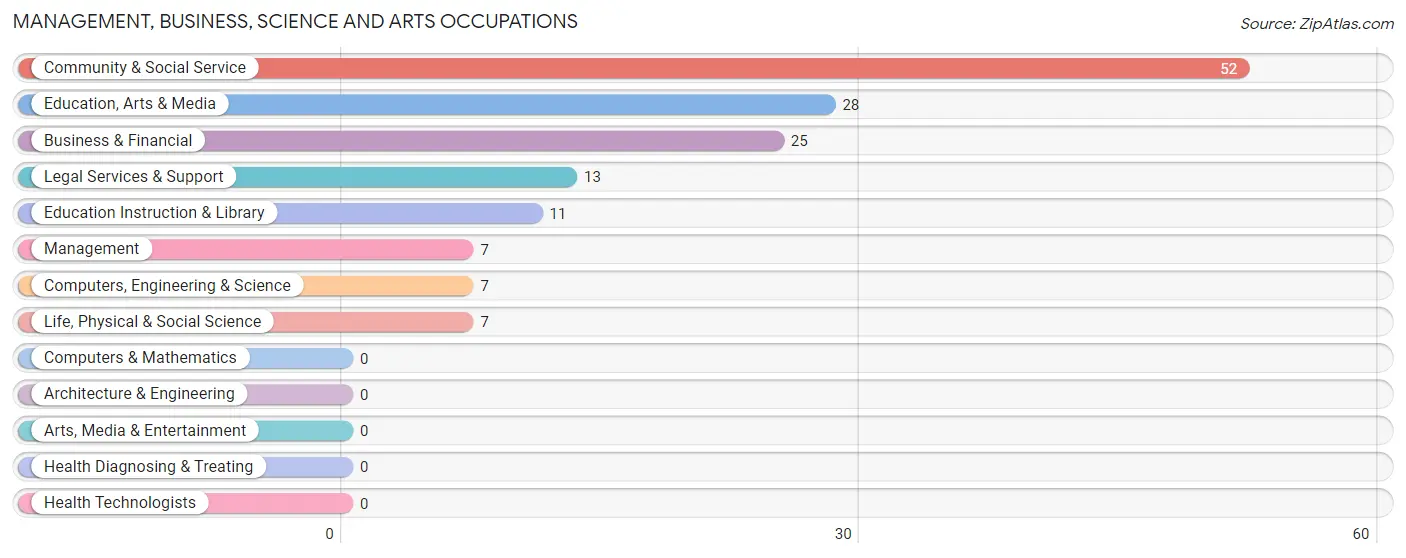
The most common Management, Business, Science and Arts occupations in Ellington are Community & Social Service (52 | 11.7%), Education, Arts & Media (28 | 6.3%), Business & Financial (25 | 5.6%), Legal Services & Support (13 | 2.9%), and Education Instruction & Library (11 | 2.5%).
Management, Business, Science and Arts Occupations by Sex
Within the Management, Business, Science and Arts occupations in Ellington, the most male-oriented occupations are Computers, Engineering & Science (71.4%), Life, Physical & Social Science (71.4%), and Education, Arts & Media (67.9%), while the most female-oriented occupations are Management (100.0%), Legal Services & Support (100.0%), and Business & Financial (84.0%).
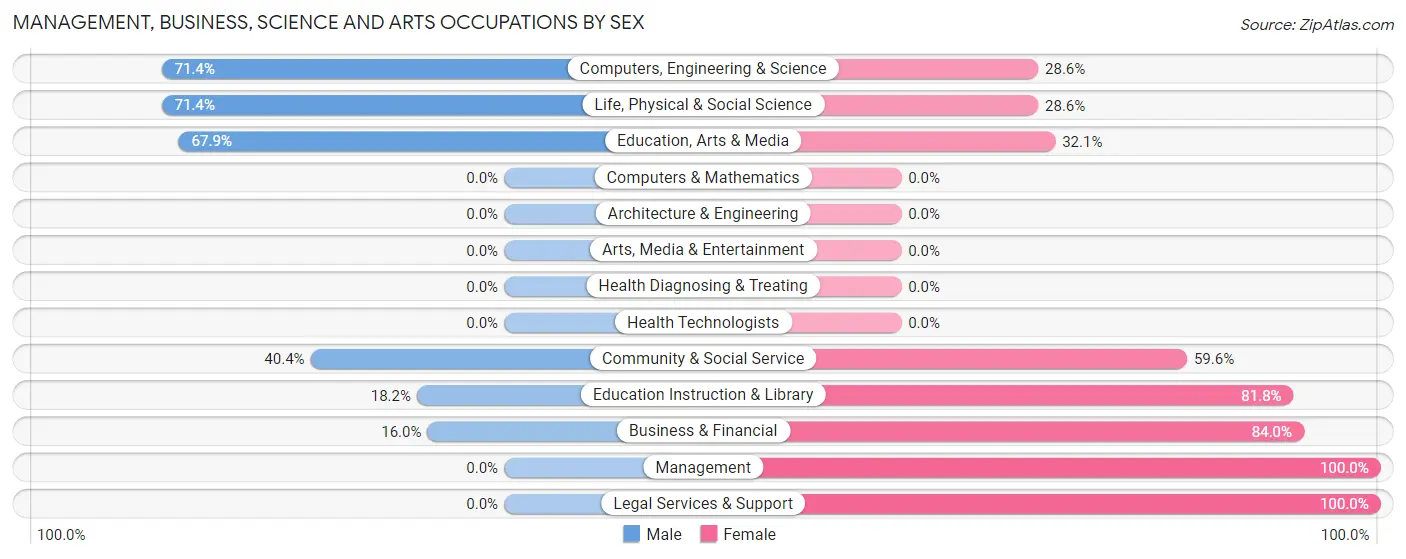
| Occupation | Male | Female |
| Management | 0 (0.0%) | 7 (100.0%) |
| Business & Financial | 4 (16.0%) | 21 (84.0%) |
| Computers, Engineering & Science | 5 (71.4%) | 2 (28.6%) |
| Computers & Mathematics | 0 (0.0%) | 0 (0.0%) |
| Architecture & Engineering | 0 (0.0%) | 0 (0.0%) |
| Life, Physical & Social Science | 5 (71.4%) | 2 (28.6%) |
| Community & Social Service | 21 (40.4%) | 31 (59.6%) |
| Education, Arts & Media | 19 (67.9%) | 9 (32.1%) |
| Legal Services & Support | 0 (0.0%) | 13 (100.0%) |
| Education Instruction & Library | 2 (18.2%) | 9 (81.8%) |
| Arts, Media & Entertainment | 0 (0.0%) | 0 (0.0%) |
| Health Diagnosing & Treating | 0 (0.0%) | 0 (0.0%) |
| Health Technologists | 0 (0.0%) | 0 (0.0%) |
| Total (Category) | 30 (33.0%) | 61 (67.0%) |
| Total (Overall) | 205 (46.3%) | 238 (53.7%) |
Services Occupations
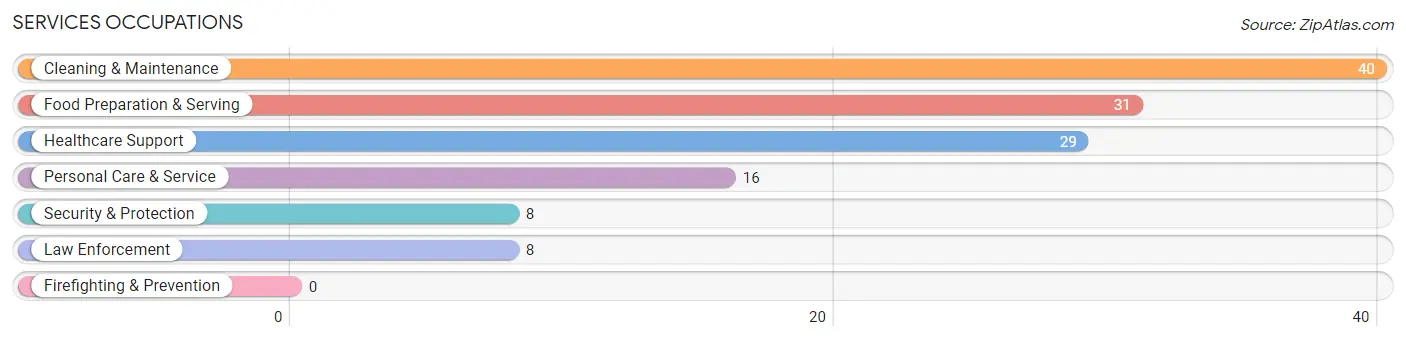
The most common Services occupations in Ellington are Cleaning & Maintenance (40 | 9.0%), Food Preparation & Serving (31 | 7.0%), Healthcare Support (29 | 6.6%), Personal Care & Service (16 | 3.6%), and Security & Protection (8 | 1.8%).
Services Occupations by Sex
Within the Services occupations in Ellington, the most male-oriented occupations are Cleaning & Maintenance (85.0%), Security & Protection (37.5%), and Law Enforcement (37.5%), while the most female-oriented occupations are Healthcare Support (100.0%), Food Preparation & Serving (100.0%), and Personal Care & Service (100.0%).
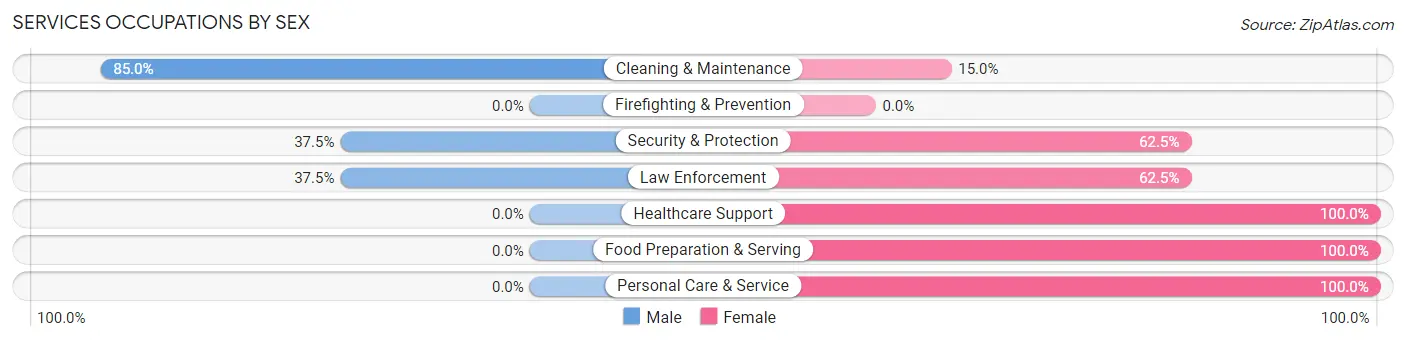
| Occupation | Male | Female |
| Healthcare Support | 0 (0.0%) | 29 (100.0%) |
| Security & Protection | 3 (37.5%) | 5 (62.5%) |
| Firefighting & Prevention | 0 (0.0%) | 0 (0.0%) |
| Law Enforcement | 3 (37.5%) | 5 (62.5%) |
| Food Preparation & Serving | 0 (0.0%) | 31 (100.0%) |
| Cleaning & Maintenance | 34 (85.0%) | 6 (15.0%) |
| Personal Care & Service | 0 (0.0%) | 16 (100.0%) |
| Total (Category) | 37 (29.8%) | 87 (70.2%) |
| Total (Overall) | 205 (46.3%) | 238 (53.7%) |
Sales and Office Occupations
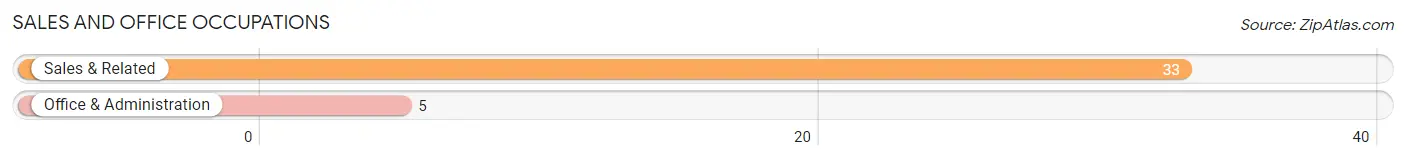
The most common Sales and Office occupations in Ellington are Sales & Related (33 | 7.4%), and Office & Administration (5 | 1.1%).
Sales and Office Occupations by Sex
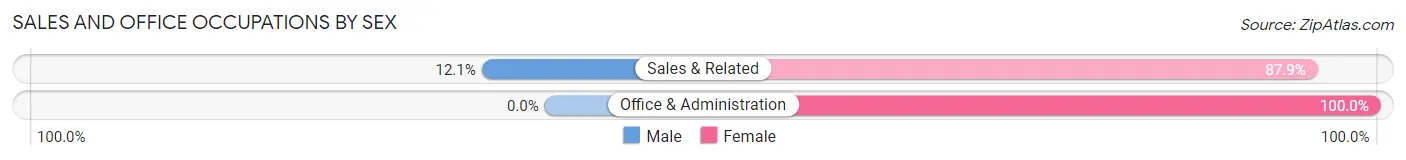
| Occupation | Male | Female |
| Sales & Related | 4 (12.1%) | 29 (87.9%) |
| Office & Administration | 0 (0.0%) | 5 (100.0%) |
| Total (Category) | 4 (10.5%) | 34 (89.5%) |
| Total (Overall) | 205 (46.3%) | 238 (53.7%) |
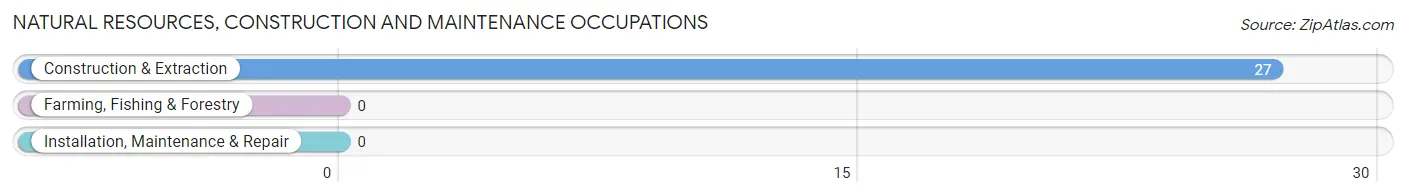
Natural Resources, Construction and Maintenance Occupations
The most common Natural Resources, Construction and Maintenance occupations in Ellington are , and Construction & Extraction (27 | 6.1%).
Natural Resources, Construction and Maintenance Occupations by Sex
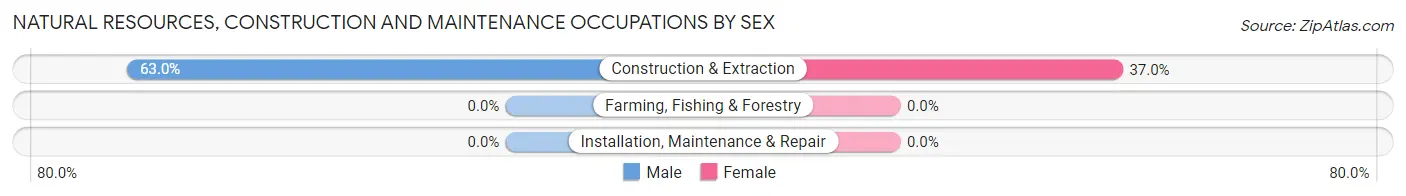
| Occupation | Male | Female |
| Farming, Fishing & Forestry | 0 (0.0%) | 0 (0.0%) |
| Construction & Extraction | 17 (63.0%) | 10 (37.0%) |
| Installation, Maintenance & Repair | 0 (0.0%) | 0 (0.0%) |
| Total (Category) | 17 (63.0%) | 10 (37.0%) |
| Total (Overall) | 205 (46.3%) | 238 (53.7%) |
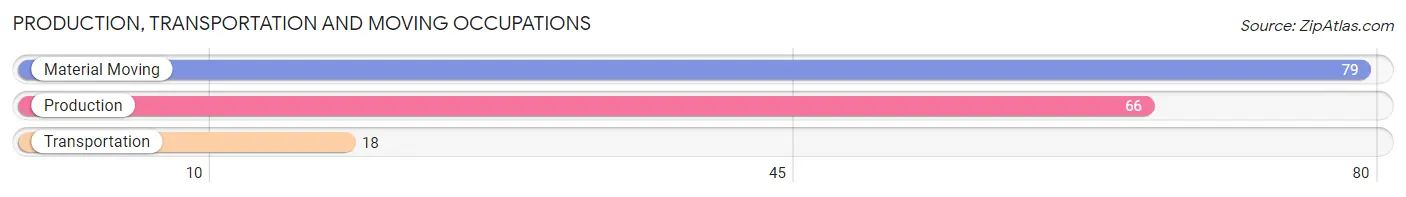
Production, Transportation and Moving Occupations
The most common Production, Transportation and Moving occupations in Ellington are Material Moving (79 | 17.8%), Production (66 | 14.9%), and Transportation (18 | 4.1%).
Production, Transportation and Moving Occupations by Sex
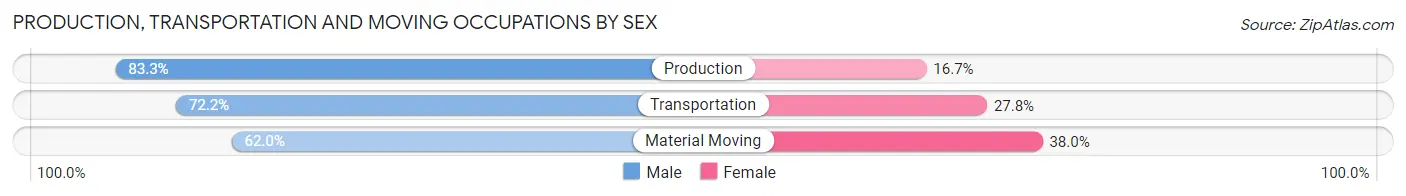
| Occupation | Male | Female |
| Production | 55 (83.3%) | 11 (16.7%) |
| Transportation | 13 (72.2%) | 5 (27.8%) |
| Material Moving | 49 (62.0%) | 30 (38.0%) |
| Total (Category) | 117 (71.8%) | 46 (28.2%) |
| Total (Overall) | 205 (46.3%) | 238 (53.7%) |
Employment Industries by Sex in Ellington
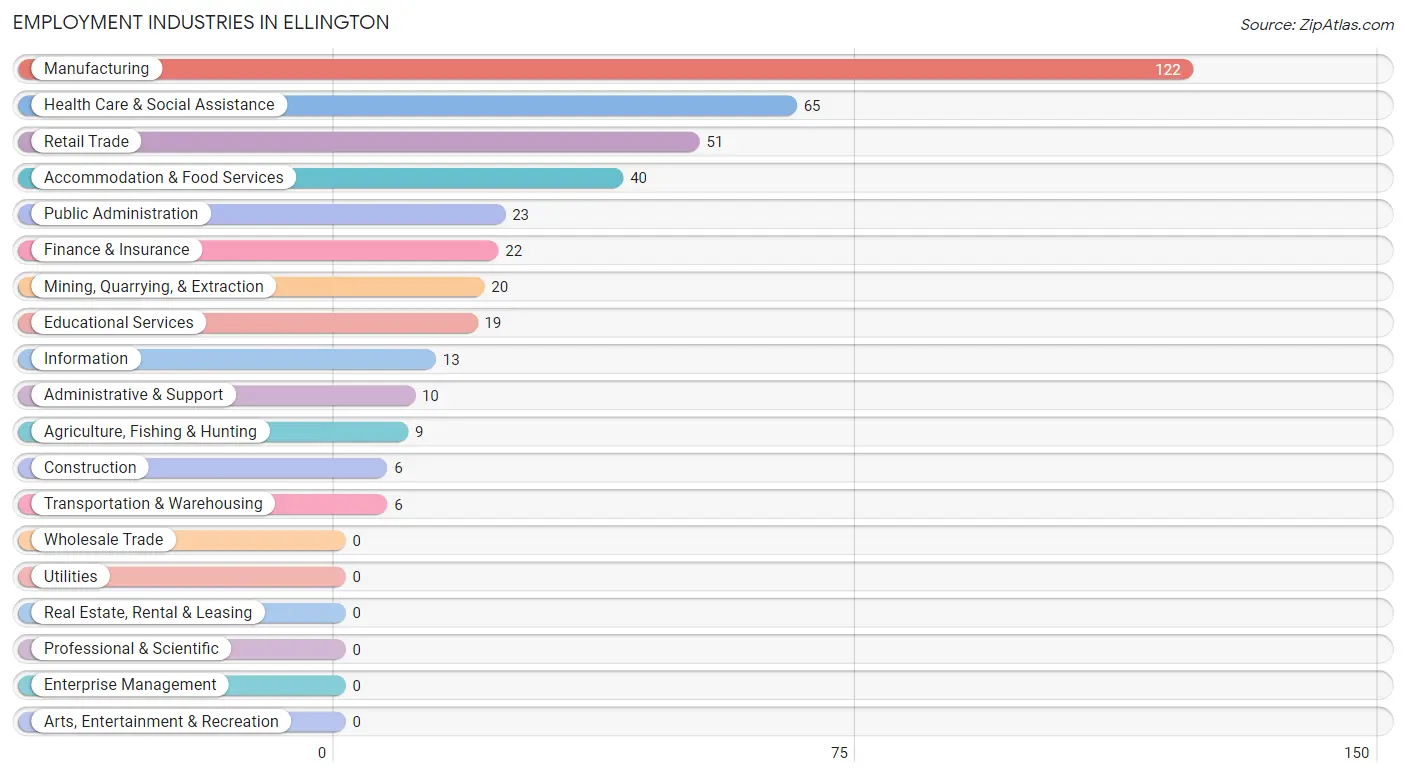
Employment Industries in Ellington
The major employment industries in Ellington include Manufacturing (122 | 27.5%), Health Care & Social Assistance (65 | 14.7%), Retail Trade (51 | 11.5%), Accommodation & Food Services (40 | 9.0%), and Public Administration (23 | 5.2%).
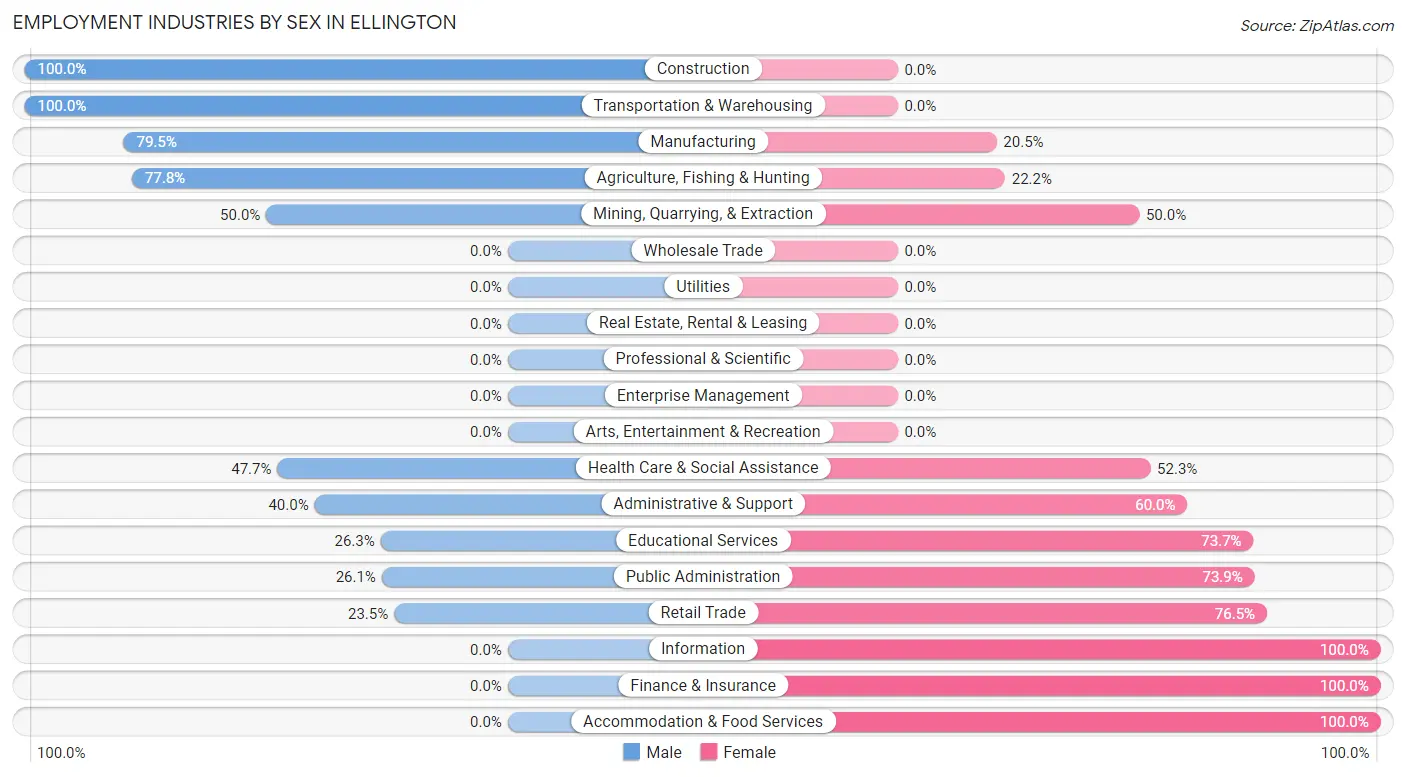
Employment Industries by Sex in Ellington
The Ellington industries that see more men than women are Construction (100.0%), Transportation & Warehousing (100.0%), and Manufacturing (79.5%), whereas the industries that tend to have a higher number of women are Information (100.0%), Finance & Insurance (100.0%), and Accommodation & Food Services (100.0%).
| Industry | Male | Female |
| Agriculture, Fishing & Hunting | 7 (77.8%) | 2 (22.2%) |
| Mining, Quarrying, & Extraction | 10 (50.0%) | 10 (50.0%) |
| Construction | 6 (100.0%) | 0 (0.0%) |
| Manufacturing | 97 (79.5%) | 25 (20.5%) |
| Wholesale Trade | 0 (0.0%) | 0 (0.0%) |
| Retail Trade | 12 (23.5%) | 39 (76.5%) |
| Transportation & Warehousing | 6 (100.0%) | 0 (0.0%) |
| Utilities | 0 (0.0%) | 0 (0.0%) |
| Information | 0 (0.0%) | 13 (100.0%) |
| Finance & Insurance | 0 (0.0%) | 22 (100.0%) |
| Real Estate, Rental & Leasing | 0 (0.0%) | 0 (0.0%) |
| Professional & Scientific | 0 (0.0%) | 0 (0.0%) |
| Enterprise Management | 0 (0.0%) | 0 (0.0%) |
| Administrative & Support | 4 (40.0%) | 6 (60.0%) |
| Educational Services | 5 (26.3%) | 14 (73.7%) |
| Health Care & Social Assistance | 31 (47.7%) | 34 (52.3%) |
| Arts, Entertainment & Recreation | 0 (0.0%) | 0 (0.0%) |
| Accommodation & Food Services | 0 (0.0%) | 40 (100.0%) |
| Public Administration | 6 (26.1%) | 17 (73.9%) |
| Total | 205 (46.3%) | 238 (53.7%) |
Education in Ellington
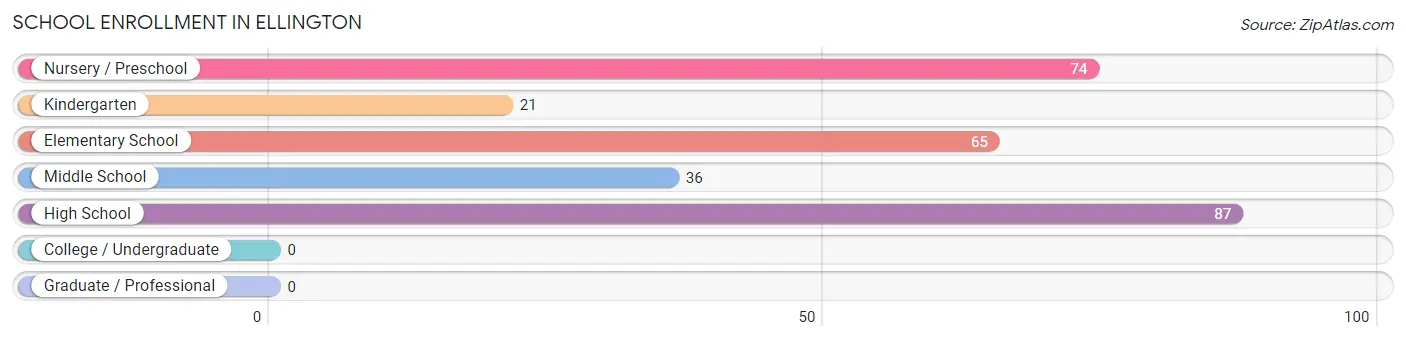
School Enrollment in Ellington
The most common levels of schooling among the 283 students in Ellington are high school (87 | 30.7%), nursery / preschool (74 | 26.2%), and elementary school (65 | 23.0%).
| School Level | # Students | % Students |
| Nursery / Preschool | 74 | 26.2% |
| Kindergarten | 21 | 7.4% |
| Elementary School | 65 | 23.0% |
| Middle School | 36 | 12.7% |
| High School | 87 | 30.7% |
| College / Undergraduate | 0 | 0.0% |
| Graduate / Professional | 0 | 0.0% |
| Total | 283 | 100.0% |
School Enrollment by Age by Funding Source in Ellington
Out of a total of 283 students who are enrolled in schools in Ellington, 31 (11.0%) attend a private institution, while the remaining 252 (89.0%) are enrolled in public schools. The age group of 18 to 19 year olds has the highest likelihood of being enrolled in private schools, with 14 (100.0% in the age bracket) enrolled. Conversely, the age group of 3 to 4 year olds has the lowest likelihood of being enrolled in a private school, with 71 (100.0% in the age bracket) attending a public institution.
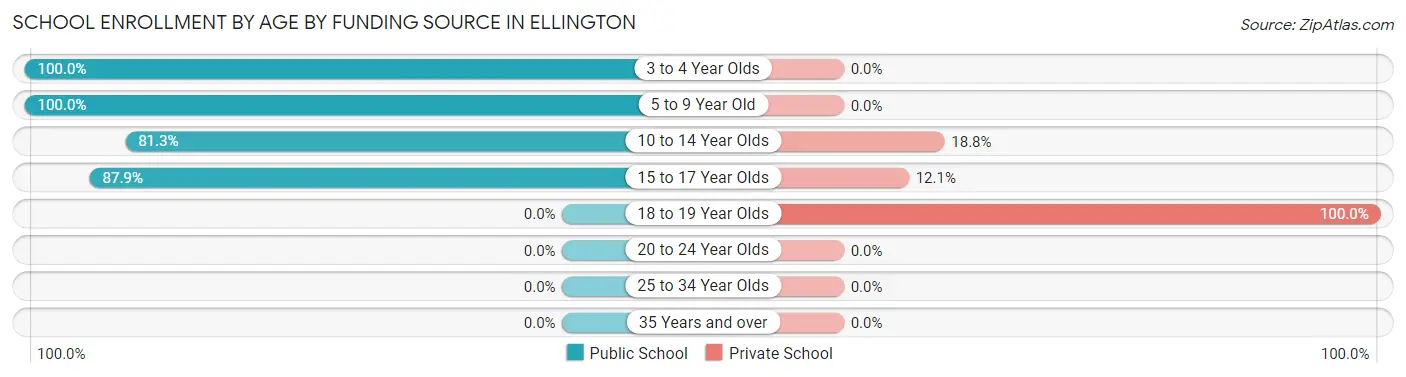
| Age Bracket | Public School | Private School |
| 3 to 4 Year Olds | 71 (100.0%) | 0 (0.0%) |
| 5 to 9 Year Old | 84 (100.0%) | 0 (0.0%) |
| 10 to 14 Year Olds | 39 (81.2%) | 9 (18.8%) |
| 15 to 17 Year Olds | 58 (87.9%) | 8 (12.1%) |
| 18 to 19 Year Olds | 0 (0.0%) | 14 (100.0%) |
| 20 to 24 Year Olds | 0 (0.0%) | 0 (0.0%) |
| 25 to 34 Year Olds | 0 (0.0%) | 0 (0.0%) |
| 35 Years and over | 0 (0.0%) | 0 (0.0%) |
| Total | 252 (89.0%) | 31 (11.0%) |
Educational Attainment by Field of Study in Ellington
Business (46 | 39.3%), education (27 | 23.1%), psychology (13 | 11.1%), bio, nature & agricultural (12 | 10.3%), and physical & health sciences (7 | 6.0%) are the most common fields of study among 117 individuals in Ellington who have obtained a bachelor's degree or higher.
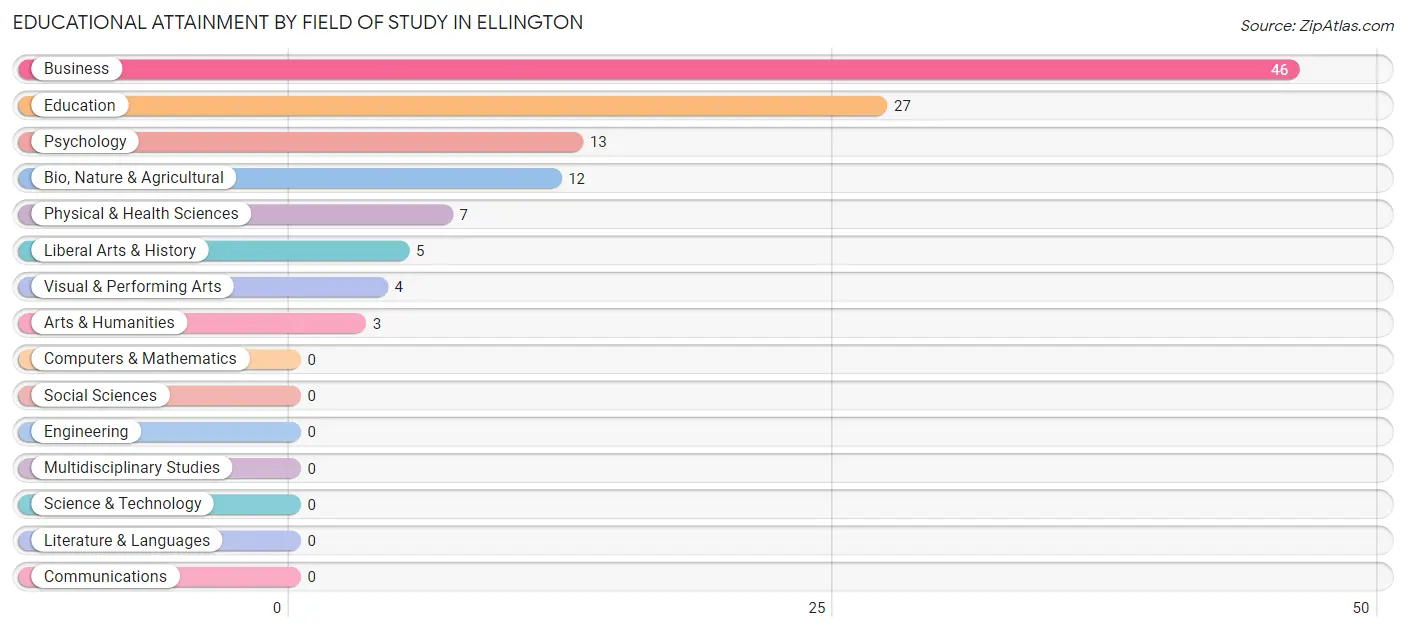
| Field of Study | # Graduates | % Graduates |
| Computers & Mathematics | 0 | 0.0% |
| Bio, Nature & Agricultural | 12 | 10.3% |
| Physical & Health Sciences | 7 | 6.0% |
| Psychology | 13 | 11.1% |
| Social Sciences | 0 | 0.0% |
| Engineering | 0 | 0.0% |
| Multidisciplinary Studies | 0 | 0.0% |
| Science & Technology | 0 | 0.0% |
| Business | 46 | 39.3% |
| Education | 27 | 23.1% |
| Literature & Languages | 0 | 0.0% |
| Liberal Arts & History | 5 | 4.3% |
| Visual & Performing Arts | 4 | 3.4% |
| Communications | 0 | 0.0% |
| Arts & Humanities | 3 | 2.6% |
| Total | 117 | 100.0% |
Transportation & Commute in Ellington
Vehicle Availability by Sex in Ellington
The most prevalent vehicle ownership categories in Ellington are males with 2 vehicles (69, accounting for 33.7%) and females with 2 vehicles (55, making up 29.7%).
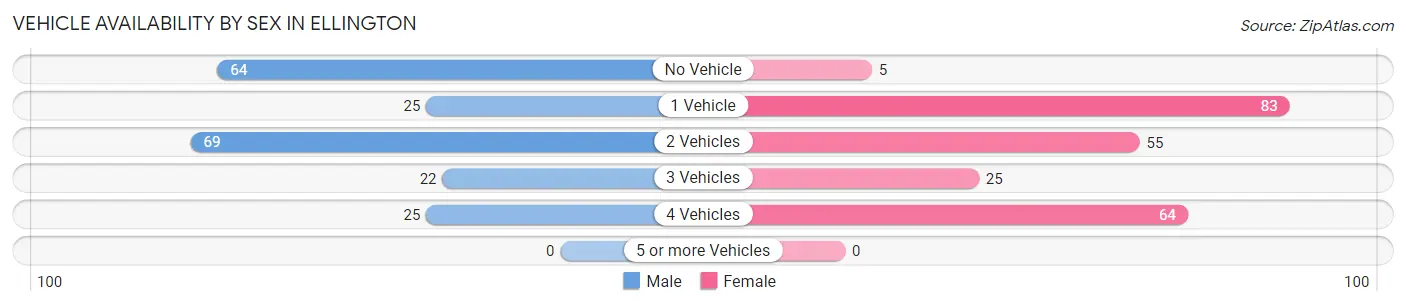
| Vehicles Available | Male | Female |
| No Vehicle | 64 (31.2%) | 5 (2.2%) |
| 1 Vehicle | 25 (12.2%) | 83 (35.8%) |
| 2 Vehicles | 69 (33.7%) | 55 (23.7%) |
| 3 Vehicles | 22 (10.7%) | 25 (10.8%) |
| 4 Vehicles | 25 (12.2%) | 64 (27.6%) |
| 5 or more Vehicles | 0 (0.0%) | 0 (0.0%) |
| Total | 205 (100.0%) | 232 (100.0%) |
Commute Time in Ellington
The most frequently occuring commute durations in Ellington are 5 to 9 minutes (102 commuters, 24.5%), less than 5 minutes (83 commuters, 19.9%), and 10 to 14 minutes (61 commuters, 14.6%).
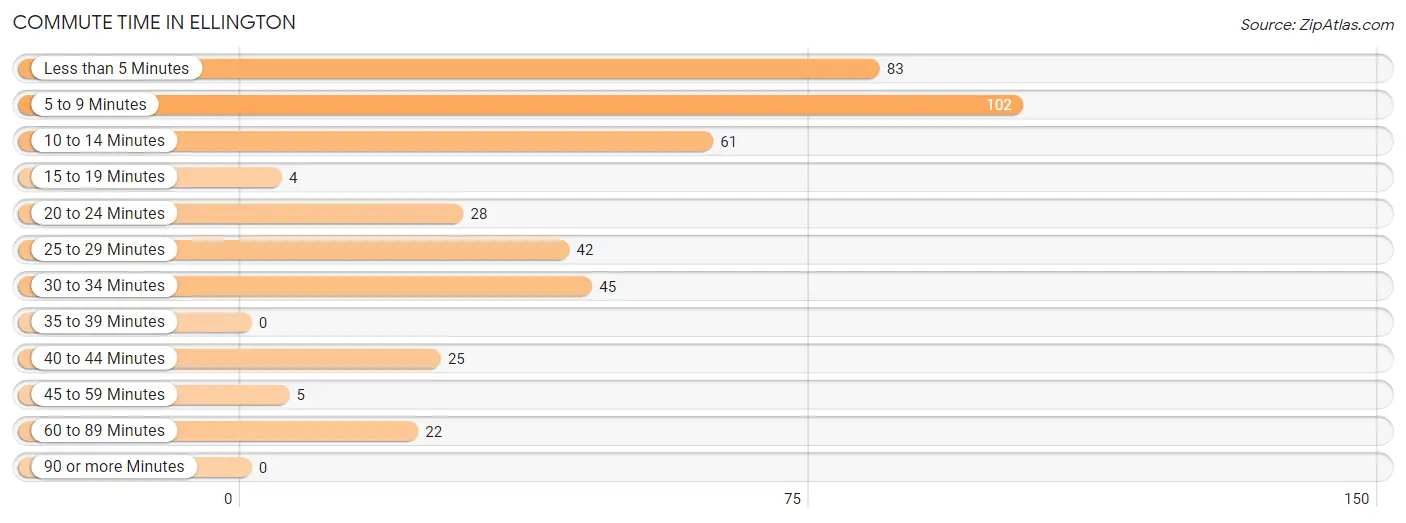
| Commute Time | # Commuters | % Commuters |
| Less than 5 Minutes | 83 | 19.9% |
| 5 to 9 Minutes | 102 | 24.5% |
| 10 to 14 Minutes | 61 | 14.6% |
| 15 to 19 Minutes | 4 | 1.0% |
| 20 to 24 Minutes | 28 | 6.7% |
| 25 to 29 Minutes | 42 | 10.1% |
| 30 to 34 Minutes | 45 | 10.8% |
| 35 to 39 Minutes | 0 | 0.0% |
| 40 to 44 Minutes | 25 | 6.0% |
| 45 to 59 Minutes | 5 | 1.2% |
| 60 to 89 Minutes | 22 | 5.3% |
| 90 or more Minutes | 0 | 0.0% |
Commute Time by Sex in Ellington
The most common commute times in Ellington are 10 to 14 minutes (50 commuters, 24.9%) for males and less than 5 minutes (69 commuters, 31.9%) for females.
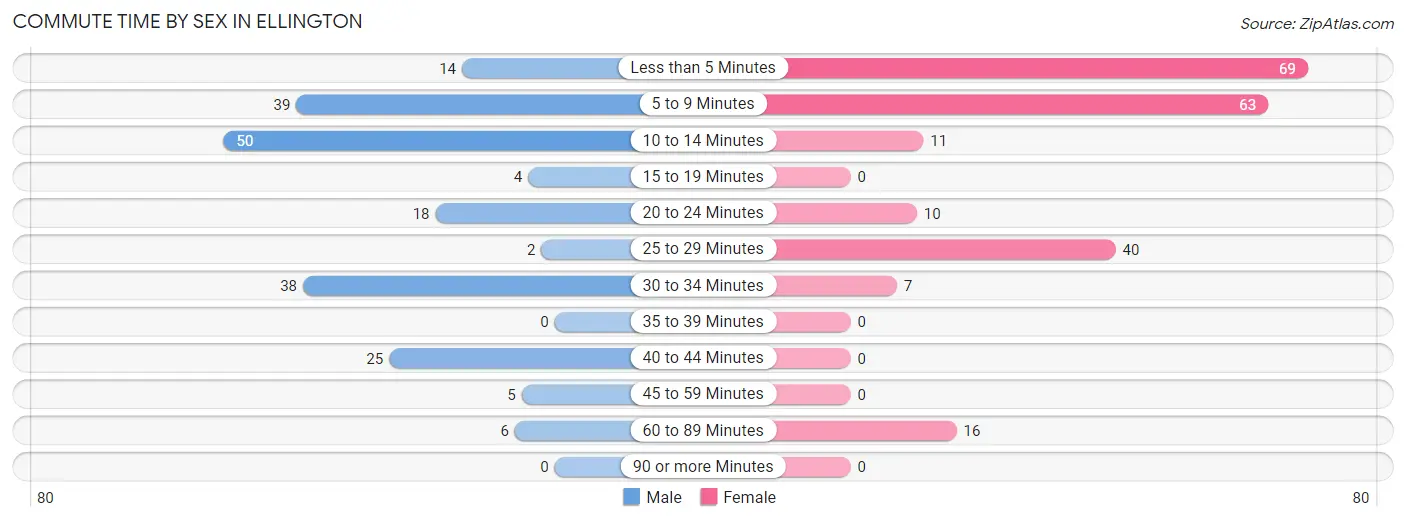
| Commute Time | Male | Female |
| Less than 5 Minutes | 14 (7.0%) | 69 (31.9%) |
| 5 to 9 Minutes | 39 (19.4%) | 63 (29.2%) |
| 10 to 14 Minutes | 50 (24.9%) | 11 (5.1%) |
| 15 to 19 Minutes | 4 (2.0%) | 0 (0.0%) |
| 20 to 24 Minutes | 18 (9.0%) | 10 (4.6%) |
| 25 to 29 Minutes | 2 (1.0%) | 40 (18.5%) |
| 30 to 34 Minutes | 38 (18.9%) | 7 (3.2%) |
| 35 to 39 Minutes | 0 (0.0%) | 0 (0.0%) |
| 40 to 44 Minutes | 25 (12.4%) | 0 (0.0%) |
| 45 to 59 Minutes | 5 (2.5%) | 0 (0.0%) |
| 60 to 89 Minutes | 6 (3.0%) | 16 (7.4%) |
| 90 or more Minutes | 0 (0.0%) | 0 (0.0%) |
Time of Departure to Work by Sex in Ellington
The most frequent times of departure to work in Ellington are 6:00 AM to 6:29 AM (69, 34.3%) for males and 6:30 AM to 6:59 AM (65, 30.1%) for females.
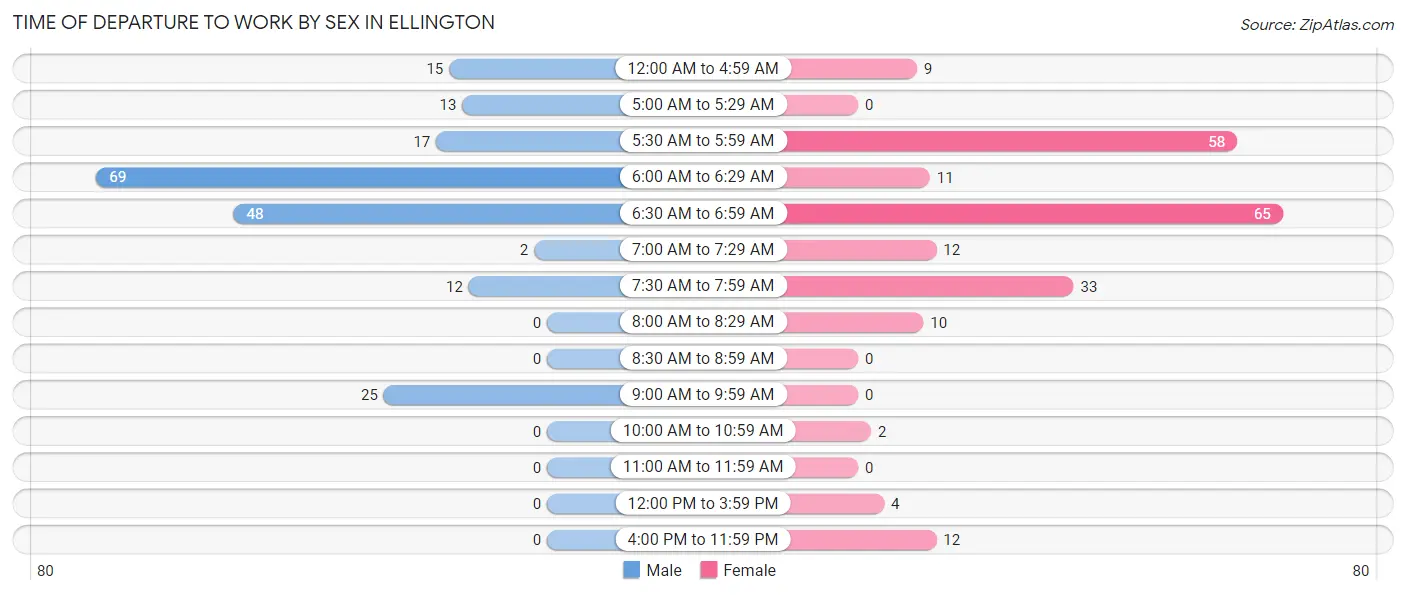
| Time of Departure | Male | Female |
| 12:00 AM to 4:59 AM | 15 (7.5%) | 9 (4.2%) |
| 5:00 AM to 5:29 AM | 13 (6.5%) | 0 (0.0%) |
| 5:30 AM to 5:59 AM | 17 (8.5%) | 58 (26.9%) |
| 6:00 AM to 6:29 AM | 69 (34.3%) | 11 (5.1%) |
| 6:30 AM to 6:59 AM | 48 (23.9%) | 65 (30.1%) |
| 7:00 AM to 7:29 AM | 2 (1.0%) | 12 (5.6%) |
| 7:30 AM to 7:59 AM | 12 (6.0%) | 33 (15.3%) |
| 8:00 AM to 8:29 AM | 0 (0.0%) | 10 (4.6%) |
| 8:30 AM to 8:59 AM | 0 (0.0%) | 0 (0.0%) |
| 9:00 AM to 9:59 AM | 25 (12.4%) | 0 (0.0%) |
| 10:00 AM to 10:59 AM | 0 (0.0%) | 2 (0.9%) |
| 11:00 AM to 11:59 AM | 0 (0.0%) | 0 (0.0%) |
| 12:00 PM to 3:59 PM | 0 (0.0%) | 4 (1.8%) |
| 4:00 PM to 11:59 PM | 0 (0.0%) | 12 (5.6%) |
| Total | 201 (100.0%) | 216 (100.0%) |
Housing Occupancy in Ellington
Occupancy by Ownership in Ellington
Of the total 412 dwellings in Ellington, owner-occupied units account for 230 (55.8%), while renter-occupied units make up 182 (44.2%).
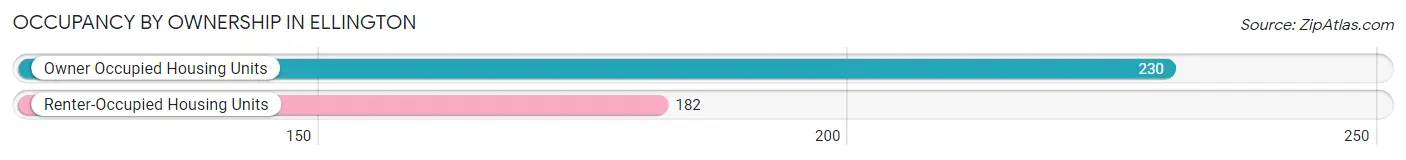
| Occupancy | # Housing Units | % Housing Units |
| Owner Occupied Housing Units | 230 | 55.8% |
| Renter-Occupied Housing Units | 182 | 44.2% |
| Total Occupied Housing Units | 412 | 100.0% |
Occupancy by Household Size in Ellington
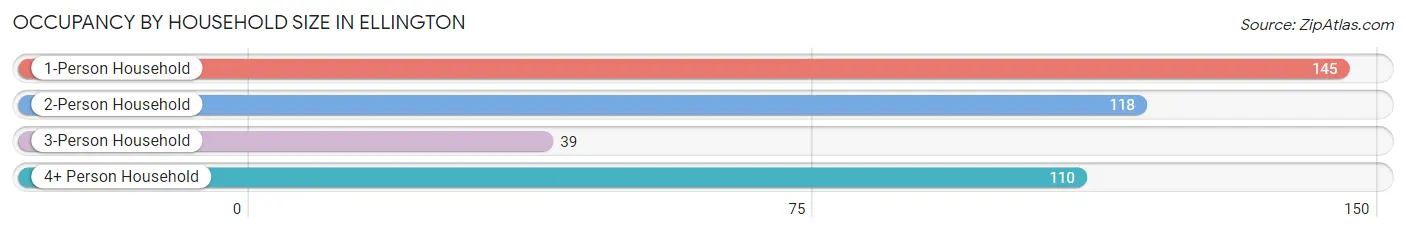
| Household Size | # Housing Units | % Housing Units |
| 1-Person Household | 145 | 35.2% |
| 2-Person Household | 118 | 28.6% |
| 3-Person Household | 39 | 9.5% |
| 4+ Person Household | 110 | 26.7% |
| Total Housing Units | 412 | 100.0% |
Occupancy by Ownership by Household Size in Ellington
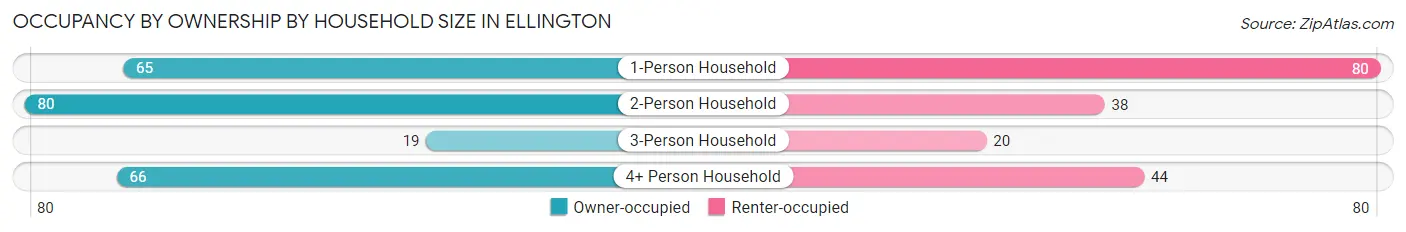
| Household Size | Owner-occupied | Renter-occupied |
| 1-Person Household | 65 (44.8%) | 80 (55.2%) |
| 2-Person Household | 80 (67.8%) | 38 (32.2%) |
| 3-Person Household | 19 (48.7%) | 20 (51.3%) |
| 4+ Person Household | 66 (60.0%) | 44 (40.0%) |
| Total Housing Units | 230 (55.8%) | 182 (44.2%) |
Occupancy by Educational Attainment in Ellington
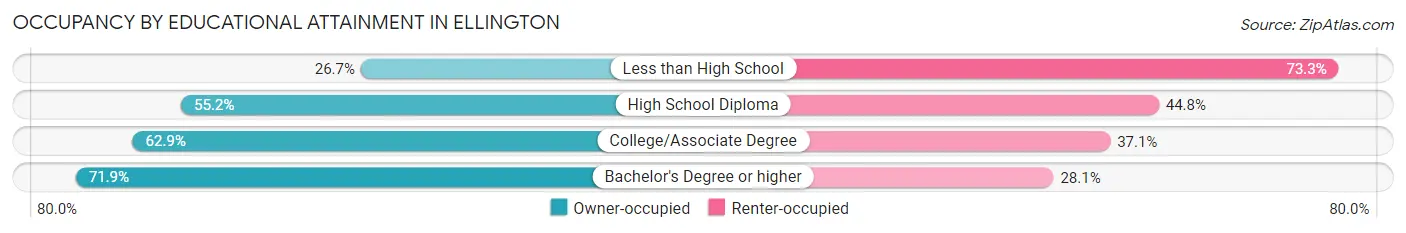
| Household Size | Owner-occupied | Renter-occupied |
| Less than High School | 12 (26.7%) | 33 (73.3%) |
| High School Diploma | 112 (55.2%) | 91 (44.8%) |
| College/Associate Degree | 83 (62.9%) | 49 (37.1%) |
| Bachelor's Degree or higher | 23 (71.9%) | 9 (28.1%) |
Occupancy by Age of Householder in Ellington
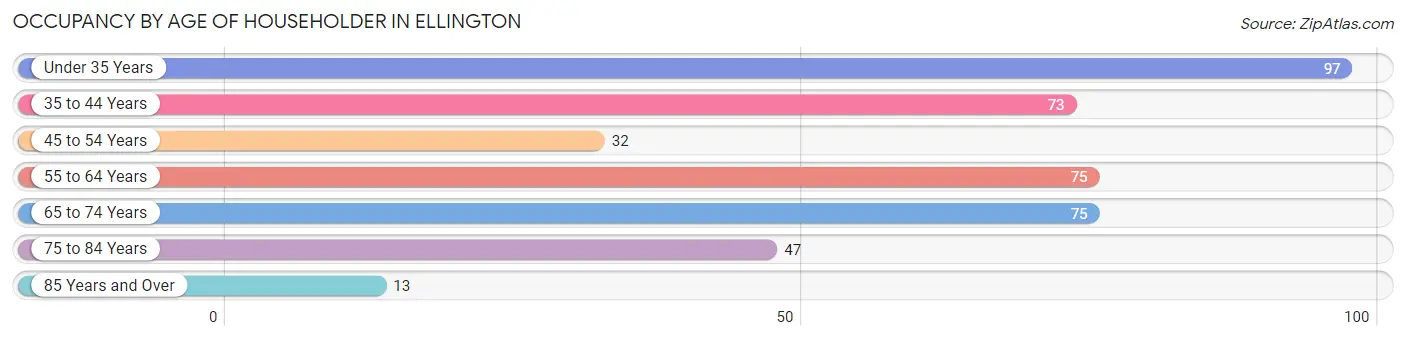
| Age Bracket | # Households | % Households |
| Under 35 Years | 97 | 23.5% |
| 35 to 44 Years | 73 | 17.7% |
| 45 to 54 Years | 32 | 7.8% |
| 55 to 64 Years | 75 | 18.2% |
| 65 to 74 Years | 75 | 18.2% |
| 75 to 84 Years | 47 | 11.4% |
| 85 Years and Over | 13 | 3.2% |
| Total | 412 | 100.0% |
Housing Finances in Ellington
Median Income by Occupancy in Ellington
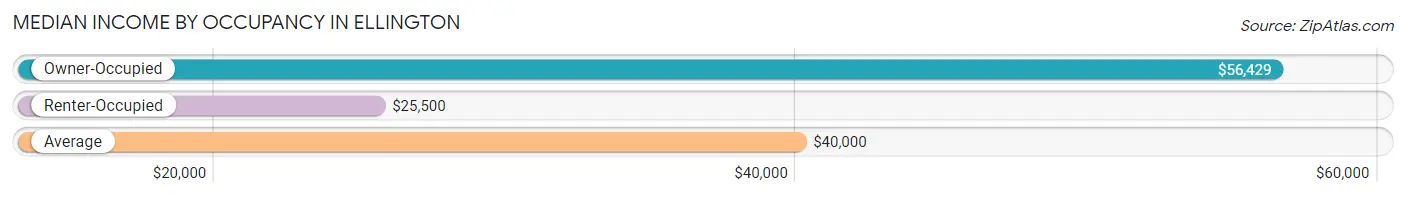
| Occupancy Type | # Households | Median Income |
| Owner-Occupied | 230 (55.8%) | $56,429 |
| Renter-Occupied | 182 (44.2%) | $25,500 |
| Average | 412 (100.0%) | $40,000 |
Occupancy by Householder Income Bracket in Ellington
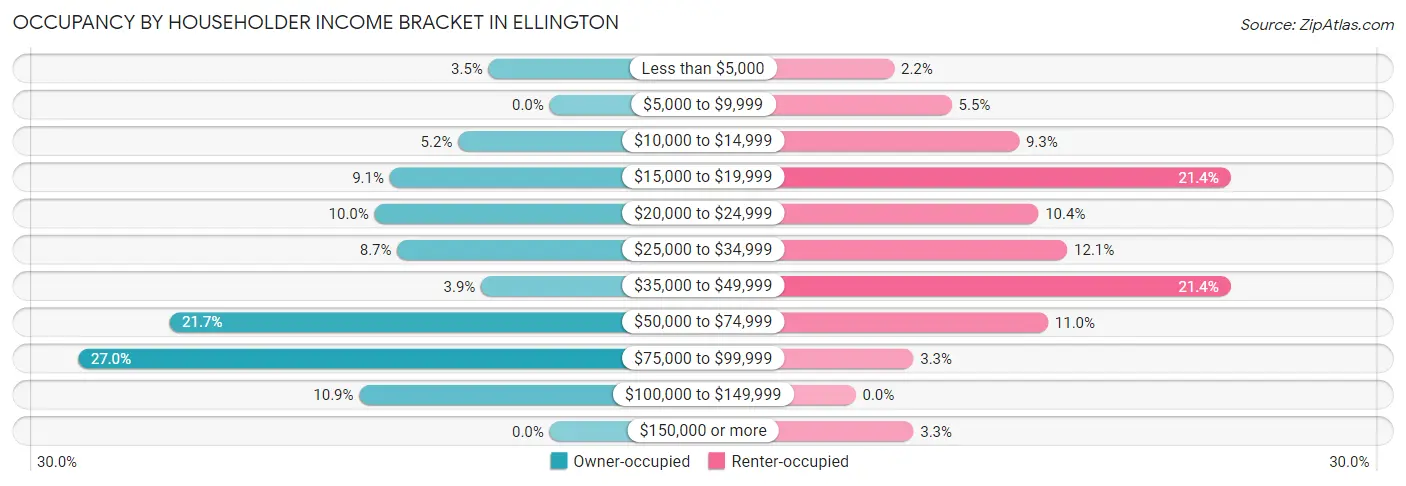
| Income Bracket | Owner-occupied | Renter-occupied |
| Less than $5,000 | 8 (3.5%) | 4 (2.2%) |
| $5,000 to $9,999 | 0 (0.0%) | 10 (5.5%) |
| $10,000 to $14,999 | 12 (5.2%) | 17 (9.3%) |
| $15,000 to $19,999 | 21 (9.1%) | 39 (21.4%) |
| $20,000 to $24,999 | 23 (10.0%) | 19 (10.4%) |
| $25,000 to $34,999 | 20 (8.7%) | 22 (12.1%) |
| $35,000 to $49,999 | 9 (3.9%) | 39 (21.4%) |
| $50,000 to $74,999 | 50 (21.7%) | 20 (11.0%) |
| $75,000 to $99,999 | 62 (27.0%) | 6 (3.3%) |
| $100,000 to $149,999 | 25 (10.9%) | 0 (0.0%) |
| $150,000 or more | 0 (0.0%) | 6 (3.3%) |
| Total | 230 (100.0%) | 182 (100.0%) |
Monthly Housing Cost Tiers in Ellington
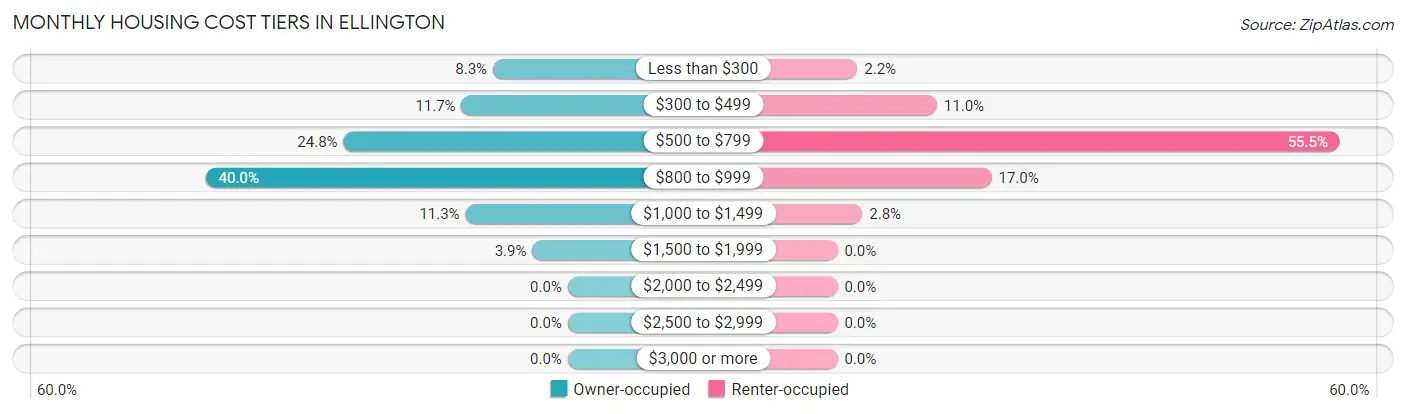
| Monthly Cost | Owner-occupied | Renter-occupied |
| Less than $300 | 19 (8.3%) | 4 (2.2%) |
| $300 to $499 | 27 (11.7%) | 20 (11.0%) |
| $500 to $799 | 57 (24.8%) | 101 (55.5%) |
| $800 to $999 | 92 (40.0%) | 31 (17.0%) |
| $1,000 to $1,499 | 26 (11.3%) | 5 (2.8%) |
| $1,500 to $1,999 | 9 (3.9%) | 0 (0.0%) |
| $2,000 to $2,499 | 0 (0.0%) | 0 (0.0%) |
| $2,500 to $2,999 | 0 (0.0%) | 0 (0.0%) |
| $3,000 or more | 0 (0.0%) | 0 (0.0%) |
| Total | 230 (100.0%) | 182 (100.0%) |
Physical Housing Characteristics in Ellington
Housing Structures in Ellington
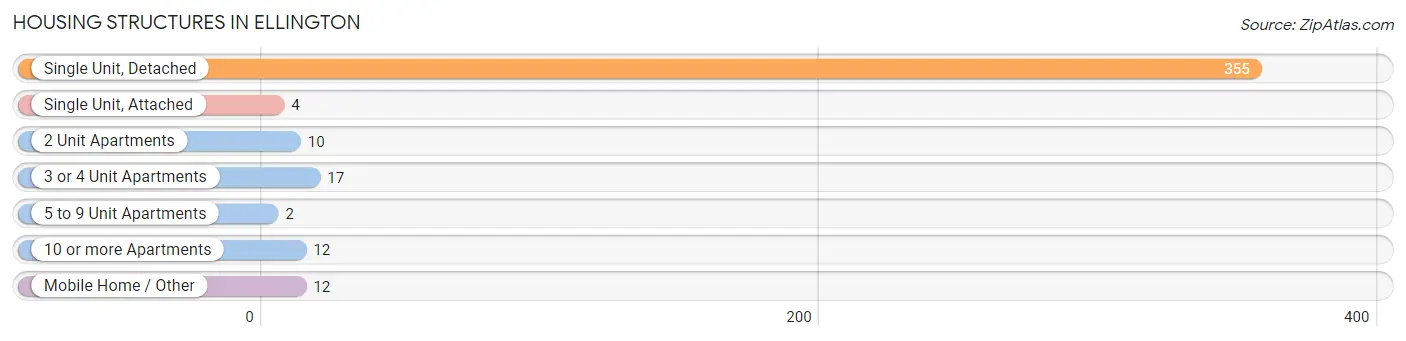
| Structure Type | # Housing Units | % Housing Units |
| Single Unit, Detached | 355 | 86.2% |
| Single Unit, Attached | 4 | 1.0% |
| 2 Unit Apartments | 10 | 2.4% |
| 3 or 4 Unit Apartments | 17 | 4.1% |
| 5 to 9 Unit Apartments | 2 | 0.5% |
| 10 or more Apartments | 12 | 2.9% |
| Mobile Home / Other | 12 | 2.9% |
| Total | 412 | 100.0% |
Housing Structures by Occupancy in Ellington
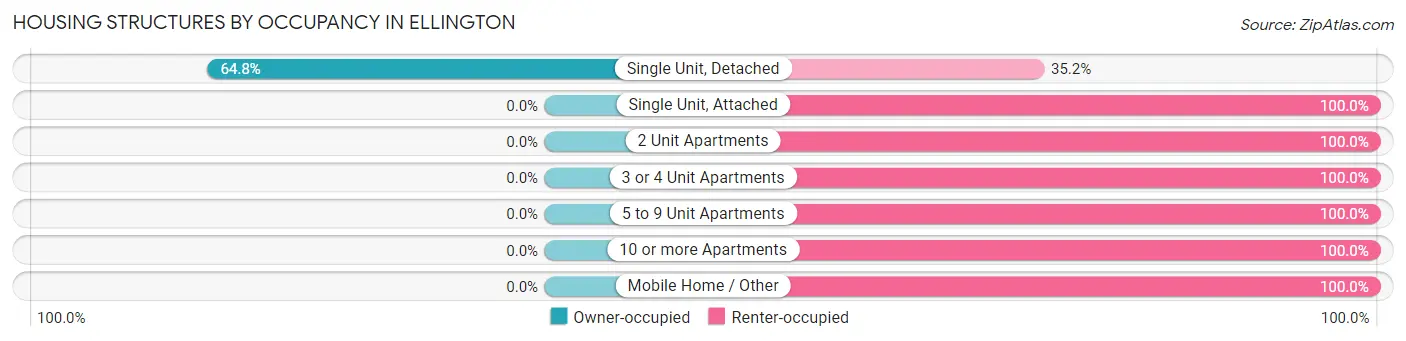
| Structure Type | Owner-occupied | Renter-occupied |
| Single Unit, Detached | 230 (64.8%) | 125 (35.2%) |
| Single Unit, Attached | 0 (0.0%) | 4 (100.0%) |
| 2 Unit Apartments | 0 (0.0%) | 10 (100.0%) |
| 3 or 4 Unit Apartments | 0 (0.0%) | 17 (100.0%) |
| 5 to 9 Unit Apartments | 0 (0.0%) | 2 (100.0%) |
| 10 or more Apartments | 0 (0.0%) | 12 (100.0%) |
| Mobile Home / Other | 0 (0.0%) | 12 (100.0%) |
| Total | 230 (55.8%) | 182 (44.2%) |
Housing Structures by Number of Rooms in Ellington
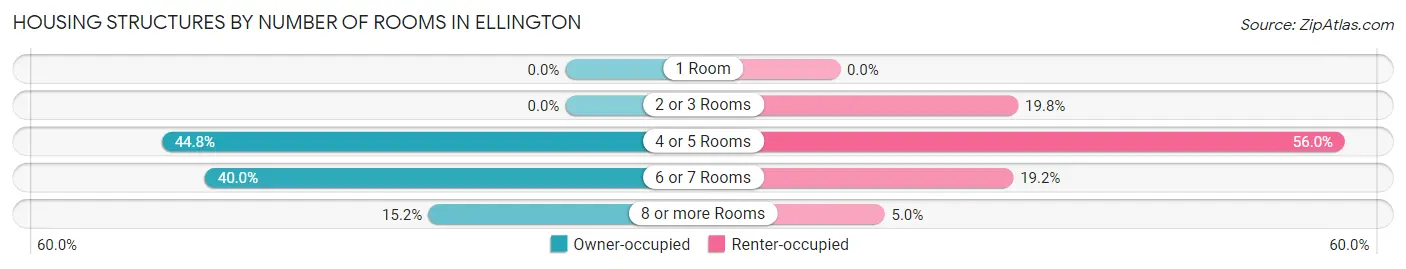
| Number of Rooms | Owner-occupied | Renter-occupied |
| 1 Room | 0 (0.0%) | 0 (0.0%) |
| 2 or 3 Rooms | 0 (0.0%) | 36 (19.8%) |
| 4 or 5 Rooms | 103 (44.8%) | 102 (56.0%) |
| 6 or 7 Rooms | 92 (40.0%) | 35 (19.2%) |
| 8 or more Rooms | 35 (15.2%) | 9 (5.0%) |
| Total | 230 (100.0%) | 182 (100.0%) |
Housing Structure by Heating Type in Ellington
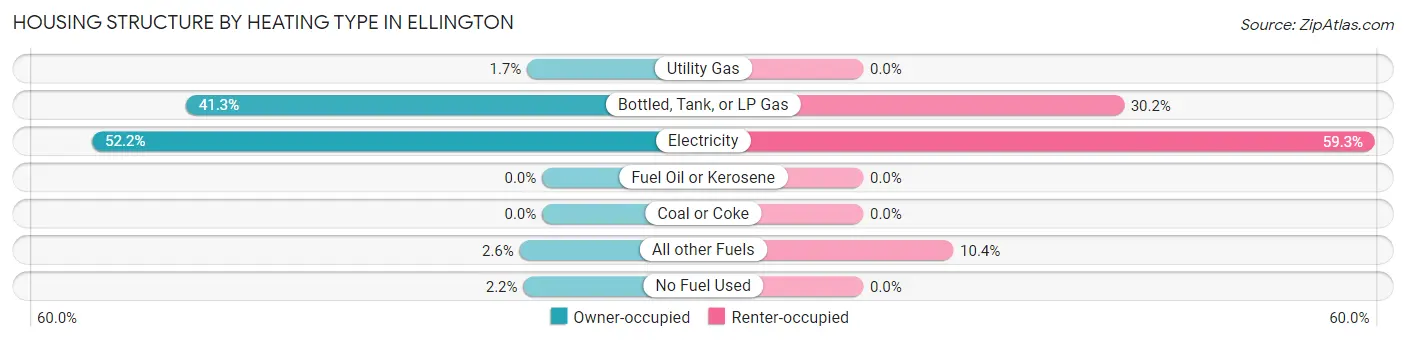
| Heating Type | Owner-occupied | Renter-occupied |
| Utility Gas | 4 (1.7%) | 0 (0.0%) |
| Bottled, Tank, or LP Gas | 95 (41.3%) | 55 (30.2%) |
| Electricity | 120 (52.2%) | 108 (59.3%) |
| Fuel Oil or Kerosene | 0 (0.0%) | 0 (0.0%) |
| Coal or Coke | 0 (0.0%) | 0 (0.0%) |
| All other Fuels | 6 (2.6%) | 19 (10.4%) |
| No Fuel Used | 5 (2.2%) | 0 (0.0%) |
| Total | 230 (100.0%) | 182 (100.0%) |
Household Vehicle Usage in Ellington
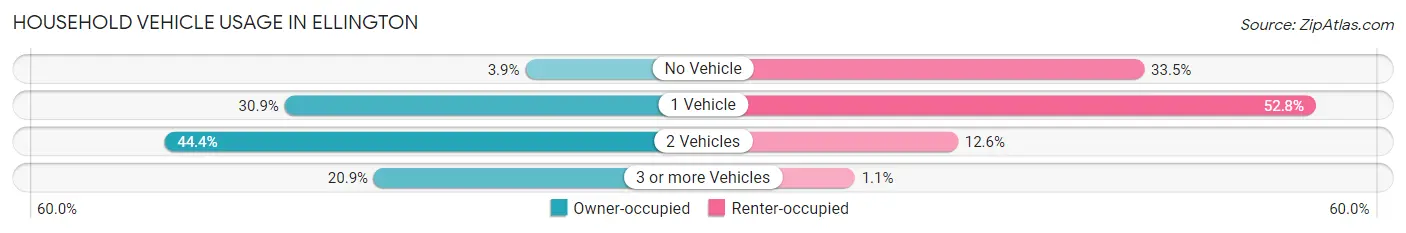
| Vehicles per Household | Owner-occupied | Renter-occupied |
| No Vehicle | 9 (3.9%) | 61 (33.5%) |
| 1 Vehicle | 71 (30.9%) | 96 (52.7%) |
| 2 Vehicles | 102 (44.4%) | 23 (12.6%) |
| 3 or more Vehicles | 48 (20.9%) | 2 (1.1%) |
| Total | 230 (100.0%) | 182 (100.0%) |
Real Estate & Mortgages in Ellington
Real Estate and Mortgage Overview in Ellington
| Characteristic | Without Mortgage | With Mortgage |
| Housing Units | 64 | 166 |
| Median Property Value | $85,700 | $56,900 |
| Median Household Income | $37,500 | $0 |
| Monthly Housing Costs | $359 | $0 |
| Real Estate Taxes | $455 | $5 |
Property Value by Mortgage Status in Ellington
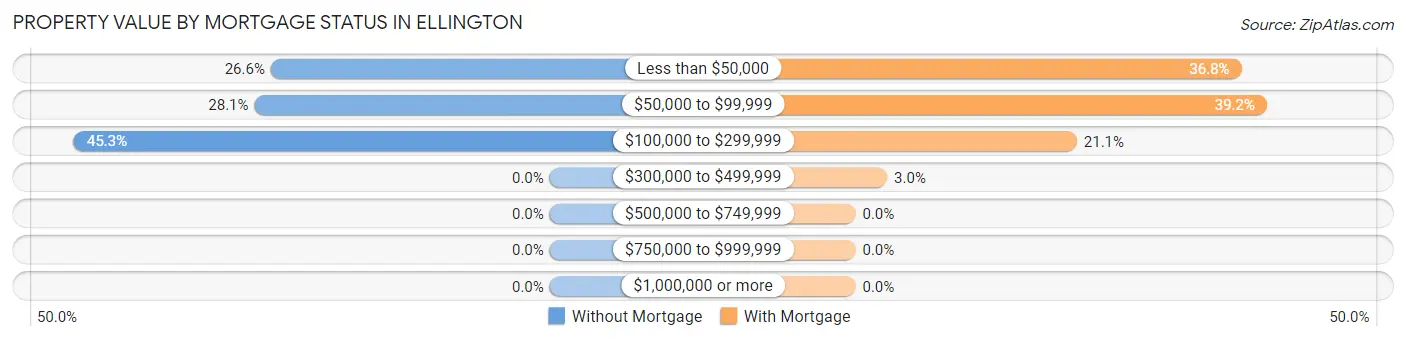
| Property Value | Without Mortgage | With Mortgage |
| Less than $50,000 | 17 (26.6%) | 61 (36.7%) |
| $50,000 to $99,999 | 18 (28.1%) | 65 (39.2%) |
| $100,000 to $299,999 | 29 (45.3%) | 35 (21.1%) |
| $300,000 to $499,999 | 0 (0.0%) | 5 (3.0%) |
| $500,000 to $749,999 | 0 (0.0%) | 0 (0.0%) |
| $750,000 to $999,999 | 0 (0.0%) | 0 (0.0%) |
| $1,000,000 or more | 0 (0.0%) | 0 (0.0%) |
| Total | 64 (100.0%) | 166 (100.0%) |
Household Income by Mortgage Status in Ellington
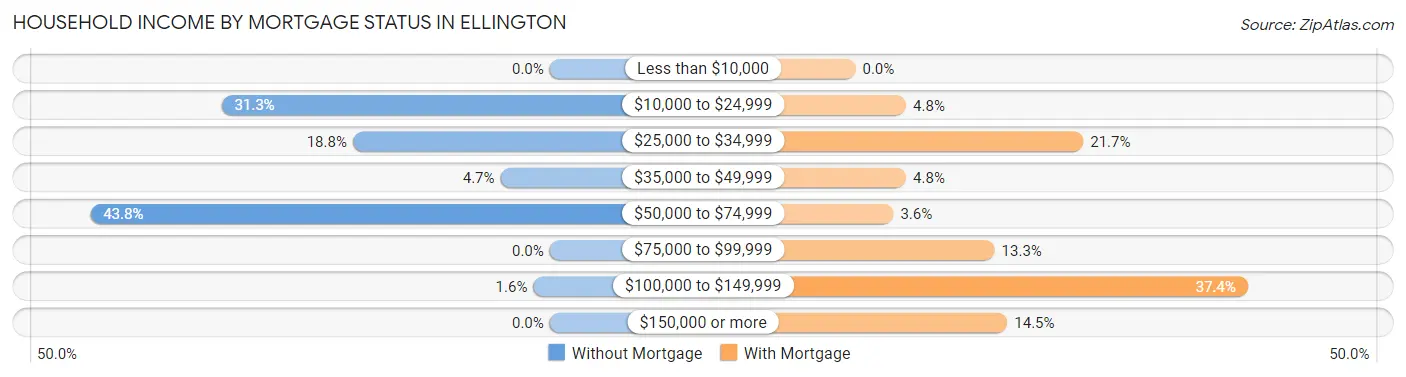
| Household Income | Without Mortgage | With Mortgage |
| Less than $10,000 | 0 (0.0%) | 0 (0.0%) |
| $10,000 to $24,999 | 20 (31.2%) | 8 (4.8%) |
| $25,000 to $34,999 | 12 (18.8%) | 36 (21.7%) |
| $35,000 to $49,999 | 3 (4.7%) | 8 (4.8%) |
| $50,000 to $74,999 | 28 (43.8%) | 6 (3.6%) |
| $75,000 to $99,999 | 0 (0.0%) | 22 (13.3%) |
| $100,000 to $149,999 | 1 (1.6%) | 62 (37.3%) |
| $150,000 or more | 0 (0.0%) | 24 (14.5%) |
| Total | 64 (100.0%) | 166 (100.0%) |
Property Value to Household Income Ratio in Ellington
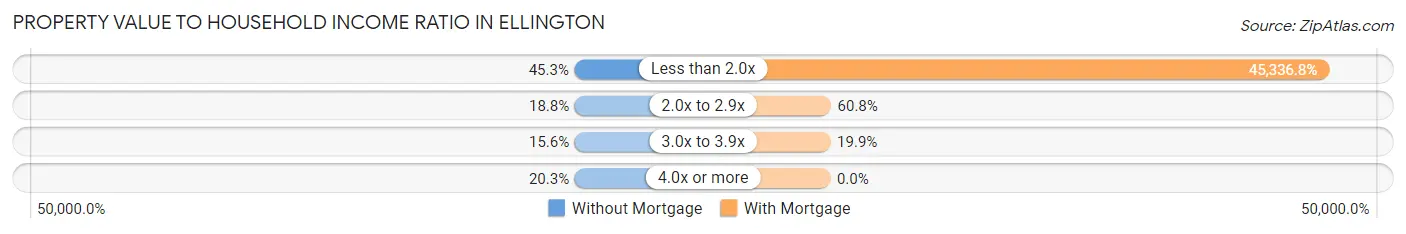
| Value-to-Income Ratio | Without Mortgage | With Mortgage |
| Less than 2.0x | 29 (45.3%) | 75,259 (45,336.8%) |
| 2.0x to 2.9x | 12 (18.8%) | 101 (60.8%) |
| 3.0x to 3.9x | 10 (15.6%) | 33 (19.9%) |
| 4.0x or more | 13 (20.3%) | 0 (0.0%) |
| Total | 64 (100.0%) | 166 (100.0%) |
Real Estate Taxes by Mortgage Status in Ellington
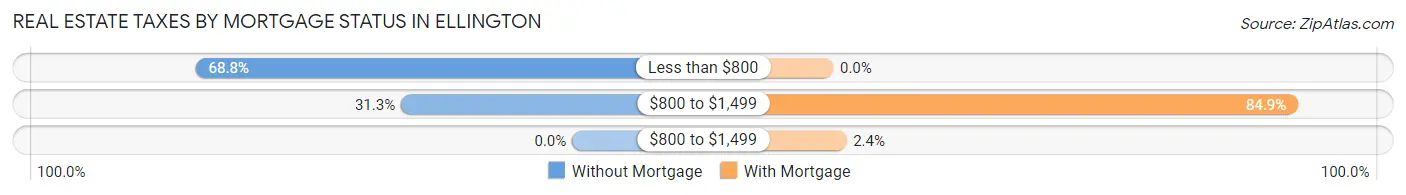
| Property Taxes | Without Mortgage | With Mortgage |
| Less than $800 | 44 (68.8%) | 0 (0.0%) |
| $800 to $1,499 | 20 (31.2%) | 141 (84.9%) |
| $800 to $1,499 | 0 (0.0%) | 4 (2.4%) |
| Total | 64 (100.0%) | 166 (100.0%) |
Health & Disability in Ellington
Health Insurance Coverage by Age in Ellington
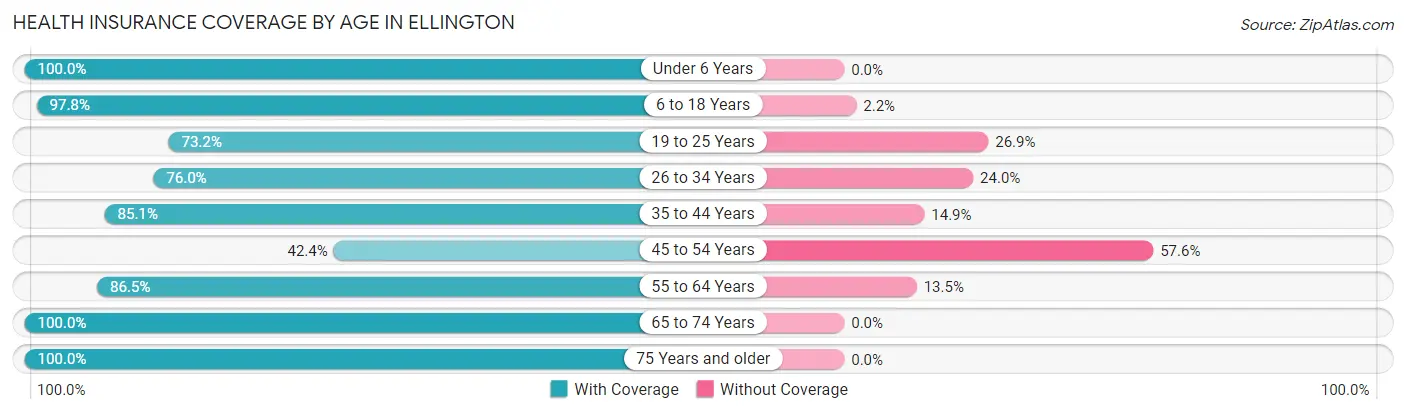
| Age Bracket | With Coverage | Without Coverage |
| Under 6 Years | 138 (100.0%) | 0 (0.0%) |
| 6 to 18 Years | 218 (97.8%) | 5 (2.2%) |
| 19 to 25 Years | 79 (73.2%) | 29 (26.9%) |
| 26 to 34 Years | 98 (76.0%) | 31 (24.0%) |
| 35 to 44 Years | 114 (85.1%) | 20 (14.9%) |
| 45 to 54 Years | 78 (42.4%) | 106 (57.6%) |
| 55 to 64 Years | 128 (86.5%) | 20 (13.5%) |
| 65 to 74 Years | 118 (100.0%) | 0 (0.0%) |
| 75 Years and older | 102 (100.0%) | 0 (0.0%) |
| Total | 1,073 (83.6%) | 211 (16.4%) |
Health Insurance Coverage by Citizenship Status in Ellington
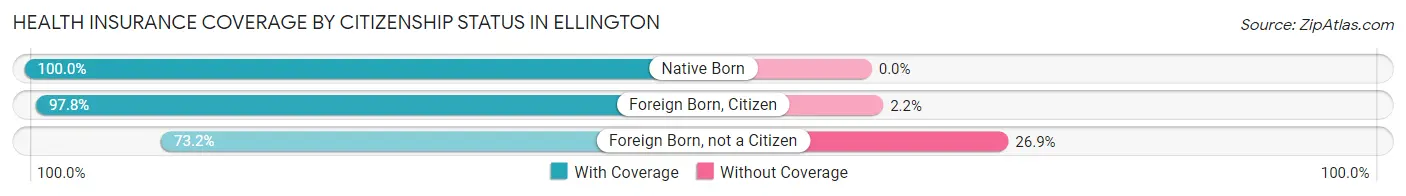
| Citizenship Status | With Coverage | Without Coverage |
| Native Born | 138 (100.0%) | 0 (0.0%) |
| Foreign Born, Citizen | 218 (97.8%) | 5 (2.2%) |
| Foreign Born, not a Citizen | 79 (73.2%) | 29 (26.9%) |
Health Insurance Coverage by Household Income in Ellington
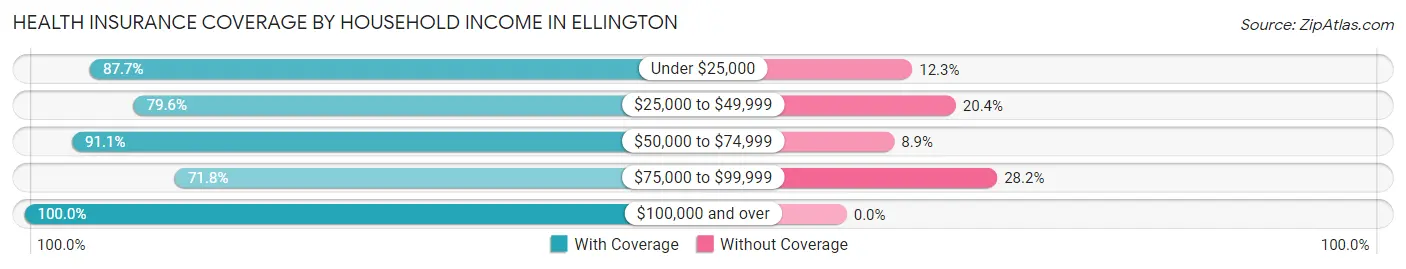
| Household Income | With Coverage | Without Coverage |
| Under $25,000 | 286 (87.7%) | 40 (12.3%) |
| $25,000 to $49,999 | 187 (79.6%) | 48 (20.4%) |
| $50,000 to $74,999 | 215 (91.1%) | 21 (8.9%) |
| $75,000 to $99,999 | 260 (71.8%) | 102 (28.2%) |
| $100,000 and over | 109 (100.0%) | 0 (0.0%) |
Public vs Private Health Insurance Coverage by Age in Ellington
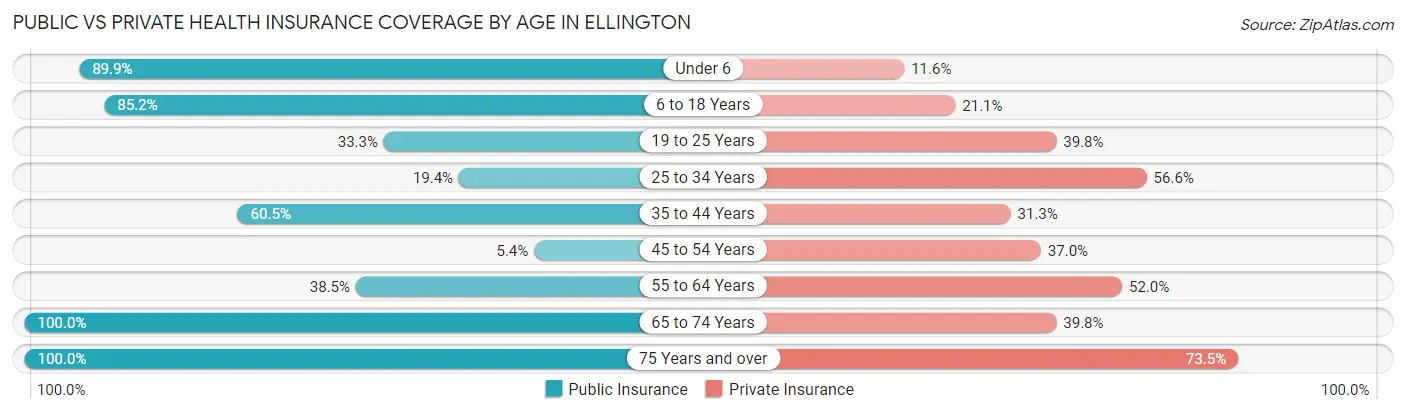
| Age Bracket | Public Insurance | Private Insurance |
| Under 6 | 124 (89.9%) | 16 (11.6%) |
| 6 to 18 Years | 190 (85.2%) | 47 (21.1%) |
| 19 to 25 Years | 36 (33.3%) | 43 (39.8%) |
| 25 to 34 Years | 25 (19.4%) | 73 (56.6%) |
| 35 to 44 Years | 81 (60.5%) | 42 (31.3%) |
| 45 to 54 Years | 10 (5.4%) | 68 (37.0%) |
| 55 to 64 Years | 57 (38.5%) | 77 (52.0%) |
| 65 to 74 Years | 118 (100.0%) | 47 (39.8%) |
| 75 Years and over | 102 (100.0%) | 75 (73.5%) |
| Total | 743 (57.9%) | 488 (38.0%) |
Disability Status by Sex by Age in Ellington
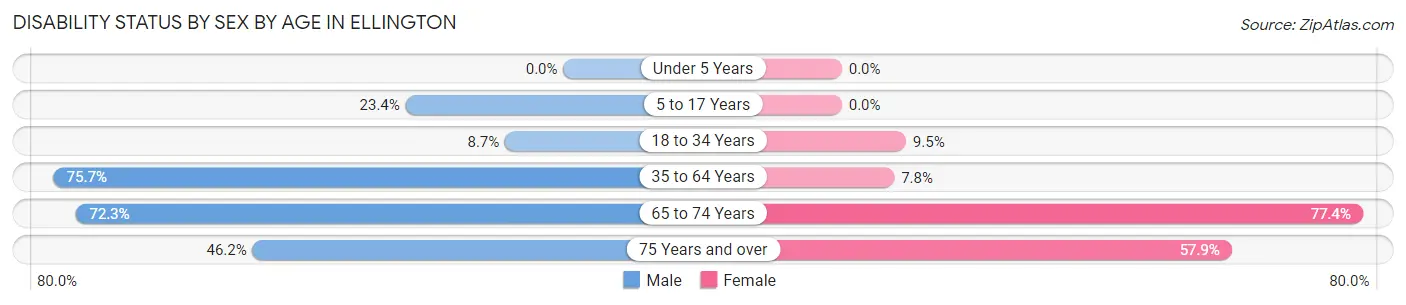
| Age Bracket | Male | Female |
| Under 5 Years | 0 (0.0%) | 0 (0.0%) |
| 5 to 17 Years | 26 (23.4%) | 0 (0.0%) |
| 18 to 34 Years | 9 (8.6%) | 14 (9.5%) |
| 35 to 64 Years | 168 (75.7%) | 19 (7.8%) |
| 65 to 74 Years | 47 (72.3%) | 41 (77.4%) |
| 75 Years and over | 12 (46.2%) | 44 (57.9%) |
Disability Class by Sex by Age in Ellington
Disability Class: Hearing Difficulty
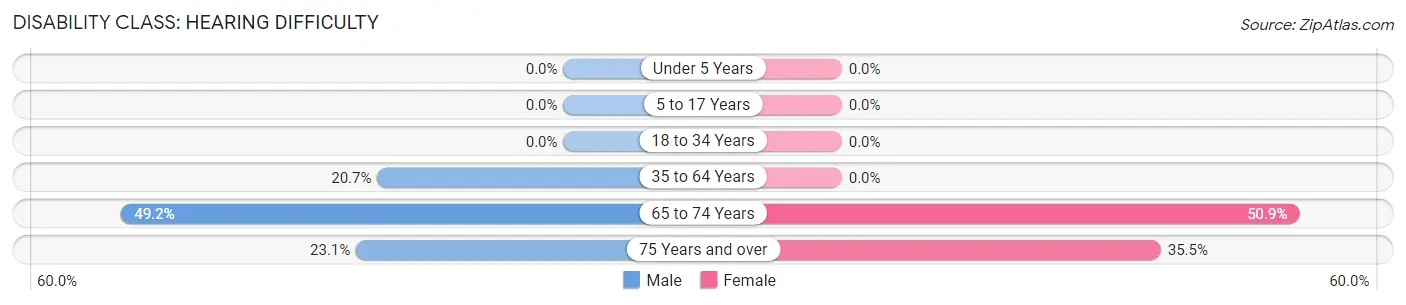
| Age Bracket | Male | Female |
| Under 5 Years | 0 (0.0%) | 0 (0.0%) |
| 5 to 17 Years | 0 (0.0%) | 0 (0.0%) |
| 18 to 34 Years | 0 (0.0%) | 0 (0.0%) |
| 35 to 64 Years | 46 (20.7%) | 0 (0.0%) |
| 65 to 74 Years | 32 (49.2%) | 27 (50.9%) |
| 75 Years and over | 6 (23.1%) | 27 (35.5%) |
Disability Class: Vision Difficulty
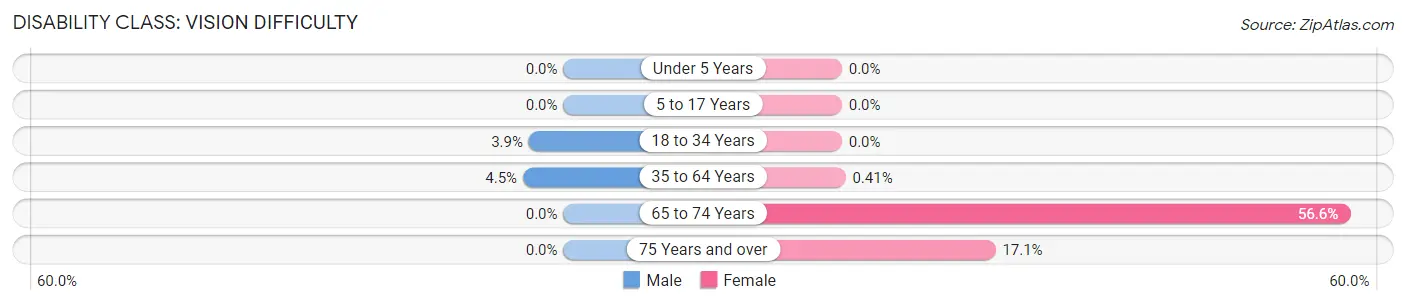
| Age Bracket | Male | Female |
| Under 5 Years | 0 (0.0%) | 0 (0.0%) |
| 5 to 17 Years | 0 (0.0%) | 0 (0.0%) |
| 18 to 34 Years | 4 (3.8%) | 0 (0.0%) |
| 35 to 64 Years | 10 (4.5%) | 1 (0.4%) |
| 65 to 74 Years | 0 (0.0%) | 30 (56.6%) |
| 75 Years and over | 0 (0.0%) | 13 (17.1%) |
Disability Class: Cognitive Difficulty
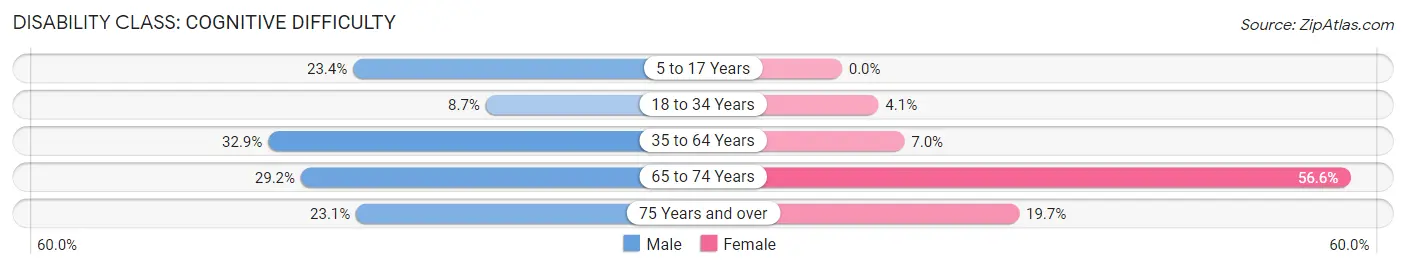
| Age Bracket | Male | Female |
| 5 to 17 Years | 26 (23.4%) | 0 (0.0%) |
| 18 to 34 Years | 9 (8.6%) | 6 (4.1%) |
| 35 to 64 Years | 73 (32.9%) | 17 (7.0%) |
| 65 to 74 Years | 19 (29.2%) | 30 (56.6%) |
| 75 Years and over | 6 (23.1%) | 15 (19.7%) |
Disability Class: Ambulatory Difficulty
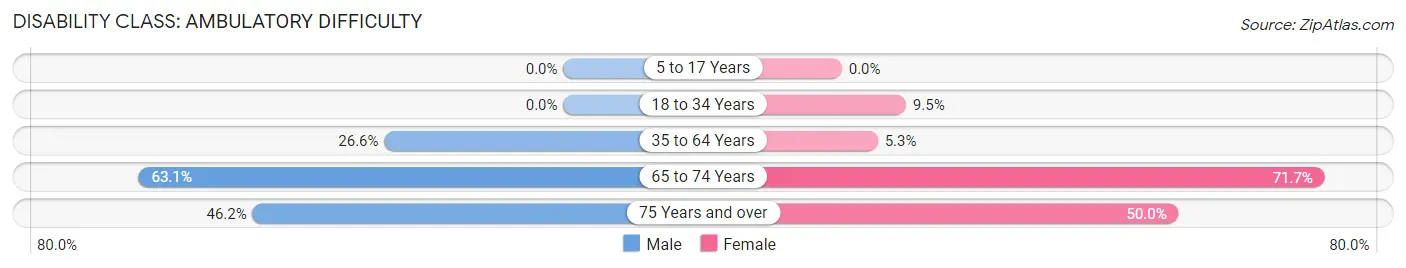
| Age Bracket | Male | Female |
| 5 to 17 Years | 0 (0.0%) | 0 (0.0%) |
| 18 to 34 Years | 0 (0.0%) | 14 (9.5%) |
| 35 to 64 Years | 59 (26.6%) | 13 (5.3%) |
| 65 to 74 Years | 41 (63.1%) | 38 (71.7%) |
| 75 Years and over | 12 (46.2%) | 38 (50.0%) |
Disability Class: Self-Care Difficulty
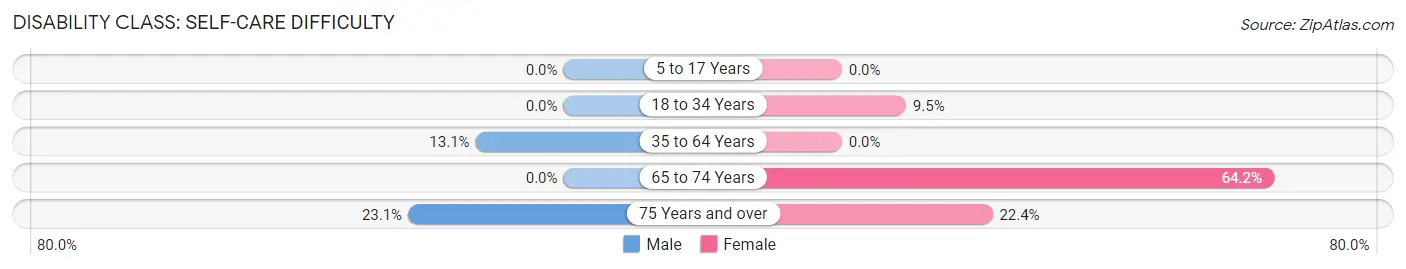
| Age Bracket | Male | Female |
| 5 to 17 Years | 0 (0.0%) | 0 (0.0%) |
| 18 to 34 Years | 0 (0.0%) | 14 (9.5%) |
| 35 to 64 Years | 29 (13.1%) | 0 (0.0%) |
| 65 to 74 Years | 0 (0.0%) | 34 (64.1%) |
| 75 Years and over | 6 (23.1%) | 17 (22.4%) |
Technology Access in Ellington
Computing Device Access in Ellington
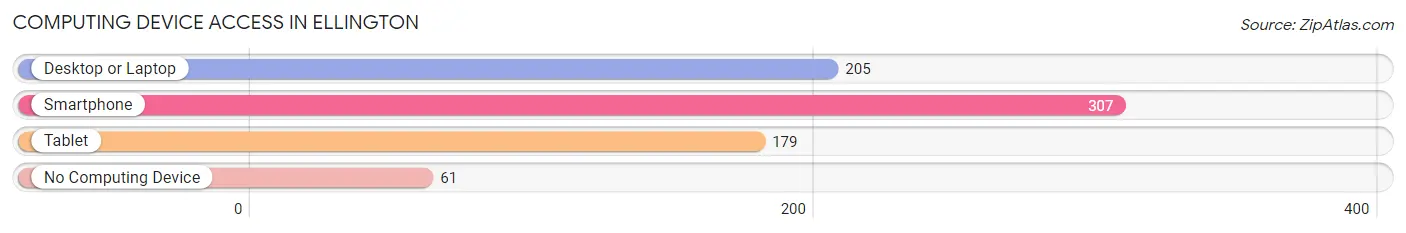
| Device Type | # Households | % Households |
| Desktop or Laptop | 205 | 49.8% |
| Smartphone | 307 | 74.5% |
| Tablet | 179 | 43.4% |
| No Computing Device | 61 | 14.8% |
| Total | 412 | 100.0% |
Internet Access in Ellington
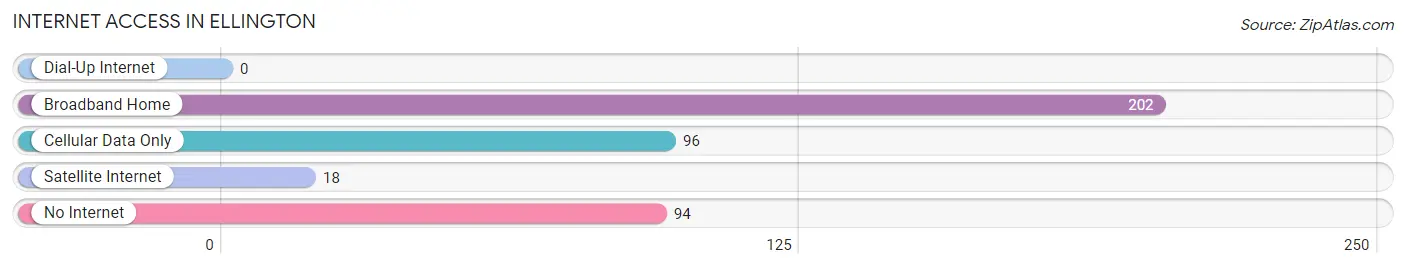
| Internet Type | # Households | % Households |
| Dial-Up Internet | 0 | 0.0% |
| Broadband Home | 202 | 49.0% |
| Cellular Data Only | 96 | 23.3% |
| Satellite Internet | 18 | 4.4% |
| No Internet | 94 | 22.8% |
| Total | 412 | 100.0% |
Ellington Summary
Ellington, Missouri is a small town located in Reynolds County in the southeastern corner of the state. It is situated on the banks of the Black River, and is surrounded by rolling hills and forests. The town has a population of approximately 1,000 people, and is the county seat of Reynolds County.
History
Ellington was founded in 1858 by a group of settlers from Tennessee. The town was named after the Ellington family, who were among the first settlers. The town was incorporated in 1872, and the first post office was established in 1873.
In the late 19th century, Ellington was a thriving agricultural community, with a variety of crops being grown in the area. The town was also home to several sawmills and gristmills, which provided lumber and grain for the local economy.
In the early 20th century, Ellington began to experience a decline in population as many of the town’s residents moved away in search of better economic opportunities. The Great Depression of the 1930s further exacerbated the town’s economic woes, and by the 1940s, the population had dropped to just over 500 people.
In the 1950s, Ellington began to experience a resurgence in population and economic activity. The town was home to several manufacturing plants, and the local economy began to diversify. The town also experienced a population boom, with the population reaching 1,000 by the end of the decade.
Geography
Ellington is located in the southeastern corner of Missouri, in Reynolds County. The town is situated on the banks of the Black River, and is surrounded by rolling hills and forests. The town is located approximately 50 miles from St. Louis, and is accessible via US Highway 67.
The climate in Ellington is humid subtropical, with hot, humid summers and mild winters. The average annual temperature is around 60 degrees Fahrenheit, and the average annual precipitation is around 40 inches.
Economy
Ellington’s economy is largely based on agriculture and manufacturing. The town is home to several manufacturing plants, including a furniture factory, a plastics factory, and a metal fabrication plant. The town is also home to several farms, which produce a variety of crops, including corn, soybeans, and wheat.
The town is also home to several small businesses, including restaurants, retail stores, and service providers. The town is also home to a branch of the Reynolds County Bank, which provides banking services to the local community.
Demographics
As of the 2010 census, the population of Ellington was 1,000 people. The racial makeup of the town was 97.2% White, 0.7% African American, 0.2% Native American, 0.2% Asian, 0.2% from other races, and 1.7% from two or more races. Hispanic or Latino of any race were 0.7% of the population.
The median household income in Ellington was $30,000, and the median family income was $35,000. The per capita income in the town was $15,000. Approximately 17.5% of the population was below the poverty line.
Ellington is a small town with a rich history and a diverse economy. The town is home to a variety of businesses, and the local economy is largely based on agriculture and manufacturing. The town is also home to a diverse population, with a variety of racial and ethnic backgrounds.
Common Questions
What is Per Capita Income in Ellington?
Per Capita income in Ellington is $22,464.
What is the Median Family Income in Ellington?
Median Family Income in Ellington is $55,227.
What is the Median Household income in Ellington?
Median Household Income in Ellington is $40,000.
What is Income or Wage Gap in Ellington?
Income or Wage Gap in Ellington is 15.9%.
Women in Ellington earn 84.1 cents for every dollar earned by a man.
What is Family Income Deficit in Ellington?
Family Income Deficit in Ellington is $16,543.
Families that are below poverty line in Ellington earn $16,543 less on average than the poverty threshold level.
What is Inequality or Gini Index in Ellington?
Inequality or Gini Index in Ellington is 0.39.
What is the Total Population of Ellington?
Total Population of Ellington is 1,302.
What is the Total Male Population of Ellington?
Total Male Population of Ellington is 599.
What is the Total Female Population of Ellington?
Total Female Population of Ellington is 703.
What is the Ratio of Males per 100 Females in Ellington?
There are 85.21 Males per 100 Females in Ellington.
What is the Ratio of Females per 100 Males in Ellington?
There are 117.36 Females per 100 Males in Ellington.
What is the Median Population Age in Ellington?
Median Population Age in Ellington is 36.6 Years.
What is the Average Family Size in Ellington
Average Family Size in Ellington is 4.2 People.
What is the Average Household Size in Ellington
Average Household Size in Ellington is 3.1 People.
How Large is the Labor Force in Ellington?
There are 600 People in the Labor Forcein in Ellington.
What is the Percentage of People in the Labor Force in Ellington?
59.1% of People are in the Labor Force in Ellington.
What is the Unemployment Rate in Ellington?
Unemployment Rate in Ellington is 26.2%.