Rosebud, MO Map & Demographics
Rosebud Map
Rosebud Overview
$24,533
PER CAPITA INCOME
$91,000
AVG FAMILY INCOME
$58,250
AVG HOUSEHOLD INCOME
49.9%
WAGE / INCOME GAP [ % ]
50.1¢/ $1
WAGE / INCOME GAP [ $ ]
0.39
INEQUALITY / GINI INDEX
481
TOTAL POPULATION
210
MALE POPULATION
271
FEMALE POPULATION
77.49
MALES / 100 FEMALES
129.05
FEMALES / 100 MALES
38.1
MEDIAN AGE
3.6
AVG FAMILY SIZE
2.7
AVG HOUSEHOLD SIZE
240
LABOR FORCE [ PEOPLE ]
63.3%
PERCENT IN LABOR FORCE
5.0%
UNEMPLOYMENT RATE
Rosebud Zip Codes
Rosebud Area Codes
Income in Rosebud
Income Overview in Rosebud
Per Capita Income in Rosebud is $24,533, while median incomes of families and households are $91,000 and $58,250 respectively.
| Characteristic | Number | Measure |
| Per Capita Income | 481 | $24,533 |
| Median Family Income | 104 | $91,000 |
| Mean Family Income | 104 | $88,328 |
| Median Household Income | 181 | $58,250 |
| Mean Household Income | 181 | $64,304 |
| Income Deficit | 104 | $0 |
| Wage / Income Gap (%) | 481 | 49.91% |
| Wage / Income Gap ($) | 481 | 50.09¢ per $1 |
| Gini / Inequality Index | 481 | 0.39 |
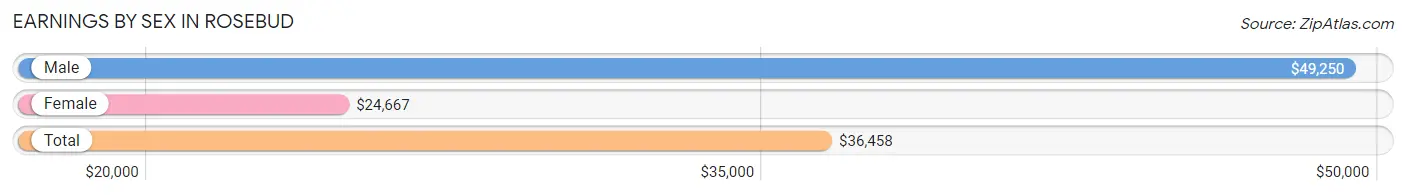
Earnings by Sex in Rosebud
Average Earnings in Rosebud are $36,458, $49,250 for men and $24,667 for women, a difference of 49.9%.
| Sex | Number | Average Earnings |
| Male | 107 (43.0%) | $49,250 |
| Female | 142 (57.0%) | $24,667 |
| Total | 249 (100.0%) | $36,458 |
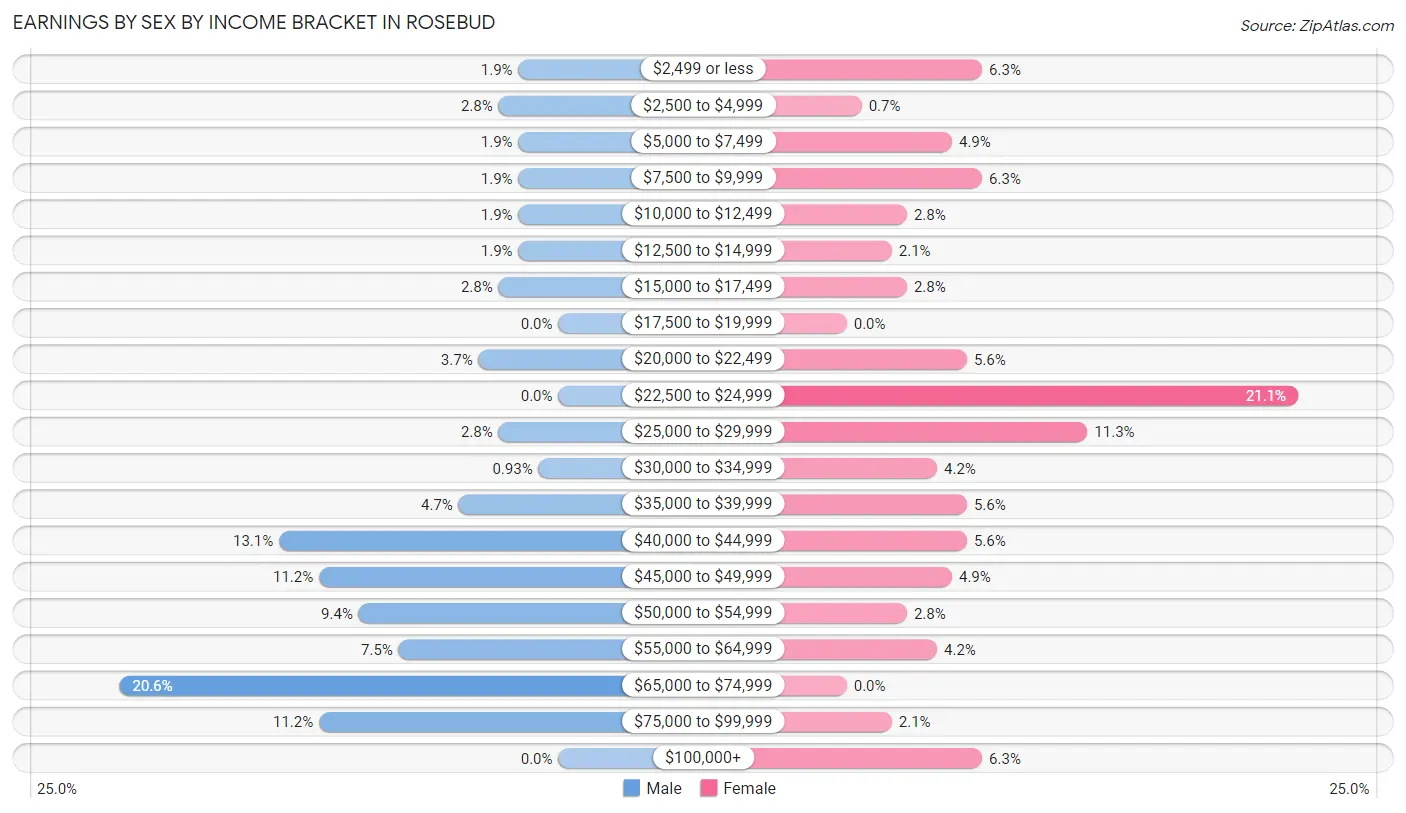
Earnings by Sex by Income Bracket in Rosebud
The most common earnings brackets in Rosebud are $65,000 to $74,999 for men (22 | 20.6%) and $22,500 to $24,999 for women (30 | 21.1%).
| Income | Male | Female |
| $2,499 or less | 2 (1.9%) | 9 (6.3%) |
| $2,500 to $4,999 | 3 (2.8%) | 1 (0.7%) |
| $5,000 to $7,499 | 2 (1.9%) | 7 (4.9%) |
| $7,500 to $9,999 | 2 (1.9%) | 9 (6.3%) |
| $10,000 to $12,499 | 2 (1.9%) | 4 (2.8%) |
| $12,500 to $14,999 | 2 (1.9%) | 3 (2.1%) |
| $15,000 to $17,499 | 3 (2.8%) | 4 (2.8%) |
| $17,500 to $19,999 | 0 (0.0%) | 0 (0.0%) |
| $20,000 to $22,499 | 4 (3.7%) | 8 (5.6%) |
| $22,500 to $24,999 | 0 (0.0%) | 30 (21.1%) |
| $25,000 to $29,999 | 3 (2.8%) | 16 (11.3%) |
| $30,000 to $34,999 | 1 (0.9%) | 6 (4.2%) |
| $35,000 to $39,999 | 5 (4.7%) | 8 (5.6%) |
| $40,000 to $44,999 | 14 (13.1%) | 8 (5.6%) |
| $45,000 to $49,999 | 12 (11.2%) | 7 (4.9%) |
| $50,000 to $54,999 | 10 (9.3%) | 4 (2.8%) |
| $55,000 to $64,999 | 8 (7.5%) | 6 (4.2%) |
| $65,000 to $74,999 | 22 (20.6%) | 0 (0.0%) |
| $75,000 to $99,999 | 12 (11.2%) | 3 (2.1%) |
| $100,000+ | 0 (0.0%) | 9 (6.3%) |
| Total | 107 (100.0%) | 142 (100.0%) |
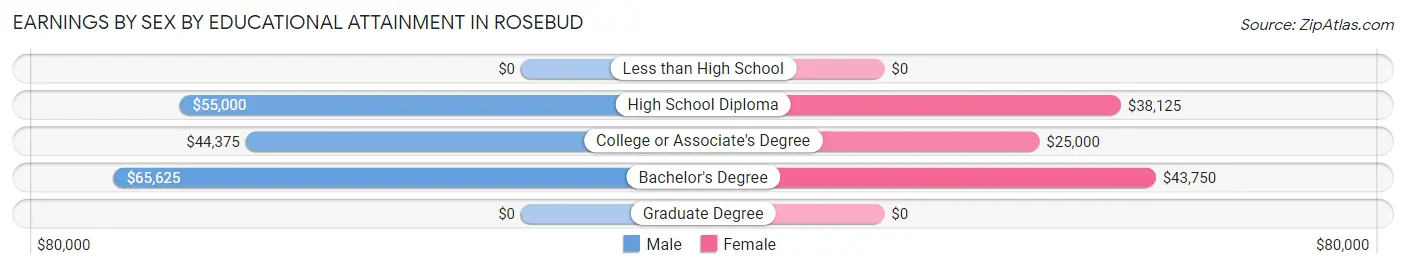
Earnings by Sex by Educational Attainment in Rosebud
Average earnings in Rosebud are $51,406 for men and $26,071 for women, a difference of 49.3%. Men with an educational attainment of bachelor's degree enjoy the highest average annual earnings of $65,625, while those with college or associate's degree education earn the least with $44,375. Women with an educational attainment of bachelor's degree earn the most with the average annual earnings of $43,750, while those with college or associate's degree education have the smallest earnings of $25,000.
| Educational Attainment | Male Income | Female Income |
| Less than High School | - | - |
| High School Diploma | $55,000 | $38,125 |
| College or Associate's Degree | $44,375 | $25,000 |
| Bachelor's Degree | $65,625 | $43,750 |
| Graduate Degree | - | - |
| Total | $51,406 | $26,071 |
Family Income in Rosebud
Family Income Brackets in Rosebud
According to the Rosebud family income data, there are 37 families falling into the $100,000 to $149,999 income range, which is the most common income bracket and makes up 35.6% of all families.
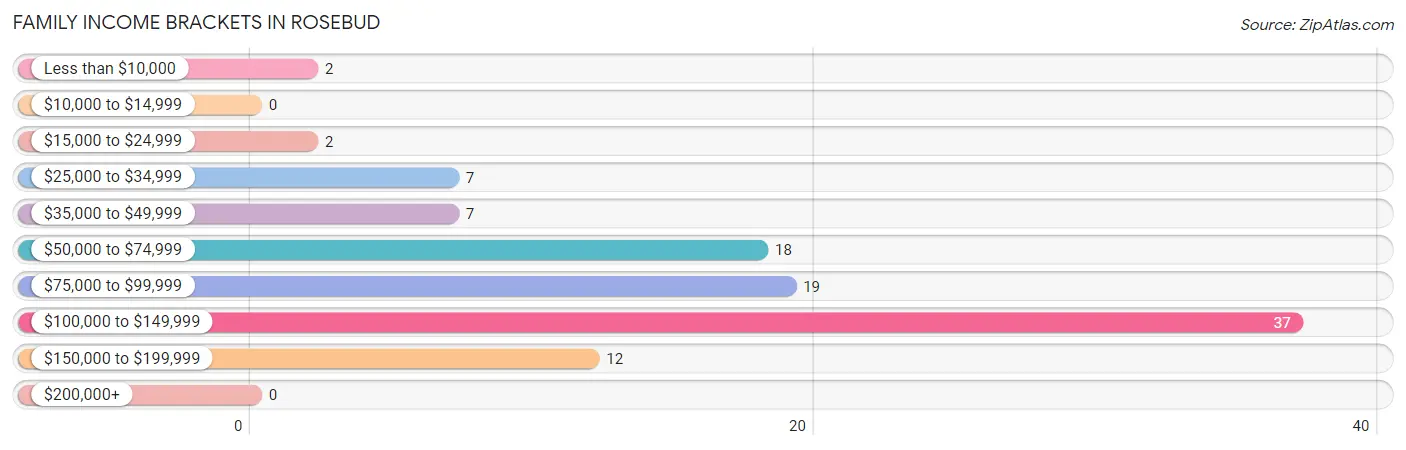
| Income Bracket | # Families | % Families |
| Less than $10,000 | 2 | 1.9% |
| $10,000 to $14,999 | 0 | 0.0% |
| $15,000 to $24,999 | 2 | 1.9% |
| $25,000 to $34,999 | 7 | 6.7% |
| $35,000 to $49,999 | 7 | 6.7% |
| $50,000 to $74,999 | 18 | 17.3% |
| $75,000 to $99,999 | 19 | 18.3% |
| $100,000 to $149,999 | 37 | 35.6% |
| $150,000 to $199,999 | 12 | 11.5% |
| $200,000+ | 0 | 0.0% |
Family Income by Famaliy Size in Rosebud
5-person families (20 | 19.2%) account for the highest median family income in Rosebud with $101,538 per family, while 2-person families (43 | 41.3%) have the highest median income of $39,375 per family member.
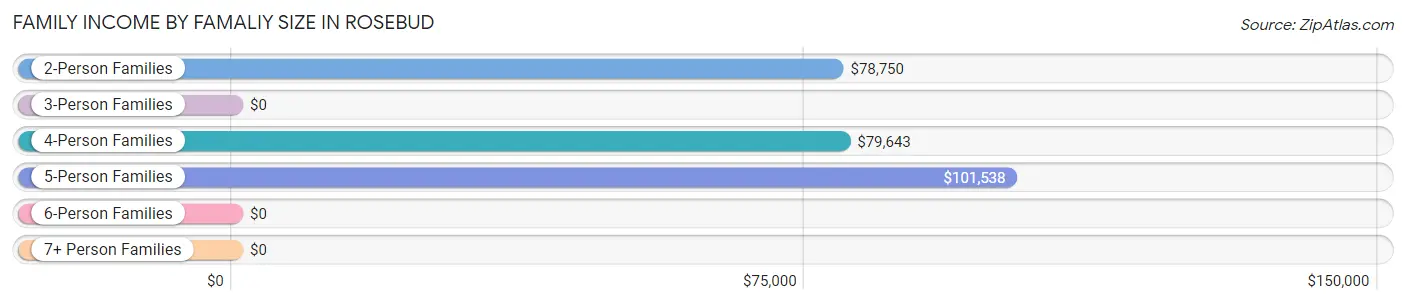
| Income Bracket | # Families | Median Income |
| 2-Person Families | 43 (41.3%) | $78,750 |
| 3-Person Families | 16 (15.4%) | $0 |
| 4-Person Families | 22 (21.1%) | $79,643 |
| 5-Person Families | 20 (19.2%) | $101,538 |
| 6-Person Families | 0 (0.0%) | $0 |
| 7+ Person Families | 3 (2.9%) | $0 |
| Total | 104 (100.0%) | $91,000 |
Family Income by Number of Earners in Rosebud
The median family income in Rosebud is $91,000, with families comprising 3+ earners (11) having the highest median family income of $107,083, while families with 1 earner (23) have the lowest median family income of $58,125, accounting for 10.6% and 22.1% of families, respectively.
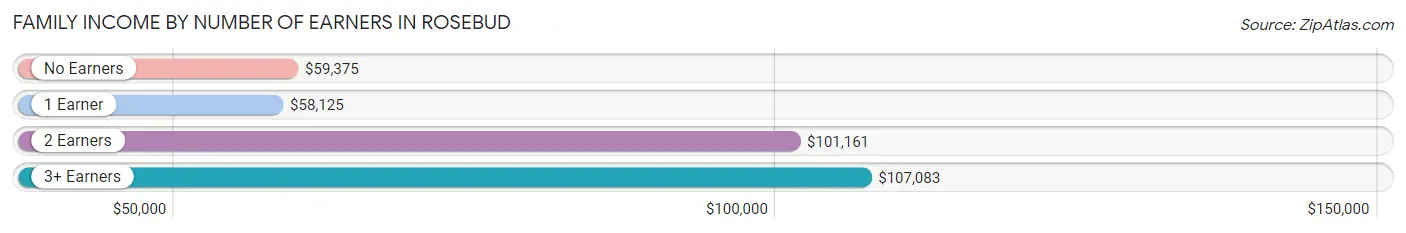
| Number of Earners | # Families | Median Income |
| No Earners | 9 (8.6%) | $59,375 |
| 1 Earner | 23 (22.1%) | $58,125 |
| 2 Earners | 61 (58.7%) | $101,161 |
| 3+ Earners | 11 (10.6%) | $107,083 |
| Total | 104 (100.0%) | $91,000 |
Household Income in Rosebud
Household Income Brackets in Rosebud
With 41 households falling in the category, the $100,000 to $149,999 income range is the most frequent in Rosebud, accounting for 22.7% of all households.
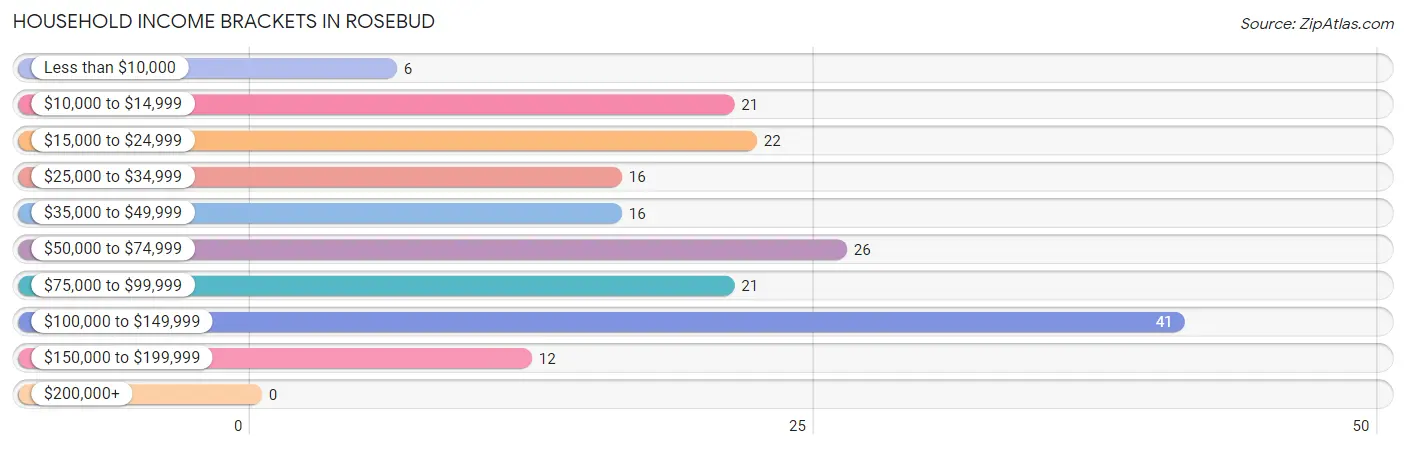
| Income Bracket | # Households | % Households |
| Less than $10,000 | 6 | 3.3% |
| $10,000 to $14,999 | 21 | 11.6% |
| $15,000 to $24,999 | 22 | 12.2% |
| $25,000 to $34,999 | 16 | 8.8% |
| $35,000 to $49,999 | 16 | 8.8% |
| $50,000 to $74,999 | 26 | 14.4% |
| $75,000 to $99,999 | 21 | 11.6% |
| $100,000 to $149,999 | 41 | 22.7% |
| $150,000 to $199,999 | 12 | 6.6% |
| $200,000+ | 0 | 0.0% |
Household Income by Householder Age in Rosebud
The median household income in Rosebud is $58,250, with the highest median household income of $91,667 found in the 25 to 44 years age bracket for the primary householder. A total of 50 households (27.6%) fall into this category. Meanwhile, the 65+ years age bracket for the primary householder has the lowest median household income of $24,531, with 35 households (19.3%) in this group.
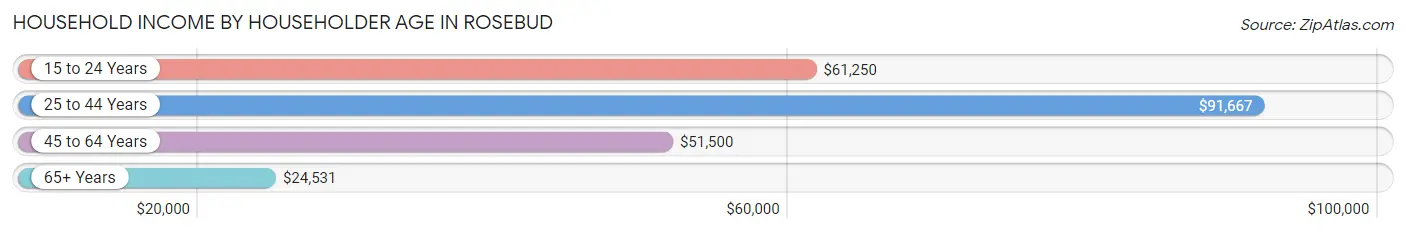
| Income Bracket | # Households | Median Income |
| 15 to 24 Years | 6 (3.3%) | $61,250 |
| 25 to 44 Years | 50 (27.6%) | $91,667 |
| 45 to 64 Years | 90 (49.7%) | $51,500 |
| 65+ Years | 35 (19.3%) | $24,531 |
| Total | 181 (100.0%) | $58,250 |
Poverty in Rosebud
Income Below Poverty by Sex and Age in Rosebud
With 7.1% poverty level for males and 18.4% for females among the residents of Rosebud, 18 to 24 year old males and 5 year old females are the most vulnerable to poverty, with 8 males (38.1%) and 2 females (50.0%) in their respective age groups living below the poverty level.
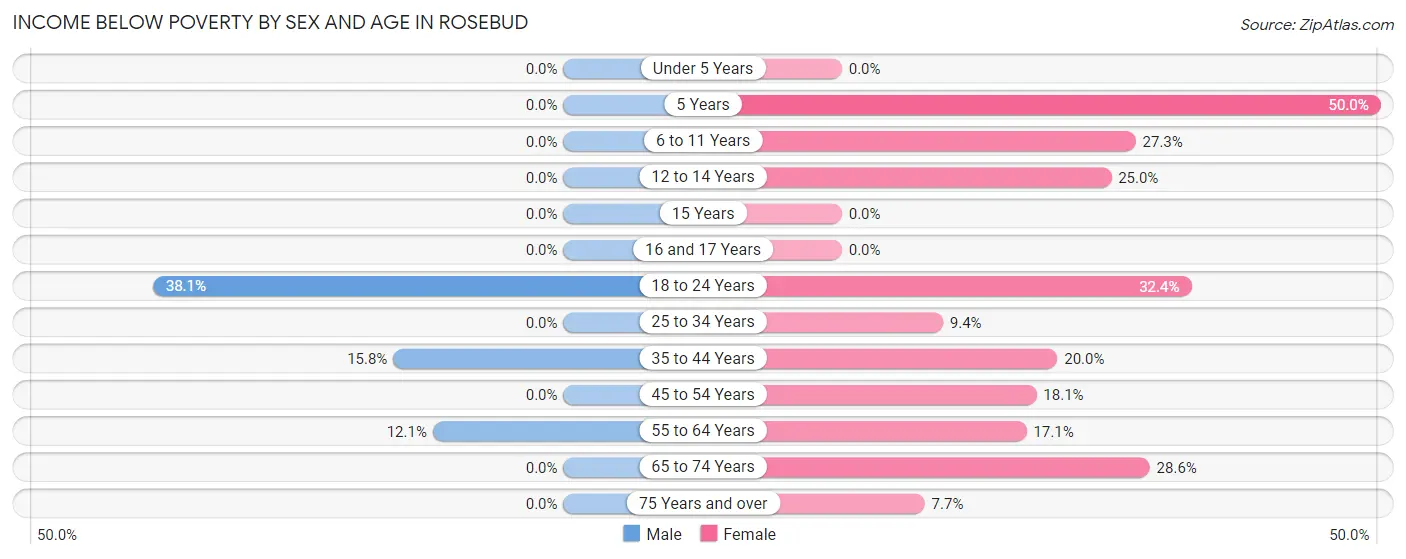
| Age Bracket | Male | Female |
| Under 5 Years | 0 (0.0%) | 0 (0.0%) |
| 5 Years | 0 (0.0%) | 2 (50.0%) |
| 6 to 11 Years | 0 (0.0%) | 3 (27.3%) |
| 12 to 14 Years | 0 (0.0%) | 2 (25.0%) |
| 15 Years | 0 (0.0%) | 0 (0.0%) |
| 16 and 17 Years | 0 (0.0%) | 0 (0.0%) |
| 18 to 24 Years | 8 (38.1%) | 12 (32.4%) |
| 25 to 34 Years | 0 (0.0%) | 3 (9.4%) |
| 35 to 44 Years | 3 (15.8%) | 4 (20.0%) |
| 45 to 54 Years | 0 (0.0%) | 13 (18.1%) |
| 55 to 64 Years | 4 (12.1%) | 6 (17.1%) |
| 65 to 74 Years | 0 (0.0%) | 4 (28.6%) |
| 75 Years and over | 0 (0.0%) | 1 (7.7%) |
| Total | 15 (7.1%) | 50 (18.4%) |
Income Above Poverty by Sex and Age in Rosebud
According to the poverty statistics in Rosebud, males aged under 5 years and females aged under 5 years are the age groups that are most secure financially, with 100.0% of males and 100.0% of females in these age groups living above the poverty line.
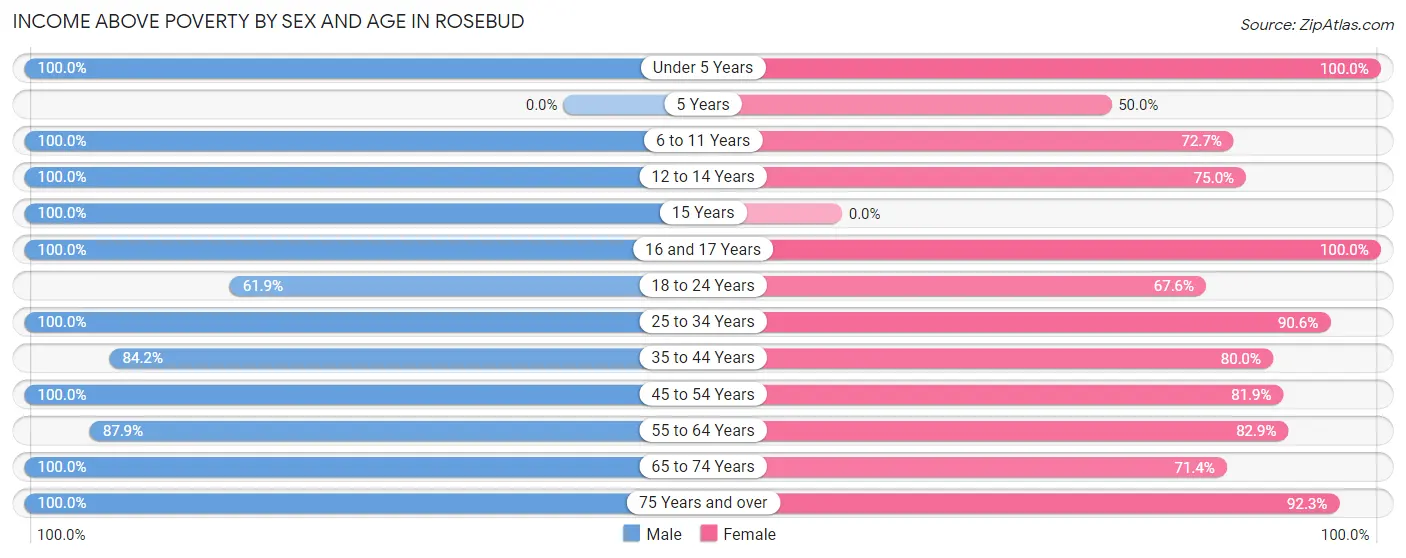
| Age Bracket | Male | Female |
| Under 5 Years | 20 (100.0%) | 17 (100.0%) |
| 5 Years | 0 (0.0%) | 2 (50.0%) |
| 6 to 11 Years | 34 (100.0%) | 8 (72.7%) |
| 12 to 14 Years | 7 (100.0%) | 6 (75.0%) |
| 15 Years | 1 (100.0%) | 0 (0.0%) |
| 16 and 17 Years | 4 (100.0%) | 8 (100.0%) |
| 18 to 24 Years | 13 (61.9%) | 25 (67.6%) |
| 25 to 34 Years | 26 (100.0%) | 29 (90.6%) |
| 35 to 44 Years | 16 (84.2%) | 16 (80.0%) |
| 45 to 54 Years | 26 (100.0%) | 59 (81.9%) |
| 55 to 64 Years | 29 (87.9%) | 29 (82.9%) |
| 65 to 74 Years | 9 (100.0%) | 10 (71.4%) |
| 75 Years and over | 10 (100.0%) | 12 (92.3%) |
| Total | 195 (92.9%) | 221 (81.6%) |
Income Below Poverty Among Married-Couple Families in Rosebud
The poverty statistics for married-couple families in Rosebud show that 2.2% or 2 of the total 90 families live below the poverty line. Families with no children have the highest poverty rate of 4.0%, comprising of 2 families. On the other hand, families with 1 or 2 children have the lowest poverty rate of 0.0%, which includes 0 families.
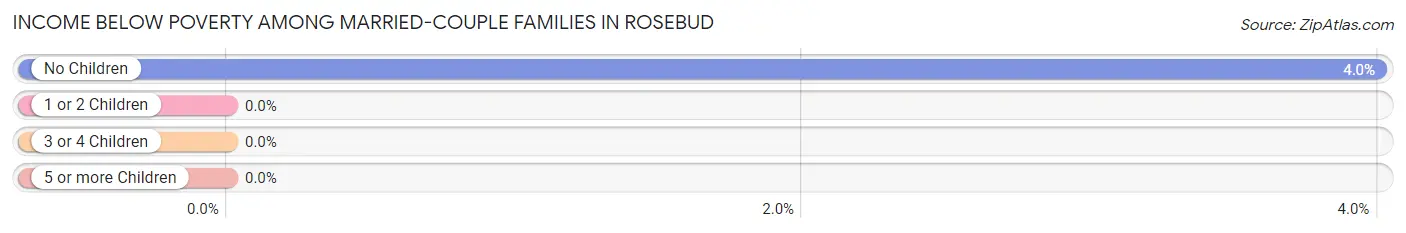
| Children | Above Poverty | Below Poverty |
| No Children | 48 (96.0%) | 2 (4.0%) |
| 1 or 2 Children | 22 (100.0%) | 0 (0.0%) |
| 3 or 4 Children | 18 (100.0%) | 0 (0.0%) |
| 5 or more Children | 0 (0.0%) | 0 (0.0%) |
| Total | 88 (97.8%) | 2 (2.2%) |
Income Below Poverty Among Single-Parent Households in Rosebud
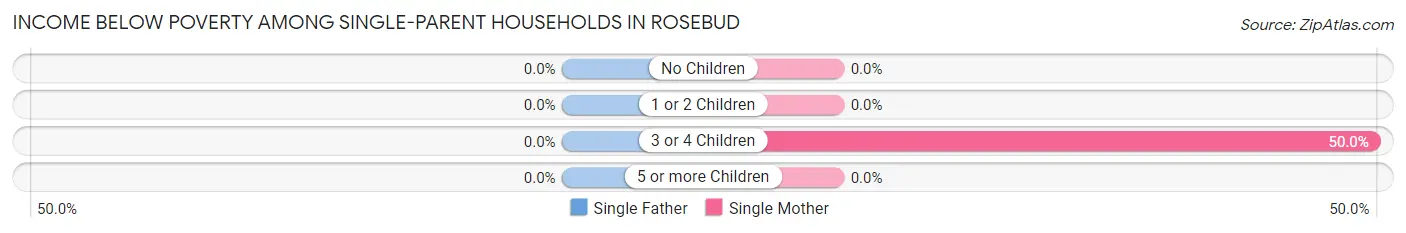
| Children | Single Father | Single Mother |
| No Children | 0 (0.0%) | 0 (0.0%) |
| 1 or 2 Children | 0 (0.0%) | 0 (0.0%) |
| 3 or 4 Children | 0 (0.0%) | 2 (50.0%) |
| 5 or more Children | 0 (0.0%) | 0 (0.0%) |
| Total | 0 (0.0%) | 2 (15.4%) |
Income Below Poverty Among Married-Couple vs Single-Parent Households in Rosebud
The poverty data for Rosebud shows that 2 of the married-couple family households (2.2%) and 2 of the single-parent households (14.3%) are living below the poverty level. Within the married-couple family households, those with no children have the highest poverty rate, with 2 households (4.0%) falling below the poverty line. Among the single-parent households, those with 3 or 4 children have the highest poverty rate, with 2 household (50.0%) living below poverty.
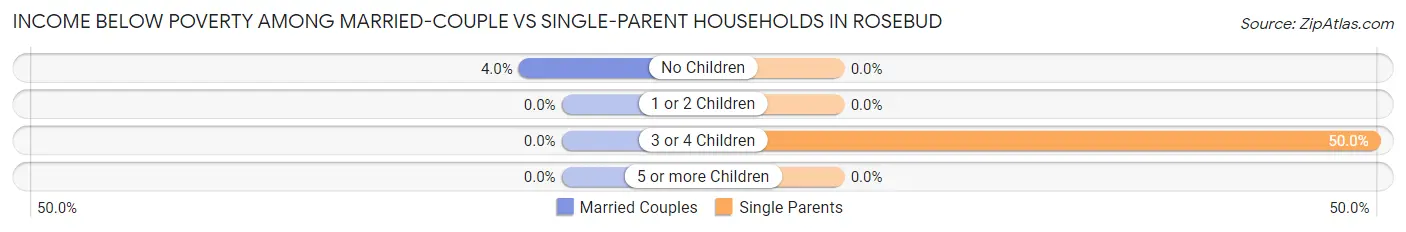
| Children | Married-Couple Families | Single-Parent Households |
| No Children | 2 (4.0%) | 0 (0.0%) |
| 1 or 2 Children | 0 (0.0%) | 0 (0.0%) |
| 3 or 4 Children | 0 (0.0%) | 2 (50.0%) |
| 5 or more Children | 0 (0.0%) | 0 (0.0%) |
| Total | 2 (2.2%) | 2 (14.3%) |
Race in Rosebud
The most populous races in Rosebud are White / Caucasian (418 | 86.9%), Two or more Races (63 | 13.1%), and Hispanic or Latino (30 | 6.2%).
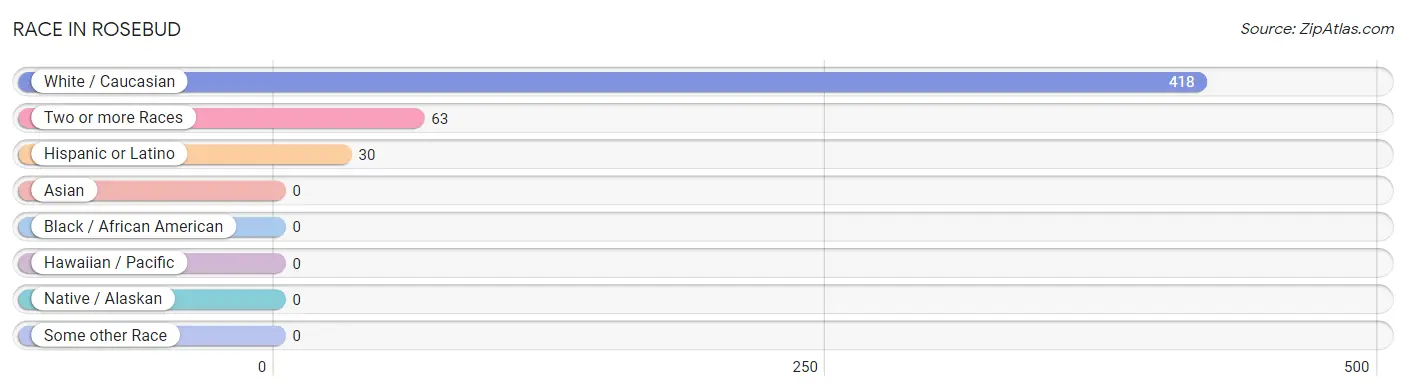
| Race | # Population | % Population |
| Asian | 0 | 0.0% |
| Black / African American | 0 | 0.0% |
| Hawaiian / Pacific | 0 | 0.0% |
| Hispanic or Latino | 30 | 6.2% |
| Native / Alaskan | 0 | 0.0% |
| White / Caucasian | 418 | 86.9% |
| Two or more Races | 63 | 13.1% |
| Some other Race | 0 | 0.0% |
| Total | 481 | 100.0% |
Ancestry in Rosebud
The most populous ancestries reported in Rosebud are German (158 | 32.9%), Irish (41 | 8.5%), English (36 | 7.5%), European (32 | 6.7%), and French (32 | 6.7%), together accounting for 62.2% of all Rosebud residents.
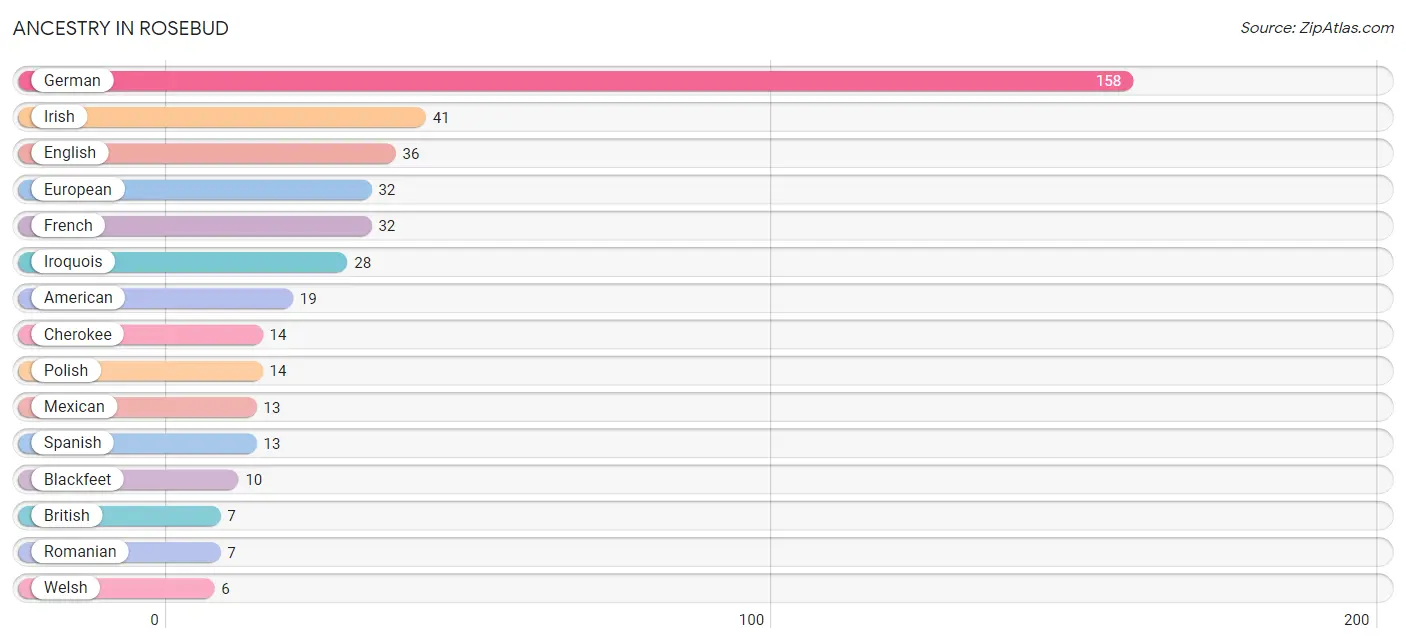
| Ancestry | # Population | % Population |
| American | 19 | 4.0% |
| Belgian | 2 | 0.4% |
| Blackfeet | 10 | 2.1% |
| British | 7 | 1.5% |
| Cherokee | 14 | 2.9% |
| Czech | 3 | 0.6% |
| English | 36 | 7.5% |
| European | 32 | 6.7% |
| French | 32 | 6.7% |
| German | 158 | 32.9% |
| Hungarian | 4 | 0.8% |
| Irish | 41 | 8.5% |
| Iroquois | 28 | 5.8% |
| Italian | 2 | 0.4% |
| Mexican | 13 | 2.7% |
| Northern European | 4 | 0.8% |
| Polish | 14 | 2.9% |
| Romanian | 7 | 1.5% |
| Scotch-Irish | 3 | 0.6% |
| Slovak | 5 | 1.0% |
| Spanish | 13 | 2.7% |
| Welsh | 6 | 1.3% | View All 22 Rows |
Immigrants in Rosebud
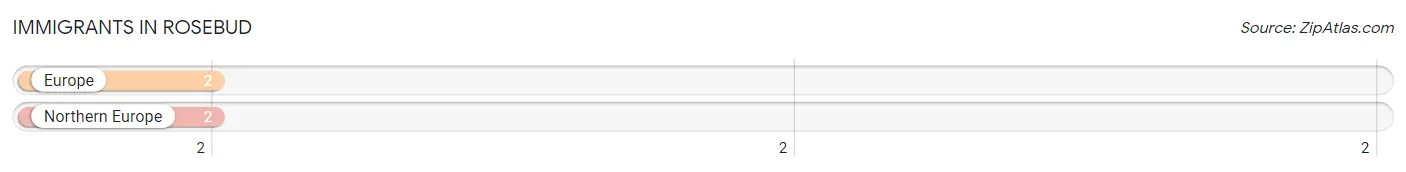
The most numerous immigrant groups reported in Rosebud came from Europe (2 | 0.4%), and Northern Europe (2 | 0.4%), together accounting for 0.8% of all Rosebud residents.
| Immigration Origin | # Population | % Population |
| Europe | 2 | 0.4% |
| Northern Europe | 2 | 0.4% | View All 2 Rows |
Sex and Age in Rosebud
Sex and Age in Rosebud
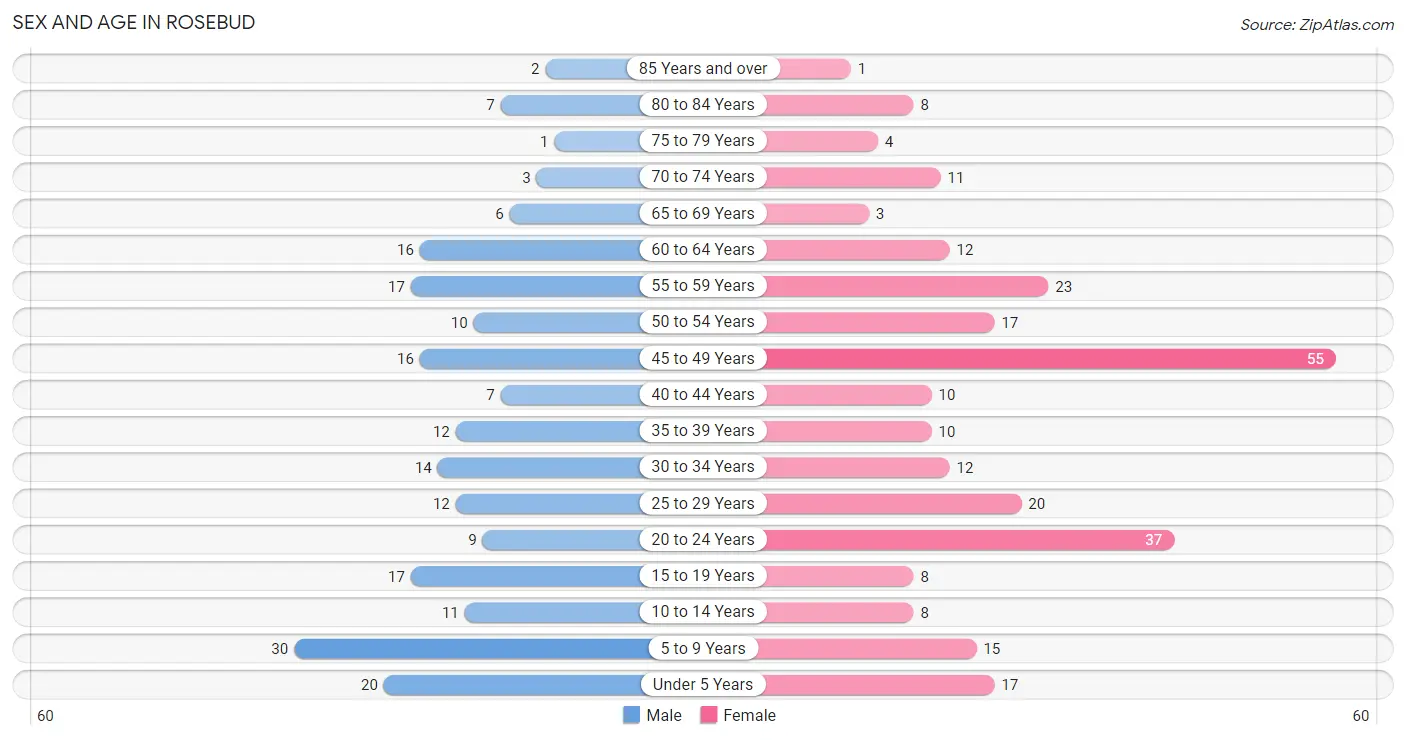
The most populous age groups in Rosebud are 5 to 9 Years (30 | 14.3%) for men and 45 to 49 Years (55 | 20.3%) for women.
| Age Bracket | Male | Female |
| Under 5 Years | 20 (9.5%) | 17 (6.3%) |
| 5 to 9 Years | 30 (14.3%) | 15 (5.5%) |
| 10 to 14 Years | 11 (5.2%) | 8 (2.9%) |
| 15 to 19 Years | 17 (8.1%) | 8 (2.9%) |
| 20 to 24 Years | 9 (4.3%) | 37 (13.7%) |
| 25 to 29 Years | 12 (5.7%) | 20 (7.4%) |
| 30 to 34 Years | 14 (6.7%) | 12 (4.4%) |
| 35 to 39 Years | 12 (5.7%) | 10 (3.7%) |
| 40 to 44 Years | 7 (3.3%) | 10 (3.7%) |
| 45 to 49 Years | 16 (7.6%) | 55 (20.3%) |
| 50 to 54 Years | 10 (4.8%) | 17 (6.3%) |
| 55 to 59 Years | 17 (8.1%) | 23 (8.5%) |
| 60 to 64 Years | 16 (7.6%) | 12 (4.4%) |
| 65 to 69 Years | 6 (2.9%) | 3 (1.1%) |
| 70 to 74 Years | 3 (1.4%) | 11 (4.1%) |
| 75 to 79 Years | 1 (0.5%) | 4 (1.5%) |
| 80 to 84 Years | 7 (3.3%) | 8 (2.9%) |
| 85 Years and over | 2 (0.9%) | 1 (0.4%) |
| Total | 210 (100.0%) | 271 (100.0%) |
Families and Households in Rosebud
Median Family Size in Rosebud
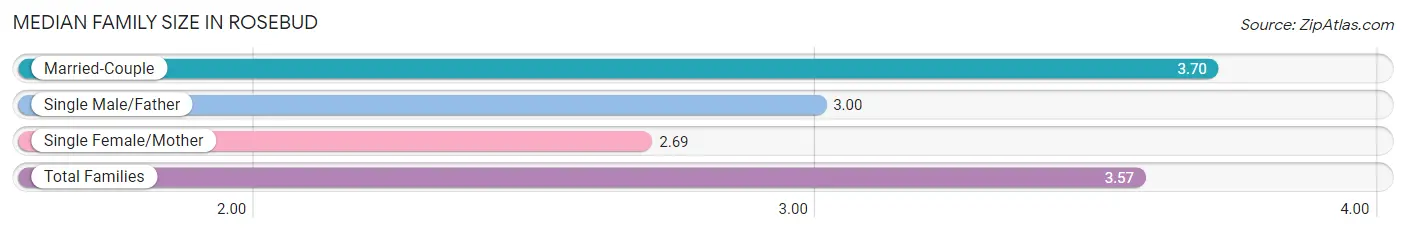
The median family size in Rosebud is 3.57 persons per family, with married-couple families (90 | 86.5%) accounting for the largest median family size of 3.7 persons per family. On the other hand, single female/mother families (13 | 12.5%) represent the smallest median family size with 2.69 persons per family.
| Family Type | # Families | Family Size |
| Married-Couple | 90 (86.5%) | 3.70 |
| Single Male/Father | 1 (1.0%) | 3.00 |
| Single Female/Mother | 13 (12.5%) | 2.69 |
| Total Families | 104 (100.0%) | 3.57 |
Median Household Size in Rosebud
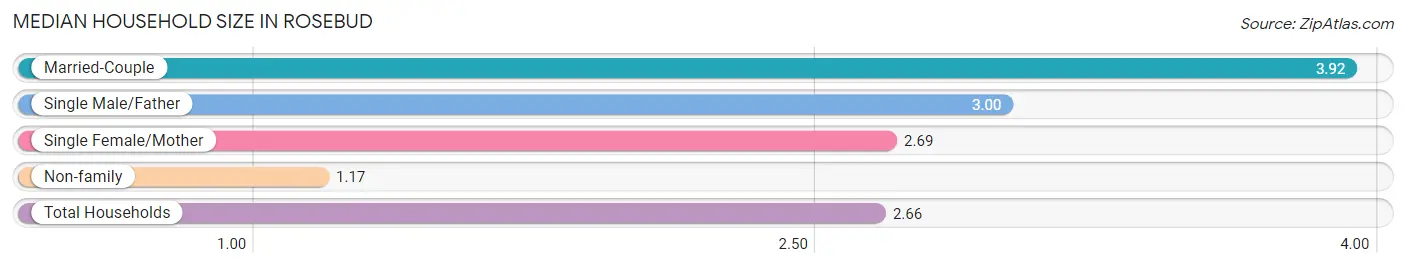
The median household size in Rosebud is 2.66 persons per household, with married-couple households (90 | 49.7%) accounting for the largest median household size of 3.92 persons per household. non-family households (77 | 42.5%) represent the smallest median household size with 1.17 persons per household.
| Household Type | # Households | Household Size |
| Married-Couple | 90 (49.7%) | 3.92 |
| Single Male/Father | 1 (0.5%) | 3.00 |
| Single Female/Mother | 13 (7.2%) | 2.69 |
| Non-family | 77 (42.5%) | 1.17 |
| Total Households | 181 (100.0%) | 2.66 |
Household Size by Marriage Status in Rosebud
Out of a total of 181 households in Rosebud, 104 (57.5%) are family households, while 77 (42.5%) are nonfamily households. The most numerous type of family households are 2-person households, comprising 43, and the most common type of nonfamily households are 1-person households, comprising 68.
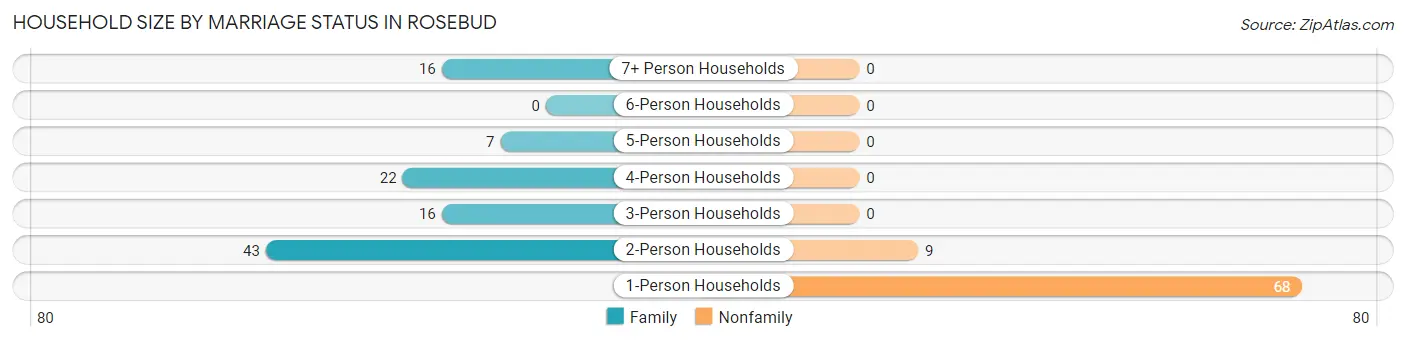
| Household Size | Family Households | Nonfamily Households |
| 1-Person Households | - | 68 (37.6%) |
| 2-Person Households | 43 (23.8%) | 9 (5.0%) |
| 3-Person Households | 16 (8.8%) | 0 (0.0%) |
| 4-Person Households | 22 (12.1%) | 0 (0.0%) |
| 5-Person Households | 7 (3.9%) | 0 (0.0%) |
| 6-Person Households | 0 (0.0%) | 0 (0.0%) |
| 7+ Person Households | 16 (8.8%) | 0 (0.0%) |
| Total | 104 (57.5%) | 77 (42.5%) |
Female Fertility in Rosebud
Fertility by Age in Rosebud
Average fertility rate in Rosebud is 140.0 births per 1,000 women. Women in the age bracket of 20 to 34 years have the highest fertility rate with 319.0 births per 1,000 women. Women in the age bracket of 20 to 34 years acount for 100.0% of all women with births.
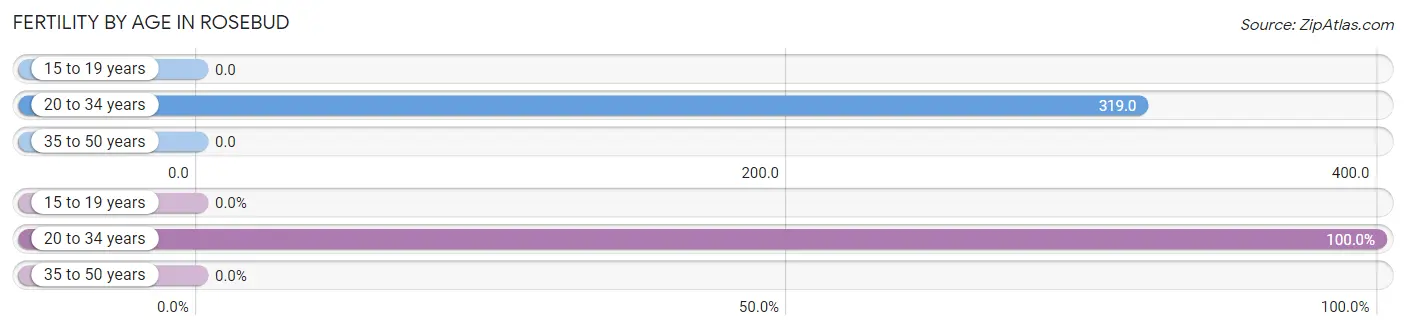
| Age Bracket | Women with Births | Births / 1,000 Women |
| 15 to 19 years | 0 (0.0%) | 0.0 |
| 20 to 34 years | 22 (100.0%) | 319.0 |
| 35 to 50 years | 0 (0.0%) | 0.0 |
| Total | 22 (100.0%) | 140.0 |
Fertility by Age by Marriage Status in Rosebud
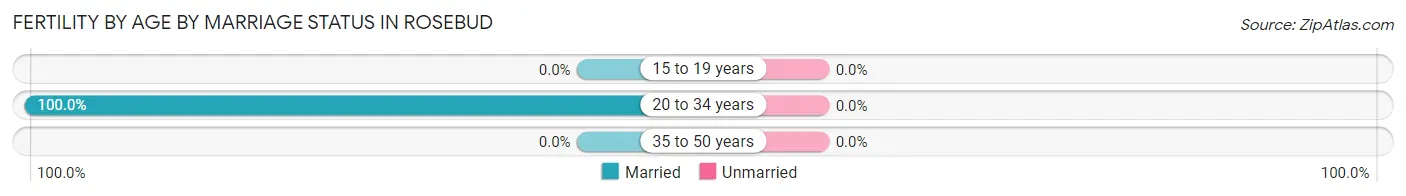
| Age Bracket | Married | Unmarried |
| 15 to 19 years | 0 (0.0%) | 0 (0.0%) |
| 20 to 34 years | 22 (100.0%) | 0 (0.0%) |
| 35 to 50 years | 0 (0.0%) | 0 (0.0%) |
| Total | 22 (100.0%) | 0 (0.0%) |
Fertility by Education in Rosebud
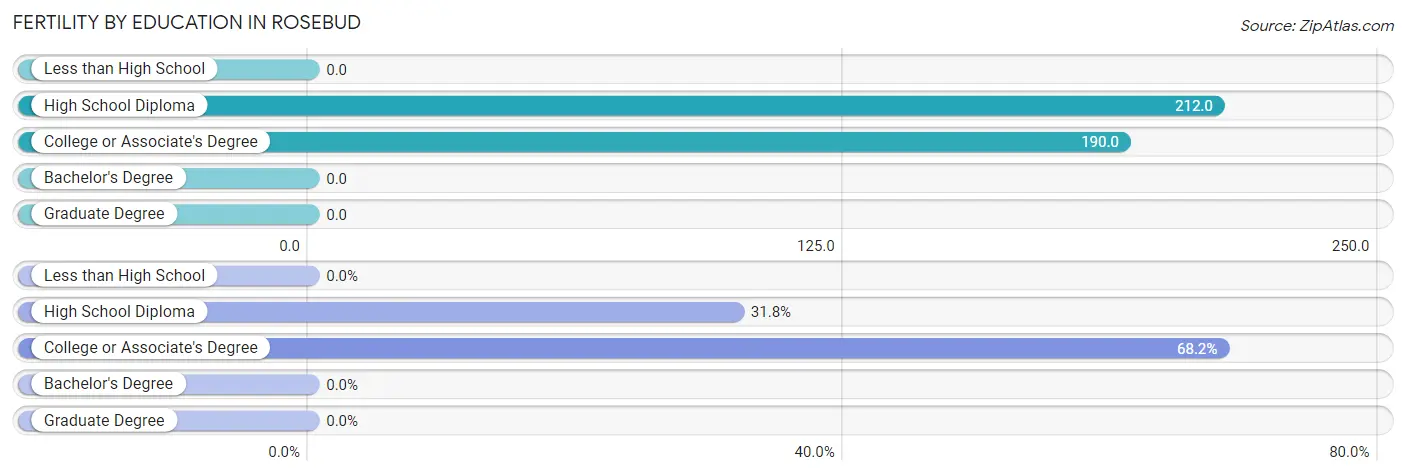
| Educational Attainment | Women with Births | Births / 1,000 Women |
| Less than High School | 0 (0.0%) | 0.0 |
| High School Diploma | 7 (31.8%) | 212.0 |
| College or Associate's Degree | 15 (68.2%) | 190.0 |
| Bachelor's Degree | 0 (0.0%) | 0.0 |
| Graduate Degree | 0 (0.0%) | 0.0 |
| Total | 22 (100.0%) | 140.0 |
Fertility by Education by Marriage Status in Rosebud
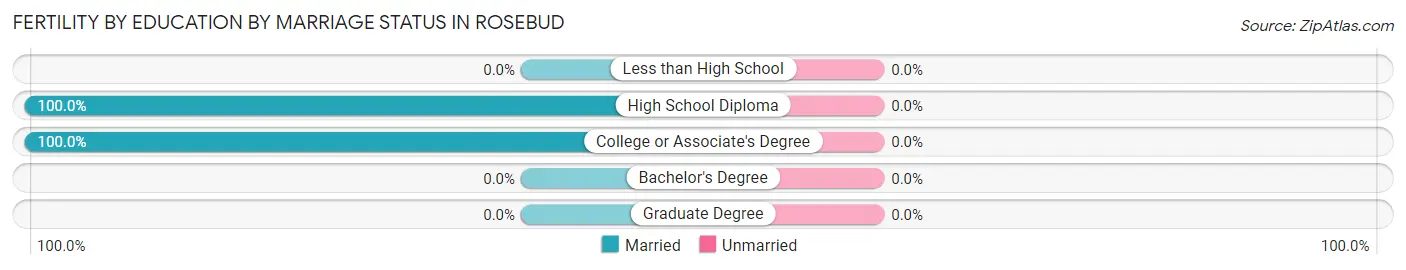
| Educational Attainment | Married | Unmarried |
| Less than High School | 0 (0.0%) | 0 (0.0%) |
| High School Diploma | 7 (100.0%) | 0 (0.0%) |
| College or Associate's Degree | 15 (100.0%) | 0 (0.0%) |
| Bachelor's Degree | 0 (0.0%) | 0 (0.0%) |
| Graduate Degree | 0 (0.0%) | 0 (0.0%) |
| Total | 22 (100.0%) | 0 (0.0%) |
Employment Characteristics in Rosebud
Employment by Class of Employer in Rosebud
Among the 215 employed individuals in Rosebud, private company employees (141 | 65.6%), local government employees (48 | 22.3%), and state government employees (10 | 4.6%) make up the most common classes of employment.
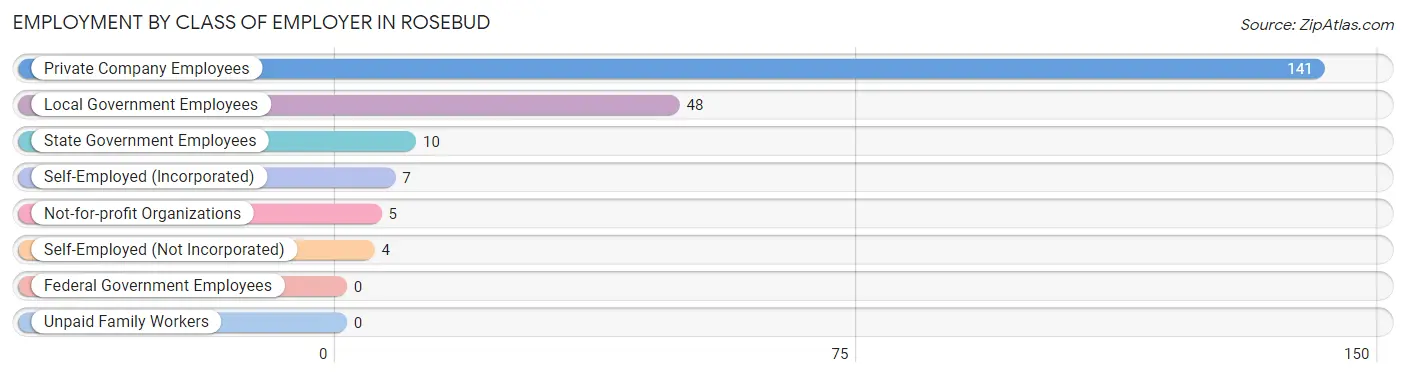
| Employer Class | # Employees | % Employees |
| Private Company Employees | 141 | 65.6% |
| Self-Employed (Incorporated) | 7 | 3.3% |
| Self-Employed (Not Incorporated) | 4 | 1.9% |
| Not-for-profit Organizations | 5 | 2.3% |
| Local Government Employees | 48 | 22.3% |
| State Government Employees | 10 | 4.6% |
| Federal Government Employees | 0 | 0.0% |
| Unpaid Family Workers | 0 | 0.0% |
| Total | 215 | 100.0% |
Employment Status by Age in Rosebud
According to the labor force statistics for Rosebud, out of the total population over 16 years of age (379), 63.3% or 240 individuals are in the labor force, with 5.0% or 12 of them unemployed. The age group with the highest labor force participation rate is 25 to 29 years, with 90.6% or 29 individuals in the labor force. Within the labor force, the 16 to 19 years age range has the highest percentage of unemployed individuals, with 18.2% or 2 of them being unemployed.
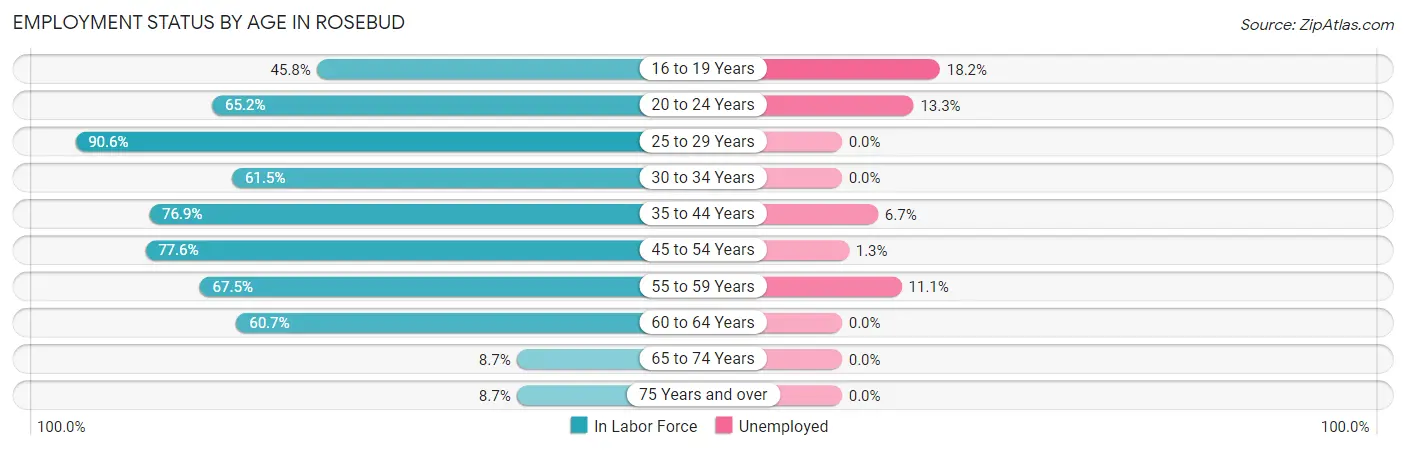
| Age Bracket | In Labor Force | Unemployed |
| 16 to 19 Years | 11 (45.8%) | 2 (18.2%) |
| 20 to 24 Years | 30 (65.2%) | 4 (13.3%) |
| 25 to 29 Years | 29 (90.6%) | 0 (0.0%) |
| 30 to 34 Years | 16 (61.5%) | 0 (0.0%) |
| 35 to 44 Years | 30 (76.9%) | 2 (6.7%) |
| 45 to 54 Years | 76 (77.6%) | 1 (1.3%) |
| 55 to 59 Years | 27 (67.5%) | 3 (11.1%) |
| 60 to 64 Years | 17 (60.7%) | 0 (0.0%) |
| 65 to 74 Years | 2 (8.7%) | 0 (0.0%) |
| 75 Years and over | 2 (8.7%) | 0 (0.0%) |
| Total | 240 (63.3%) | 12 (5.0%) |
Employment Status by Educational Attainment in Rosebud
According to labor force statistics for Rosebud, 74.1% of individuals (195) out of the total population between 25 and 64 years of age (263) are in the labor force, with 3.1% or 6 of them being unemployed. The group with the highest labor force participation rate are those with the educational attainment of bachelor's degree or higher, with 88.0% or 22 individuals in the labor force. Within the labor force, individuals with high school diploma education have the highest percentage of unemployment, with 5.0% or 3 of them being unemployed.
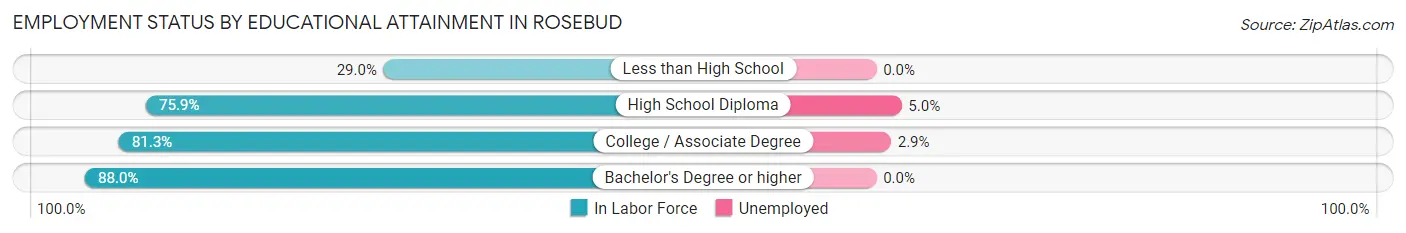
| Educational Attainment | In Labor Force | Unemployed |
| Less than High School | 9 (29.0%) | 0 (0.0%) |
| High School Diploma | 60 (75.9%) | 4 (5.0%) |
| College / Associate Degree | 104 (81.3%) | 4 (2.9%) |
| Bachelor's Degree or higher | 22 (88.0%) | 0 (0.0%) |
| Total | 195 (74.1%) | 8 (3.1%) |
Employment Occupations by Sex in Rosebud
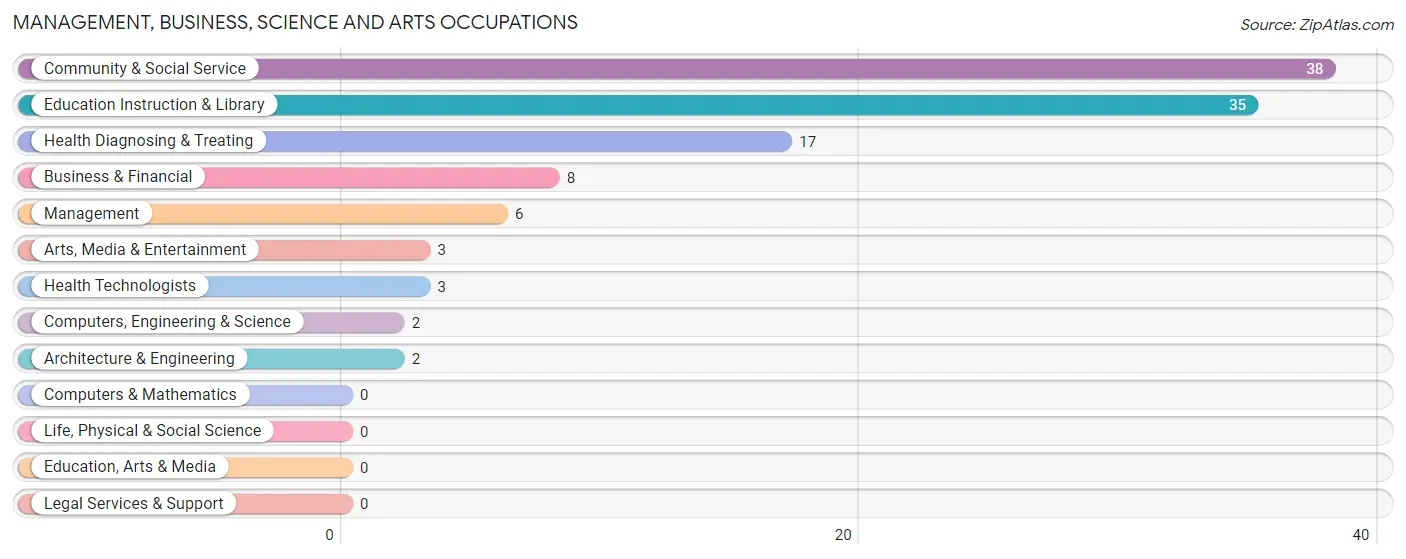
Management, Business, Science and Arts Occupations
The most common Management, Business, Science and Arts occupations in Rosebud are Community & Social Service (38 | 16.7%), Education Instruction & Library (35 | 15.3%), Health Diagnosing & Treating (17 | 7.5%), Business & Financial (8 | 3.5%), and Management (6 | 2.6%).
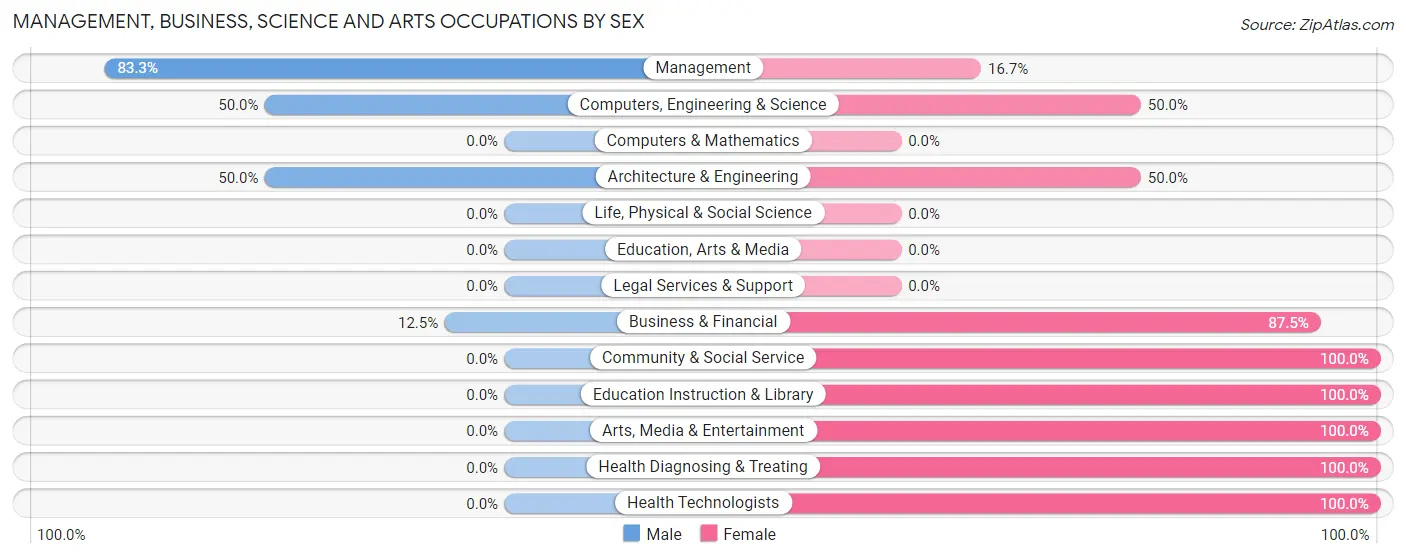
Management, Business, Science and Arts Occupations by Sex
Within the Management, Business, Science and Arts occupations in Rosebud, the most male-oriented occupations are Management (83.3%), Computers, Engineering & Science (50.0%), and Architecture & Engineering (50.0%), while the most female-oriented occupations are Community & Social Service (100.0%), Education Instruction & Library (100.0%), and Arts, Media & Entertainment (100.0%).
| Occupation | Male | Female |
| Management | 5 (83.3%) | 1 (16.7%) |
| Business & Financial | 1 (12.5%) | 7 (87.5%) |
| Computers, Engineering & Science | 1 (50.0%) | 1 (50.0%) |
| Computers & Mathematics | 0 (0.0%) | 0 (0.0%) |
| Architecture & Engineering | 1 (50.0%) | 1 (50.0%) |
| Life, Physical & Social Science | 0 (0.0%) | 0 (0.0%) |
| Community & Social Service | 0 (0.0%) | 38 (100.0%) |
| Education, Arts & Media | 0 (0.0%) | 0 (0.0%) |
| Legal Services & Support | 0 (0.0%) | 0 (0.0%) |
| Education Instruction & Library | 0 (0.0%) | 35 (100.0%) |
| Arts, Media & Entertainment | 0 (0.0%) | 3 (100.0%) |
| Health Diagnosing & Treating | 0 (0.0%) | 17 (100.0%) |
| Health Technologists | 0 (0.0%) | 3 (100.0%) |
| Total (Category) | 7 (9.9%) | 64 (90.1%) |
| Total (Overall) | 98 (43.0%) | 130 (57.0%) |
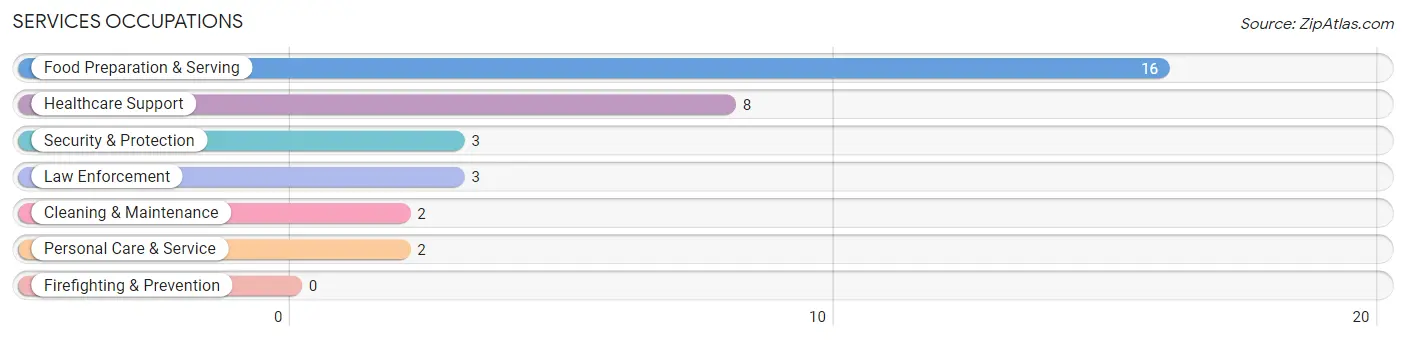
Services Occupations
The most common Services occupations in Rosebud are Food Preparation & Serving (16 | 7.0%), Healthcare Support (8 | 3.5%), Security & Protection (3 | 1.3%), Law Enforcement (3 | 1.3%), and Cleaning & Maintenance (2 | 0.9%).
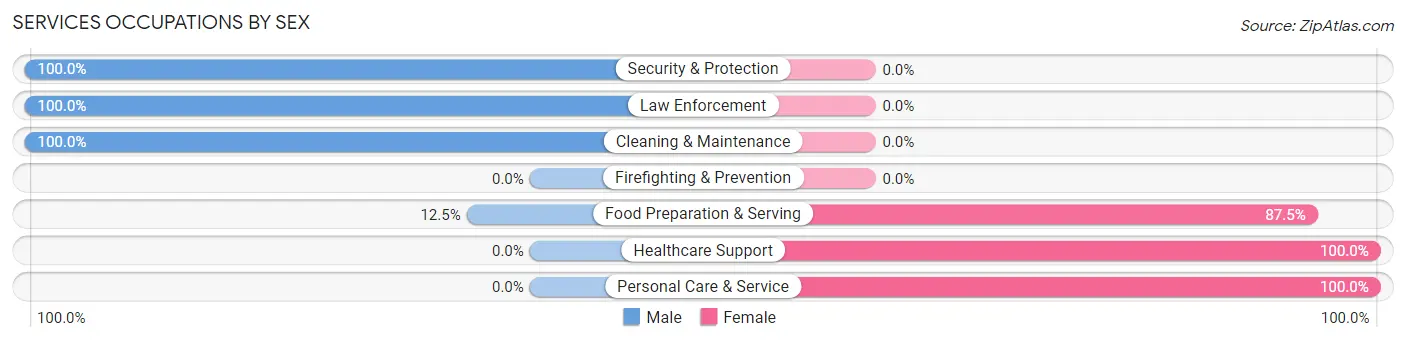
Services Occupations by Sex
Within the Services occupations in Rosebud, the most male-oriented occupations are Security & Protection (100.0%), Law Enforcement (100.0%), and Cleaning & Maintenance (100.0%), while the most female-oriented occupations are Healthcare Support (100.0%), Personal Care & Service (100.0%), and Food Preparation & Serving (87.5%).
| Occupation | Male | Female |
| Healthcare Support | 0 (0.0%) | 8 (100.0%) |
| Security & Protection | 3 (100.0%) | 0 (0.0%) |
| Firefighting & Prevention | 0 (0.0%) | 0 (0.0%) |
| Law Enforcement | 3 (100.0%) | 0 (0.0%) |
| Food Preparation & Serving | 2 (12.5%) | 14 (87.5%) |
| Cleaning & Maintenance | 2 (100.0%) | 0 (0.0%) |
| Personal Care & Service | 0 (0.0%) | 2 (100.0%) |
| Total (Category) | 7 (22.6%) | 24 (77.4%) |
| Total (Overall) | 98 (43.0%) | 130 (57.0%) |
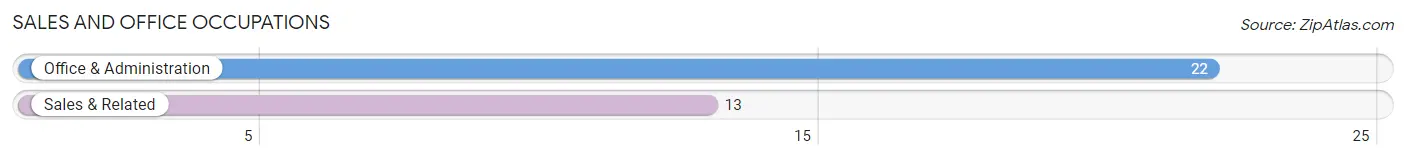
Sales and Office Occupations
The most common Sales and Office occupations in Rosebud are Office & Administration (22 | 9.7%), and Sales & Related (13 | 5.7%).
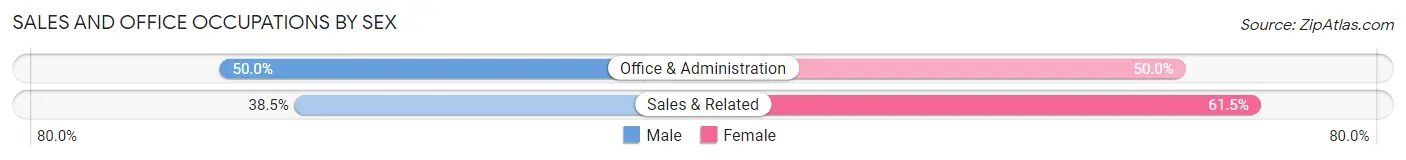
Sales and Office Occupations by Sex
| Occupation | Male | Female |
| Sales & Related | 5 (38.5%) | 8 (61.5%) |
| Office & Administration | 11 (50.0%) | 11 (50.0%) |
| Total (Category) | 16 (45.7%) | 19 (54.3%) |
| Total (Overall) | 98 (43.0%) | 130 (57.0%) |
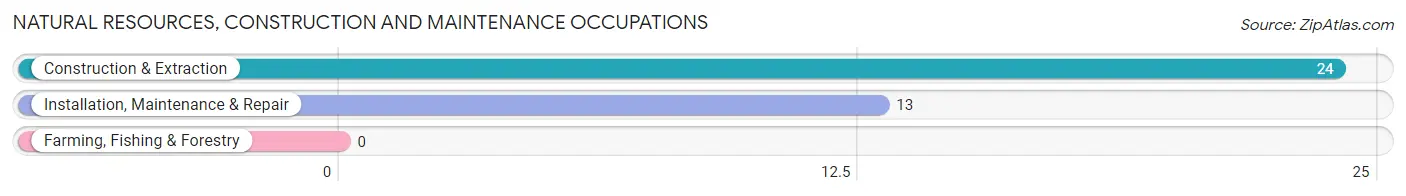
Natural Resources, Construction and Maintenance Occupations
The most common Natural Resources, Construction and Maintenance occupations in Rosebud are Construction & Extraction (24 | 10.5%), and Installation, Maintenance & Repair (13 | 5.7%).
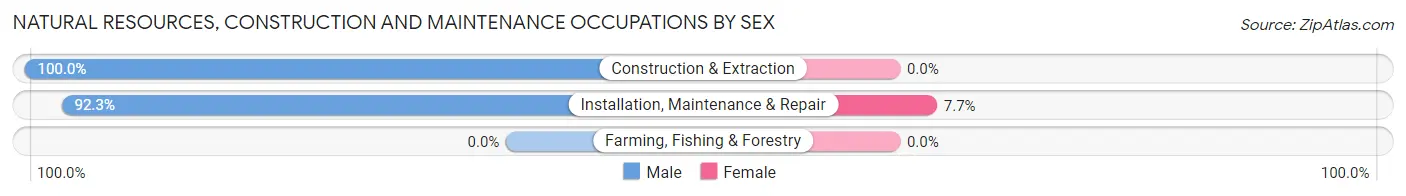
Natural Resources, Construction and Maintenance Occupations by Sex
| Occupation | Male | Female |
| Farming, Fishing & Forestry | 0 (0.0%) | 0 (0.0%) |
| Construction & Extraction | 24 (100.0%) | 0 (0.0%) |
| Installation, Maintenance & Repair | 12 (92.3%) | 1 (7.7%) |
| Total (Category) | 36 (97.3%) | 1 (2.7%) |
| Total (Overall) | 98 (43.0%) | 130 (57.0%) |
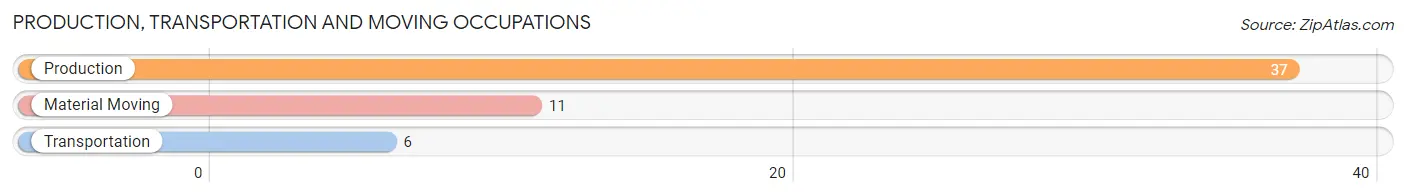
Production, Transportation and Moving Occupations
The most common Production, Transportation and Moving occupations in Rosebud are Production (37 | 16.2%), Material Moving (11 | 4.8%), and Transportation (6 | 2.6%).
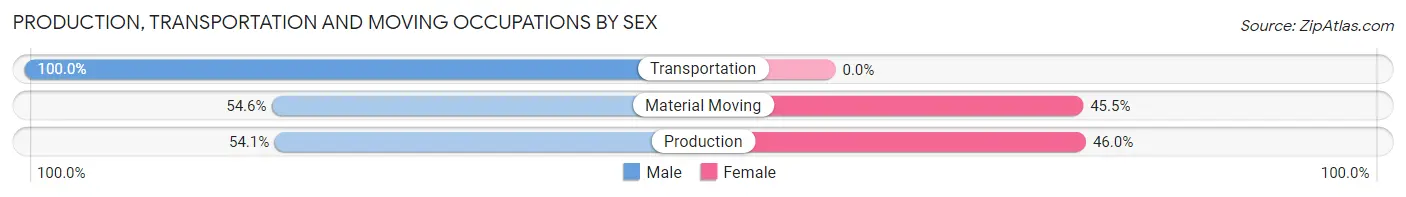
Production, Transportation and Moving Occupations by Sex
| Occupation | Male | Female |
| Production | 20 (54.0%) | 17 (46.0%) |
| Transportation | 6 (100.0%) | 0 (0.0%) |
| Material Moving | 6 (54.5%) | 5 (45.5%) |
| Total (Category) | 32 (59.3%) | 22 (40.7%) |
| Total (Overall) | 98 (43.0%) | 130 (57.0%) |
Employment Industries by Sex in Rosebud
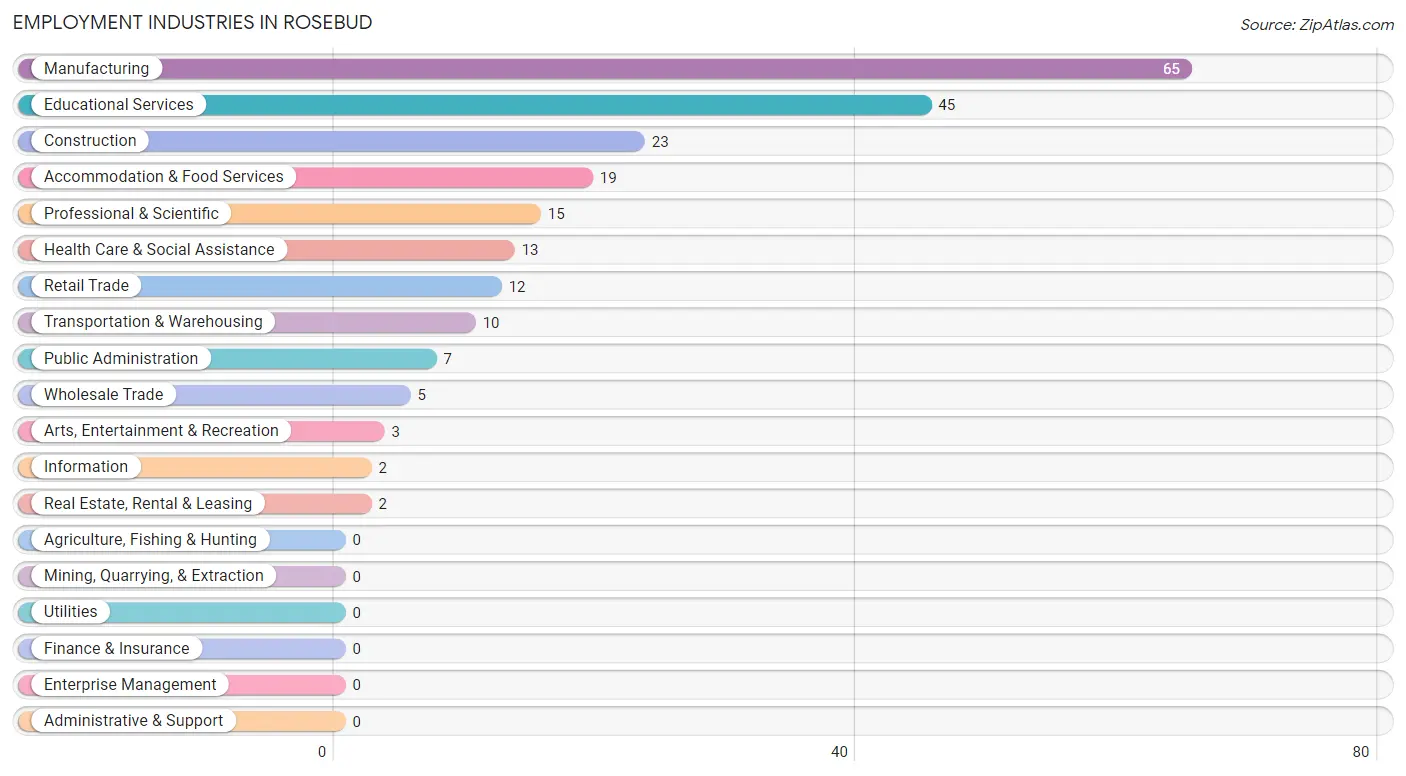
Employment Industries in Rosebud
The major employment industries in Rosebud include Manufacturing (65 | 28.5%), Educational Services (45 | 19.7%), Construction (23 | 10.1%), Accommodation & Food Services (19 | 8.3%), and Professional & Scientific (15 | 6.6%).
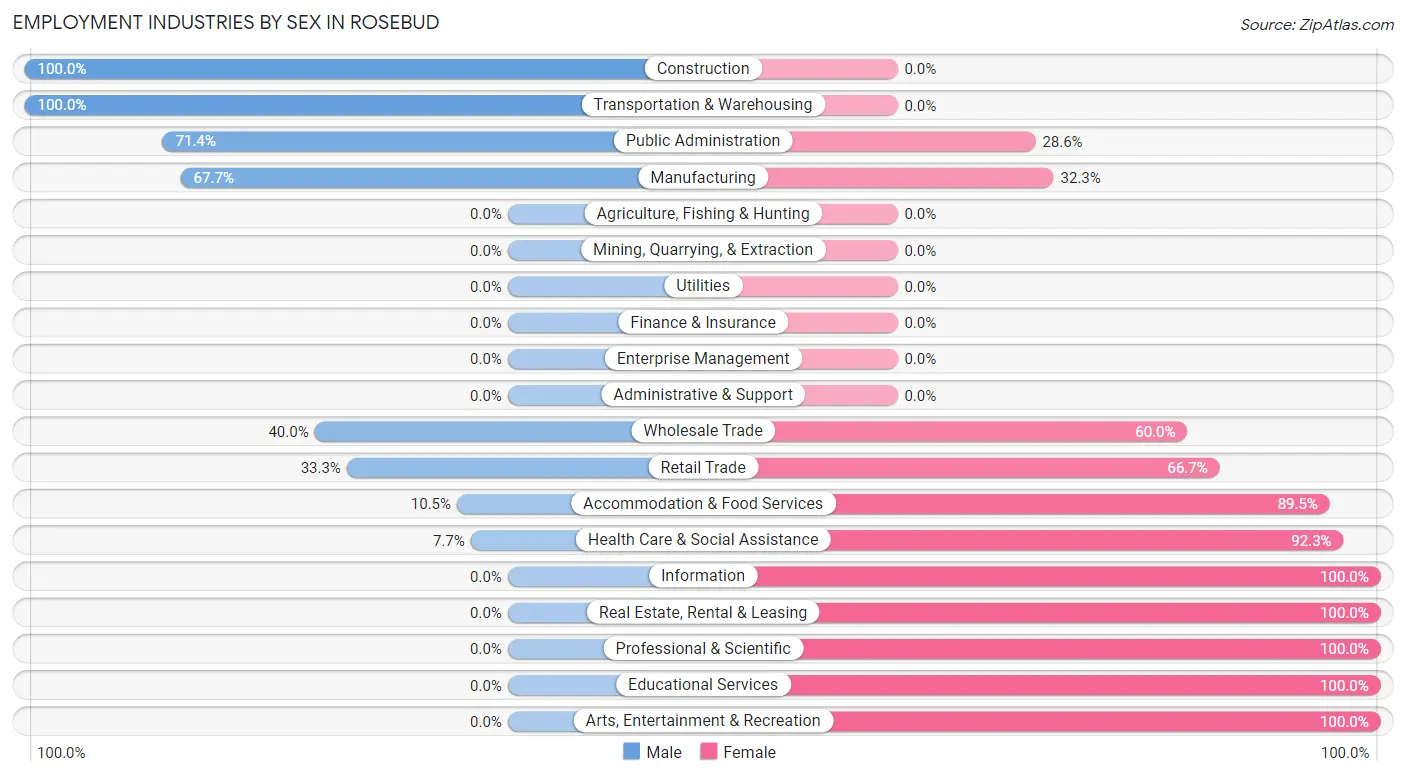
Employment Industries by Sex in Rosebud
The Rosebud industries that see more men than women are Construction (100.0%), Transportation & Warehousing (100.0%), and Public Administration (71.4%), whereas the industries that tend to have a higher number of women are Information (100.0%), Real Estate, Rental & Leasing (100.0%), and Professional & Scientific (100.0%).
| Industry | Male | Female |
| Agriculture, Fishing & Hunting | 0 (0.0%) | 0 (0.0%) |
| Mining, Quarrying, & Extraction | 0 (0.0%) | 0 (0.0%) |
| Construction | 23 (100.0%) | 0 (0.0%) |
| Manufacturing | 44 (67.7%) | 21 (32.3%) |
| Wholesale Trade | 2 (40.0%) | 3 (60.0%) |
| Retail Trade | 4 (33.3%) | 8 (66.7%) |
| Transportation & Warehousing | 10 (100.0%) | 0 (0.0%) |
| Utilities | 0 (0.0%) | 0 (0.0%) |
| Information | 0 (0.0%) | 2 (100.0%) |
| Finance & Insurance | 0 (0.0%) | 0 (0.0%) |
| Real Estate, Rental & Leasing | 0 (0.0%) | 2 (100.0%) |
| Professional & Scientific | 0 (0.0%) | 15 (100.0%) |
| Enterprise Management | 0 (0.0%) | 0 (0.0%) |
| Administrative & Support | 0 (0.0%) | 0 (0.0%) |
| Educational Services | 0 (0.0%) | 45 (100.0%) |
| Health Care & Social Assistance | 1 (7.7%) | 12 (92.3%) |
| Arts, Entertainment & Recreation | 0 (0.0%) | 3 (100.0%) |
| Accommodation & Food Services | 2 (10.5%) | 17 (89.5%) |
| Public Administration | 5 (71.4%) | 2 (28.6%) |
| Total | 98 (43.0%) | 130 (57.0%) |
Education in Rosebud
School Enrollment in Rosebud
The most common levels of schooling among the 67 students in Rosebud are elementary school (26 | 38.8%), middle school (19 | 28.4%), and high school (13 | 19.4%).
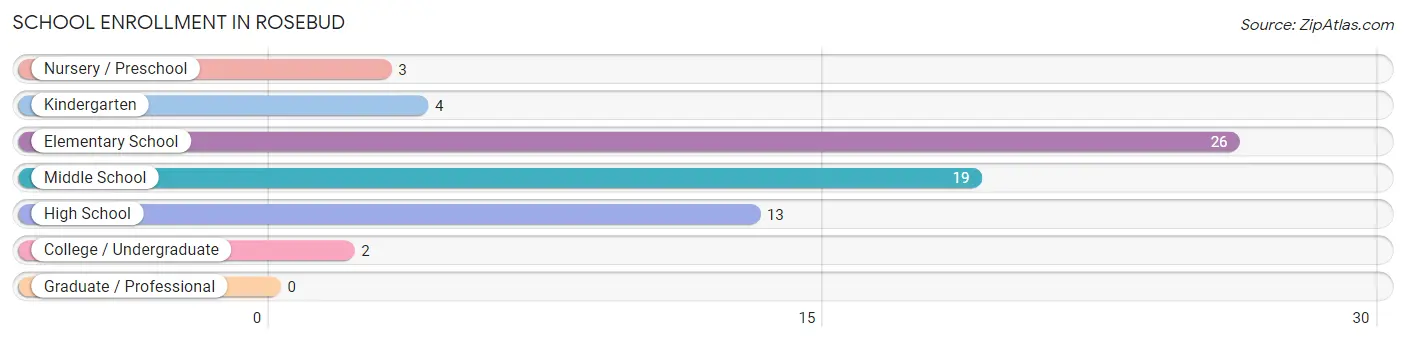
| School Level | # Students | % Students |
| Nursery / Preschool | 3 | 4.5% |
| Kindergarten | 4 | 6.0% |
| Elementary School | 26 | 38.8% |
| Middle School | 19 | 28.4% |
| High School | 13 | 19.4% |
| College / Undergraduate | 2 | 3.0% |
| Graduate / Professional | 0 | 0.0% |
| Total | 67 | 100.0% |
School Enrollment by Age by Funding Source in Rosebud
Out of a total of 67 students who are enrolled in schools in Rosebud, 3 (4.5%) attend a private institution, while the remaining 64 (95.5%) are enrolled in public schools. The age group of 5 to 9 year old has the highest likelihood of being enrolled in private schools, with 2 (6.2% in the age bracket) enrolled. Conversely, the age group of 3 to 4 year olds has the lowest likelihood of being enrolled in a private school, with 1 (100.0% in the age bracket) attending a public institution.
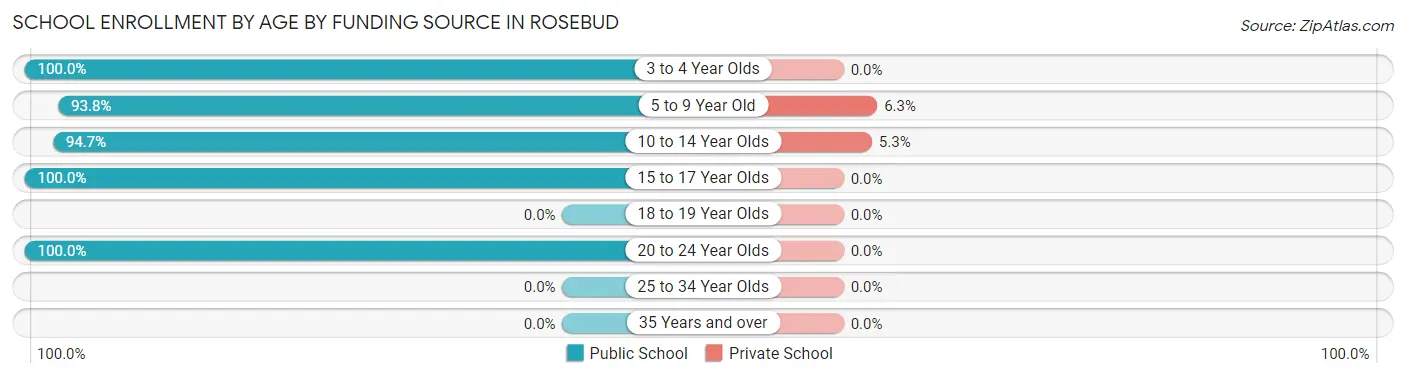
| Age Bracket | Public School | Private School |
| 3 to 4 Year Olds | 1 (100.0%) | 0 (0.0%) |
| 5 to 9 Year Old | 30 (93.8%) | 2 (6.2%) |
| 10 to 14 Year Olds | 18 (94.7%) | 1 (5.3%) |
| 15 to 17 Year Olds | 10 (100.0%) | 0 (0.0%) |
| 18 to 19 Year Olds | 0 (0.0%) | 0 (0.0%) |
| 20 to 24 Year Olds | 5 (100.0%) | 0 (0.0%) |
| 25 to 34 Year Olds | 0 (0.0%) | 0 (0.0%) |
| 35 Years and over | 0 (0.0%) | 0 (0.0%) |
| Total | 64 (95.5%) | 3 (4.5%) |
Educational Attainment by Field of Study in Rosebud
Business (12 | 32.4%), communications (7 | 18.9%), education (6 | 16.2%), visual & performing arts (5 | 13.5%), and engineering (2 | 5.4%) are the most common fields of study among 37 individuals in Rosebud who have obtained a bachelor's degree or higher.
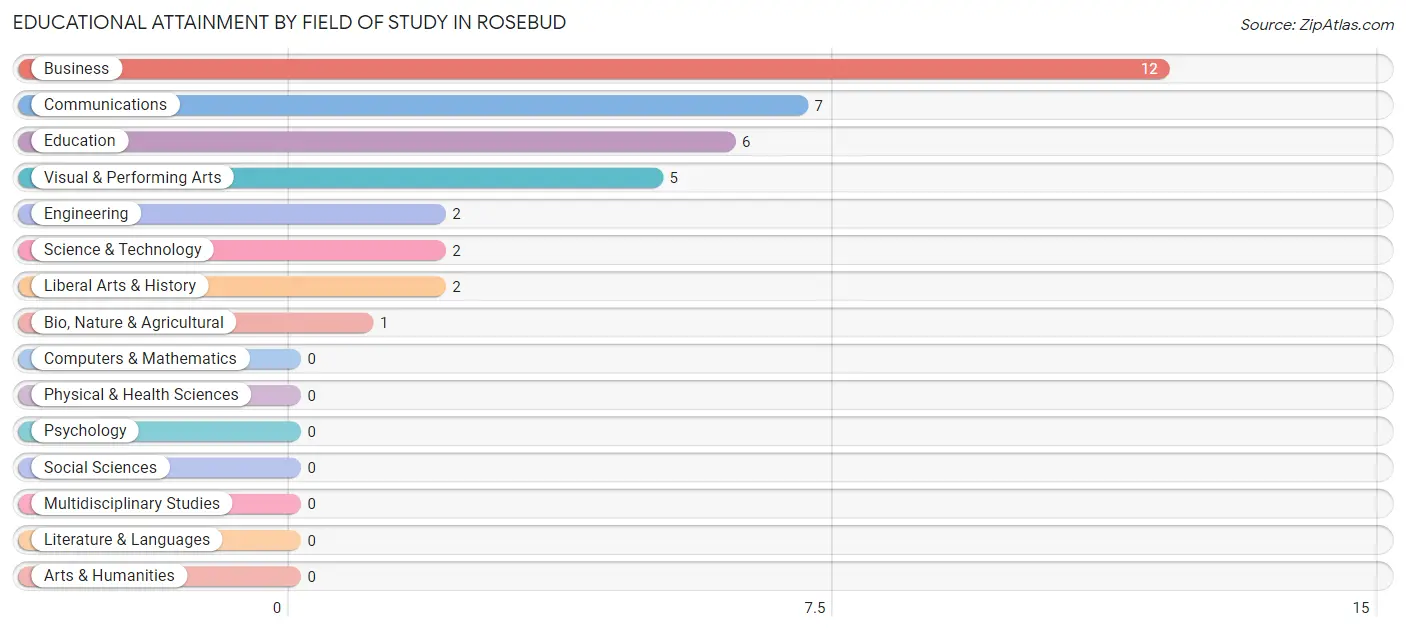
| Field of Study | # Graduates | % Graduates |
| Computers & Mathematics | 0 | 0.0% |
| Bio, Nature & Agricultural | 1 | 2.7% |
| Physical & Health Sciences | 0 | 0.0% |
| Psychology | 0 | 0.0% |
| Social Sciences | 0 | 0.0% |
| Engineering | 2 | 5.4% |
| Multidisciplinary Studies | 0 | 0.0% |
| Science & Technology | 2 | 5.4% |
| Business | 12 | 32.4% |
| Education | 6 | 16.2% |
| Literature & Languages | 0 | 0.0% |
| Liberal Arts & History | 2 | 5.4% |
| Visual & Performing Arts | 5 | 13.5% |
| Communications | 7 | 18.9% |
| Arts & Humanities | 0 | 0.0% |
| Total | 37 | 100.0% |
Transportation & Commute in Rosebud
Vehicle Availability by Sex in Rosebud
The most prevalent vehicle ownership categories in Rosebud are males with 2 vehicles (49, accounting for 50.0%) and females with 2 vehicles (41, making up 41.9%).
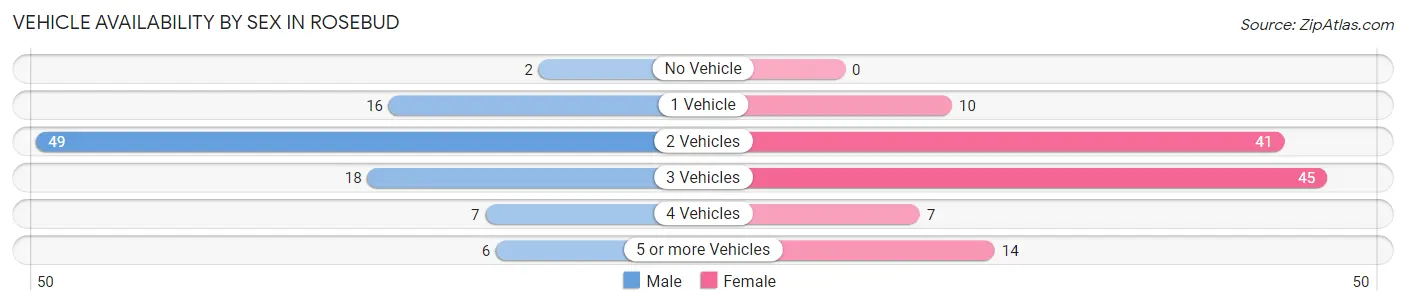
| Vehicles Available | Male | Female |
| No Vehicle | 2 (2.0%) | 0 (0.0%) |
| 1 Vehicle | 16 (16.3%) | 10 (8.6%) |
| 2 Vehicles | 49 (50.0%) | 41 (35.0%) |
| 3 Vehicles | 18 (18.4%) | 45 (38.5%) |
| 4 Vehicles | 7 (7.1%) | 7 (6.0%) |
| 5 or more Vehicles | 6 (6.1%) | 14 (12.0%) |
| Total | 98 (100.0%) | 117 (100.0%) |
Commute Time in Rosebud
The most frequently occuring commute durations in Rosebud are 10 to 14 minutes (67 commuters, 31.2%), 5 to 9 minutes (34 commuters, 15.8%), and less than 5 minutes (19 commuters, 8.8%).
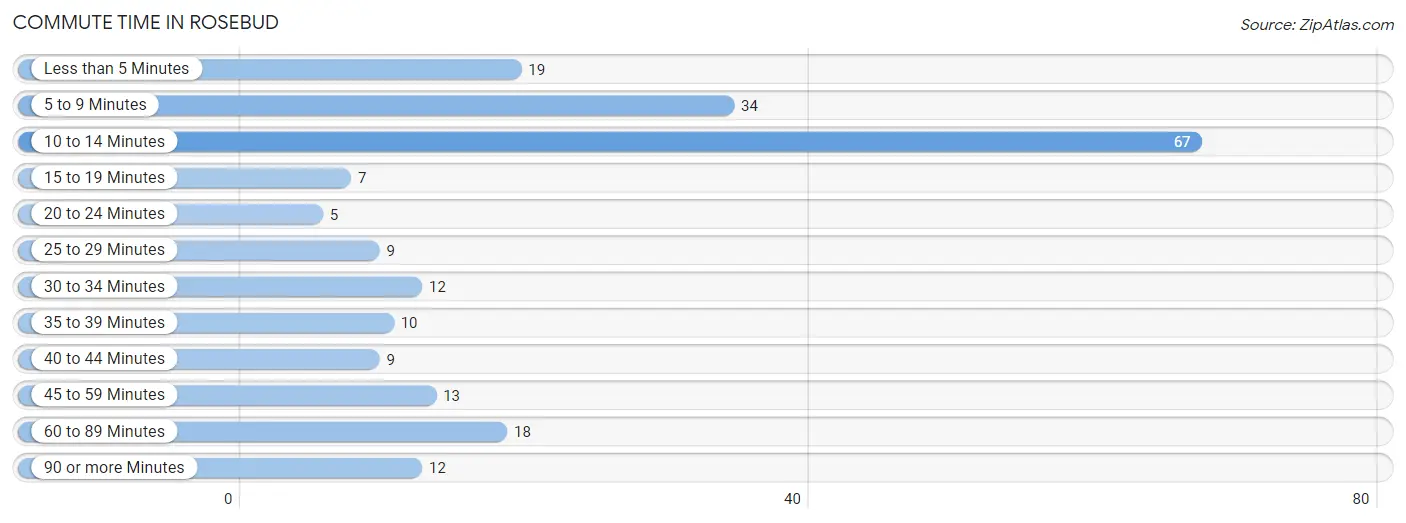
| Commute Time | # Commuters | % Commuters |
| Less than 5 Minutes | 19 | 8.8% |
| 5 to 9 Minutes | 34 | 15.8% |
| 10 to 14 Minutes | 67 | 31.2% |
| 15 to 19 Minutes | 7 | 3.3% |
| 20 to 24 Minutes | 5 | 2.3% |
| 25 to 29 Minutes | 9 | 4.2% |
| 30 to 34 Minutes | 12 | 5.6% |
| 35 to 39 Minutes | 10 | 4.6% |
| 40 to 44 Minutes | 9 | 4.2% |
| 45 to 59 Minutes | 13 | 6.0% |
| 60 to 89 Minutes | 18 | 8.4% |
| 90 or more Minutes | 12 | 5.6% |
Commute Time by Sex in Rosebud
The most common commute times in Rosebud are 5 to 9 minutes (13 commuters, 13.3%) for males and 10 to 14 minutes (59 commuters, 50.4%) for females.
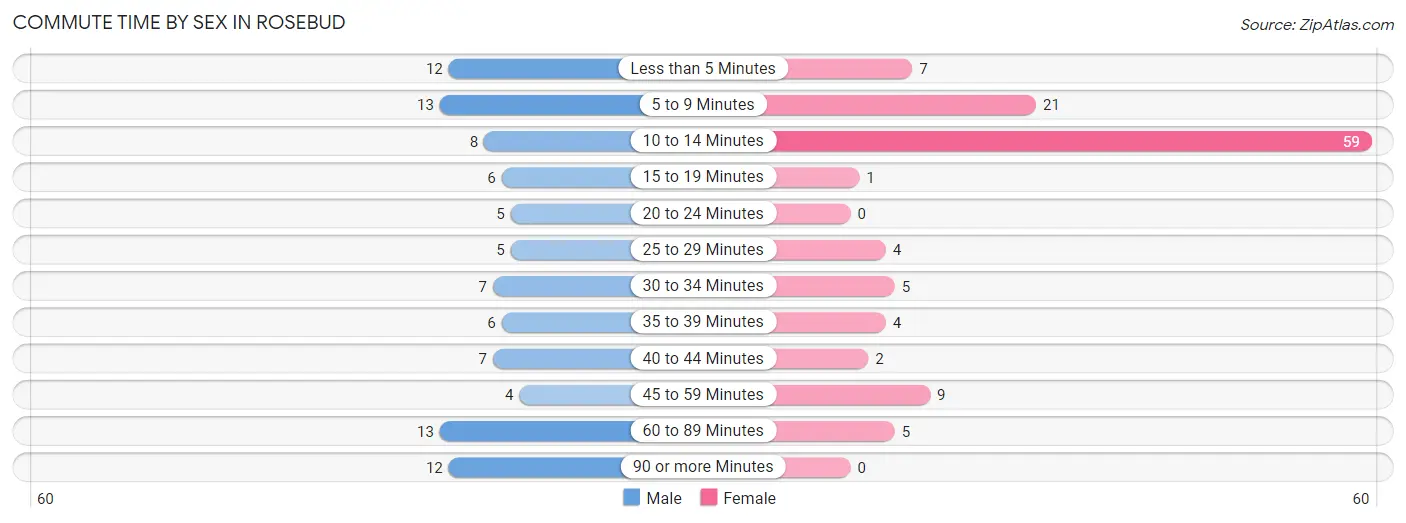
| Commute Time | Male | Female |
| Less than 5 Minutes | 12 (12.2%) | 7 (6.0%) |
| 5 to 9 Minutes | 13 (13.3%) | 21 (17.9%) |
| 10 to 14 Minutes | 8 (8.2%) | 59 (50.4%) |
| 15 to 19 Minutes | 6 (6.1%) | 1 (0.9%) |
| 20 to 24 Minutes | 5 (5.1%) | 0 (0.0%) |
| 25 to 29 Minutes | 5 (5.1%) | 4 (3.4%) |
| 30 to 34 Minutes | 7 (7.1%) | 5 (4.3%) |
| 35 to 39 Minutes | 6 (6.1%) | 4 (3.4%) |
| 40 to 44 Minutes | 7 (7.1%) | 2 (1.7%) |
| 45 to 59 Minutes | 4 (4.1%) | 9 (7.7%) |
| 60 to 89 Minutes | 13 (13.3%) | 5 (4.3%) |
| 90 or more Minutes | 12 (12.2%) | 0 (0.0%) |
Time of Departure to Work by Sex in Rosebud
The most frequent times of departure to work in Rosebud are 12:00 AM to 4:59 AM (16, 16.3%) for males and 5:30 AM to 5:59 AM (38, 32.5%) for females.
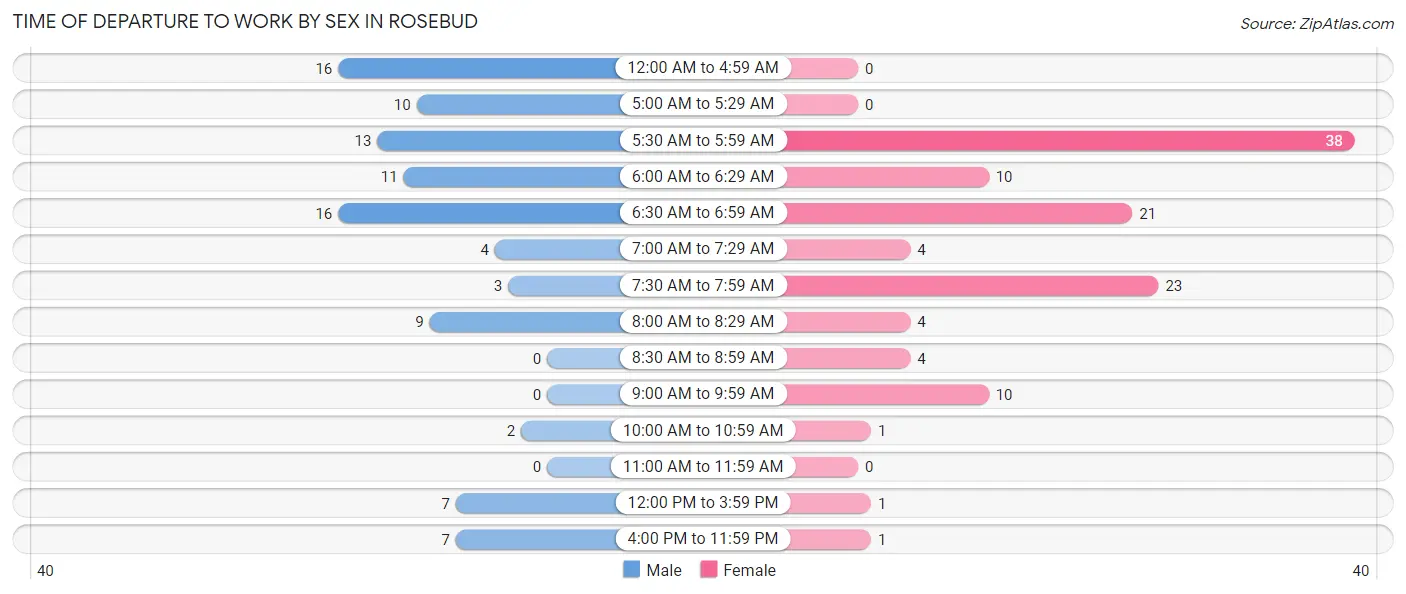
| Time of Departure | Male | Female |
| 12:00 AM to 4:59 AM | 16 (16.3%) | 0 (0.0%) |
| 5:00 AM to 5:29 AM | 10 (10.2%) | 0 (0.0%) |
| 5:30 AM to 5:59 AM | 13 (13.3%) | 38 (32.5%) |
| 6:00 AM to 6:29 AM | 11 (11.2%) | 10 (8.6%) |
| 6:30 AM to 6:59 AM | 16 (16.3%) | 21 (17.9%) |
| 7:00 AM to 7:29 AM | 4 (4.1%) | 4 (3.4%) |
| 7:30 AM to 7:59 AM | 3 (3.1%) | 23 (19.7%) |
| 8:00 AM to 8:29 AM | 9 (9.2%) | 4 (3.4%) |
| 8:30 AM to 8:59 AM | 0 (0.0%) | 4 (3.4%) |
| 9:00 AM to 9:59 AM | 0 (0.0%) | 10 (8.6%) |
| 10:00 AM to 10:59 AM | 2 (2.0%) | 1 (0.9%) |
| 11:00 AM to 11:59 AM | 0 (0.0%) | 0 (0.0%) |
| 12:00 PM to 3:59 PM | 7 (7.1%) | 1 (0.9%) |
| 4:00 PM to 11:59 PM | 7 (7.1%) | 1 (0.9%) |
| Total | 98 (100.0%) | 117 (100.0%) |
Housing Occupancy in Rosebud
Occupancy by Ownership in Rosebud
Of the total 181 dwellings in Rosebud, owner-occupied units account for 122 (67.4%), while renter-occupied units make up 59 (32.6%).
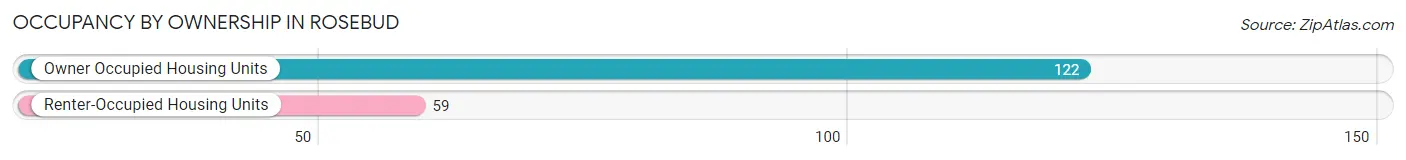
| Occupancy | # Housing Units | % Housing Units |
| Owner Occupied Housing Units | 122 | 67.4% |
| Renter-Occupied Housing Units | 59 | 32.6% |
| Total Occupied Housing Units | 181 | 100.0% |
Occupancy by Household Size in Rosebud
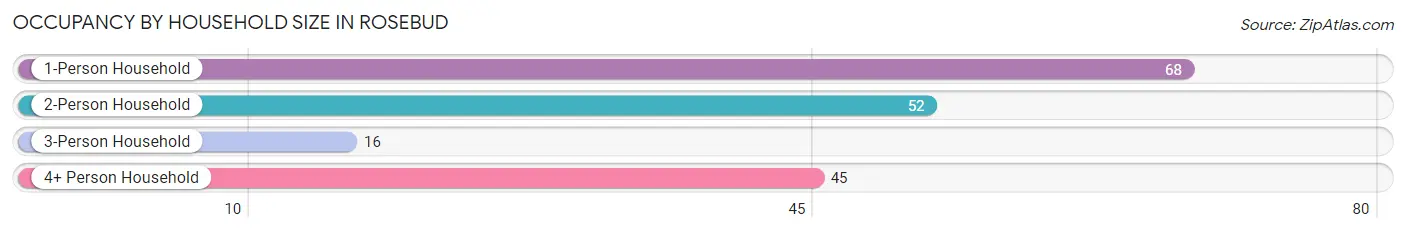
| Household Size | # Housing Units | % Housing Units |
| 1-Person Household | 68 | 37.6% |
| 2-Person Household | 52 | 28.7% |
| 3-Person Household | 16 | 8.8% |
| 4+ Person Household | 45 | 24.9% |
| Total Housing Units | 181 | 100.0% |
Occupancy by Ownership by Household Size in Rosebud
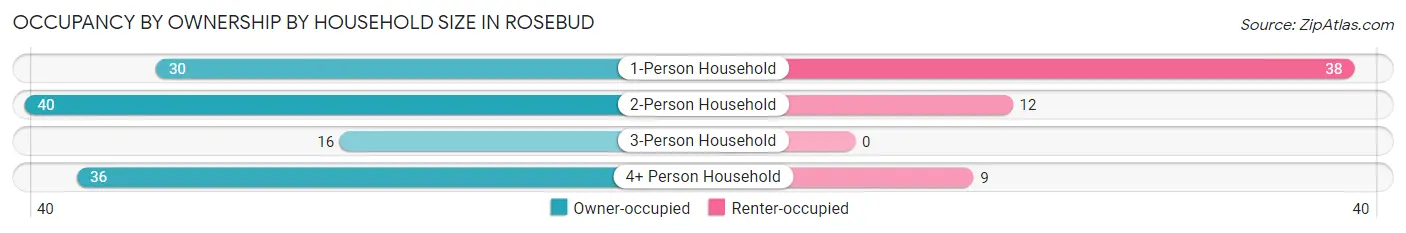
| Household Size | Owner-occupied | Renter-occupied |
| 1-Person Household | 30 (44.1%) | 38 (55.9%) |
| 2-Person Household | 40 (76.9%) | 12 (23.1%) |
| 3-Person Household | 16 (100.0%) | 0 (0.0%) |
| 4+ Person Household | 36 (80.0%) | 9 (20.0%) |
| Total Housing Units | 122 (67.4%) | 59 (32.6%) |
Occupancy by Educational Attainment in Rosebud
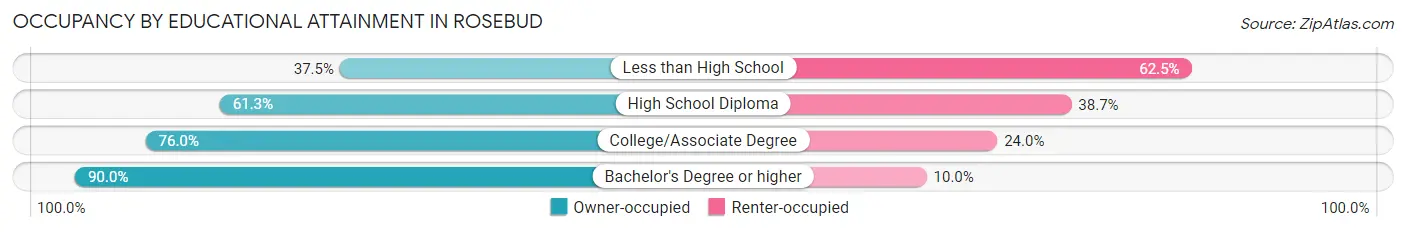
| Household Size | Owner-occupied | Renter-occupied |
| Less than High School | 9 (37.5%) | 15 (62.5%) |
| High School Diploma | 38 (61.3%) | 24 (38.7%) |
| College/Associate Degree | 57 (76.0%) | 18 (24.0%) |
| Bachelor's Degree or higher | 18 (90.0%) | 2 (10.0%) |
Occupancy by Age of Householder in Rosebud
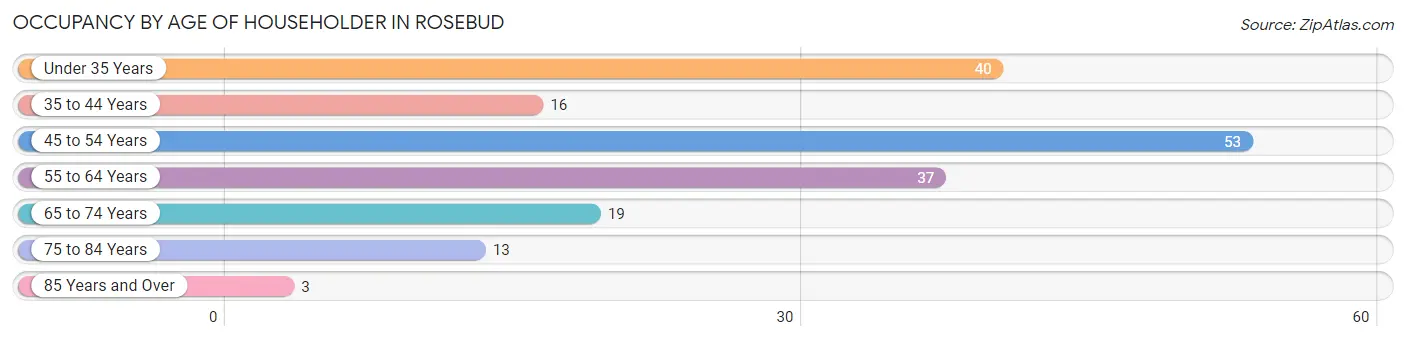
| Age Bracket | # Households | % Households |
| Under 35 Years | 40 | 22.1% |
| 35 to 44 Years | 16 | 8.8% |
| 45 to 54 Years | 53 | 29.3% |
| 55 to 64 Years | 37 | 20.4% |
| 65 to 74 Years | 19 | 10.5% |
| 75 to 84 Years | 13 | 7.2% |
| 85 Years and Over | 3 | 1.7% |
| Total | 181 | 100.0% |
Housing Finances in Rosebud
Median Income by Occupancy in Rosebud
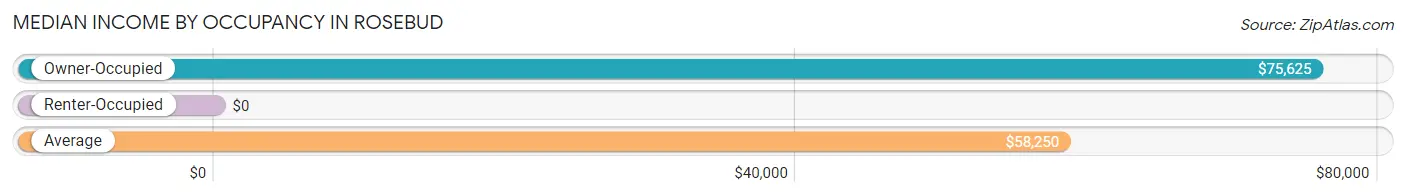
| Occupancy Type | # Households | Median Income |
| Owner-Occupied | 122 (67.4%) | $75,625 |
| Renter-Occupied | 59 (32.6%) | $0 |
| Average | 181 (100.0%) | $58,250 |
Occupancy by Householder Income Bracket in Rosebud
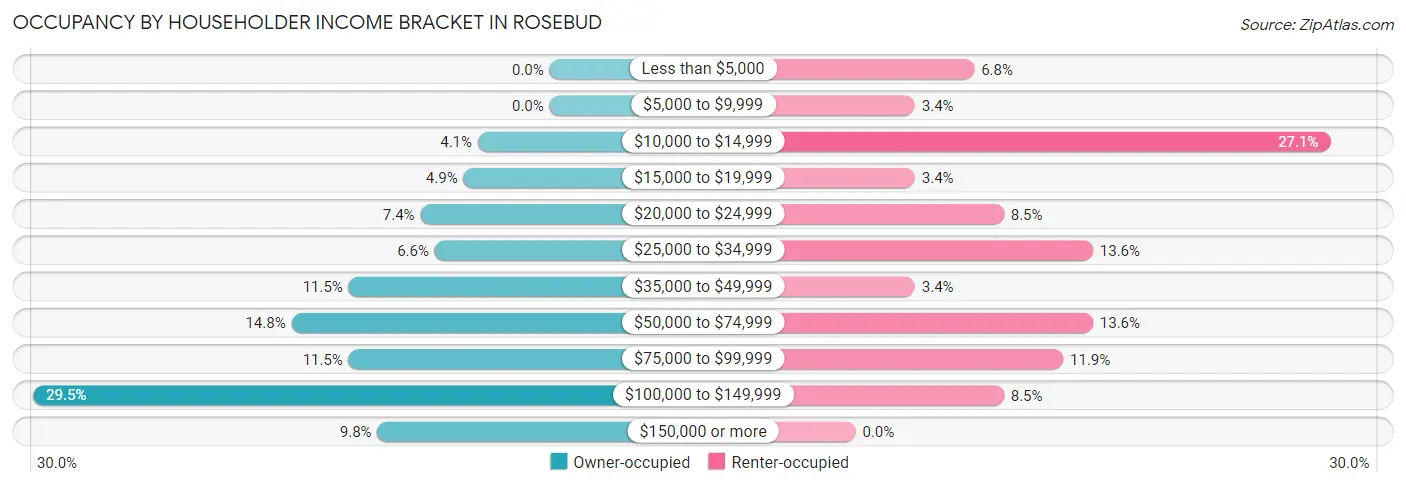
| Income Bracket | Owner-occupied | Renter-occupied |
| Less than $5,000 | 0 (0.0%) | 4 (6.8%) |
| $5,000 to $9,999 | 0 (0.0%) | 2 (3.4%) |
| $10,000 to $14,999 | 5 (4.1%) | 16 (27.1%) |
| $15,000 to $19,999 | 6 (4.9%) | 2 (3.4%) |
| $20,000 to $24,999 | 9 (7.4%) | 5 (8.5%) |
| $25,000 to $34,999 | 8 (6.6%) | 8 (13.6%) |
| $35,000 to $49,999 | 14 (11.5%) | 2 (3.4%) |
| $50,000 to $74,999 | 18 (14.7%) | 8 (13.6%) |
| $75,000 to $99,999 | 14 (11.5%) | 7 (11.9%) |
| $100,000 to $149,999 | 36 (29.5%) | 5 (8.5%) |
| $150,000 or more | 12 (9.8%) | 0 (0.0%) |
| Total | 122 (100.0%) | 59 (100.0%) |
Monthly Housing Cost Tiers in Rosebud
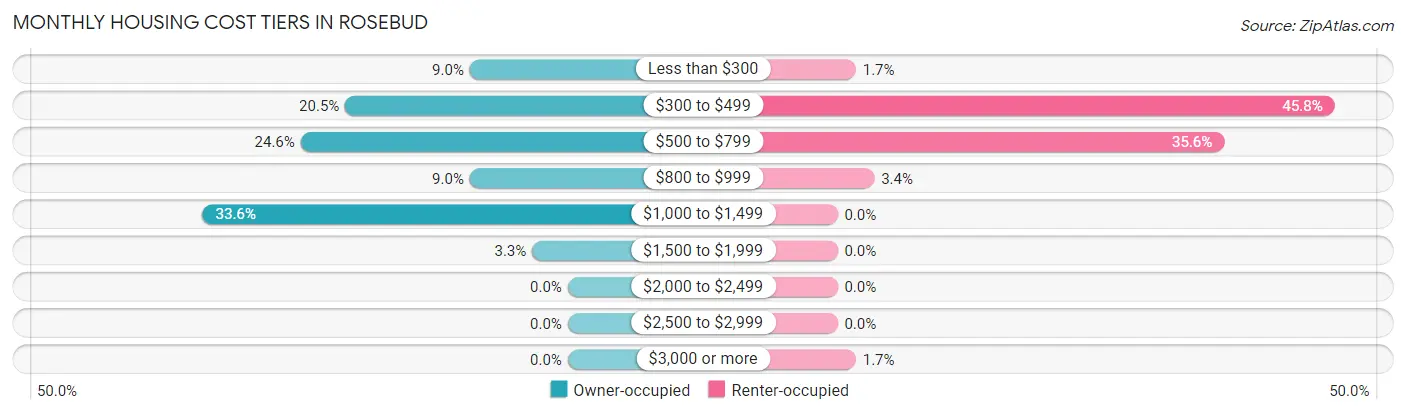
| Monthly Cost | Owner-occupied | Renter-occupied |
| Less than $300 | 11 (9.0%) | 1 (1.7%) |
| $300 to $499 | 25 (20.5%) | 27 (45.8%) |
| $500 to $799 | 30 (24.6%) | 21 (35.6%) |
| $800 to $999 | 11 (9.0%) | 2 (3.4%) |
| $1,000 to $1,499 | 41 (33.6%) | 0 (0.0%) |
| $1,500 to $1,999 | 4 (3.3%) | 0 (0.0%) |
| $2,000 to $2,499 | 0 (0.0%) | 0 (0.0%) |
| $2,500 to $2,999 | 0 (0.0%) | 0 (0.0%) |
| $3,000 or more | 0 (0.0%) | 1 (1.7%) |
| Total | 122 (100.0%) | 59 (100.0%) |
Physical Housing Characteristics in Rosebud
Housing Structures in Rosebud
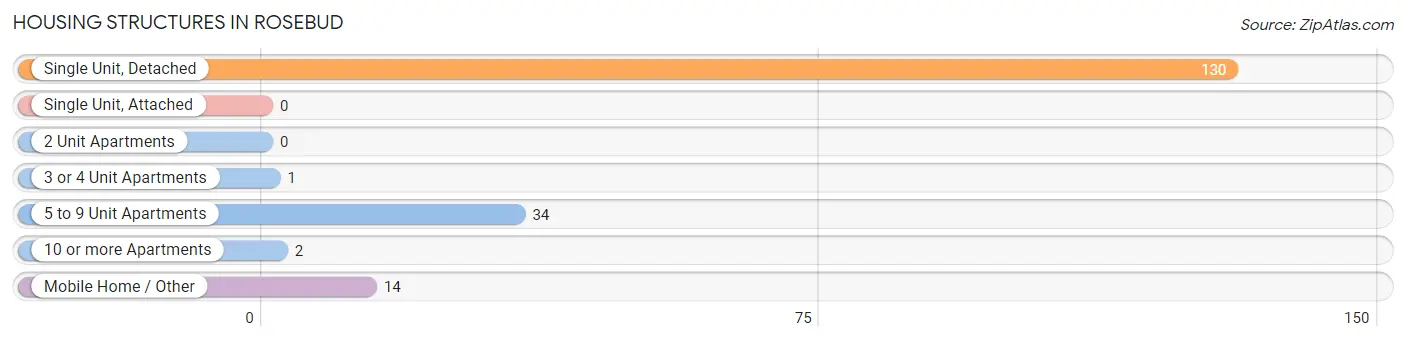
| Structure Type | # Housing Units | % Housing Units |
| Single Unit, Detached | 130 | 71.8% |
| Single Unit, Attached | 0 | 0.0% |
| 2 Unit Apartments | 0 | 0.0% |
| 3 or 4 Unit Apartments | 1 | 0.5% |
| 5 to 9 Unit Apartments | 34 | 18.8% |
| 10 or more Apartments | 2 | 1.1% |
| Mobile Home / Other | 14 | 7.7% |
| Total | 181 | 100.0% |
Housing Structures by Occupancy in Rosebud
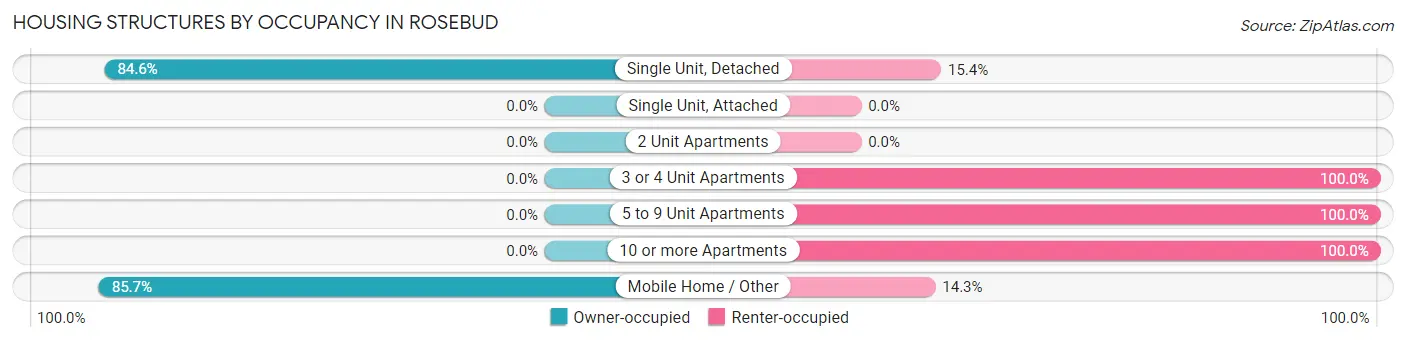
| Structure Type | Owner-occupied | Renter-occupied |
| Single Unit, Detached | 110 (84.6%) | 20 (15.4%) |
| Single Unit, Attached | 0 (0.0%) | 0 (0.0%) |
| 2 Unit Apartments | 0 (0.0%) | 0 (0.0%) |
| 3 or 4 Unit Apartments | 0 (0.0%) | 1 (100.0%) |
| 5 to 9 Unit Apartments | 0 (0.0%) | 34 (100.0%) |
| 10 or more Apartments | 0 (0.0%) | 2 (100.0%) |
| Mobile Home / Other | 12 (85.7%) | 2 (14.3%) |
| Total | 122 (67.4%) | 59 (32.6%) |
Housing Structures by Number of Rooms in Rosebud
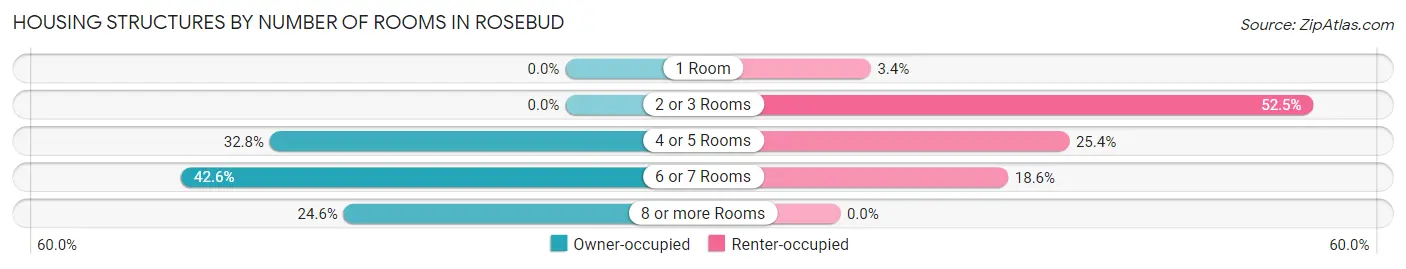
| Number of Rooms | Owner-occupied | Renter-occupied |
| 1 Room | 0 (0.0%) | 2 (3.4%) |
| 2 or 3 Rooms | 0 (0.0%) | 31 (52.5%) |
| 4 or 5 Rooms | 40 (32.8%) | 15 (25.4%) |
| 6 or 7 Rooms | 52 (42.6%) | 11 (18.6%) |
| 8 or more Rooms | 30 (24.6%) | 0 (0.0%) |
| Total | 122 (100.0%) | 59 (100.0%) |
Housing Structure by Heating Type in Rosebud
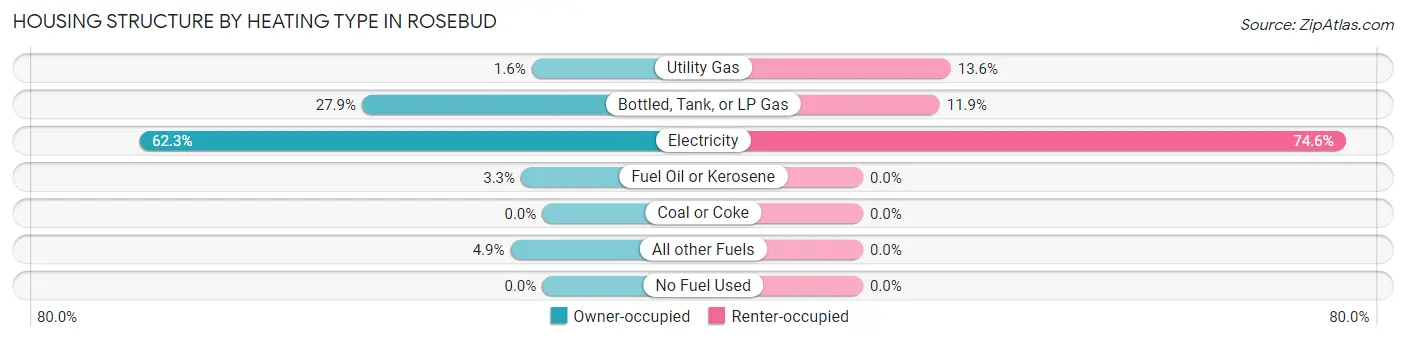
| Heating Type | Owner-occupied | Renter-occupied |
| Utility Gas | 2 (1.6%) | 8 (13.6%) |
| Bottled, Tank, or LP Gas | 34 (27.9%) | 7 (11.9%) |
| Electricity | 76 (62.3%) | 44 (74.6%) |
| Fuel Oil or Kerosene | 4 (3.3%) | 0 (0.0%) |
| Coal or Coke | 0 (0.0%) | 0 (0.0%) |
| All other Fuels | 6 (4.9%) | 0 (0.0%) |
| No Fuel Used | 0 (0.0%) | 0 (0.0%) |
| Total | 122 (100.0%) | 59 (100.0%) |
Household Vehicle Usage in Rosebud
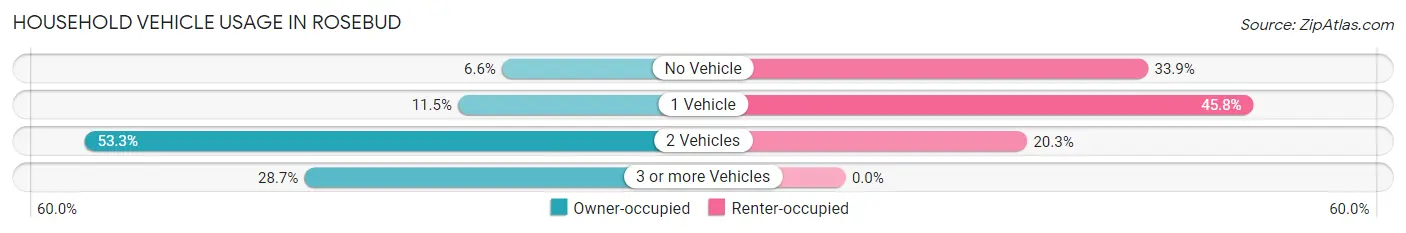
| Vehicles per Household | Owner-occupied | Renter-occupied |
| No Vehicle | 8 (6.6%) | 20 (33.9%) |
| 1 Vehicle | 14 (11.5%) | 27 (45.8%) |
| 2 Vehicles | 65 (53.3%) | 12 (20.3%) |
| 3 or more Vehicles | 35 (28.7%) | 0 (0.0%) |
| Total | 122 (100.0%) | 59 (100.0%) |
Real Estate & Mortgages in Rosebud
Real Estate and Mortgage Overview in Rosebud
| Characteristic | Without Mortgage | With Mortgage |
| Housing Units | 51 | 71 |
| Median Property Value | $120,800 | $126,000 |
| Median Household Income | $47,917 | $5 |
| Monthly Housing Costs | $438 | $0 |
| Real Estate Taxes | $1,139 | $0 |
Property Value by Mortgage Status in Rosebud
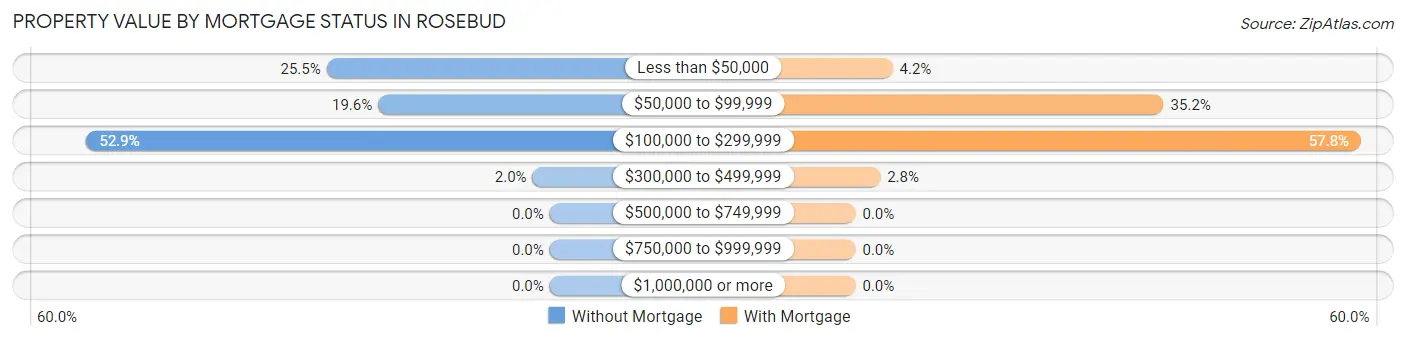
| Property Value | Without Mortgage | With Mortgage |
| Less than $50,000 | 13 (25.5%) | 3 (4.2%) |
| $50,000 to $99,999 | 10 (19.6%) | 25 (35.2%) |
| $100,000 to $299,999 | 27 (52.9%) | 41 (57.8%) |
| $300,000 to $499,999 | 1 (2.0%) | 2 (2.8%) |
| $500,000 to $749,999 | 0 (0.0%) | 0 (0.0%) |
| $750,000 to $999,999 | 0 (0.0%) | 0 (0.0%) |
| $1,000,000 or more | 0 (0.0%) | 0 (0.0%) |
| Total | 51 (100.0%) | 71 (100.0%) |
Household Income by Mortgage Status in Rosebud
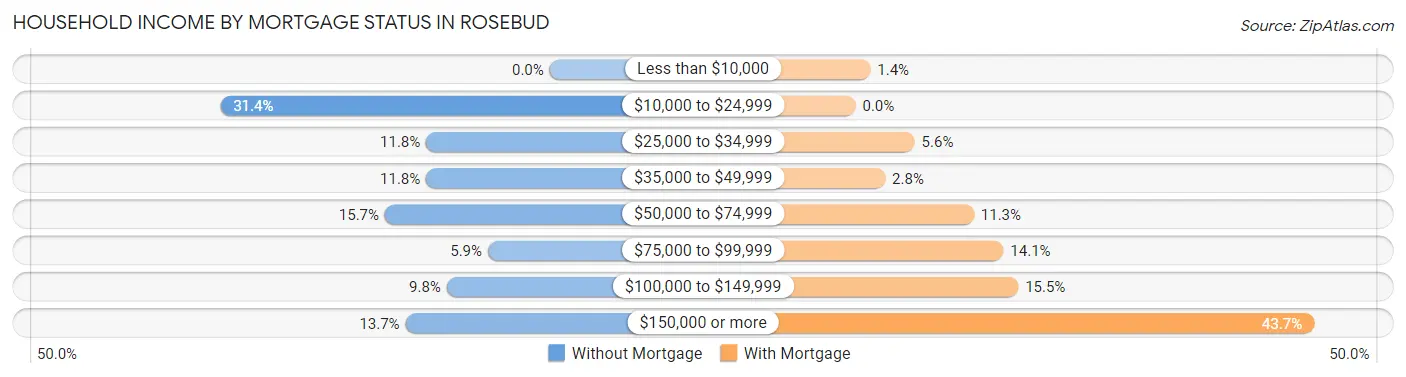
| Household Income | Without Mortgage | With Mortgage |
| Less than $10,000 | 0 (0.0%) | 1 (1.4%) |
| $10,000 to $24,999 | 16 (31.4%) | 0 (0.0%) |
| $25,000 to $34,999 | 6 (11.8%) | 4 (5.6%) |
| $35,000 to $49,999 | 6 (11.8%) | 2 (2.8%) |
| $50,000 to $74,999 | 8 (15.7%) | 8 (11.3%) |
| $75,000 to $99,999 | 3 (5.9%) | 10 (14.1%) |
| $100,000 to $149,999 | 5 (9.8%) | 11 (15.5%) |
| $150,000 or more | 7 (13.7%) | 31 (43.7%) |
| Total | 51 (100.0%) | 71 (100.0%) |
Property Value to Household Income Ratio in Rosebud

| Value-to-Income Ratio | Without Mortgage | With Mortgage |
| Less than 2.0x | 22 (43.1%) | 100,089 (140,970.4%) |
| 2.0x to 2.9x | 4 (7.8%) | 38 (53.5%) |
| 3.0x to 3.9x | 1 (2.0%) | 24 (33.8%) |
| 4.0x or more | 24 (47.1%) | 6 (8.5%) |
| Total | 51 (100.0%) | 71 (100.0%) |
Real Estate Taxes by Mortgage Status in Rosebud
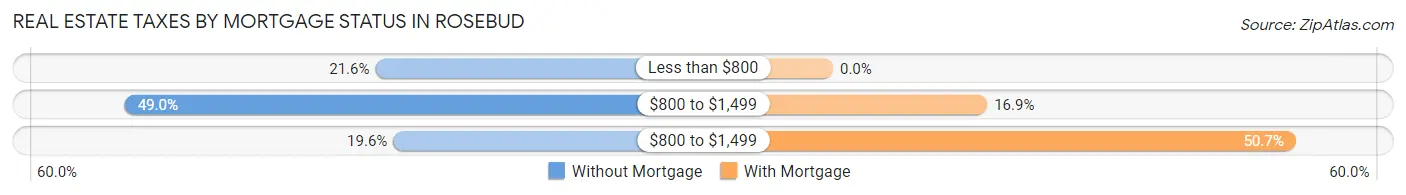
| Property Taxes | Without Mortgage | With Mortgage |
| Less than $800 | 11 (21.6%) | 0 (0.0%) |
| $800 to $1,499 | 25 (49.0%) | 12 (16.9%) |
| $800 to $1,499 | 10 (19.6%) | 36 (50.7%) |
| Total | 51 (100.0%) | 71 (100.0%) |
Health & Disability in Rosebud
Health Insurance Coverage by Age in Rosebud
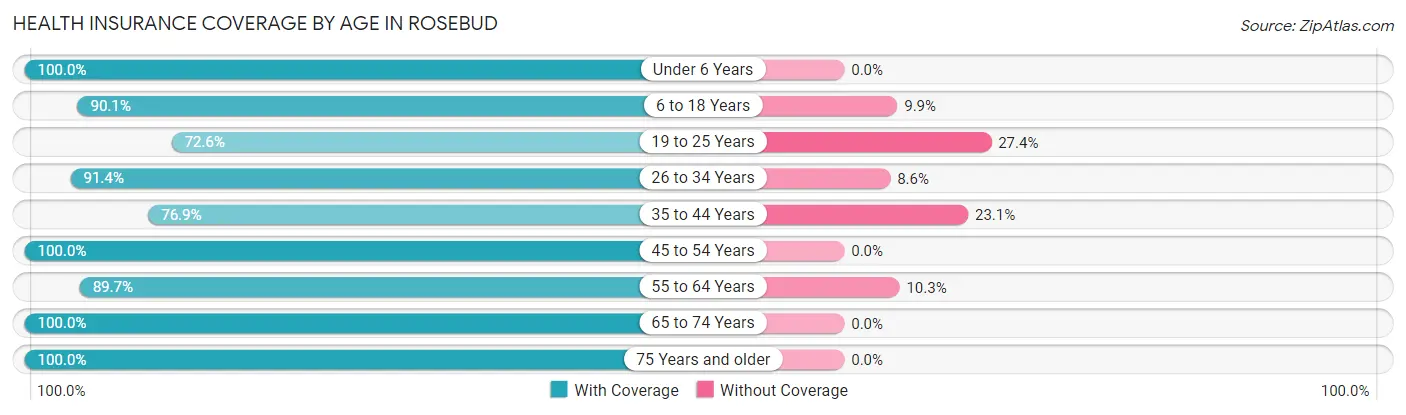
| Age Bracket | With Coverage | Without Coverage |
| Under 6 Years | 41 (100.0%) | 0 (0.0%) |
| 6 to 18 Years | 73 (90.1%) | 8 (9.9%) |
| 19 to 25 Years | 53 (72.6%) | 20 (27.4%) |
| 26 to 34 Years | 32 (91.4%) | 3 (8.6%) |
| 35 to 44 Years | 30 (76.9%) | 9 (23.1%) |
| 45 to 54 Years | 98 (100.0%) | 0 (0.0%) |
| 55 to 64 Years | 61 (89.7%) | 7 (10.3%) |
| 65 to 74 Years | 23 (100.0%) | 0 (0.0%) |
| 75 Years and older | 23 (100.0%) | 0 (0.0%) |
| Total | 434 (90.2%) | 47 (9.8%) |
Health Insurance Coverage by Citizenship Status in Rosebud
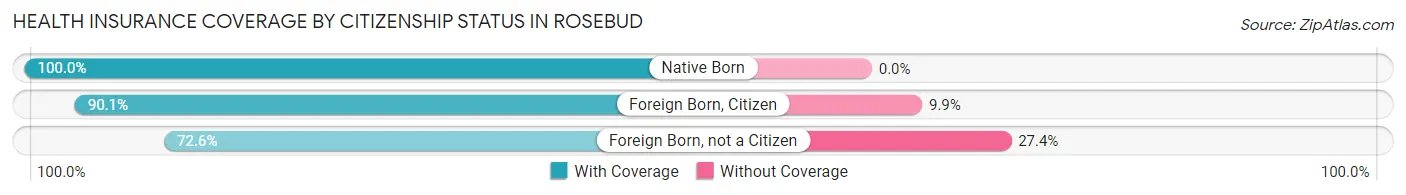
| Citizenship Status | With Coverage | Without Coverage |
| Native Born | 41 (100.0%) | 0 (0.0%) |
| Foreign Born, Citizen | 73 (90.1%) | 8 (9.9%) |
| Foreign Born, not a Citizen | 53 (72.6%) | 20 (27.4%) |
Health Insurance Coverage by Household Income in Rosebud
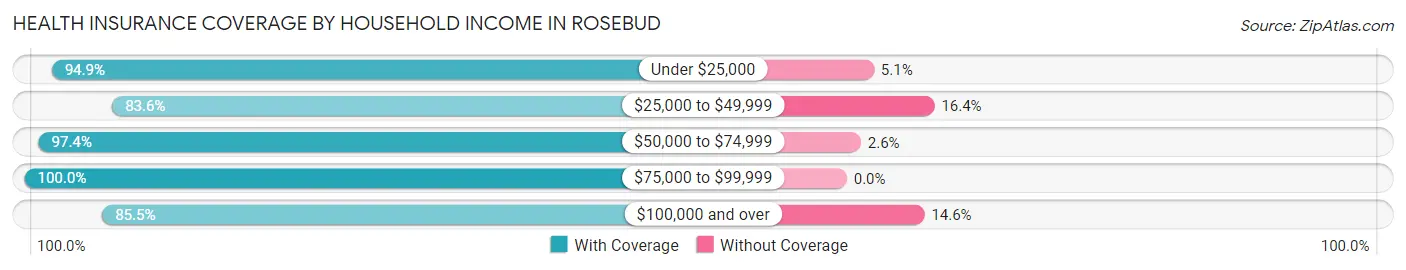
| Household Income | With Coverage | Without Coverage |
| Under $25,000 | 56 (94.9%) | 3 (5.1%) |
| $25,000 to $49,999 | 56 (83.6%) | 11 (16.4%) |
| $50,000 to $74,999 | 74 (97.4%) | 2 (2.6%) |
| $75,000 to $99,999 | 66 (100.0%) | 0 (0.0%) |
| $100,000 and over | 182 (85.5%) | 31 (14.5%) |
Public vs Private Health Insurance Coverage by Age in Rosebud
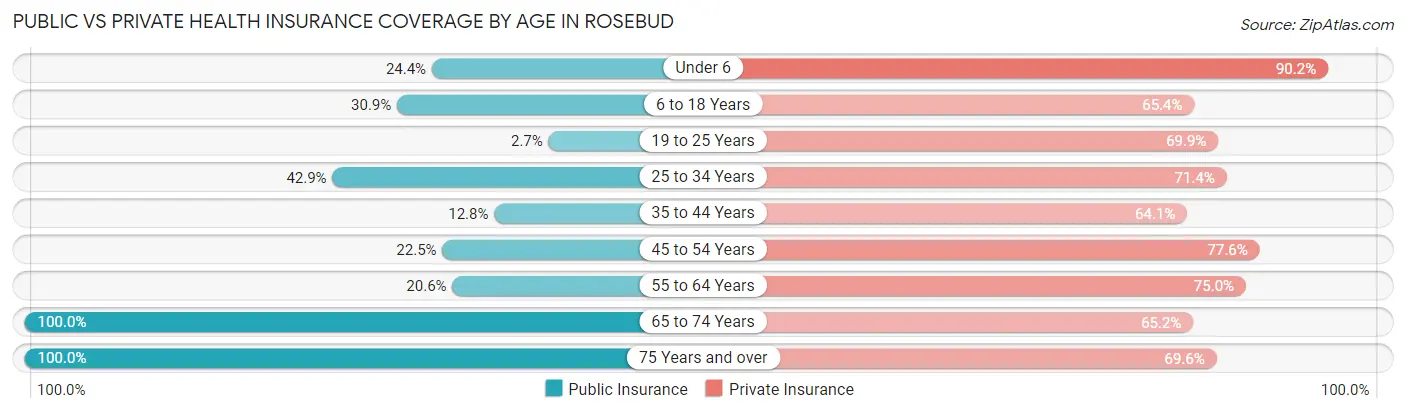
| Age Bracket | Public Insurance | Private Insurance |
| Under 6 | 10 (24.4%) | 37 (90.2%) |
| 6 to 18 Years | 25 (30.9%) | 53 (65.4%) |
| 19 to 25 Years | 2 (2.7%) | 51 (69.9%) |
| 25 to 34 Years | 15 (42.9%) | 25 (71.4%) |
| 35 to 44 Years | 5 (12.8%) | 25 (64.1%) |
| 45 to 54 Years | 22 (22.5%) | 76 (77.5%) |
| 55 to 64 Years | 14 (20.6%) | 51 (75.0%) |
| 65 to 74 Years | 23 (100.0%) | 15 (65.2%) |
| 75 Years and over | 23 (100.0%) | 16 (69.6%) |
| Total | 139 (28.9%) | 349 (72.6%) |
Disability Status by Sex by Age in Rosebud
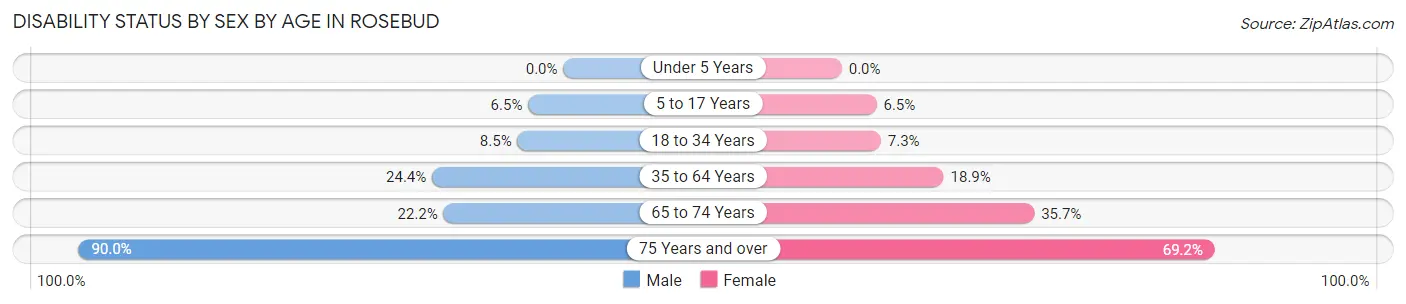
| Age Bracket | Male | Female |
| Under 5 Years | 0 (0.0%) | 0 (0.0%) |
| 5 to 17 Years | 3 (6.5%) | 2 (6.5%) |
| 18 to 34 Years | 4 (8.5%) | 5 (7.2%) |
| 35 to 64 Years | 19 (24.4%) | 24 (18.9%) |
| 65 to 74 Years | 2 (22.2%) | 5 (35.7%) |
| 75 Years and over | 9 (90.0%) | 9 (69.2%) |
Disability Class by Sex by Age in Rosebud
Disability Class: Hearing Difficulty
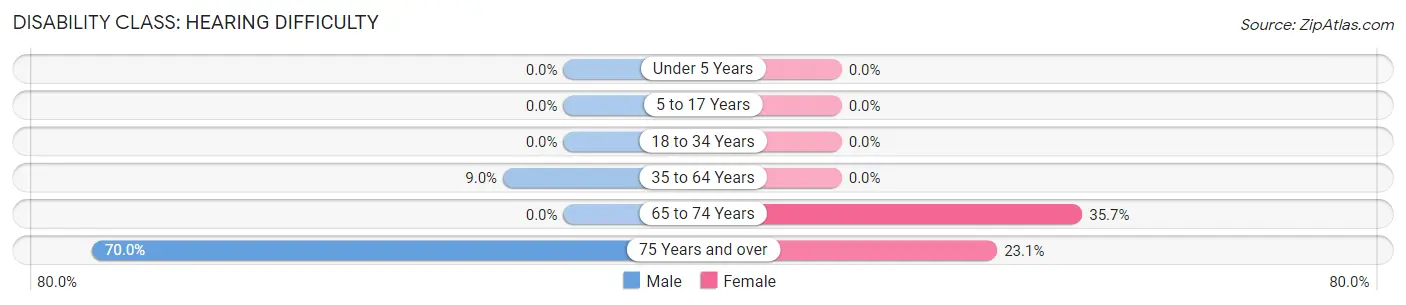
| Age Bracket | Male | Female |
| Under 5 Years | 0 (0.0%) | 0 (0.0%) |
| 5 to 17 Years | 0 (0.0%) | 0 (0.0%) |
| 18 to 34 Years | 0 (0.0%) | 0 (0.0%) |
| 35 to 64 Years | 7 (9.0%) | 0 (0.0%) |
| 65 to 74 Years | 0 (0.0%) | 5 (35.7%) |
| 75 Years and over | 7 (70.0%) | 3 (23.1%) |
Disability Class: Vision Difficulty
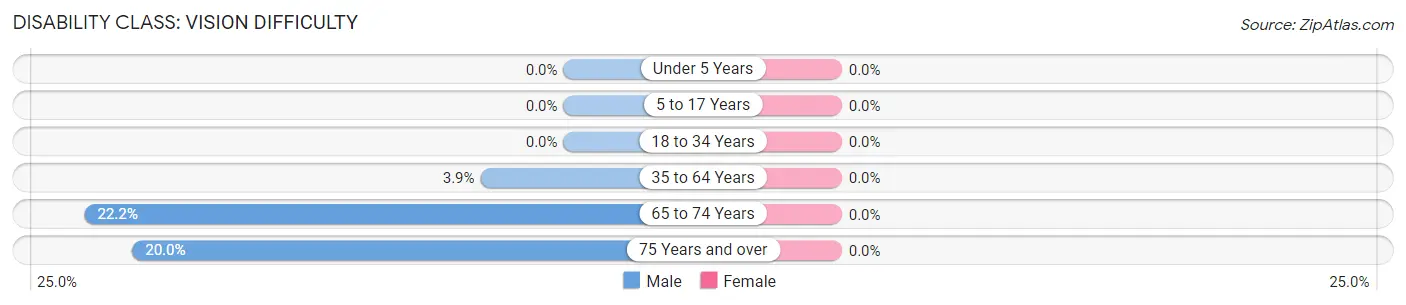
| Age Bracket | Male | Female |
| Under 5 Years | 0 (0.0%) | 0 (0.0%) |
| 5 to 17 Years | 0 (0.0%) | 0 (0.0%) |
| 18 to 34 Years | 0 (0.0%) | 0 (0.0%) |
| 35 to 64 Years | 3 (3.8%) | 0 (0.0%) |
| 65 to 74 Years | 2 (22.2%) | 0 (0.0%) |
| 75 Years and over | 2 (20.0%) | 0 (0.0%) |
Disability Class: Cognitive Difficulty
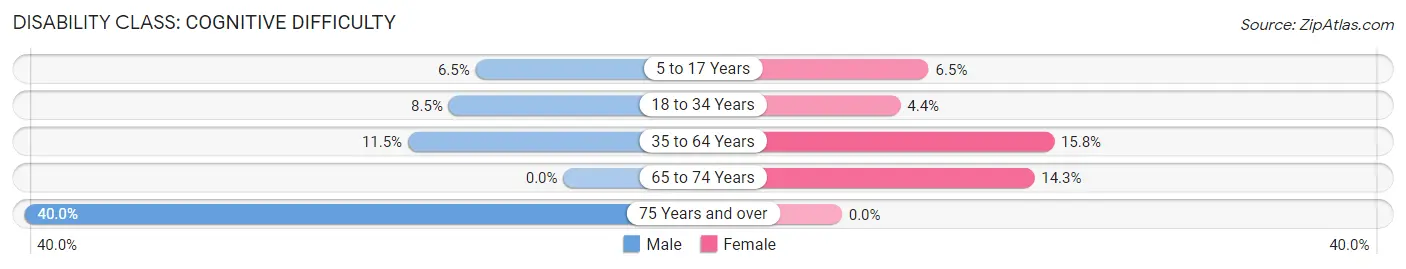
| Age Bracket | Male | Female |
| 5 to 17 Years | 3 (6.5%) | 2 (6.5%) |
| 18 to 34 Years | 4 (8.5%) | 3 (4.3%) |
| 35 to 64 Years | 9 (11.5%) | 20 (15.8%) |
| 65 to 74 Years | 0 (0.0%) | 2 (14.3%) |
| 75 Years and over | 4 (40.0%) | 0 (0.0%) |
Disability Class: Ambulatory Difficulty
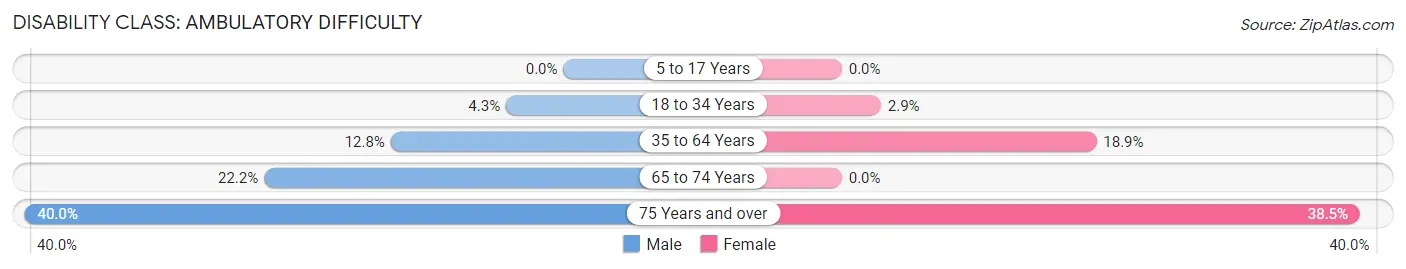
| Age Bracket | Male | Female |
| 5 to 17 Years | 0 (0.0%) | 0 (0.0%) |
| 18 to 34 Years | 2 (4.3%) | 2 (2.9%) |
| 35 to 64 Years | 10 (12.8%) | 24 (18.9%) |
| 65 to 74 Years | 2 (22.2%) | 0 (0.0%) |
| 75 Years and over | 4 (40.0%) | 5 (38.5%) |
Disability Class: Self-Care Difficulty
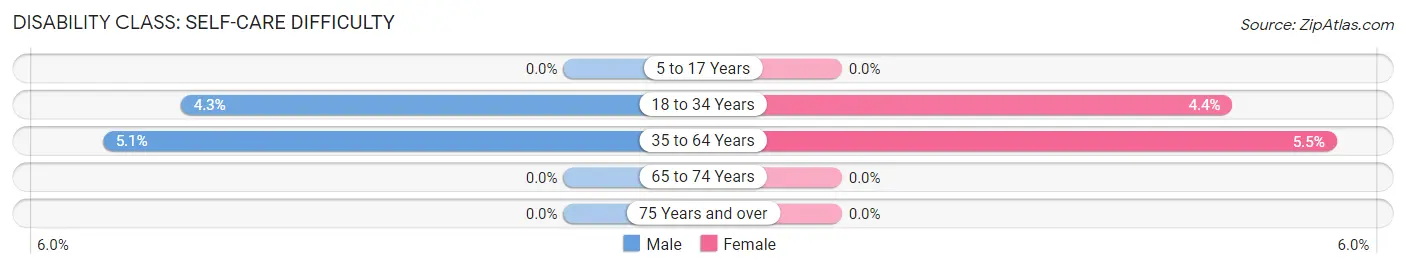
| Age Bracket | Male | Female |
| 5 to 17 Years | 0 (0.0%) | 0 (0.0%) |
| 18 to 34 Years | 2 (4.3%) | 3 (4.3%) |
| 35 to 64 Years | 4 (5.1%) | 7 (5.5%) |
| 65 to 74 Years | 0 (0.0%) | 0 (0.0%) |
| 75 Years and over | 0 (0.0%) | 0 (0.0%) |
Technology Access in Rosebud
Computing Device Access in Rosebud
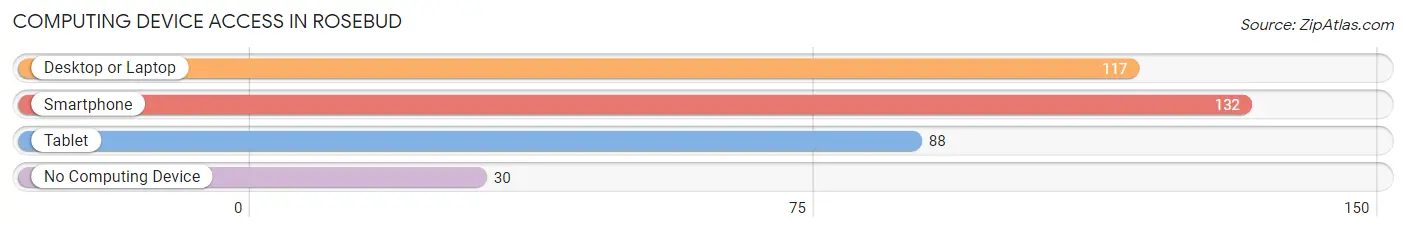
| Device Type | # Households | % Households |
| Desktop or Laptop | 117 | 64.6% |
| Smartphone | 132 | 72.9% |
| Tablet | 88 | 48.6% |
| No Computing Device | 30 | 16.6% |
| Total | 181 | 100.0% |
Internet Access in Rosebud
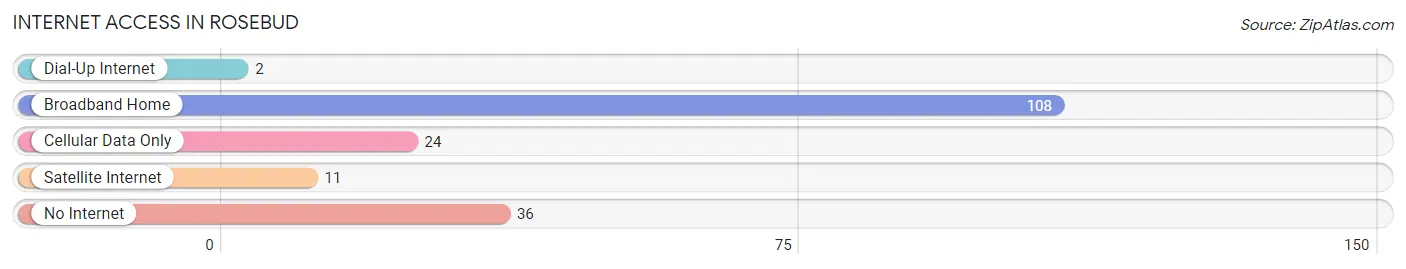
| Internet Type | # Households | % Households |
| Dial-Up Internet | 2 | 1.1% |
| Broadband Home | 108 | 59.7% |
| Cellular Data Only | 24 | 13.3% |
| Satellite Internet | 11 | 6.1% |
| No Internet | 36 | 19.9% |
| Total | 181 | 100.0% |
Rosebud Summary
Rosebud, Missouri is a small town located in Dent County, Missouri. It is situated in the Ozark Mountains and is home to a population of just over 1,000 people. The town was founded in 1883 and has a rich history of farming, logging, and coal mining.
History
Rosebud was founded in 1883 by a group of settlers from the nearby town of Salem. The town was named after the wild roses that grew in the area. The settlers were attracted to the area due to its abundance of natural resources, including timber, coal, and limestone. The town quickly grew and by the early 1900s, it had become a bustling community with a population of over 1,000 people.
The town was home to a variety of businesses, including a sawmill, a grist mill, a blacksmith shop, and a general store. The town also had a school, a post office, and a church. The town was a major hub for the coal mining industry in the area, and many of the town’s residents worked in the mines.
In the early 1900s, the town was hit hard by the Great Depression. Many of the businesses in town closed and the population began to decline. The town was further impacted by the decline of the coal mining industry in the area. By the 1950s, the population had dropped to just over 500 people.
Geography
Rosebud is located in Dent County, Missouri. It is situated in the Ozark Mountains and is surrounded by rolling hills and forests. The town is located near the Meramec River, which provides a source of water for the town. The town is located about 40 miles south of St. Louis and is accessible by car or bus.
Economy
The economy of Rosebud is largely based on agriculture and tourism. The town is home to several farms, which produce a variety of crops, including corn, soybeans, and hay. The town is also home to several tourist attractions, including a historic grist mill, a museum, and a nature center.
The town is also home to several small businesses, including a grocery store, a hardware store, and a restaurant. The town is also home to a few manufacturing companies, which produce a variety of products, including furniture and clothing.
Demographics
As of the 2010 census, the population of Rosebud was 1,072. The town is predominantly white, with 95.3% of the population identifying as white. The town also has a small Hispanic population, with 2.3% of the population identifying as Hispanic or Latino. The median household income in the town is $37,500, and the median home value is $90,000.
Rosebud is a small town with a rich history and a vibrant economy. The town is home to a variety of businesses and attractions, and it is a popular destination for tourists. The town is also home to a diverse population, with a variety of ethnic backgrounds represented. Rosebud is a great place to live and work, and it is a great place to visit.
Common Questions
What is Per Capita Income in Rosebud?
Per Capita income in Rosebud is $24,533.
What is the Median Family Income in Rosebud?
Median Family Income in Rosebud is $91,000.
What is the Median Household income in Rosebud?
Median Household Income in Rosebud is $58,250.
What is Income or Wage Gap in Rosebud?
Income or Wage Gap in Rosebud is 49.9%.
Women in Rosebud earn 50.1 cents for every dollar earned by a man.
What is Inequality or Gini Index in Rosebud?
Inequality or Gini Index in Rosebud is 0.39.
What is the Total Population of Rosebud?
Total Population of Rosebud is 481.
What is the Total Male Population of Rosebud?
Total Male Population of Rosebud is 210.
What is the Total Female Population of Rosebud?
Total Female Population of Rosebud is 271.
What is the Ratio of Males per 100 Females in Rosebud?
There are 77.49 Males per 100 Females in Rosebud.
What is the Ratio of Females per 100 Males in Rosebud?
There are 129.05 Females per 100 Males in Rosebud.
What is the Median Population Age in Rosebud?
Median Population Age in Rosebud is 38.1 Years.
What is the Average Family Size in Rosebud
Average Family Size in Rosebud is 3.6 People.
What is the Average Household Size in Rosebud
Average Household Size in Rosebud is 2.7 People.
How Large is the Labor Force in Rosebud?
There are 240 People in the Labor Forcein in Rosebud.
What is the Percentage of People in the Labor Force in Rosebud?
63.3% of People are in the Labor Force in Rosebud.
What is the Unemployment Rate in Rosebud?
Unemployment Rate in Rosebud is 5.0%.