Pomona, MO Map & Demographics
Pomona Map
Pomona Overview
$13,505
PER CAPITA INCOME
80.6%
WAGE / INCOME GAP [ % ]
19.4¢/ $1
WAGE / INCOME GAP [ $ ]
0.42
INEQUALITY / GINI INDEX
259
TOTAL POPULATION
181
MALE POPULATION
78
FEMALE POPULATION
232.05
MALES / 100 FEMALES
43.09
FEMALES / 100 MALES
56.2
MEDIAN AGE
3.3
AVG FAMILY SIZE
3.0
AVG HOUSEHOLD SIZE
113
LABOR FORCE [ PEOPLE ]
43.6%
PERCENT IN LABOR FORCE
18.6%
UNEMPLOYMENT RATE
Pomona Zip Codes
Pomona Area Codes
Income in Pomona
Income Overview in Pomona
| Characteristic | Number | Measure |
| Per Capita Income | 259 | $13,505 |
| Median Family Income | 68 | $0 |
| Mean Family Income | 68 | $41,579 |
| Median Household Income | 85 | $0 |
| Mean Household Income | 85 | $37,196 |
| Income Deficit | 68 | $0 |
| Wage / Income Gap (%) | 259 | 80.56% |
| Wage / Income Gap ($) | 259 | 19.44¢ per $1 |
| Gini / Inequality Index | 259 | 0.42 |
Earnings by Sex in Pomona
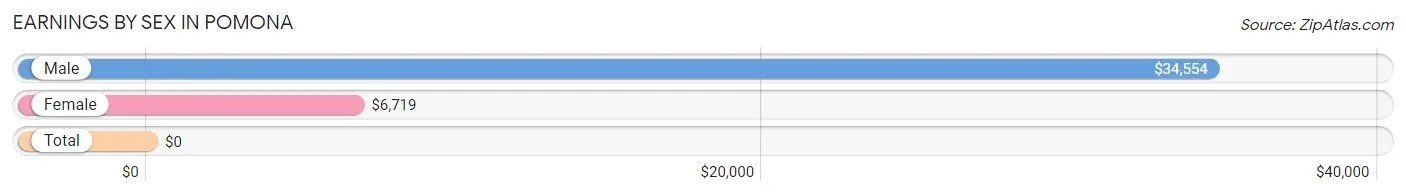
| Sex | Number | Average Earnings |
| Male | 57 (54.3%) | $34,554 |
| Female | 48 (45.7%) | $6,719 |
| Total | 105 (100.0%) | $0 |
Earnings by Sex by Income Bracket in Pomona
The most common earnings brackets in Pomona are $45,000 to $49,999 for men (26 | 45.6%) and $5,000 to $7,499 for women (16 | 33.3%).
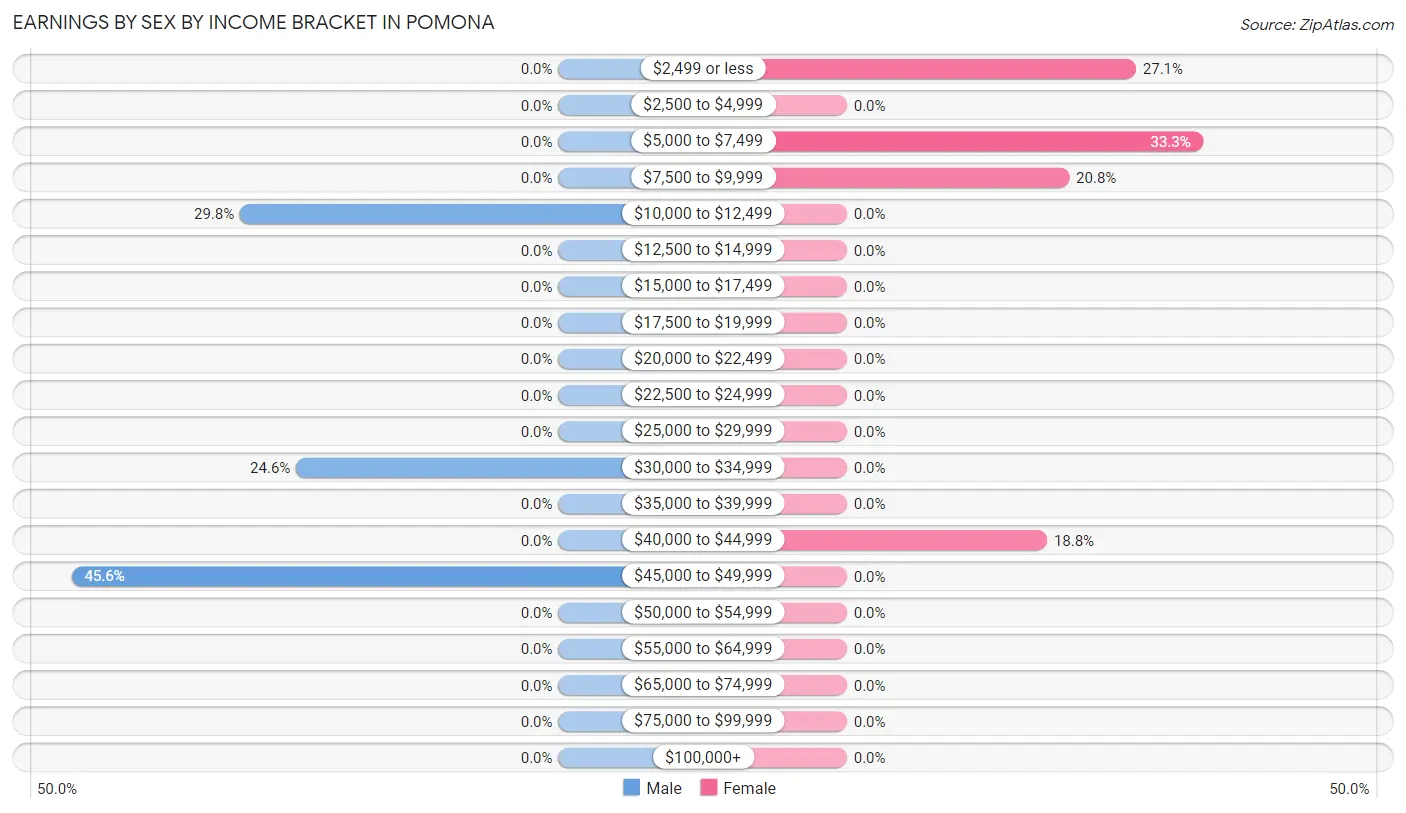
| Income | Male | Female |
| $2,499 or less | 0 (0.0%) | 13 (27.1%) |
| $2,500 to $4,999 | 0 (0.0%) | 0 (0.0%) |
| $5,000 to $7,499 | 0 (0.0%) | 16 (33.3%) |
| $7,500 to $9,999 | 0 (0.0%) | 10 (20.8%) |
| $10,000 to $12,499 | 17 (29.8%) | 0 (0.0%) |
| $12,500 to $14,999 | 0 (0.0%) | 0 (0.0%) |
| $15,000 to $17,499 | 0 (0.0%) | 0 (0.0%) |
| $17,500 to $19,999 | 0 (0.0%) | 0 (0.0%) |
| $20,000 to $22,499 | 0 (0.0%) | 0 (0.0%) |
| $22,500 to $24,999 | 0 (0.0%) | 0 (0.0%) |
| $25,000 to $29,999 | 0 (0.0%) | 0 (0.0%) |
| $30,000 to $34,999 | 14 (24.6%) | 0 (0.0%) |
| $35,000 to $39,999 | 0 (0.0%) | 0 (0.0%) |
| $40,000 to $44,999 | 0 (0.0%) | 9 (18.8%) |
| $45,000 to $49,999 | 26 (45.6%) | 0 (0.0%) |
| $50,000 to $54,999 | 0 (0.0%) | 0 (0.0%) |
| $55,000 to $64,999 | 0 (0.0%) | 0 (0.0%) |
| $65,000 to $74,999 | 0 (0.0%) | 0 (0.0%) |
| $75,000 to $99,999 | 0 (0.0%) | 0 (0.0%) |
| $100,000+ | 0 (0.0%) | 0 (0.0%) |
| Total | 57 (100.0%) | 48 (100.0%) |
Earnings by Sex by Educational Attainment in Pomona
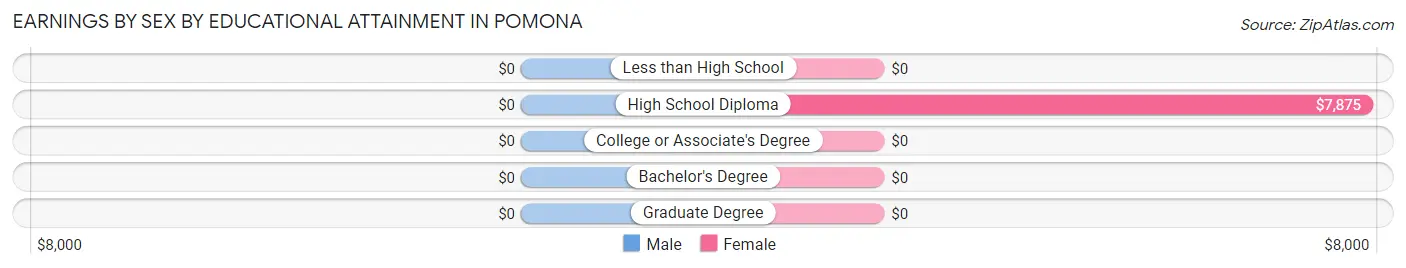
| Educational Attainment | Male Income | Female Income |
| Less than High School | - | - |
| High School Diploma | - | - |
| College or Associate's Degree | - | - |
| Bachelor's Degree | - | - |
| Graduate Degree | - | - |
| Total | - | - |
Family Income in Pomona
Family Income Brackets in Pomona
According to the Pomona family income data, there are 26 families falling into the $50,000 to $74,999 income range, which is the most common income bracket and makes up 38.2% of all families.
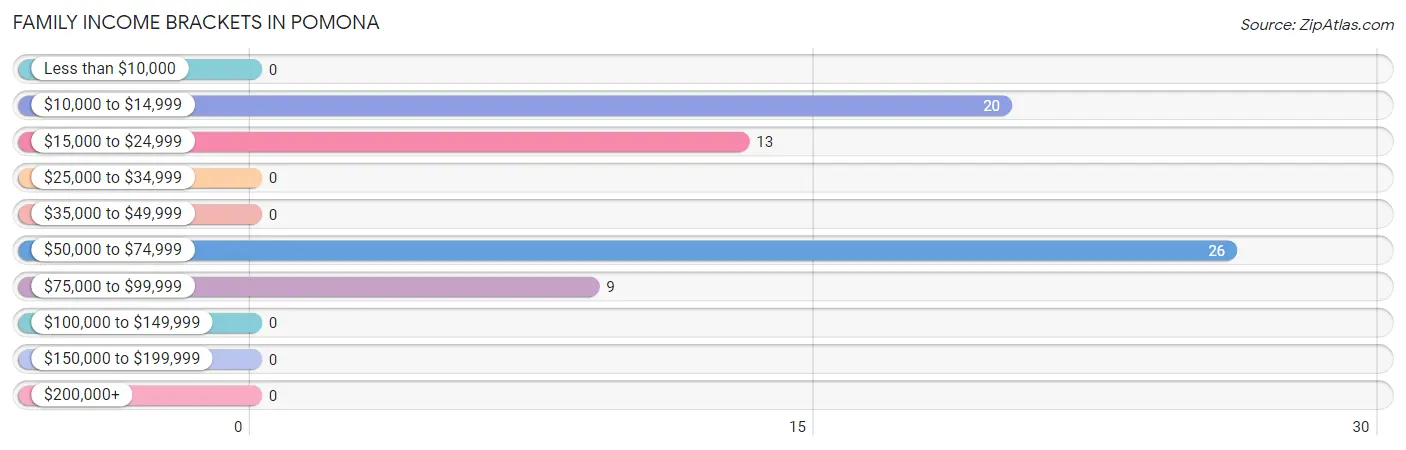
| Income Bracket | # Families | % Families |
| Less than $10,000 | 0 | 0.0% |
| $10,000 to $14,999 | 20 | 29.4% |
| $15,000 to $24,999 | 13 | 19.1% |
| $25,000 to $34,999 | 0 | 0.0% |
| $35,000 to $49,999 | 0 | 0.0% |
| $50,000 to $74,999 | 26 | 38.2% |
| $75,000 to $99,999 | 9 | 13.2% |
| $100,000 to $149,999 | 0 | 0.0% |
| $150,000 to $199,999 | 0 | 0.0% |
| $200,000+ | 0 | 0.0% |
Family Income by Famaliy Size in Pomona
| Income Bracket | # Families | Median Income |
| 2-Person Families | 22 (32.4%) | $0 |
| 3-Person Families | 30 (44.1%) | $0 |
| 4-Person Families | 16 (23.5%) | $0 |
| 5-Person Families | 0 (0.0%) | $0 |
| 6-Person Families | 0 (0.0%) | $0 |
| 7+ Person Families | 0 (0.0%) | $0 |
| Total | 68 (100.0%) | $0 |
Family Income by Number of Earners in Pomona
| Number of Earners | # Families | Median Income |
| No Earners | 13 (19.1%) | $0 |
| 1 Earner | 20 (29.4%) | $0 |
| 2 Earners | 19 (27.9%) | $0 |
| 3+ Earners | 16 (23.5%) | $0 |
| Total | 68 (100.0%) | $0 |
Household Income in Pomona
Household Income Brackets in Pomona
With 26 households falling in the category, the $50,000 to $74,999 income range is the most frequent in Pomona, accounting for 30.6% of all households.
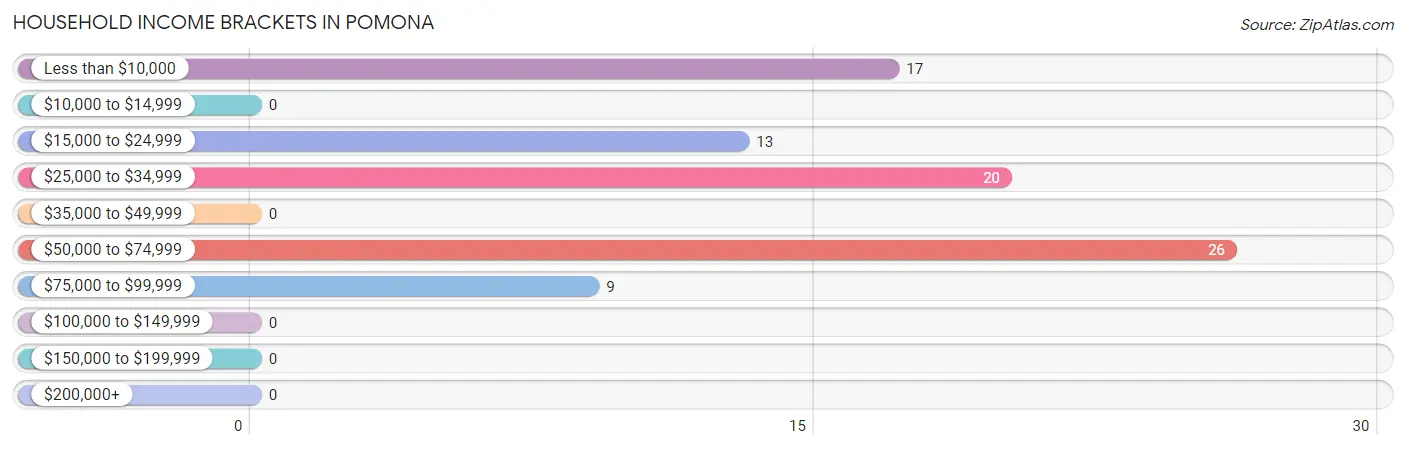
| Income Bracket | # Households | % Households |
| Less than $10,000 | 17 | 20.0% |
| $10,000 to $14,999 | 0 | 0.0% |
| $15,000 to $24,999 | 13 | 15.3% |
| $25,000 to $34,999 | 20 | 23.5% |
| $35,000 to $49,999 | 0 | 0.0% |
| $50,000 to $74,999 | 26 | 30.6% |
| $75,000 to $99,999 | 9 | 10.6% |
| $100,000 to $149,999 | 0 | 0.0% |
| $150,000 to $199,999 | 0 | 0.0% |
| $200,000+ | 0 | 0.0% |
Household Income by Householder Age in Pomona
| Income Bracket | # Households | Median Income |
| 15 to 24 Years | 0 (0.0%) | $0 |
| 25 to 44 Years | 25 (29.4%) | $0 |
| 45 to 64 Years | 47 (55.3%) | $0 |
| 65+ Years | 13 (15.3%) | $0 |
| Total | 85 (100.0%) | $0 |
Poverty in Pomona
Income Below Poverty by Sex and Age in Pomona
With 26.0% poverty level for males and 42.3% for females among the residents of Pomona, 45 to 54 year old males and 18 to 24 year old females are the most vulnerable to poverty, with 30 males (100.0%) and 13 females (100.0%) in their respective age groups living below the poverty level.
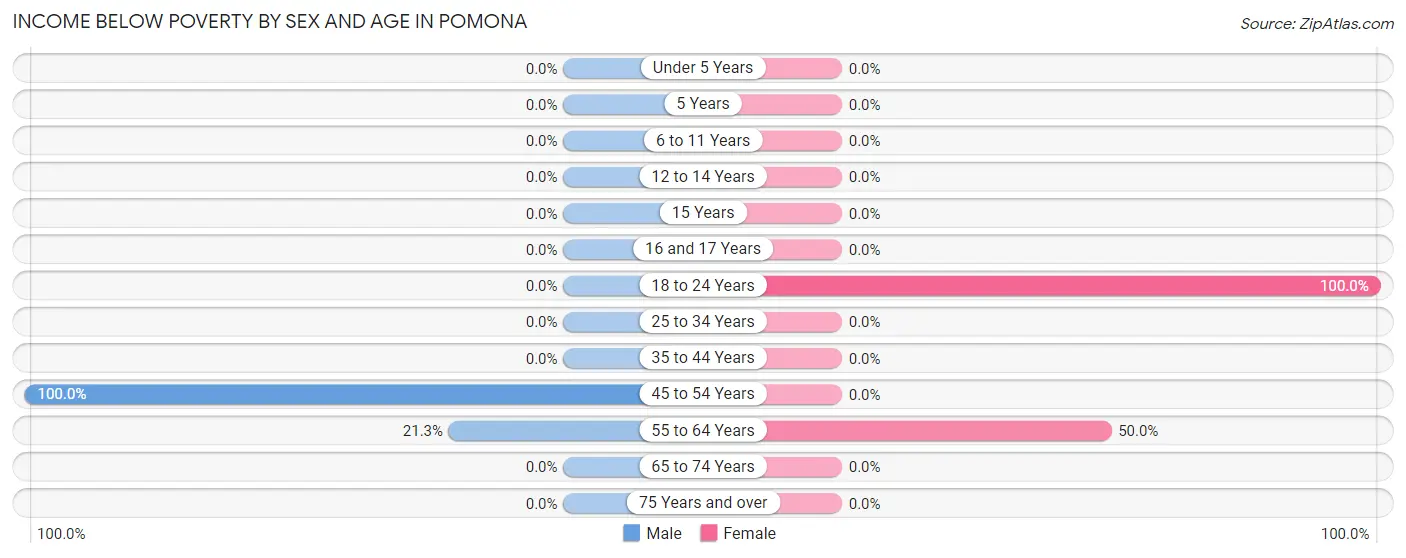
| Age Bracket | Male | Female |
| Under 5 Years | 0 (0.0%) | 0 (0.0%) |
| 5 Years | 0 (0.0%) | 0 (0.0%) |
| 6 to 11 Years | 0 (0.0%) | 0 (0.0%) |
| 12 to 14 Years | 0 (0.0%) | 0 (0.0%) |
| 15 Years | 0 (0.0%) | 0 (0.0%) |
| 16 and 17 Years | 0 (0.0%) | 0 (0.0%) |
| 18 to 24 Years | 0 (0.0%) | 13 (100.0%) |
| 25 to 34 Years | 0 (0.0%) | 0 (0.0%) |
| 35 to 44 Years | 0 (0.0%) | 0 (0.0%) |
| 45 to 54 Years | 30 (100.0%) | 0 (0.0%) |
| 55 to 64 Years | 17 (21.2%) | 20 (50.0%) |
| 65 to 74 Years | 0 (0.0%) | 0 (0.0%) |
| 75 Years and over | 0 (0.0%) | 0 (0.0%) |
| Total | 47 (26.0%) | 33 (42.3%) |
Income Above Poverty by Sex and Age in Pomona
According to the poverty statistics in Pomona, males aged 18 to 24 years and females aged 25 to 34 years are the age groups that are most secure financially, with 100.0% of males and 100.0% of females in these age groups living above the poverty line.
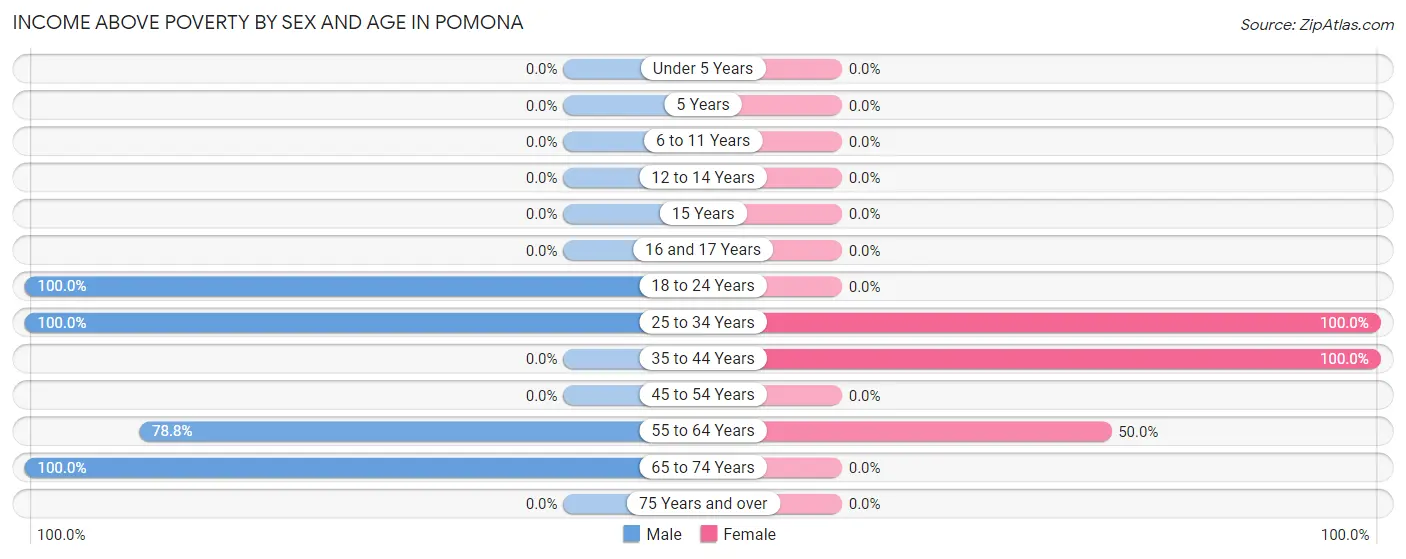
| Age Bracket | Male | Female |
| Under 5 Years | 0 (0.0%) | 0 (0.0%) |
| 5 Years | 0 (0.0%) | 0 (0.0%) |
| 6 to 11 Years | 0 (0.0%) | 0 (0.0%) |
| 12 to 14 Years | 0 (0.0%) | 0 (0.0%) |
| 15 Years | 0 (0.0%) | 0 (0.0%) |
| 16 and 17 Years | 0 (0.0%) | 0 (0.0%) |
| 18 to 24 Years | 37 (100.0%) | 0 (0.0%) |
| 25 to 34 Years | 21 (100.0%) | 16 (100.0%) |
| 35 to 44 Years | 0 (0.0%) | 9 (100.0%) |
| 45 to 54 Years | 0 (0.0%) | 0 (0.0%) |
| 55 to 64 Years | 63 (78.7%) | 20 (50.0%) |
| 65 to 74 Years | 13 (100.0%) | 0 (0.0%) |
| 75 Years and over | 0 (0.0%) | 0 (0.0%) |
| Total | 134 (74.0%) | 45 (57.7%) |
Income Below Poverty Among Married-Couple Families in Pomona

| Children | Above Poverty | Below Poverty |
| No Children | 32 (100.0%) | 0 (0.0%) |
| 1 or 2 Children | 0 (0.0%) | 0 (0.0%) |
| 3 or 4 Children | 0 (0.0%) | 0 (0.0%) |
| 5 or more Children | 0 (0.0%) | 0 (0.0%) |
| Total | 32 (100.0%) | 0 (0.0%) |
Income Below Poverty Among Single-Parent Households in Pomona
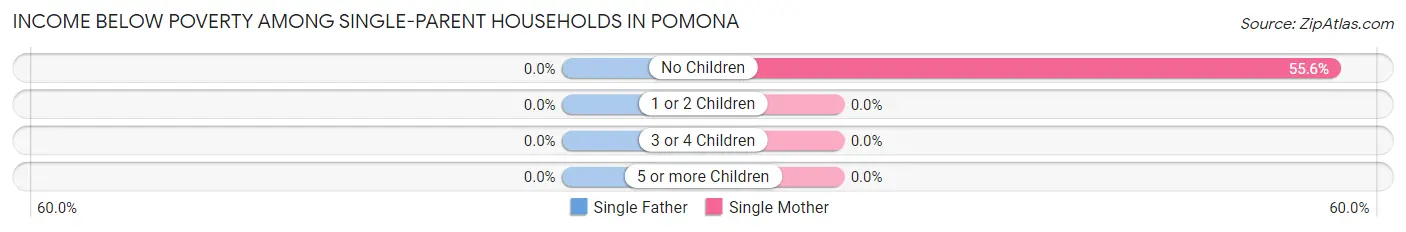
| Children | Single Father | Single Mother |
| No Children | 0 (0.0%) | 20 (55.6%) |
| 1 or 2 Children | 0 (0.0%) | 0 (0.0%) |
| 3 or 4 Children | 0 (0.0%) | 0 (0.0%) |
| 5 or more Children | 0 (0.0%) | 0 (0.0%) |
| Total | 0 (0.0%) | 20 (55.6%) |
Income Below Poverty Among Married-Couple vs Single-Parent Households in Pomona
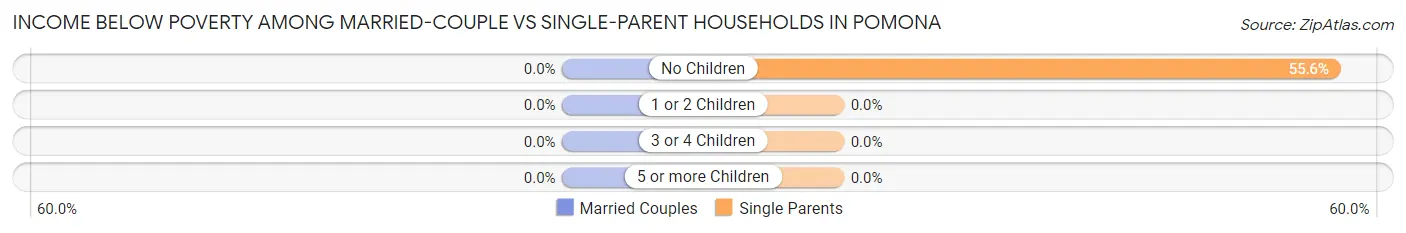
| Children | Married-Couple Families | Single-Parent Households |
| No Children | 0 (0.0%) | 20 (55.6%) |
| 1 or 2 Children | 0 (0.0%) | 0 (0.0%) |
| 3 or 4 Children | 0 (0.0%) | 0 (0.0%) |
| 5 or more Children | 0 (0.0%) | 0 (0.0%) |
| Total | 0 (0.0%) | 20 (55.6%) |
Race in Pomona
The most populous races in Pomona are White / Caucasian (225 | 86.9%), Two or more Races (24 | 9.3%), and Native / Alaskan (10 | 3.9%).
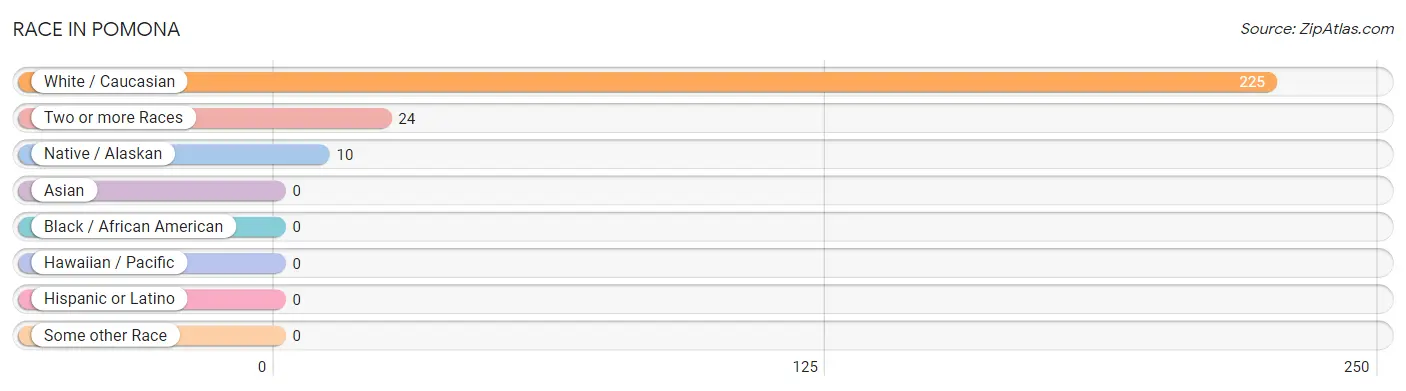
| Race | # Population | % Population |
| Asian | 0 | 0.0% |
| Black / African American | 0 | 0.0% |
| Hawaiian / Pacific | 0 | 0.0% |
| Hispanic or Latino | 0 | 0.0% |
| Native / Alaskan | 10 | 3.9% |
| White / Caucasian | 225 | 86.9% |
| Two or more Races | 24 | 9.3% |
| Some other Race | 0 | 0.0% |
| Total | 259 | 100.0% |
Ancestry in Pomona
The most populous ancestries reported in Pomona are Irish (129 | 49.8%), German (57 | 22.0%), European (21 | 8.1%), Scottish (16 | 6.2%), and Cherokee (10 | 3.9%), together accounting for 90.0% of all Pomona residents.
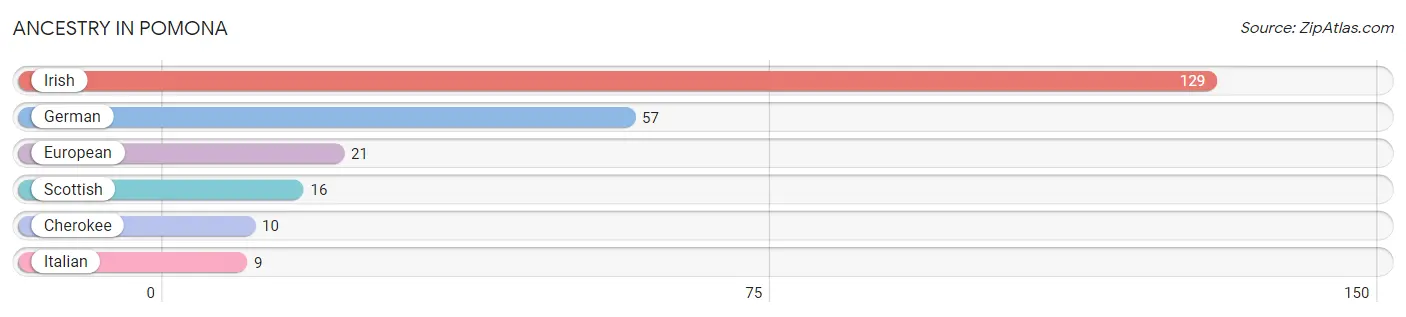
| Ancestry | # Population | % Population |
| Cherokee | 10 | 3.9% |
| European | 21 | 8.1% |
| German | 57 | 22.0% |
| Irish | 129 | 49.8% |
| Italian | 9 | 3.5% |
| Scottish | 16 | 6.2% | View All 6 Rows |
Immigrants in Pomona

| Immigration Origin | # Population | % Population | View All 0 Rows |
Sex and Age in Pomona
Sex and Age in Pomona
The most populous age groups in Pomona are 60 to 64 Years (52 | 28.7%) for men and 60 to 64 Years (30 | 38.5%) for women.
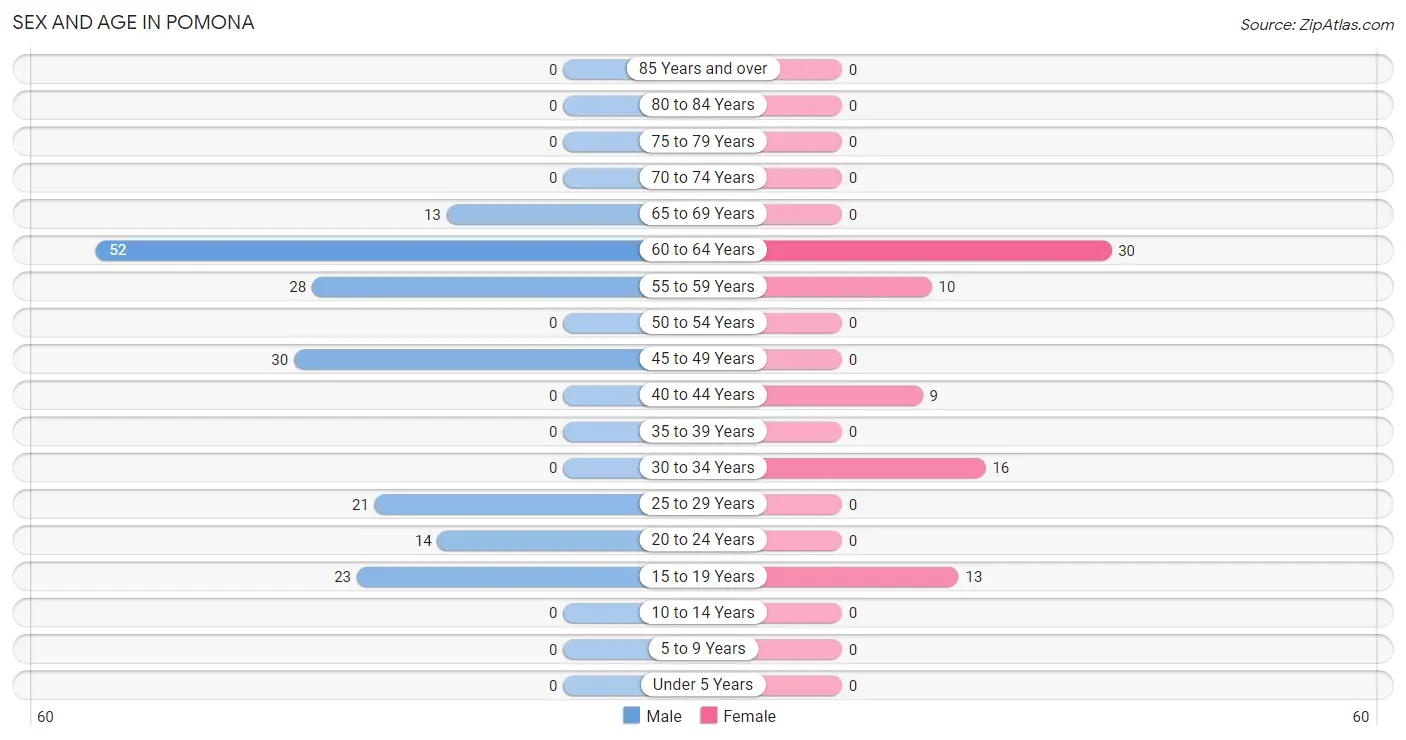
| Age Bracket | Male | Female |
| Under 5 Years | 0 (0.0%) | 0 (0.0%) |
| 5 to 9 Years | 0 (0.0%) | 0 (0.0%) |
| 10 to 14 Years | 0 (0.0%) | 0 (0.0%) |
| 15 to 19 Years | 23 (12.7%) | 13 (16.7%) |
| 20 to 24 Years | 14 (7.7%) | 0 (0.0%) |
| 25 to 29 Years | 21 (11.6%) | 0 (0.0%) |
| 30 to 34 Years | 0 (0.0%) | 16 (20.5%) |
| 35 to 39 Years | 0 (0.0%) | 0 (0.0%) |
| 40 to 44 Years | 0 (0.0%) | 9 (11.5%) |
| 45 to 49 Years | 30 (16.6%) | 0 (0.0%) |
| 50 to 54 Years | 0 (0.0%) | 0 (0.0%) |
| 55 to 59 Years | 28 (15.5%) | 10 (12.8%) |
| 60 to 64 Years | 52 (28.7%) | 30 (38.5%) |
| 65 to 69 Years | 13 (7.2%) | 0 (0.0%) |
| 70 to 74 Years | 0 (0.0%) | 0 (0.0%) |
| 75 to 79 Years | 0 (0.0%) | 0 (0.0%) |
| 80 to 84 Years | 0 (0.0%) | 0 (0.0%) |
| 85 Years and over | 0 (0.0%) | 0 (0.0%) |
| Total | 181 (100.0%) | 78 (100.0%) |
Families and Households in Pomona
Median Family Size in Pomona
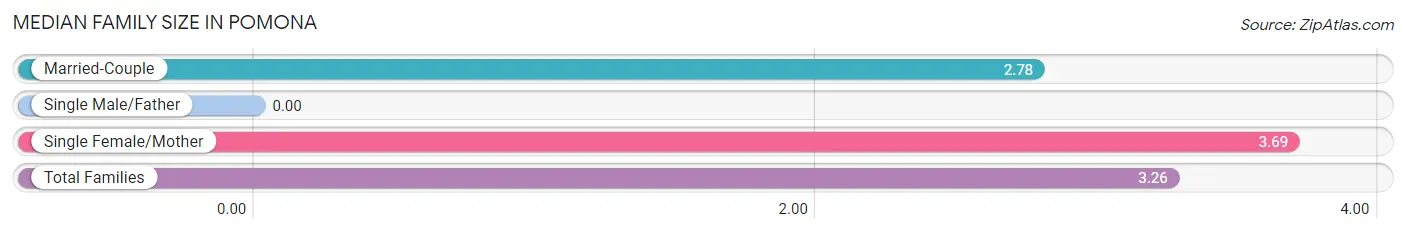
| Family Type | # Families | Family Size |
| Married-Couple | 32 (47.1%) | 2.78 |
| Single Male/Father | 0 (0.0%) | - |
| Single Female/Mother | 36 (52.9%) | 3.69 |
| Total Families | 68 (100.0%) | 3.26 |
Median Household Size in Pomona
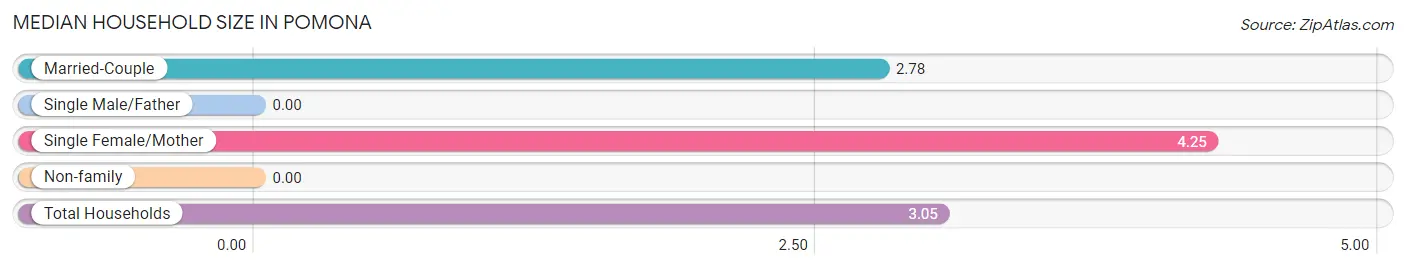
| Household Type | # Households | Household Size |
| Married-Couple | 32 (37.7%) | 2.78 |
| Single Male/Father | 0 (0.0%) | - |
| Single Female/Mother | 36 (42.3%) | 4.25 |
| Non-family | 17 (20.0%) | - |
| Total Households | 85 (100.0%) | 3.05 |
Household Size by Marriage Status in Pomona
Out of a total of 85 households in Pomona, 68 (80.0%) are family households, while 17 (20.0%) are nonfamily households. The most numerous type of family households are 4-person households, comprising 36, and the most common type of nonfamily households are 1-person households, comprising 17.
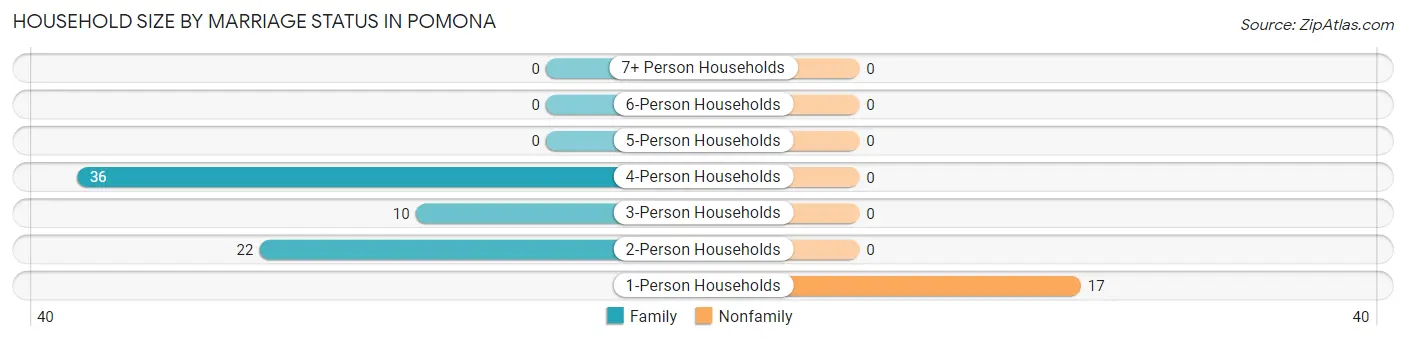
| Household Size | Family Households | Nonfamily Households |
| 1-Person Households | - | 17 (20.0%) |
| 2-Person Households | 22 (25.9%) | 0 (0.0%) |
| 3-Person Households | 10 (11.8%) | 0 (0.0%) |
| 4-Person Households | 36 (42.3%) | 0 (0.0%) |
| 5-Person Households | 0 (0.0%) | 0 (0.0%) |
| 6-Person Households | 0 (0.0%) | 0 (0.0%) |
| 7+ Person Households | 0 (0.0%) | 0 (0.0%) |
| Total | 68 (80.0%) | 17 (20.0%) |
Female Fertility in Pomona
Fertility by Age in Pomona
| Age Bracket | Women with Births | Births / 1,000 Women |
| 15 to 19 years | 0 (0.0%) | 0.0 |
| 20 to 34 years | 0 (0.0%) | 0.0 |
| 35 to 50 years | 0 (0.0%) | 0.0 |
| Total | 0 (0.0%) | 0.0 |
Fertility by Age by Marriage Status in Pomona
| Age Bracket | Married | Unmarried |
| 15 to 19 years | 0 (0.0%) | 0 (0.0%) |
| 20 to 34 years | 0 (0.0%) | 0 (0.0%) |
| 35 to 50 years | 0 (0.0%) | 0 (0.0%) |
| Total | 0 (0.0%) | 0 (0.0%) |
Fertility by Education in Pomona
| Educational Attainment | Women with Births | Births / 1,000 Women |
| Less than High School | 0 (0.0%) | 0.0 |
| High School Diploma | 0 (0.0%) | 0.0 |
| College or Associate's Degree | 0 (0.0%) | 0.0 |
| Bachelor's Degree | 0 (0.0%) | 0.0 |
| Graduate Degree | 0 (0.0%) | 0.0 |
| Total | 0 (0.0%) | 0.0 |
Fertility by Education by Marriage Status in Pomona
| Educational Attainment | Married | Unmarried |
| Less than High School | 0 (0.0%) | 0 (0.0%) |
| High School Diploma | 0 (0.0%) | 0 (0.0%) |
| College or Associate's Degree | 0 (0.0%) | 0 (0.0%) |
| Bachelor's Degree | 0 (0.0%) | 0 (0.0%) |
| Graduate Degree | 0 (0.0%) | 0 (0.0%) |
| Total | 0 (0.0%) | 0 (0.0%) |
Employment Characteristics in Pomona
Employment by Class of Employer in Pomona
Among the 92 employed individuals in Pomona, private company employees (67 | 72.8%), local government employees (15 | 16.3%), and not-for-profit organizations (10 | 10.9%) make up the most common classes of employment.
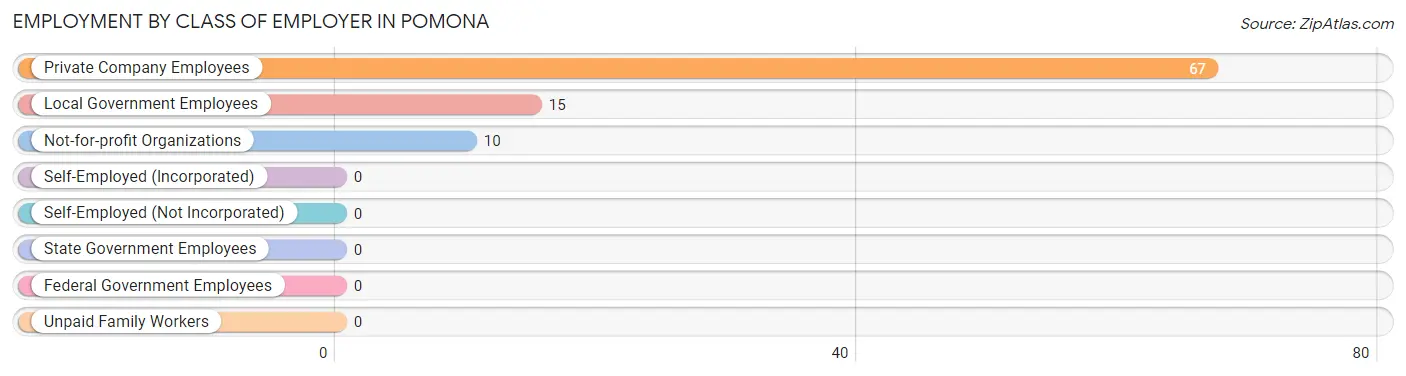
| Employer Class | # Employees | % Employees |
| Private Company Employees | 67 | 72.8% |
| Self-Employed (Incorporated) | 0 | 0.0% |
| Self-Employed (Not Incorporated) | 0 | 0.0% |
| Not-for-profit Organizations | 10 | 10.9% |
| Local Government Employees | 15 | 16.3% |
| State Government Employees | 0 | 0.0% |
| Federal Government Employees | 0 | 0.0% |
| Unpaid Family Workers | 0 | 0.0% |
| Total | 92 | 100.0% |
Employment Status by Age in Pomona
According to the labor force statistics for Pomona, out of the total population over 16 years of age (259), 43.6% or 113 individuals are in the labor force, with 18.6% or 21 of them unemployed. The age group with the highest labor force participation rate is 20 to 24 years, with 100.0% or 14 individuals in the labor force. Within the labor force, the 25 to 29 years age range has the highest percentage of unemployed individuals, with 100.0% or 21 of them being unemployed.
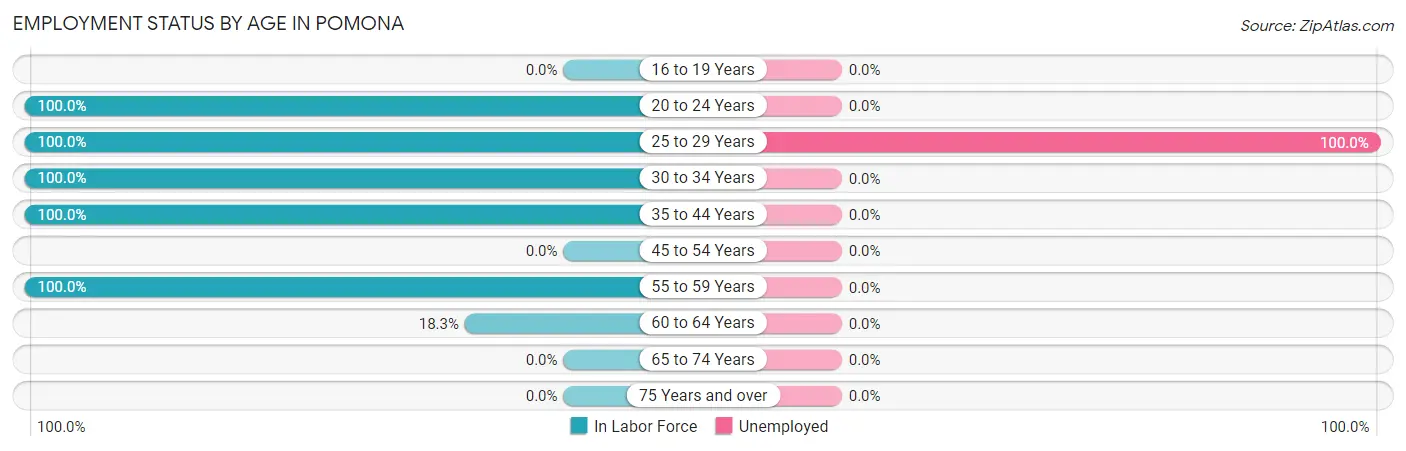
| Age Bracket | In Labor Force | Unemployed |
| 16 to 19 Years | 0 (0.0%) | 0 (0.0%) |
| 20 to 24 Years | 14 (100.0%) | 0 (0.0%) |
| 25 to 29 Years | 21 (100.0%) | 21 (100.0%) |
| 30 to 34 Years | 16 (100.0%) | 0 (0.0%) |
| 35 to 44 Years | 9 (100.0%) | 0 (0.0%) |
| 45 to 54 Years | 0 (0.0%) | 0 (0.0%) |
| 55 to 59 Years | 38 (100.0%) | 0 (0.0%) |
| 60 to 64 Years | 15 (18.3%) | 0 (0.0%) |
| 65 to 74 Years | 0 (0.0%) | 0 (0.0%) |
| 75 Years and over | 0 (0.0%) | 0 (0.0%) |
| Total | 113 (43.6%) | 21 (18.6%) |
Employment Status by Educational Attainment in Pomona
According to labor force statistics for Pomona, 50.5% of individuals (99) out of the total population between 25 and 64 years of age (196) are in the labor force, with 21.2% or 21 of them being unemployed. The group with the highest labor force participation rate are those with the educational attainment of high school diploma, with 100.0% or 67 individuals in the labor force. Within the labor force, individuals with less than high school education have the highest percentage of unemployment, with 100.0% or 21 of them being unemployed.
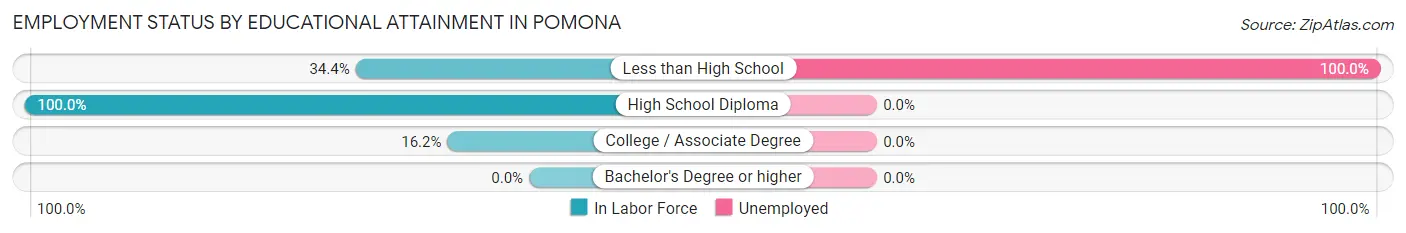
| Educational Attainment | In Labor Force | Unemployed |
| Less than High School | 21 (34.4%) | 61 (100.0%) |
| High School Diploma | 67 (100.0%) | 0 (0.0%) |
| College / Associate Degree | 11 (16.2%) | 0 (0.0%) |
| Bachelor's Degree or higher | 0 (0.0%) | 0 (0.0%) |
| Total | 99 (50.5%) | 42 (21.2%) |
Employment Occupations by Sex in Pomona
Management, Business, Science and Arts Occupations
Management, Business, Science and Arts Occupations by Sex
| Occupation | Male | Female |
| Management | 0 (0.0%) | 0 (0.0%) |
| Business & Financial | 0 (0.0%) | 0 (0.0%) |
| Computers, Engineering & Science | 0 (0.0%) | 0 (0.0%) |
| Computers & Mathematics | 0 (0.0%) | 0 (0.0%) |
| Architecture & Engineering | 0 (0.0%) | 0 (0.0%) |
| Life, Physical & Social Science | 0 (0.0%) | 0 (0.0%) |
| Community & Social Service | 0 (0.0%) | 0 (0.0%) |
| Education, Arts & Media | 0 (0.0%) | 0 (0.0%) |
| Legal Services & Support | 0 (0.0%) | 0 (0.0%) |
| Education Instruction & Library | 0 (0.0%) | 0 (0.0%) |
| Arts, Media & Entertainment | 0 (0.0%) | 0 (0.0%) |
| Health Diagnosing & Treating | 0 (0.0%) | 0 (0.0%) |
| Health Technologists | 0 (0.0%) | 0 (0.0%) |
| Total (Category) | 0 (0.0%) | 0 (0.0%) |
| Total (Overall) | 57 (62.0%) | 35 (38.0%) |
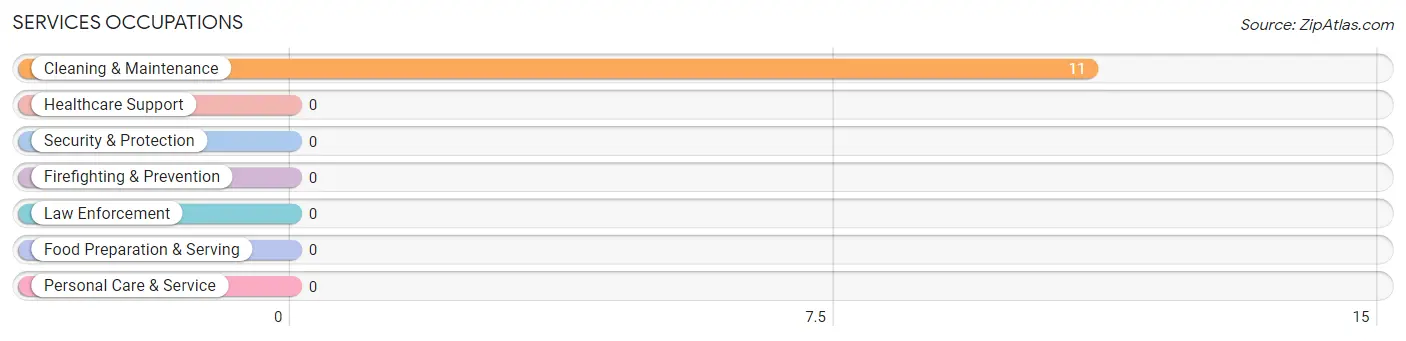
Services Occupations
The most common Services occupations in Pomona are , and Cleaning & Maintenance (11 | 12.0%).
Services Occupations by Sex
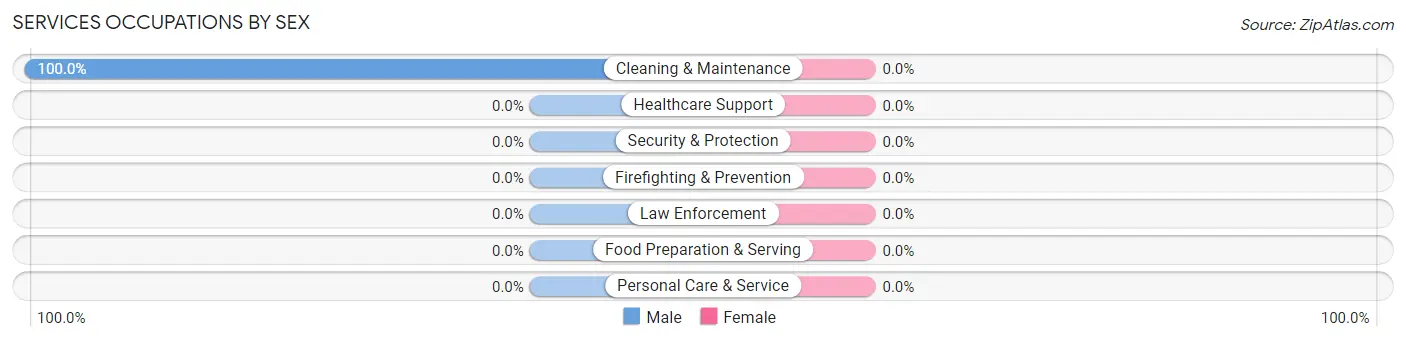
| Occupation | Male | Female |
| Healthcare Support | 0 (0.0%) | 0 (0.0%) |
| Security & Protection | 0 (0.0%) | 0 (0.0%) |
| Firefighting & Prevention | 0 (0.0%) | 0 (0.0%) |
| Law Enforcement | 0 (0.0%) | 0 (0.0%) |
| Food Preparation & Serving | 0 (0.0%) | 0 (0.0%) |
| Cleaning & Maintenance | 11 (100.0%) | 0 (0.0%) |
| Personal Care & Service | 0 (0.0%) | 0 (0.0%) |
| Total (Category) | 11 (100.0%) | 0 (0.0%) |
| Total (Overall) | 57 (62.0%) | 35 (38.0%) |
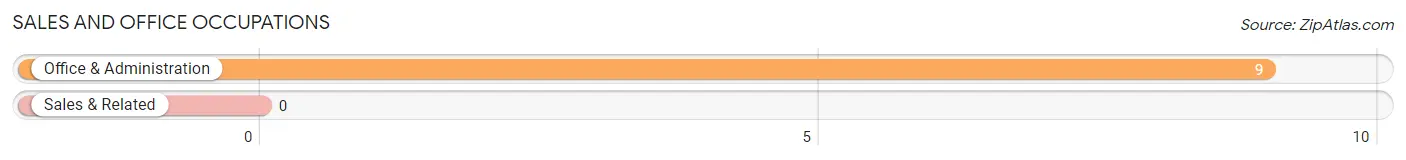
Sales and Office Occupations
The most common Sales and Office occupations in Pomona are , and Office & Administration (9 | 9.8%).
Sales and Office Occupations by Sex
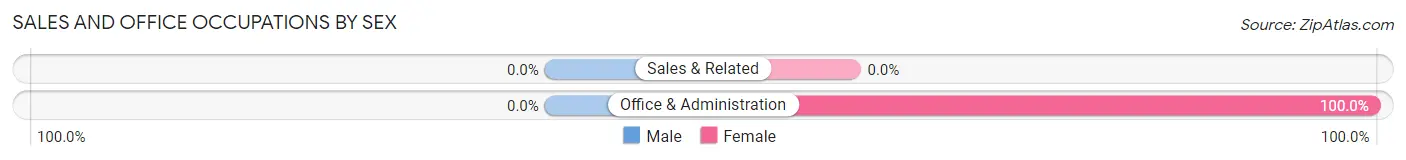
| Occupation | Male | Female |
| Sales & Related | 0 (0.0%) | 0 (0.0%) |
| Office & Administration | 0 (0.0%) | 9 (100.0%) |
| Total (Category) | 0 (0.0%) | 9 (100.0%) |
| Total (Overall) | 57 (62.0%) | 35 (38.0%) |
Natural Resources, Construction and Maintenance Occupations
The most common Natural Resources, Construction and Maintenance occupations in Pomona are , and Construction & Extraction (15 | 16.3%).
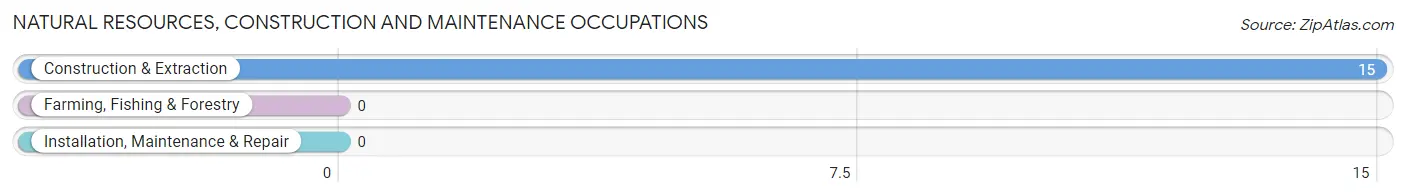
Natural Resources, Construction and Maintenance Occupations by Sex
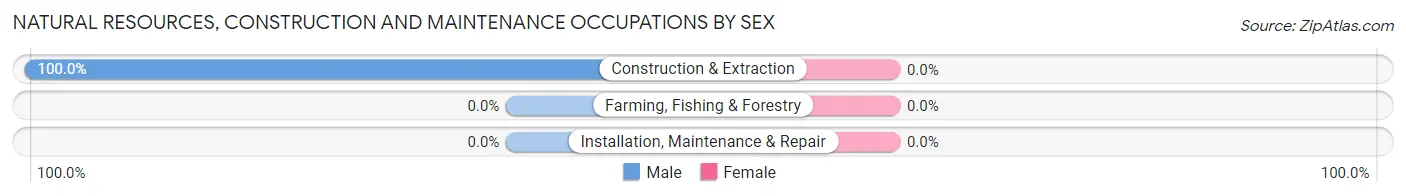
| Occupation | Male | Female |
| Farming, Fishing & Forestry | 0 (0.0%) | 0 (0.0%) |
| Construction & Extraction | 15 (100.0%) | 0 (0.0%) |
| Installation, Maintenance & Repair | 0 (0.0%) | 0 (0.0%) |
| Total (Category) | 15 (100.0%) | 0 (0.0%) |
| Total (Overall) | 57 (62.0%) | 35 (38.0%) |
Production, Transportation and Moving Occupations
The most common Production, Transportation and Moving occupations in Pomona are Material Moving (47 | 51.1%), and Production (10 | 10.9%).
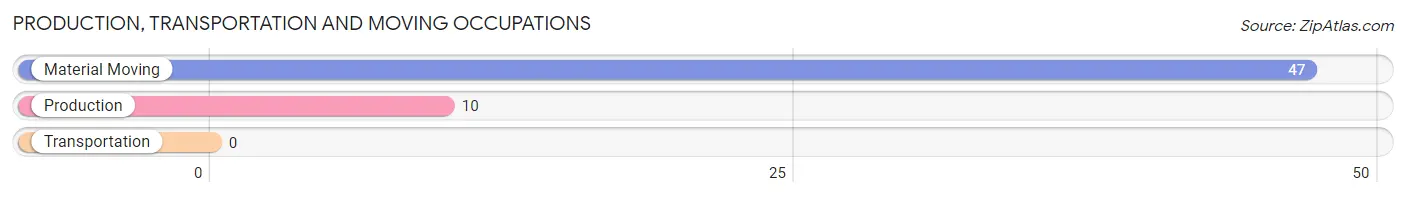
Production, Transportation and Moving Occupations by Sex
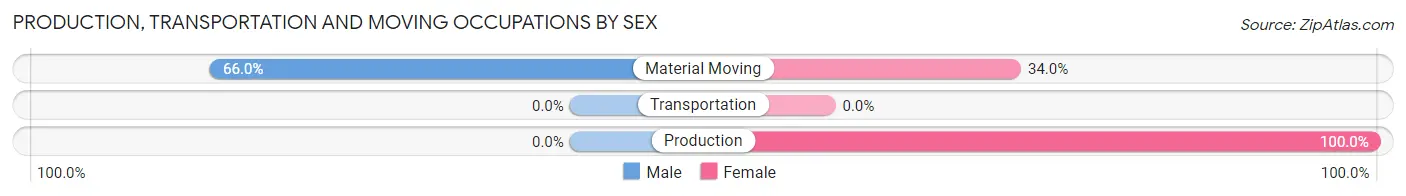
| Occupation | Male | Female |
| Production | 0 (0.0%) | 10 (100.0%) |
| Transportation | 0 (0.0%) | 0 (0.0%) |
| Material Moving | 31 (66.0%) | 16 (34.0%) |
| Total (Category) | 31 (54.4%) | 26 (45.6%) |
| Total (Overall) | 57 (62.0%) | 35 (38.0%) |
Employment Industries by Sex in Pomona
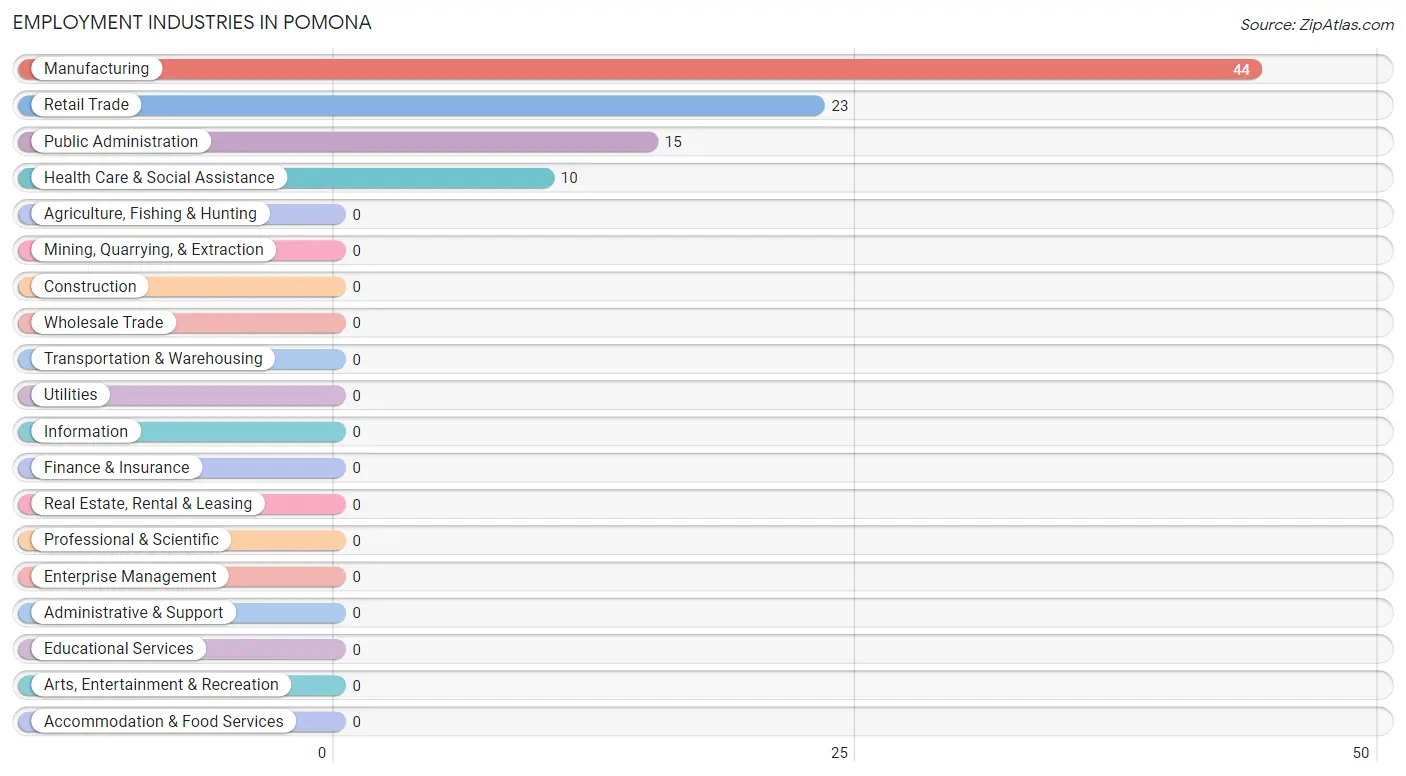
Employment Industries in Pomona
The major employment industries in Pomona include Manufacturing (44 | 47.8%), Retail Trade (23 | 25.0%), Public Administration (15 | 16.3%), and Health Care & Social Assistance (10 | 10.9%).
Employment Industries by Sex in Pomona
The Pomona industries that see more men than women are Public Administration (100.0%), Manufacturing (63.6%), and Retail Trade (60.9%), whereas the industries that tend to have a higher number of women are Health Care & Social Assistance (100.0%), Retail Trade (39.1%), and Manufacturing (36.4%).
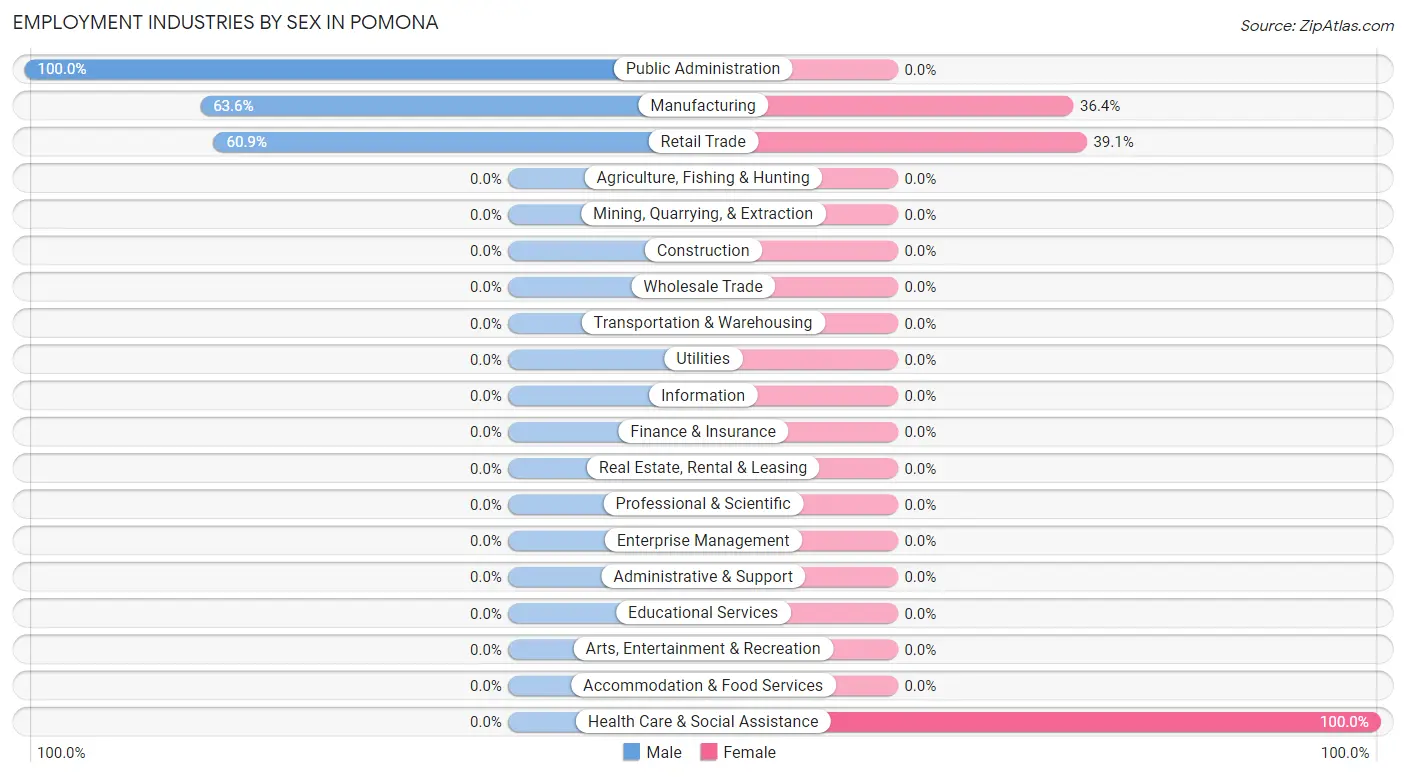
| Industry | Male | Female |
| Agriculture, Fishing & Hunting | 0 (0.0%) | 0 (0.0%) |
| Mining, Quarrying, & Extraction | 0 (0.0%) | 0 (0.0%) |
| Construction | 0 (0.0%) | 0 (0.0%) |
| Manufacturing | 28 (63.6%) | 16 (36.4%) |
| Wholesale Trade | 0 (0.0%) | 0 (0.0%) |
| Retail Trade | 14 (60.9%) | 9 (39.1%) |
| Transportation & Warehousing | 0 (0.0%) | 0 (0.0%) |
| Utilities | 0 (0.0%) | 0 (0.0%) |
| Information | 0 (0.0%) | 0 (0.0%) |
| Finance & Insurance | 0 (0.0%) | 0 (0.0%) |
| Real Estate, Rental & Leasing | 0 (0.0%) | 0 (0.0%) |
| Professional & Scientific | 0 (0.0%) | 0 (0.0%) |
| Enterprise Management | 0 (0.0%) | 0 (0.0%) |
| Administrative & Support | 0 (0.0%) | 0 (0.0%) |
| Educational Services | 0 (0.0%) | 0 (0.0%) |
| Health Care & Social Assistance | 0 (0.0%) | 10 (100.0%) |
| Arts, Entertainment & Recreation | 0 (0.0%) | 0 (0.0%) |
| Accommodation & Food Services | 0 (0.0%) | 0 (0.0%) |
| Public Administration | 15 (100.0%) | 0 (0.0%) |
| Total | 57 (62.0%) | 35 (38.0%) |
Education in Pomona
School Enrollment in Pomona
| School Level | # Students | % Students |
| Nursery / Preschool | 0 | 0.0% |
| Kindergarten | 0 | 0.0% |
| Elementary School | 0 | 0.0% |
| Middle School | 0 | 0.0% |
| High School | 0 | 0.0% |
| College / Undergraduate | 0 | 0.0% |
| Graduate / Professional | 0 | 0.0% |
| Total | 0 | 0.0% |
School Enrollment by Age by Funding Source in Pomona
| Age Bracket | Public School | Private School |
| 3 to 4 Year Olds | 0 (0.0%) | 0 (0.0%) |
| 5 to 9 Year Old | 0 (0.0%) | 0 (0.0%) |
| 10 to 14 Year Olds | 0 (0.0%) | 0 (0.0%) |
| 15 to 17 Year Olds | 0 (0.0%) | 0 (0.0%) |
| 18 to 19 Year Olds | 0 (0.0%) | 0 (0.0%) |
| 20 to 24 Year Olds | 0 (0.0%) | 0 (0.0%) |
| 25 to 34 Year Olds | 0 (0.0%) | 0 (0.0%) |
| 35 Years and over | 0 (0.0%) | 0 (0.0%) |
| Total | 0 (0.0%) | 0 (0.0%) |
Educational Attainment by Field of Study in Pomona
| Field of Study | # Graduates | % Graduates |
| Computers & Mathematics | 0 | 0.0% |
| Bio, Nature & Agricultural | 0 | 0.0% |
| Physical & Health Sciences | 0 | 0.0% |
| Psychology | 0 | 0.0% |
| Social Sciences | 0 | 0.0% |
| Engineering | 0 | 0.0% |
| Multidisciplinary Studies | 0 | 0.0% |
| Science & Technology | 0 | 0.0% |
| Business | 0 | 0.0% |
| Education | 0 | 0.0% |
| Literature & Languages | 0 | 0.0% |
| Liberal Arts & History | 0 | 0.0% |
| Visual & Performing Arts | 0 | 0.0% |
| Communications | 0 | 0.0% |
| Arts & Humanities | 0 | 0.0% |
| Total | 0 | 0.0% |
Transportation & Commute in Pomona
Vehicle Availability by Sex in Pomona
The most prevalent vehicle ownership categories in Pomona are males with 4 vehicles (31, accounting for 54.4%) and females with 4 vehicles (16, making up 88.6%).
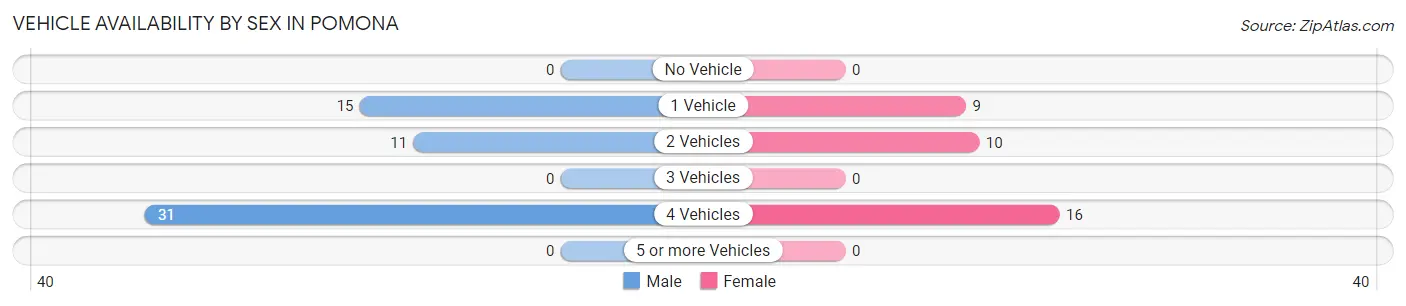
| Vehicles Available | Male | Female |
| No Vehicle | 0 (0.0%) | 0 (0.0%) |
| 1 Vehicle | 15 (26.3%) | 9 (25.7%) |
| 2 Vehicles | 11 (19.3%) | 10 (28.6%) |
| 3 Vehicles | 0 (0.0%) | 0 (0.0%) |
| 4 Vehicles | 31 (54.4%) | 16 (45.7%) |
| 5 or more Vehicles | 0 (0.0%) | 0 (0.0%) |
| Total | 57 (100.0%) | 35 (100.0%) |
Commute Time in Pomona
The most frequently occuring commute durations in Pomona are 15 to 19 minutes (41 commuters, 44.6%), 10 to 14 minutes (21 commuters, 22.8%), and 20 to 24 minutes (16 commuters, 17.4%).
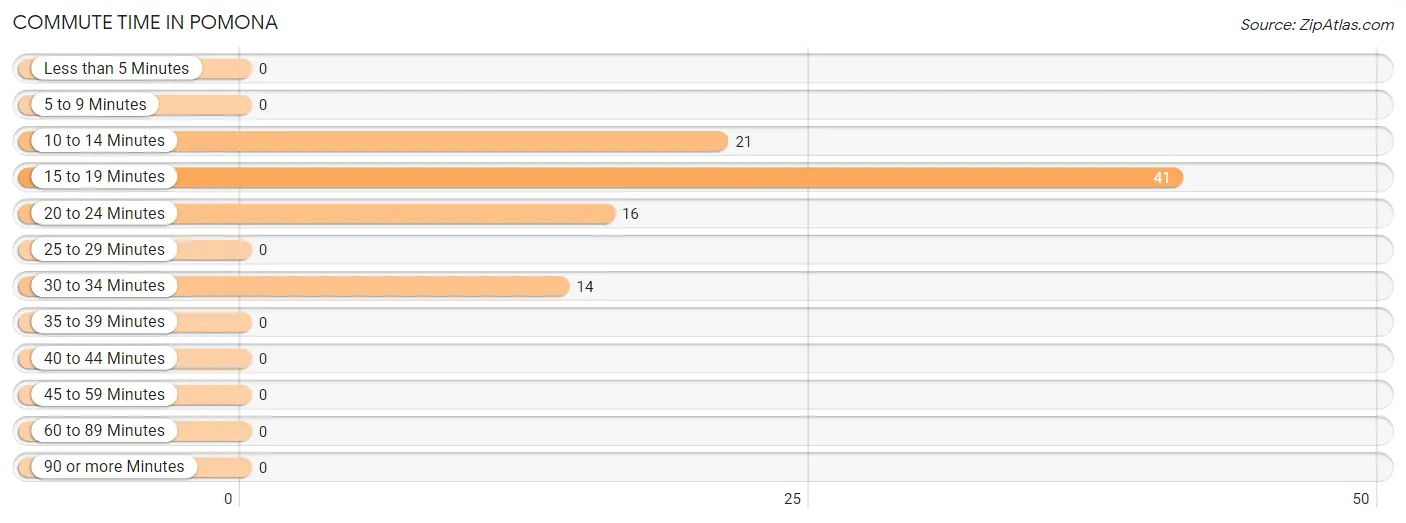
| Commute Time | # Commuters | % Commuters |
| Less than 5 Minutes | 0 | 0.0% |
| 5 to 9 Minutes | 0 | 0.0% |
| 10 to 14 Minutes | 21 | 22.8% |
| 15 to 19 Minutes | 41 | 44.6% |
| 20 to 24 Minutes | 16 | 17.4% |
| 25 to 29 Minutes | 0 | 0.0% |
| 30 to 34 Minutes | 14 | 15.2% |
| 35 to 39 Minutes | 0 | 0.0% |
| 40 to 44 Minutes | 0 | 0.0% |
| 45 to 59 Minutes | 0 | 0.0% |
| 60 to 89 Minutes | 0 | 0.0% |
| 90 or more Minutes | 0 | 0.0% |
Commute Time by Sex in Pomona
The most common commute times in Pomona are 15 to 19 minutes (32 commuters, 56.1%) for males and 20 to 24 minutes (16 commuters, 45.7%) for females.
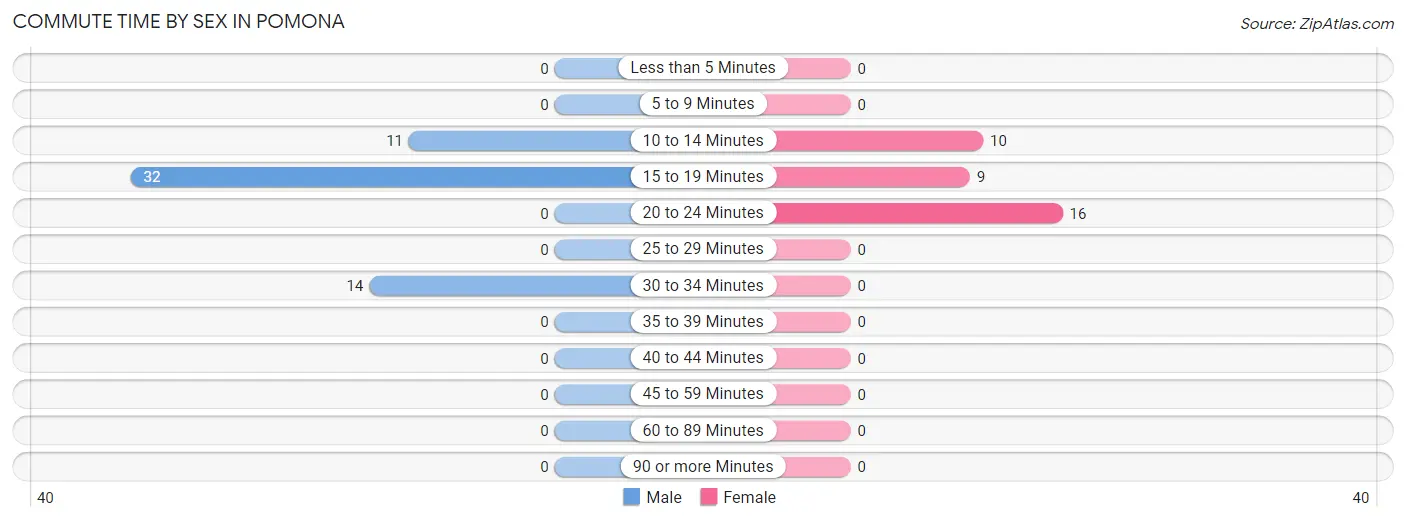
| Commute Time | Male | Female |
| Less than 5 Minutes | 0 (0.0%) | 0 (0.0%) |
| 5 to 9 Minutes | 0 (0.0%) | 0 (0.0%) |
| 10 to 14 Minutes | 11 (19.3%) | 10 (28.6%) |
| 15 to 19 Minutes | 32 (56.1%) | 9 (25.7%) |
| 20 to 24 Minutes | 0 (0.0%) | 16 (45.7%) |
| 25 to 29 Minutes | 0 (0.0%) | 0 (0.0%) |
| 30 to 34 Minutes | 14 (24.6%) | 0 (0.0%) |
| 35 to 39 Minutes | 0 (0.0%) | 0 (0.0%) |
| 40 to 44 Minutes | 0 (0.0%) | 0 (0.0%) |
| 45 to 59 Minutes | 0 (0.0%) | 0 (0.0%) |
| 60 to 89 Minutes | 0 (0.0%) | 0 (0.0%) |
| 90 or more Minutes | 0 (0.0%) | 0 (0.0%) |
Time of Departure to Work by Sex in Pomona
The most frequent times of departure to work in Pomona are 7:30 AM to 7:59 AM (17, 29.8%) for males and 5:00 AM to 5:29 AM (16, 45.7%) for females.
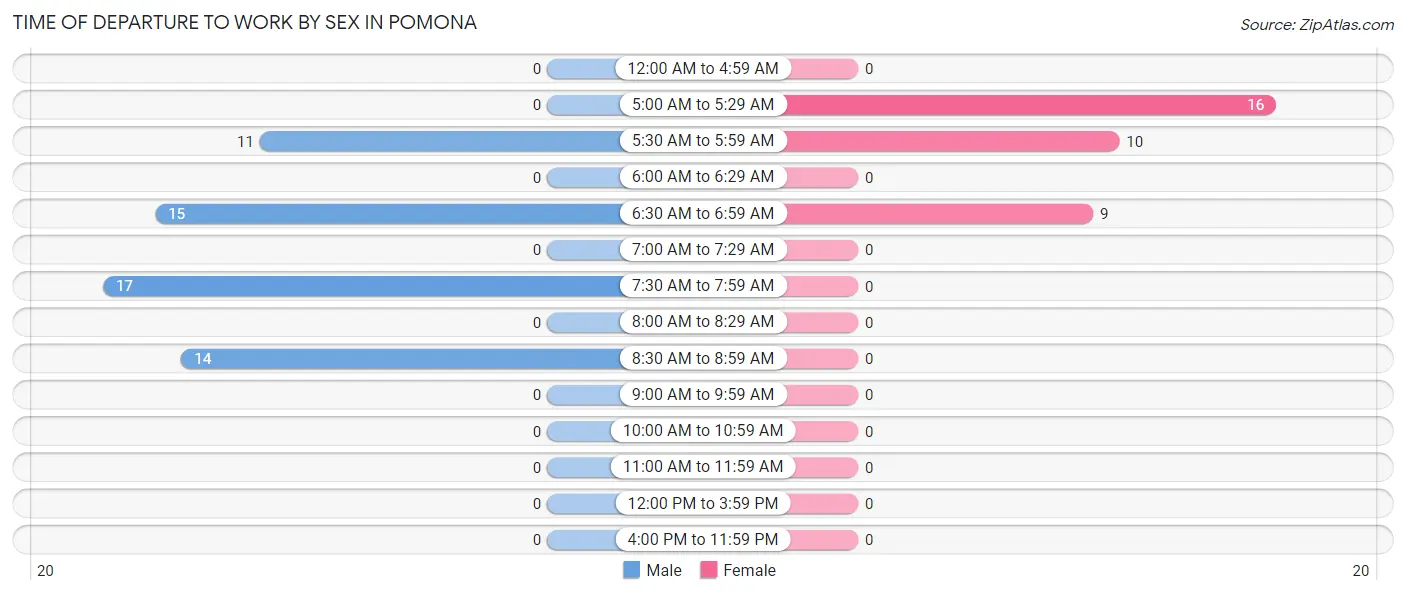
| Time of Departure | Male | Female |
| 12:00 AM to 4:59 AM | 0 (0.0%) | 0 (0.0%) |
| 5:00 AM to 5:29 AM | 0 (0.0%) | 16 (45.7%) |
| 5:30 AM to 5:59 AM | 11 (19.3%) | 10 (28.6%) |
| 6:00 AM to 6:29 AM | 0 (0.0%) | 0 (0.0%) |
| 6:30 AM to 6:59 AM | 15 (26.3%) | 9 (25.7%) |
| 7:00 AM to 7:29 AM | 0 (0.0%) | 0 (0.0%) |
| 7:30 AM to 7:59 AM | 17 (29.8%) | 0 (0.0%) |
| 8:00 AM to 8:29 AM | 0 (0.0%) | 0 (0.0%) |
| 8:30 AM to 8:59 AM | 14 (24.6%) | 0 (0.0%) |
| 9:00 AM to 9:59 AM | 0 (0.0%) | 0 (0.0%) |
| 10:00 AM to 10:59 AM | 0 (0.0%) | 0 (0.0%) |
| 11:00 AM to 11:59 AM | 0 (0.0%) | 0 (0.0%) |
| 12:00 PM to 3:59 PM | 0 (0.0%) | 0 (0.0%) |
| 4:00 PM to 11:59 PM | 0 (0.0%) | 0 (0.0%) |
| Total | 57 (100.0%) | 35 (100.0%) |
Housing Occupancy in Pomona
Occupancy by Ownership in Pomona
Of the total 85 dwellings in Pomona, owner-occupied units account for 52 (61.2%), while renter-occupied units make up 33 (38.8%).
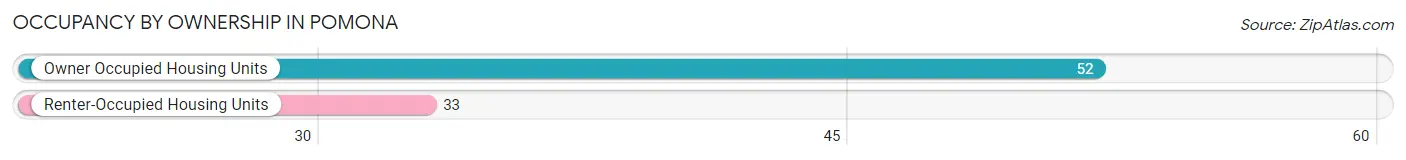
| Occupancy | # Housing Units | % Housing Units |
| Owner Occupied Housing Units | 52 | 61.2% |
| Renter-Occupied Housing Units | 33 | 38.8% |
| Total Occupied Housing Units | 85 | 100.0% |
Occupancy by Household Size in Pomona
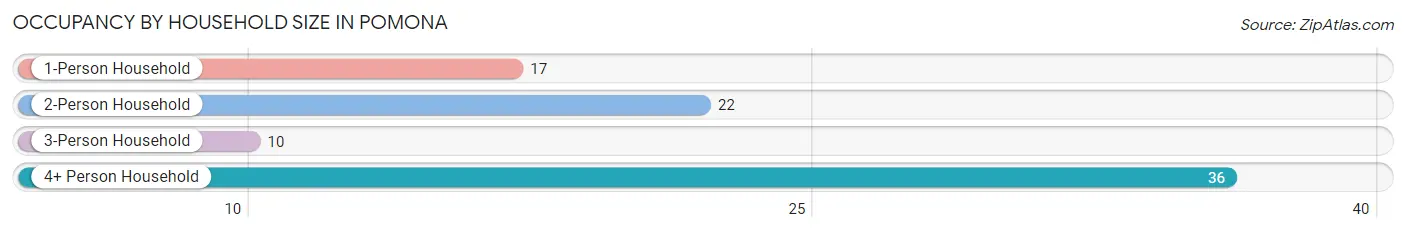
| Household Size | # Housing Units | % Housing Units |
| 1-Person Household | 17 | 20.0% |
| 2-Person Household | 22 | 25.9% |
| 3-Person Household | 10 | 11.8% |
| 4+ Person Household | 36 | 42.3% |
| Total Housing Units | 85 | 100.0% |
Occupancy by Ownership by Household Size in Pomona
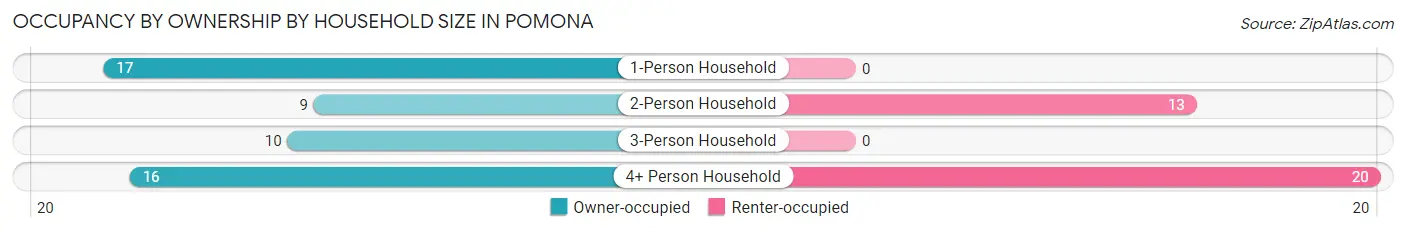
| Household Size | Owner-occupied | Renter-occupied |
| 1-Person Household | 17 (100.0%) | 0 (0.0%) |
| 2-Person Household | 9 (40.9%) | 13 (59.1%) |
| 3-Person Household | 10 (100.0%) | 0 (0.0%) |
| 4+ Person Household | 16 (44.4%) | 20 (55.6%) |
| Total Housing Units | 52 (61.2%) | 33 (38.8%) |
Occupancy by Educational Attainment in Pomona
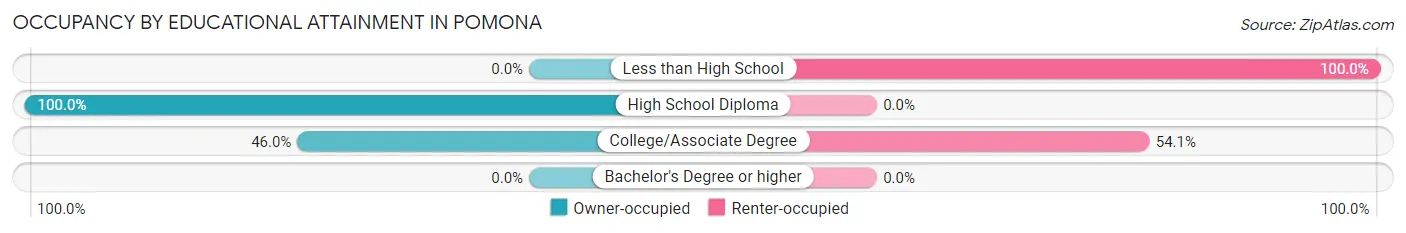
| Household Size | Owner-occupied | Renter-occupied |
| Less than High School | 0 (0.0%) | 13 (100.0%) |
| High School Diploma | 35 (100.0%) | 0 (0.0%) |
| College/Associate Degree | 17 (46.0%) | 20 (54.0%) |
| Bachelor's Degree or higher | 0 (0.0%) | 0 (0.0%) |
Occupancy by Age of Householder in Pomona
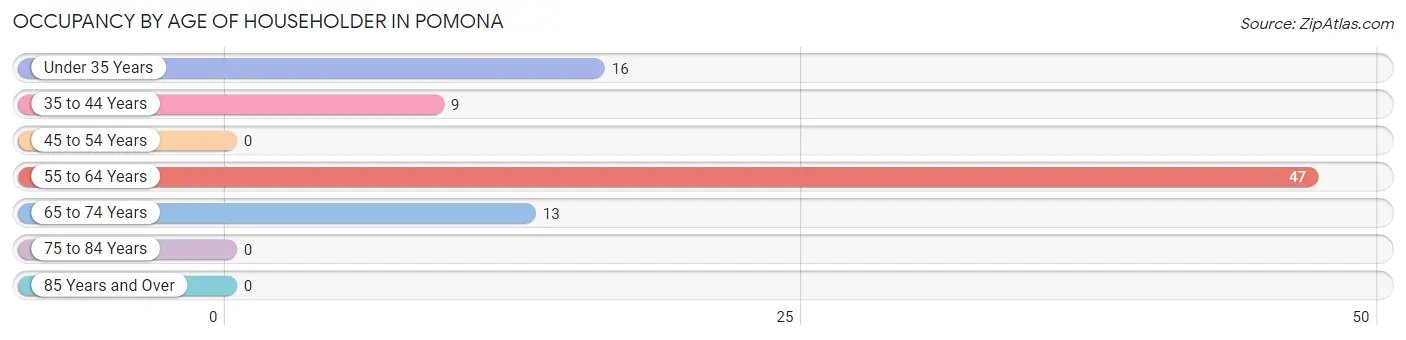
| Age Bracket | # Households | % Households |
| Under 35 Years | 16 | 18.8% |
| 35 to 44 Years | 9 | 10.6% |
| 45 to 54 Years | 0 | 0.0% |
| 55 to 64 Years | 47 | 55.3% |
| 65 to 74 Years | 13 | 15.3% |
| 75 to 84 Years | 0 | 0.0% |
| 85 Years and Over | 0 | 0.0% |
| Total | 85 | 100.0% |
Housing Finances in Pomona
Median Income by Occupancy in Pomona
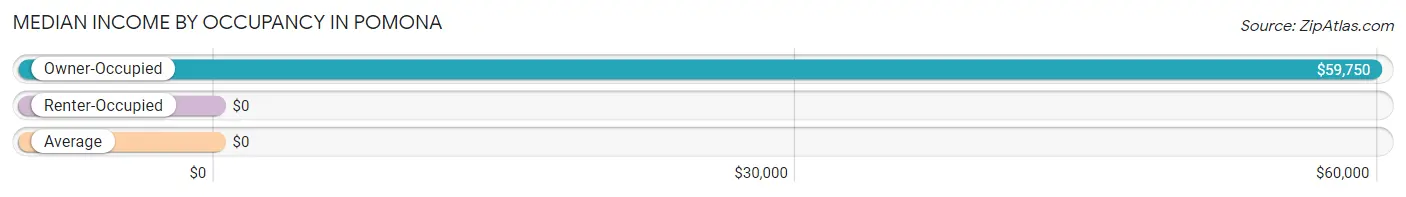
| Occupancy Type | # Households | Median Income |
| Owner-Occupied | 52 (61.2%) | $59,750 |
| Renter-Occupied | 33 (38.8%) | $0 |
| Average | 85 (100.0%) | $0 |
Occupancy by Householder Income Bracket in Pomona
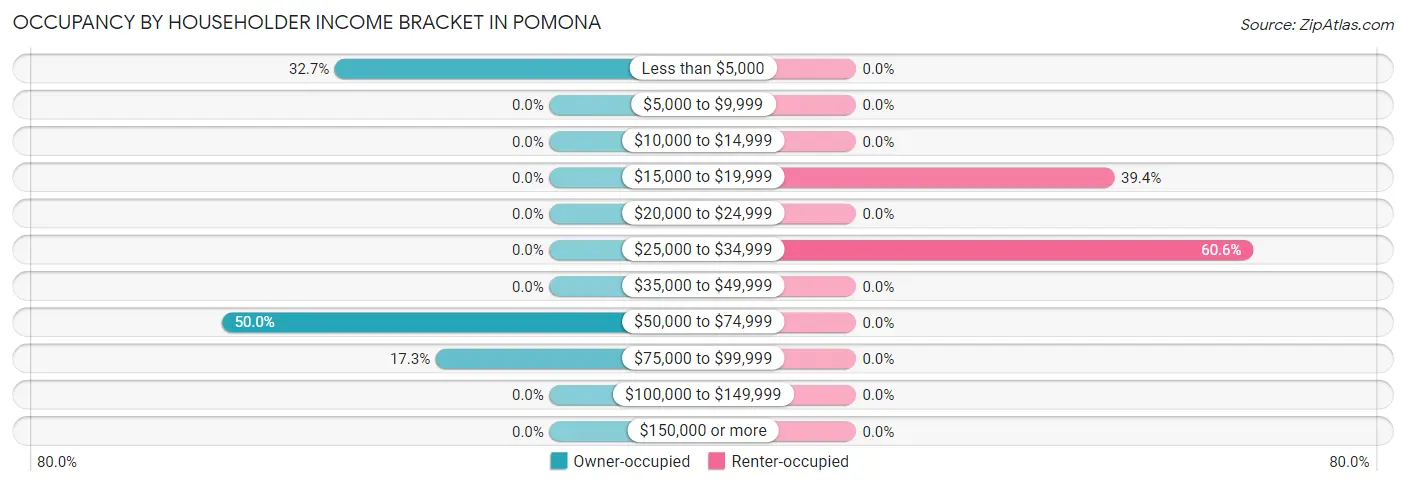
| Income Bracket | Owner-occupied | Renter-occupied |
| Less than $5,000 | 17 (32.7%) | 0 (0.0%) |
| $5,000 to $9,999 | 0 (0.0%) | 0 (0.0%) |
| $10,000 to $14,999 | 0 (0.0%) | 0 (0.0%) |
| $15,000 to $19,999 | 0 (0.0%) | 13 (39.4%) |
| $20,000 to $24,999 | 0 (0.0%) | 0 (0.0%) |
| $25,000 to $34,999 | 0 (0.0%) | 20 (60.6%) |
| $35,000 to $49,999 | 0 (0.0%) | 0 (0.0%) |
| $50,000 to $74,999 | 26 (50.0%) | 0 (0.0%) |
| $75,000 to $99,999 | 9 (17.3%) | 0 (0.0%) |
| $100,000 to $149,999 | 0 (0.0%) | 0 (0.0%) |
| $150,000 or more | 0 (0.0%) | 0 (0.0%) |
| Total | 52 (100.0%) | 33 (100.0%) |
Monthly Housing Cost Tiers in Pomona
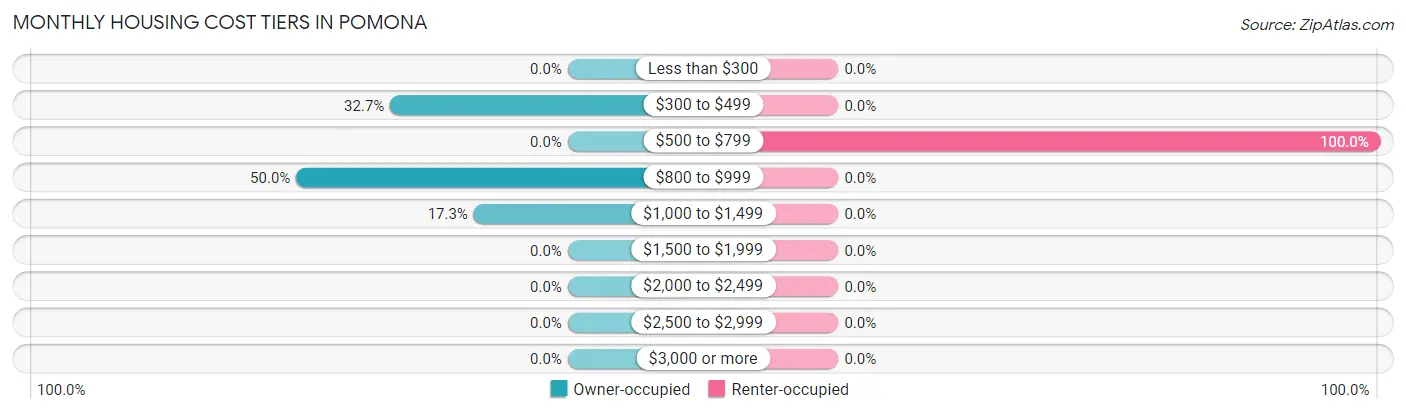
| Monthly Cost | Owner-occupied | Renter-occupied |
| Less than $300 | 0 (0.0%) | 0 (0.0%) |
| $300 to $499 | 17 (32.7%) | 0 (0.0%) |
| $500 to $799 | 0 (0.0%) | 33 (100.0%) |
| $800 to $999 | 26 (50.0%) | 0 (0.0%) |
| $1,000 to $1,499 | 9 (17.3%) | 0 (0.0%) |
| $1,500 to $1,999 | 0 (0.0%) | 0 (0.0%) |
| $2,000 to $2,499 | 0 (0.0%) | 0 (0.0%) |
| $2,500 to $2,999 | 0 (0.0%) | 0 (0.0%) |
| $3,000 or more | 0 (0.0%) | 0 (0.0%) |
| Total | 52 (100.0%) | 33 (100.0%) |
Physical Housing Characteristics in Pomona
Housing Structures in Pomona
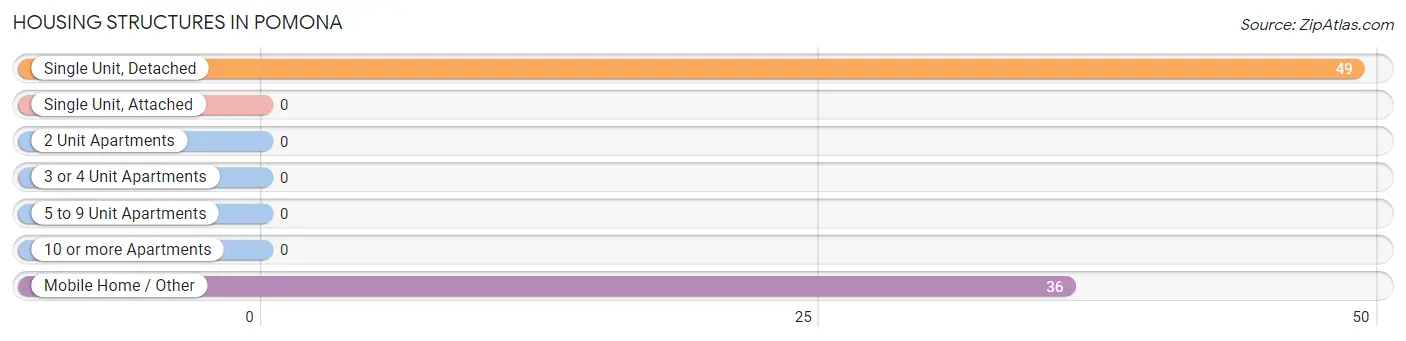
| Structure Type | # Housing Units | % Housing Units |
| Single Unit, Detached | 49 | 57.7% |
| Single Unit, Attached | 0 | 0.0% |
| 2 Unit Apartments | 0 | 0.0% |
| 3 or 4 Unit Apartments | 0 | 0.0% |
| 5 to 9 Unit Apartments | 0 | 0.0% |
| 10 or more Apartments | 0 | 0.0% |
| Mobile Home / Other | 36 | 42.3% |
| Total | 85 | 100.0% |
Housing Structures by Occupancy in Pomona
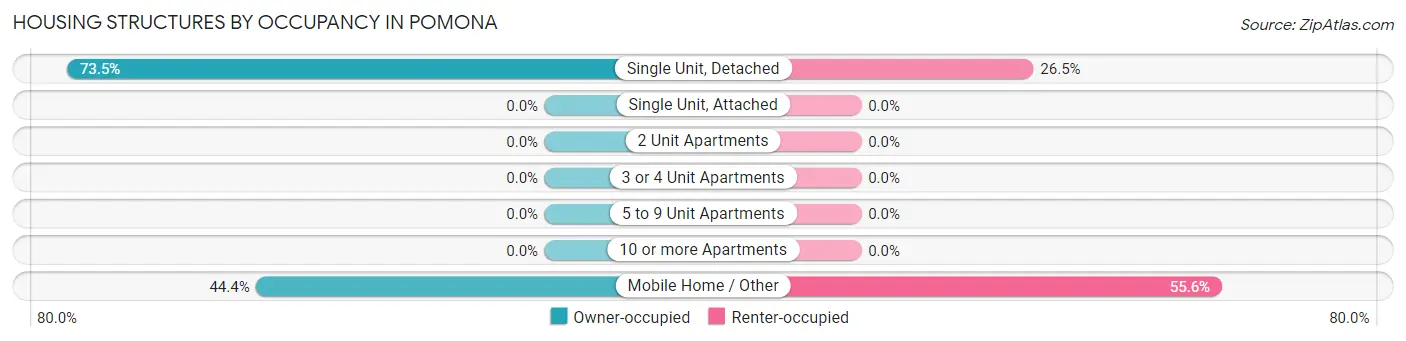
| Structure Type | Owner-occupied | Renter-occupied |
| Single Unit, Detached | 36 (73.5%) | 13 (26.5%) |
| Single Unit, Attached | 0 (0.0%) | 0 (0.0%) |
| 2 Unit Apartments | 0 (0.0%) | 0 (0.0%) |
| 3 or 4 Unit Apartments | 0 (0.0%) | 0 (0.0%) |
| 5 to 9 Unit Apartments | 0 (0.0%) | 0 (0.0%) |
| 10 or more Apartments | 0 (0.0%) | 0 (0.0%) |
| Mobile Home / Other | 16 (44.4%) | 20 (55.6%) |
| Total | 52 (61.2%) | 33 (38.8%) |
Housing Structures by Number of Rooms in Pomona
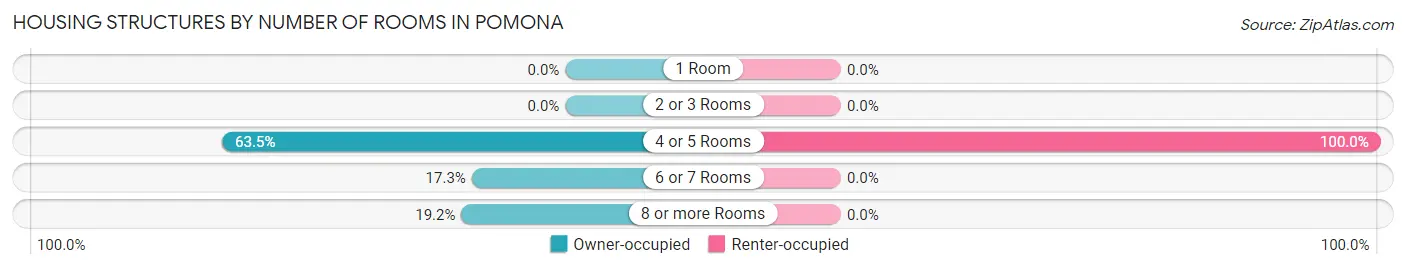
| Number of Rooms | Owner-occupied | Renter-occupied |
| 1 Room | 0 (0.0%) | 0 (0.0%) |
| 2 or 3 Rooms | 0 (0.0%) | 0 (0.0%) |
| 4 or 5 Rooms | 33 (63.5%) | 33 (100.0%) |
| 6 or 7 Rooms | 9 (17.3%) | 0 (0.0%) |
| 8 or more Rooms | 10 (19.2%) | 0 (0.0%) |
| Total | 52 (100.0%) | 33 (100.0%) |
Housing Structure by Heating Type in Pomona
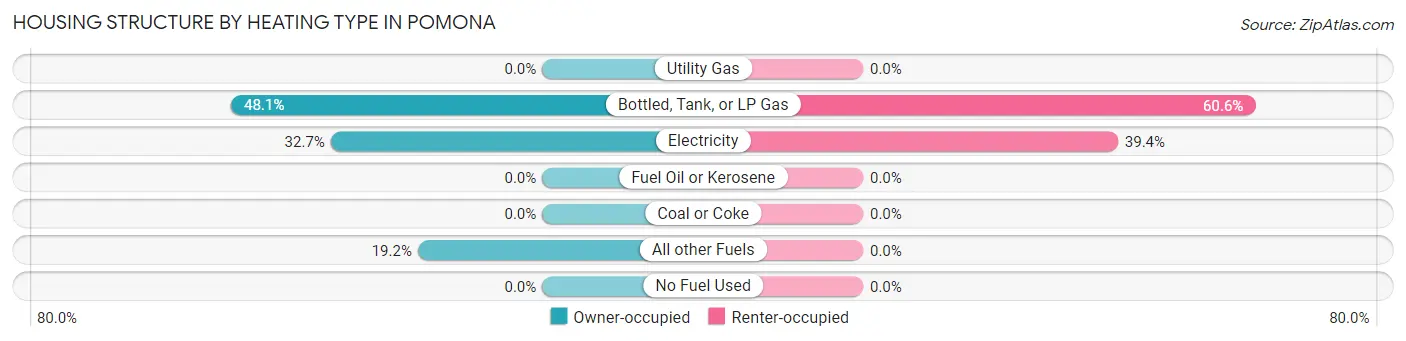
| Heating Type | Owner-occupied | Renter-occupied |
| Utility Gas | 0 (0.0%) | 0 (0.0%) |
| Bottled, Tank, or LP Gas | 25 (48.1%) | 20 (60.6%) |
| Electricity | 17 (32.7%) | 13 (39.4%) |
| Fuel Oil or Kerosene | 0 (0.0%) | 0 (0.0%) |
| Coal or Coke | 0 (0.0%) | 0 (0.0%) |
| All other Fuels | 10 (19.2%) | 0 (0.0%) |
| No Fuel Used | 0 (0.0%) | 0 (0.0%) |
| Total | 52 (100.0%) | 33 (100.0%) |
Household Vehicle Usage in Pomona
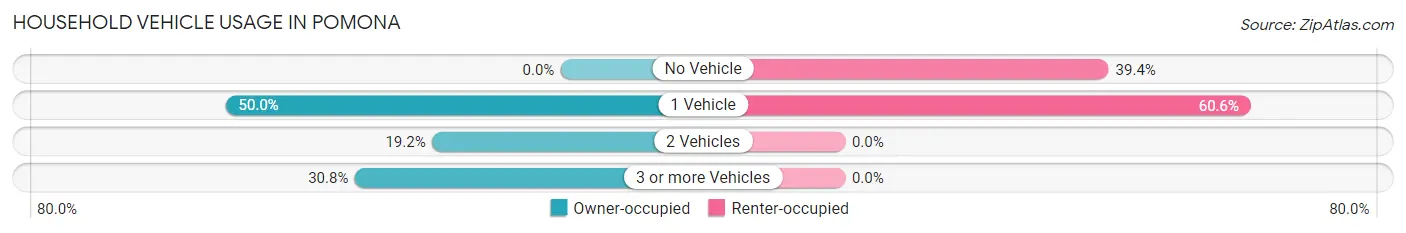
| Vehicles per Household | Owner-occupied | Renter-occupied |
| No Vehicle | 0 (0.0%) | 13 (39.4%) |
| 1 Vehicle | 26 (50.0%) | 20 (60.6%) |
| 2 Vehicles | 10 (19.2%) | 0 (0.0%) |
| 3 or more Vehicles | 16 (30.8%) | 0 (0.0%) |
| Total | 52 (100.0%) | 33 (100.0%) |
Real Estate & Mortgages in Pomona
Real Estate and Mortgage Overview in Pomona
| Characteristic | Without Mortgage | With Mortgage |
| Housing Units | 17 | 35 |
| Median Property Value | - | - |
| Median Household Income | - | - |
| Monthly Housing Costs | - | - |
| Real Estate Taxes | - | - |
Property Value by Mortgage Status in Pomona
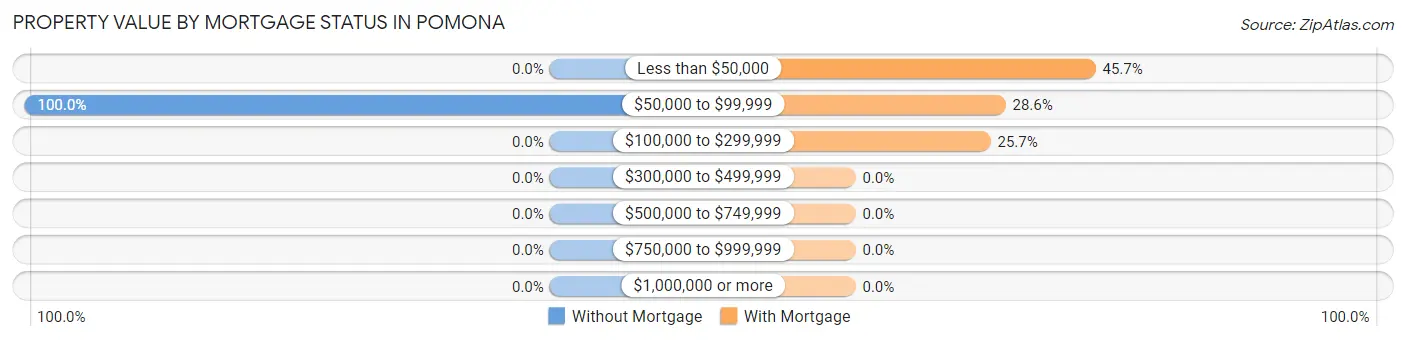
| Property Value | Without Mortgage | With Mortgage |
| Less than $50,000 | 0 (0.0%) | 16 (45.7%) |
| $50,000 to $99,999 | 17 (100.0%) | 10 (28.6%) |
| $100,000 to $299,999 | 0 (0.0%) | 9 (25.7%) |
| $300,000 to $499,999 | 0 (0.0%) | 0 (0.0%) |
| $500,000 to $749,999 | 0 (0.0%) | 0 (0.0%) |
| $750,000 to $999,999 | 0 (0.0%) | 0 (0.0%) |
| $1,000,000 or more | 0 (0.0%) | 0 (0.0%) |
| Total | 17 (100.0%) | 35 (100.0%) |
Household Income by Mortgage Status in Pomona
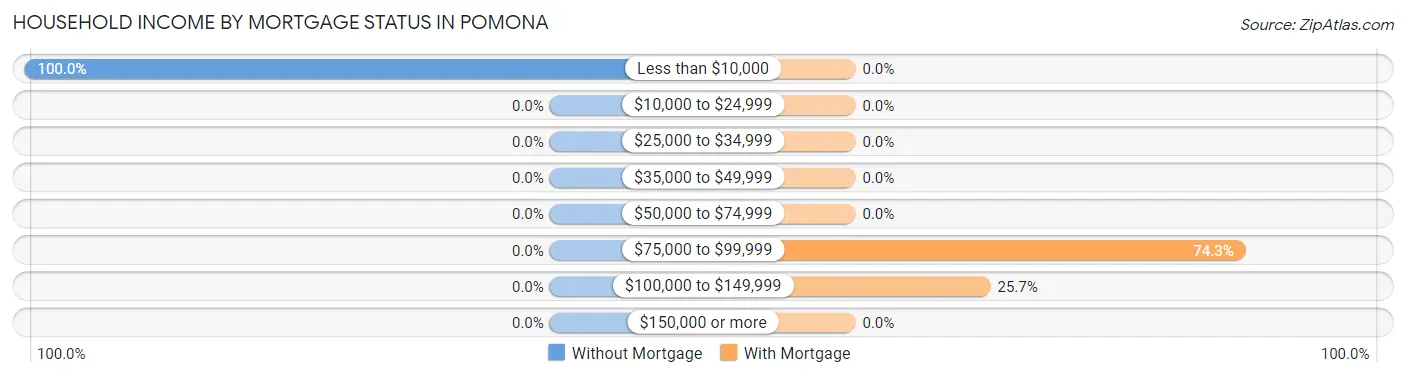
| Household Income | Without Mortgage | With Mortgage |
| Less than $10,000 | 17 (100.0%) | 0 (0.0%) |
| $10,000 to $24,999 | 0 (0.0%) | 0 (0.0%) |
| $25,000 to $34,999 | 0 (0.0%) | 0 (0.0%) |
| $35,000 to $49,999 | 0 (0.0%) | 0 (0.0%) |
| $50,000 to $74,999 | 0 (0.0%) | 0 (0.0%) |
| $75,000 to $99,999 | 0 (0.0%) | 26 (74.3%) |
| $100,000 to $149,999 | 0 (0.0%) | 9 (25.7%) |
| $150,000 or more | 0 (0.0%) | 0 (0.0%) |
| Total | 17 (100.0%) | 35 (100.0%) |
Property Value to Household Income Ratio in Pomona
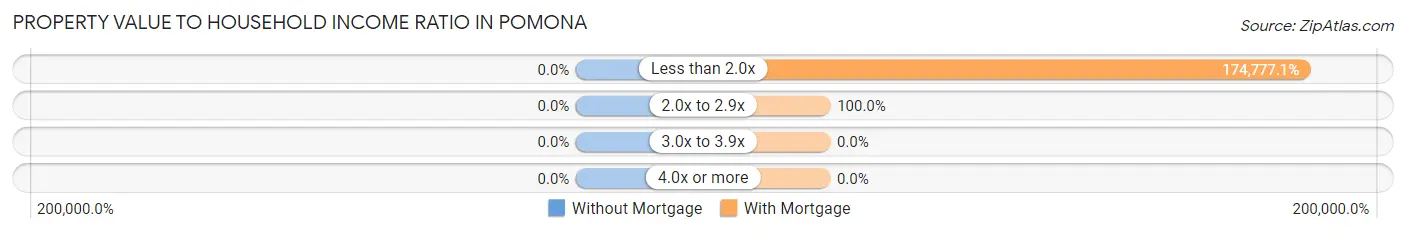
| Value-to-Income Ratio | Without Mortgage | With Mortgage |
| Less than 2.0x | 0 (0.0%) | 61,172 (174,777.1%) |
| 2.0x to 2.9x | 0 (0.0%) | 35 (100.0%) |
| 3.0x to 3.9x | 0 (0.0%) | 0 (0.0%) |
| 4.0x or more | 0 (0.0%) | 0 (0.0%) |
| Total | 17 (100.0%) | 35 (100.0%) |
Real Estate Taxes by Mortgage Status in Pomona
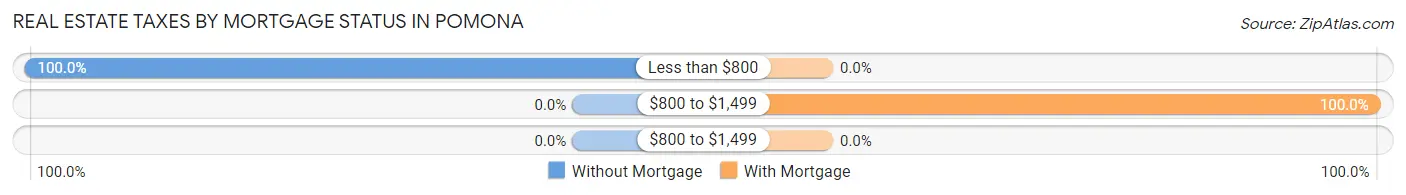
| Property Taxes | Without Mortgage | With Mortgage |
| Less than $800 | 17 (100.0%) | 0 (0.0%) |
| $800 to $1,499 | 0 (0.0%) | 35 (100.0%) |
| $800 to $1,499 | 0 (0.0%) | 0 (0.0%) |
| Total | 17 (100.0%) | 35 (100.0%) |
Health & Disability in Pomona
Health Insurance Coverage by Age in Pomona
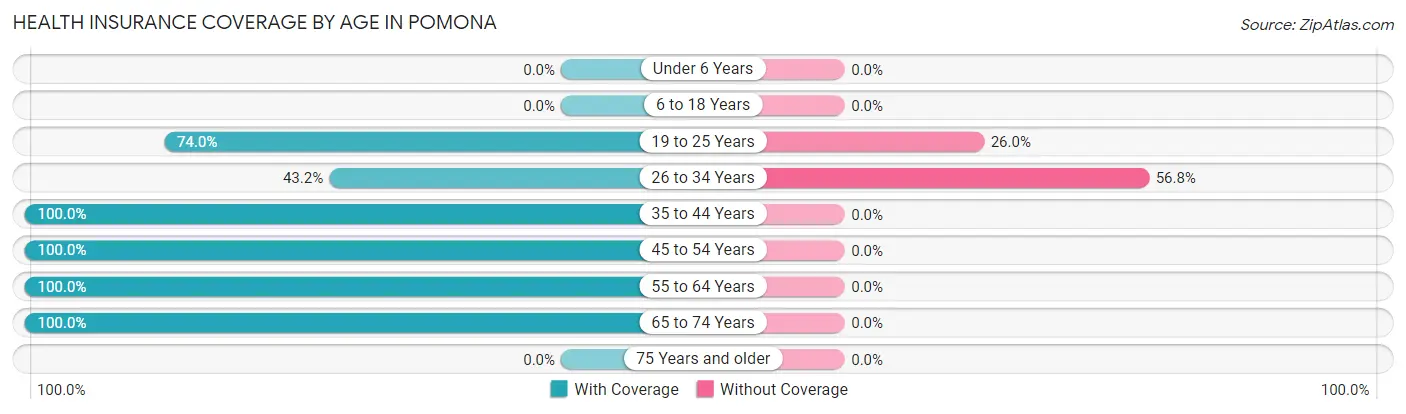
| Age Bracket | With Coverage | Without Coverage |
| Under 6 Years | 0 (0.0%) | 0 (0.0%) |
| 6 to 18 Years | 0 (0.0%) | 0 (0.0%) |
| 19 to 25 Years | 37 (74.0%) | 13 (26.0%) |
| 26 to 34 Years | 16 (43.2%) | 21 (56.8%) |
| 35 to 44 Years | 9 (100.0%) | 0 (0.0%) |
| 45 to 54 Years | 30 (100.0%) | 0 (0.0%) |
| 55 to 64 Years | 120 (100.0%) | 0 (0.0%) |
| 65 to 74 Years | 13 (100.0%) | 0 (0.0%) |
| 75 Years and older | 0 (0.0%) | 0 (0.0%) |
| Total | 225 (86.9%) | 34 (13.1%) |
Health Insurance Coverage by Citizenship Status in Pomona
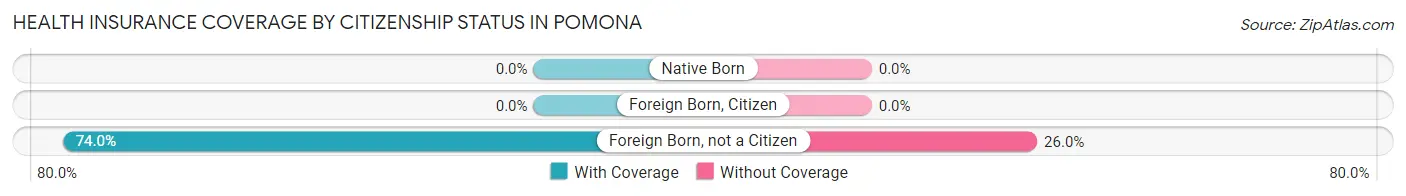
| Citizenship Status | With Coverage | Without Coverage |
| Native Born | 0 (0.0%) | 0 (0.0%) |
| Foreign Born, Citizen | 0 (0.0%) | 0 (0.0%) |
| Foreign Born, not a Citizen | 37 (74.0%) | 13 (26.0%) |
Health Insurance Coverage by Household Income in Pomona
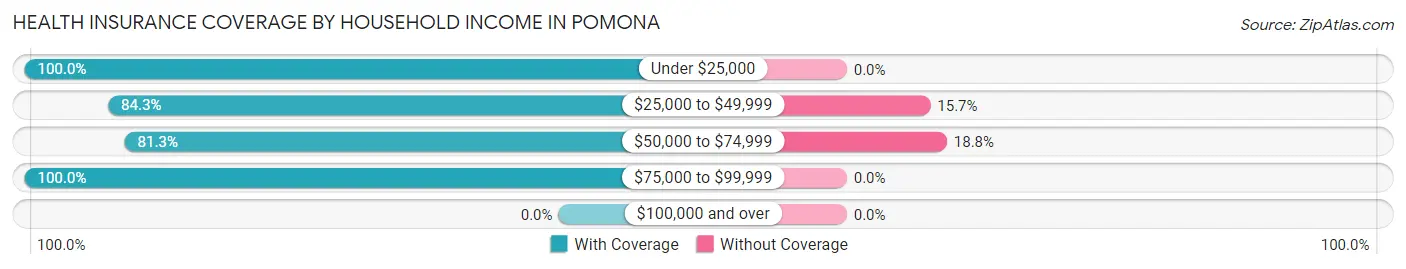
| Household Income | With Coverage | Without Coverage |
| Under $25,000 | 40 (100.0%) | 0 (0.0%) |
| $25,000 to $49,999 | 70 (84.3%) | 13 (15.7%) |
| $50,000 to $74,999 | 91 (81.2%) | 21 (18.8%) |
| $75,000 to $99,999 | 24 (100.0%) | 0 (0.0%) |
| $100,000 and over | 0 (0.0%) | 0 (0.0%) |
Public vs Private Health Insurance Coverage by Age in Pomona
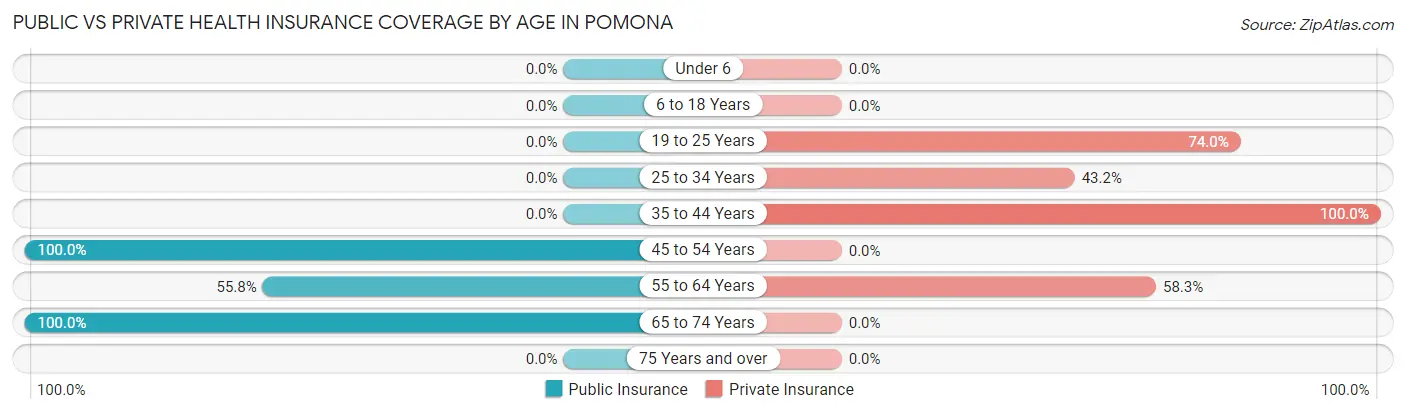
| Age Bracket | Public Insurance | Private Insurance |
| Under 6 | 0 (0.0%) | 0 (0.0%) |
| 6 to 18 Years | 0 (0.0%) | 0 (0.0%) |
| 19 to 25 Years | 0 (0.0%) | 37 (74.0%) |
| 25 to 34 Years | 0 (0.0%) | 16 (43.2%) |
| 35 to 44 Years | 0 (0.0%) | 9 (100.0%) |
| 45 to 54 Years | 30 (100.0%) | 0 (0.0%) |
| 55 to 64 Years | 67 (55.8%) | 70 (58.3%) |
| 65 to 74 Years | 13 (100.0%) | 0 (0.0%) |
| 75 Years and over | 0 (0.0%) | 0 (0.0%) |
| Total | 110 (42.5%) | 132 (51.0%) |
Disability Status by Sex by Age in Pomona
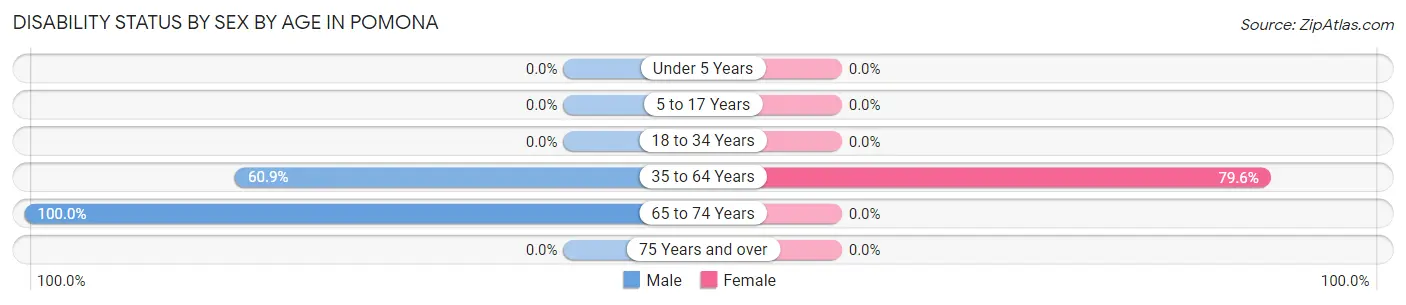
| Age Bracket | Male | Female |
| Under 5 Years | 0 (0.0%) | 0 (0.0%) |
| 5 to 17 Years | 0 (0.0%) | 0 (0.0%) |
| 18 to 34 Years | 0 (0.0%) | 0 (0.0%) |
| 35 to 64 Years | 67 (60.9%) | 39 (79.6%) |
| 65 to 74 Years | 13 (100.0%) | 0 (0.0%) |
| 75 Years and over | 0 (0.0%) | 0 (0.0%) |
Disability Class by Sex by Age in Pomona
Disability Class: Hearing Difficulty
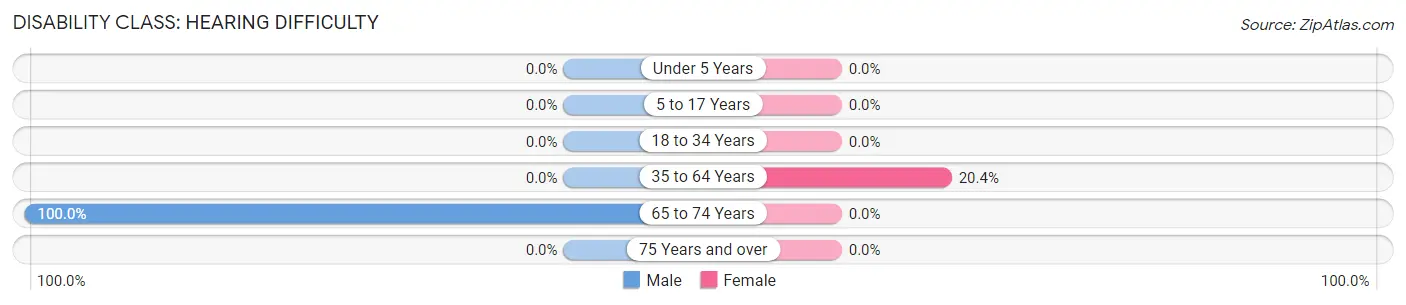
| Age Bracket | Male | Female |
| Under 5 Years | 0 (0.0%) | 0 (0.0%) |
| 5 to 17 Years | 0 (0.0%) | 0 (0.0%) |
| 18 to 34 Years | 0 (0.0%) | 0 (0.0%) |
| 35 to 64 Years | 0 (0.0%) | 10 (20.4%) |
| 65 to 74 Years | 13 (100.0%) | 0 (0.0%) |
| 75 Years and over | 0 (0.0%) | 0 (0.0%) |
Disability Class: Vision Difficulty
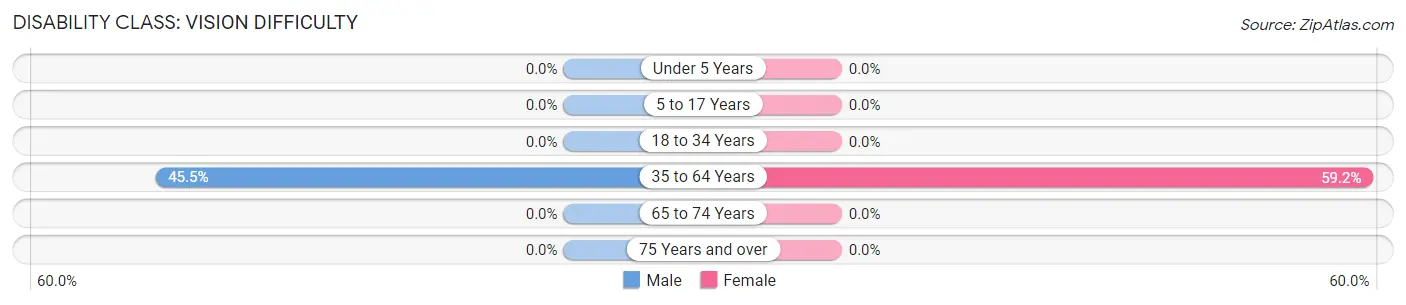
| Age Bracket | Male | Female |
| Under 5 Years | 0 (0.0%) | 0 (0.0%) |
| 5 to 17 Years | 0 (0.0%) | 0 (0.0%) |
| 18 to 34 Years | 0 (0.0%) | 0 (0.0%) |
| 35 to 64 Years | 50 (45.5%) | 29 (59.2%) |
| 65 to 74 Years | 0 (0.0%) | 0 (0.0%) |
| 75 Years and over | 0 (0.0%) | 0 (0.0%) |
Disability Class: Cognitive Difficulty
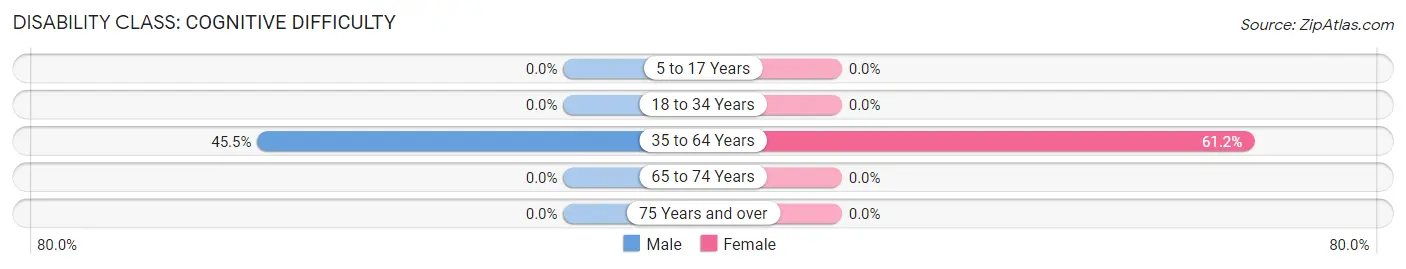
| Age Bracket | Male | Female |
| 5 to 17 Years | 0 (0.0%) | 0 (0.0%) |
| 18 to 34 Years | 0 (0.0%) | 0 (0.0%) |
| 35 to 64 Years | 50 (45.5%) | 30 (61.2%) |
| 65 to 74 Years | 0 (0.0%) | 0 (0.0%) |
| 75 Years and over | 0 (0.0%) | 0 (0.0%) |
Disability Class: Ambulatory Difficulty
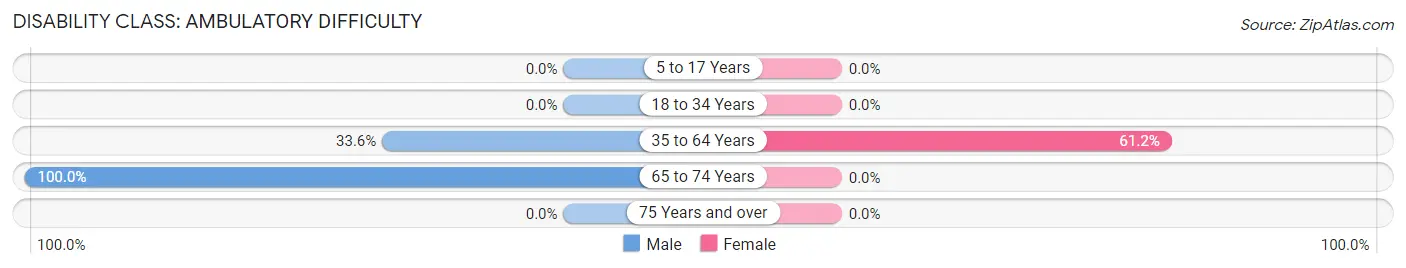
| Age Bracket | Male | Female |
| 5 to 17 Years | 0 (0.0%) | 0 (0.0%) |
| 18 to 34 Years | 0 (0.0%) | 0 (0.0%) |
| 35 to 64 Years | 37 (33.6%) | 30 (61.2%) |
| 65 to 74 Years | 13 (100.0%) | 0 (0.0%) |
| 75 Years and over | 0 (0.0%) | 0 (0.0%) |
Disability Class: Self-Care Difficulty
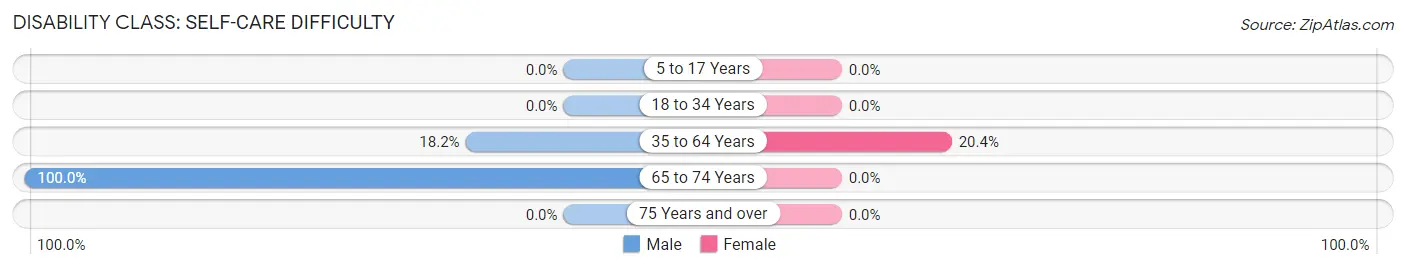
| Age Bracket | Male | Female |
| 5 to 17 Years | 0 (0.0%) | 0 (0.0%) |
| 18 to 34 Years | 0 (0.0%) | 0 (0.0%) |
| 35 to 64 Years | 20 (18.2%) | 10 (20.4%) |
| 65 to 74 Years | 13 (100.0%) | 0 (0.0%) |
| 75 Years and over | 0 (0.0%) | 0 (0.0%) |
Technology Access in Pomona
Computing Device Access in Pomona
| Device Type | # Households | % Households |
| Desktop or Laptop | 35 | 41.2% |
| Smartphone | 72 | 84.7% |
| Tablet | 20 | 23.5% |
| No Computing Device | 13 | 15.3% |
| Total | 85 | 100.0% |
Internet Access in Pomona
| Internet Type | # Households | % Households |
| Dial-Up Internet | 0 | 0.0% |
| Broadband Home | 10 | 11.8% |
| Cellular Data Only | 17 | 20.0% |
| Satellite Internet | 20 | 23.5% |
| No Internet | 22 | 25.9% |
| Total | 85 | 100.0% |
Pomona Summary
Pomona, Missouri is a small town located in the Ozark Mountains of southwest Missouri. It is situated in the foothills of the Ozarks, about 20 miles south of Springfield. The town was founded in 1883 and has a population of approximately 1,000 people.
Geography
Pomona is located in the Ozark Mountains of southwest Missouri. It is situated in the foothills of the Ozarks, about 20 miles south of Springfield. The town is located in the Ozark Plateau, which is characterized by rolling hills and valleys. The town is surrounded by forests and is home to a variety of wildlife, including deer, turkey, and other small game. The town is also home to several creeks and streams, which provide a source of recreation for the locals.
Economy
Pomona’s economy is largely based on agriculture and tourism. The town is home to several farms, which produce a variety of crops, including corn, soybeans, wheat, and hay. The town is also home to several small businesses, including a grocery store, a hardware store, and a few restaurants. Tourism is also an important part of the local economy, as the town is home to several attractions, including a historic courthouse, a museum, and a golf course.
Demographics
As of the 2010 census, the population of Pomona was 1,000 people. The racial makeup of the town was 97.2% White, 0.7% African American, 0.3% Native American, 0.2% Asian, 0.1% Pacific Islander, 0.2% from other races, and 1.3% from two or more races. The median household income was $37,500, and the median family income was $45,000.
History
Pomona was founded in 1883 by a group of settlers from the nearby town of Springfield. The town was named after the Roman goddess of fruit, Pomona. The town quickly grew and became a popular destination for tourists, as it was located in the foothills of the Ozarks. The town was also home to several businesses, including a hotel, a general store, and a post office.
In the early 1900s, the town was home to several churches, a school, and a library. The town also had a thriving agricultural industry, with several farms producing a variety of crops. The town was also home to several small businesses, including a grocery store, a hardware store, and a few restaurants.
In the late 20th century, the town began to decline as the local economy shifted away from agriculture and towards tourism. The town is now home to several attractions, including a historic courthouse, a museum, and a golf course. The town is also home to several small businesses, including a grocery store, a hardware store, and a few restaurants.
Common Questions
What is Per Capita Income in Pomona?
Per Capita income in Pomona is $13,505.
What is Income or Wage Gap in Pomona?
Income or Wage Gap in Pomona is 80.6%.
Women in Pomona earn 19.4 cents for every dollar earned by a man.
What is Inequality or Gini Index in Pomona?
Inequality or Gini Index in Pomona is 0.42.
What is the Total Population of Pomona?
Total Population of Pomona is 259.
What is the Total Male Population of Pomona?
Total Male Population of Pomona is 181.
What is the Total Female Population of Pomona?
Total Female Population of Pomona is 78.
What is the Ratio of Males per 100 Females in Pomona?
There are 232.05 Males per 100 Females in Pomona.
What is the Ratio of Females per 100 Males in Pomona?
There are 43.09 Females per 100 Males in Pomona.
What is the Median Population Age in Pomona?
Median Population Age in Pomona is 56.2 Years.
What is the Average Family Size in Pomona
Average Family Size in Pomona is 3.3 People.
What is the Average Household Size in Pomona
Average Household Size in Pomona is 3.0 People.
How Large is the Labor Force in Pomona?
There are 113 People in the Labor Forcein in Pomona.
What is the Percentage of People in the Labor Force in Pomona?
43.6% of People are in the Labor Force in Pomona.
What is the Unemployment Rate in Pomona?
Unemployment Rate in Pomona is 18.6%.