Spokane, MO Map & Demographics
Spokane Map
Spokane Overview
$29,725
PER CAPITA INCOME
$91,875
AVG FAMILY INCOME
$83,958
AVG HOUSEHOLD INCOME
0.29
INEQUALITY / GINI INDEX
209
TOTAL POPULATION
105
MALE POPULATION
104
FEMALE POPULATION
100.96
MALES / 100 FEMALES
99.05
FEMALES / 100 MALES
45.4
MEDIAN AGE
3.7
AVG FAMILY SIZE
3.1
AVG HOUSEHOLD SIZE
143
LABOR FORCE [ PEOPLE ]
75.3%
PERCENT IN LABOR FORCE
Spokane Zip Codes
Spokane Area Codes
Income in Spokane
Income Overview in Spokane
Per Capita Income in Spokane is $29,725, while median incomes of families and households are $91,875 and $83,958 respectively.
| Characteristic | Number | Measure |
| Per Capita Income | 209 | $29,725 |
| Median Family Income | 52 | $91,875 |
| Mean Family Income | 52 | $100,658 |
| Median Household Income | 68 | $83,958 |
| Mean Household Income | 68 | $78,953 |
| Income Deficit | 52 | $0 |
| Wage / Income Gap (%) | 209 | 0.00% |
| Wage / Income Gap ($) | 209 | 100.00¢ per $1 |
| Gini / Inequality Index | 209 | 0.29 |
Earnings by Sex in Spokane
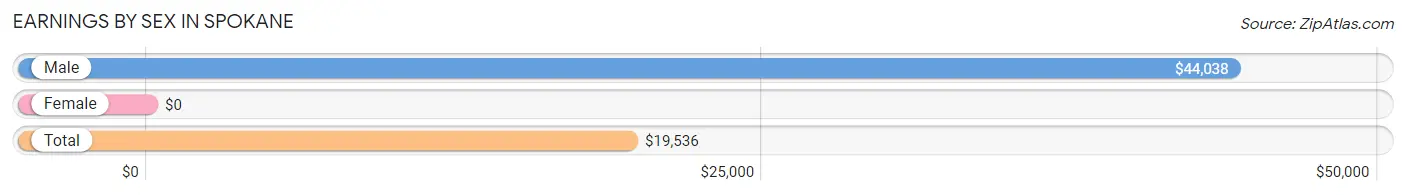
| Sex | Number | Average Earnings |
| Male | 70 (48.9%) | $44,038 |
| Female | 73 (51.0%) | $0 |
| Total | 143 (100.0%) | $19,536 |
Earnings by Sex by Income Bracket in Spokane
The most common earnings brackets in Spokane are $100,000+ for men (19 | 27.1%) and $7,500 to $9,999 for women (39 | 53.4%).
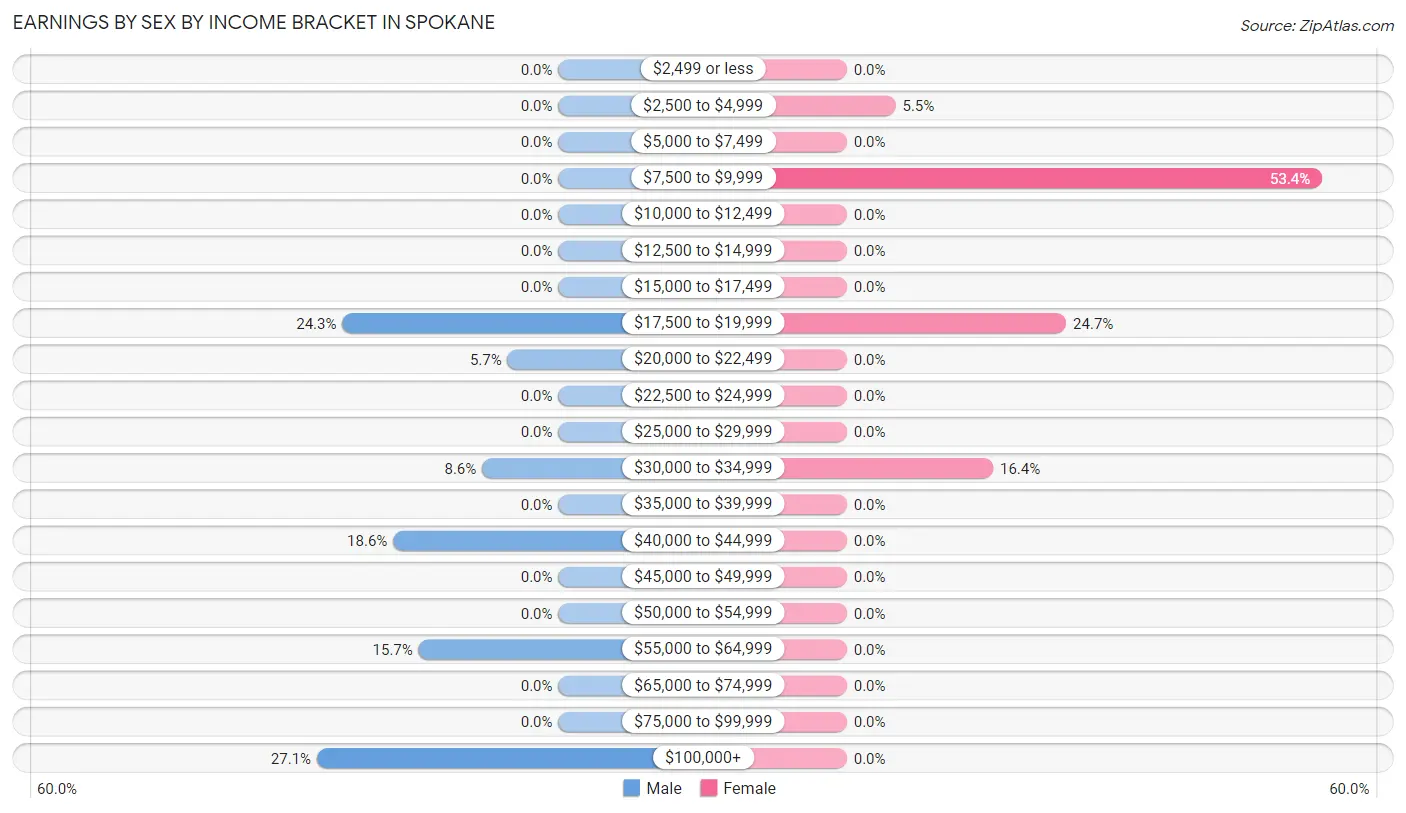
| Income | Male | Female |
| $2,499 or less | 0 (0.0%) | 0 (0.0%) |
| $2,500 to $4,999 | 0 (0.0%) | 4 (5.5%) |
| $5,000 to $7,499 | 0 (0.0%) | 0 (0.0%) |
| $7,500 to $9,999 | 0 (0.0%) | 39 (53.4%) |
| $10,000 to $12,499 | 0 (0.0%) | 0 (0.0%) |
| $12,500 to $14,999 | 0 (0.0%) | 0 (0.0%) |
| $15,000 to $17,499 | 0 (0.0%) | 0 (0.0%) |
| $17,500 to $19,999 | 17 (24.3%) | 18 (24.7%) |
| $20,000 to $22,499 | 4 (5.7%) | 0 (0.0%) |
| $22,500 to $24,999 | 0 (0.0%) | 0 (0.0%) |
| $25,000 to $29,999 | 0 (0.0%) | 0 (0.0%) |
| $30,000 to $34,999 | 6 (8.6%) | 12 (16.4%) |
| $35,000 to $39,999 | 0 (0.0%) | 0 (0.0%) |
| $40,000 to $44,999 | 13 (18.6%) | 0 (0.0%) |
| $45,000 to $49,999 | 0 (0.0%) | 0 (0.0%) |
| $50,000 to $54,999 | 0 (0.0%) | 0 (0.0%) |
| $55,000 to $64,999 | 11 (15.7%) | 0 (0.0%) |
| $65,000 to $74,999 | 0 (0.0%) | 0 (0.0%) |
| $75,000 to $99,999 | 0 (0.0%) | 0 (0.0%) |
| $100,000+ | 19 (27.1%) | 0 (0.0%) |
| Total | 70 (100.0%) | 73 (100.0%) |
Earnings by Sex by Educational Attainment in Spokane
| Educational Attainment | Male Income | Female Income |
| Less than High School | - | - |
| High School Diploma | - | - |
| College or Associate's Degree | - | - |
| Bachelor's Degree | - | - |
| Graduate Degree | - | - |
| Total | - | - |
Family Income in Spokane
Family Income Brackets in Spokane
According to the Spokane family income data, there are 27 families falling into the $75,000 to $99,999 income range, which is the most common income bracket and makes up 51.9% of all families.
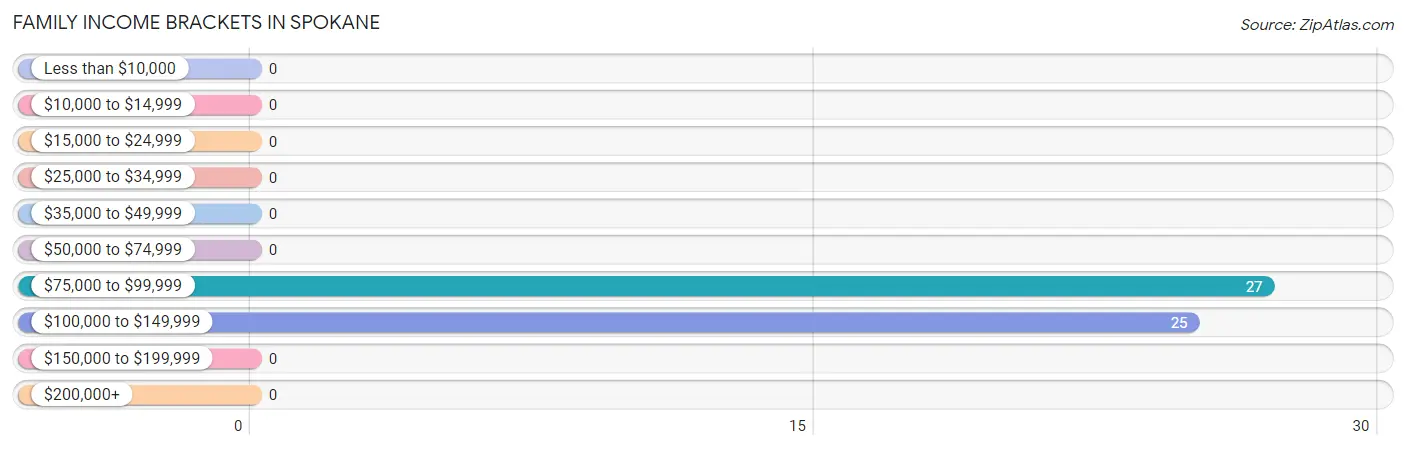
| Income Bracket | # Families | % Families |
| Less than $10,000 | 0 | 0.0% |
| $10,000 to $14,999 | 0 | 0.0% |
| $15,000 to $24,999 | 0 | 0.0% |
| $25,000 to $34,999 | 0 | 0.0% |
| $35,000 to $49,999 | 0 | 0.0% |
| $50,000 to $74,999 | 0 | 0.0% |
| $75,000 to $99,999 | 27 | 51.9% |
| $100,000 to $149,999 | 25 | 48.1% |
| $150,000 to $199,999 | 0 | 0.0% |
| $200,000+ | 0 | 0.0% |
Family Income by Famaliy Size in Spokane
3-person families (48 | 92.3%) account for the highest median family income in Spokane with $113,125 per family, while 3-person families (48 | 92.3%) have the highest median income of $37,708 per family member.
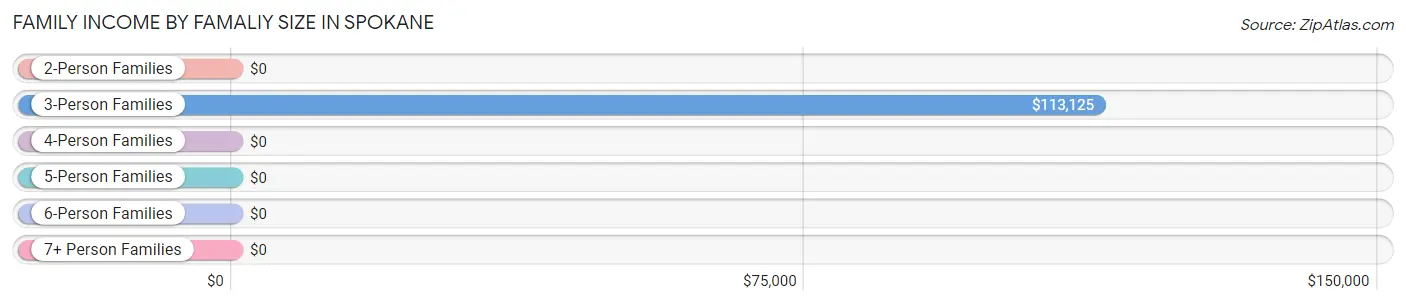
| Income Bracket | # Families | Median Income |
| 2-Person Families | 0 (0.0%) | $0 |
| 3-Person Families | 48 (92.3%) | $113,125 |
| 4-Person Families | 4 (7.7%) | $0 |
| 5-Person Families | 0 (0.0%) | $0 |
| 6-Person Families | 0 (0.0%) | $0 |
| 7+ Person Families | 0 (0.0%) | $0 |
| Total | 52 (100.0%) | $91,875 |
Family Income by Number of Earners in Spokane
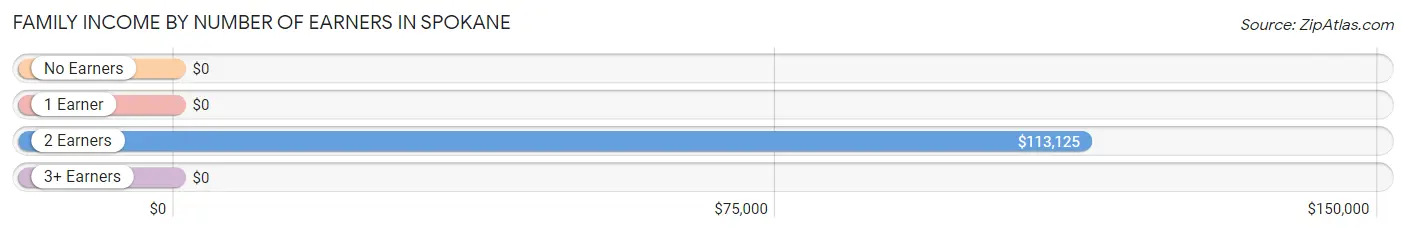
| Number of Earners | # Families | Median Income |
| No Earners | 0 (0.0%) | $0 |
| 1 Earner | 0 (0.0%) | $0 |
| 2 Earners | 48 (92.3%) | $113,125 |
| 3+ Earners | 4 (7.7%) | $0 |
| Total | 52 (100.0%) | $91,875 |
Household Income in Spokane
Household Income Brackets in Spokane
With 27 households falling in the category, the $75,000 to $99,999 income range is the most frequent in Spokane, accounting for 39.7% of all households.
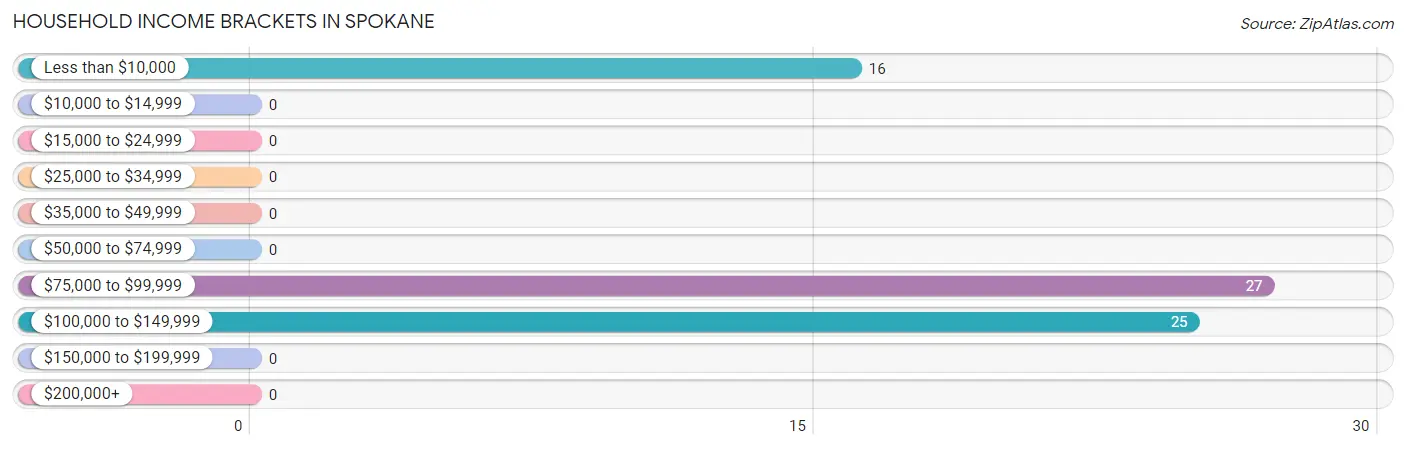
| Income Bracket | # Households | % Households |
| Less than $10,000 | 16 | 23.5% |
| $10,000 to $14,999 | 0 | 0.0% |
| $15,000 to $24,999 | 0 | 0.0% |
| $25,000 to $34,999 | 0 | 0.0% |
| $35,000 to $49,999 | 0 | 0.0% |
| $50,000 to $74,999 | 0 | 0.0% |
| $75,000 to $99,999 | 27 | 39.7% |
| $100,000 to $149,999 | 25 | 36.8% |
| $150,000 to $199,999 | 0 | 0.0% |
| $200,000+ | 0 | 0.0% |
Household Income by Householder Age in Spokane
The median household income in Spokane is $83,958, with the highest median household income of $120,298 found in the 45 to 64 years age bracket for the primary householder. A total of 37 households (54.4%) fall into this category.
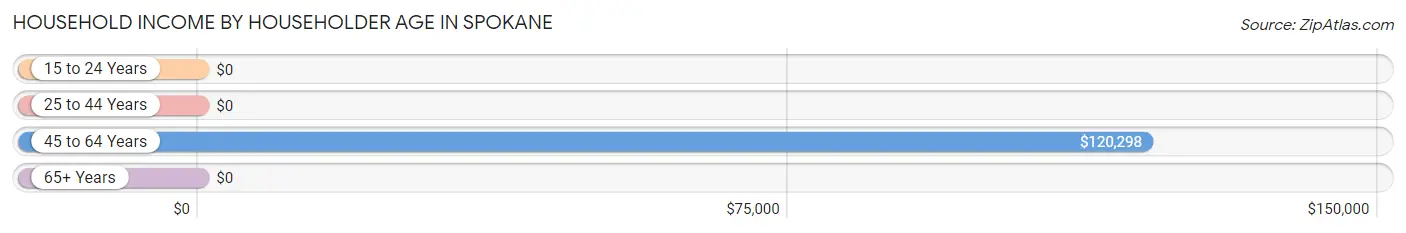
| Income Bracket | # Households | Median Income |
| 15 to 24 Years | 0 (0.0%) | $0 |
| 25 to 44 Years | 0 (0.0%) | $0 |
| 45 to 64 Years | 37 (54.4%) | $120,298 |
| 65+ Years | 31 (45.6%) | $0 |
| Total | 68 (100.0%) | $83,958 |
Poverty in Spokane
Income Below Poverty by Sex and Age in Spokane
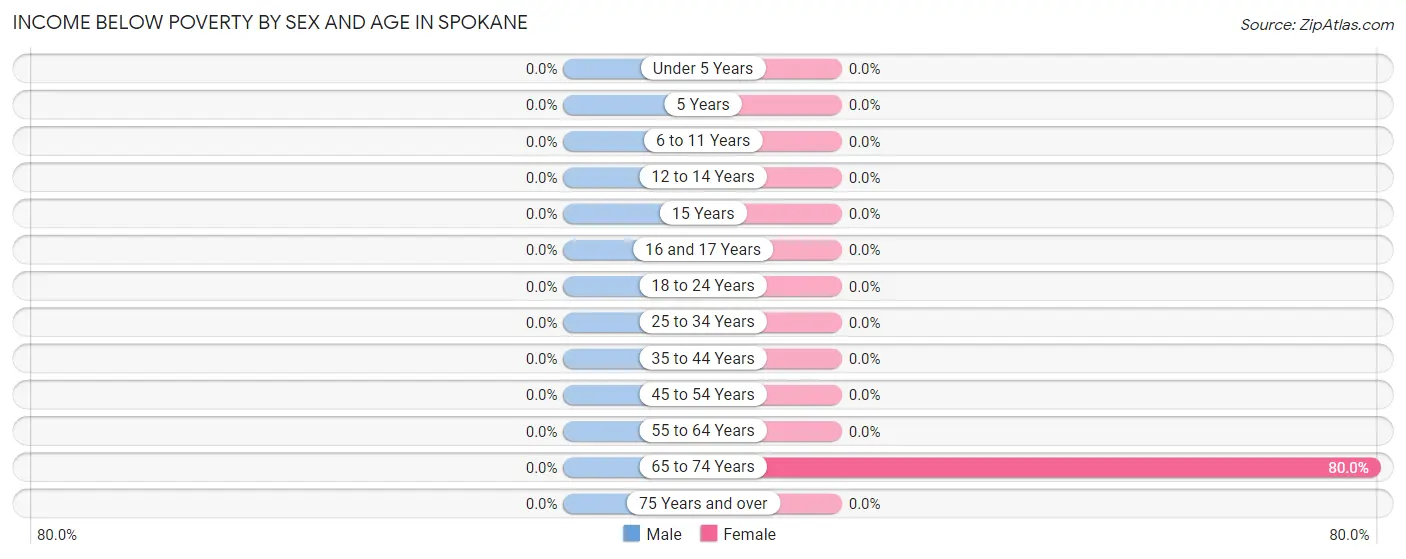
| Age Bracket | Male | Female |
| Under 5 Years | 0 (0.0%) | 0 (0.0%) |
| 5 Years | 0 (0.0%) | 0 (0.0%) |
| 6 to 11 Years | 0 (0.0%) | 0 (0.0%) |
| 12 to 14 Years | 0 (0.0%) | 0 (0.0%) |
| 15 Years | 0 (0.0%) | 0 (0.0%) |
| 16 and 17 Years | 0 (0.0%) | 0 (0.0%) |
| 18 to 24 Years | 0 (0.0%) | 0 (0.0%) |
| 25 to 34 Years | 0 (0.0%) | 0 (0.0%) |
| 35 to 44 Years | 0 (0.0%) | 0 (0.0%) |
| 45 to 54 Years | 0 (0.0%) | 0 (0.0%) |
| 55 to 64 Years | 0 (0.0%) | 0 (0.0%) |
| 65 to 74 Years | 0 (0.0%) | 16 (80.0%) |
| 75 Years and over | 0 (0.0%) | 0 (0.0%) |
| Total | 0 (0.0%) | 16 (15.4%) |
Income Above Poverty by Sex and Age in Spokane
According to the poverty statistics in Spokane, males aged 12 to 14 years and females aged 25 to 34 years are the age groups that are most secure financially, with 100.0% of males and 100.0% of females in these age groups living above the poverty line.
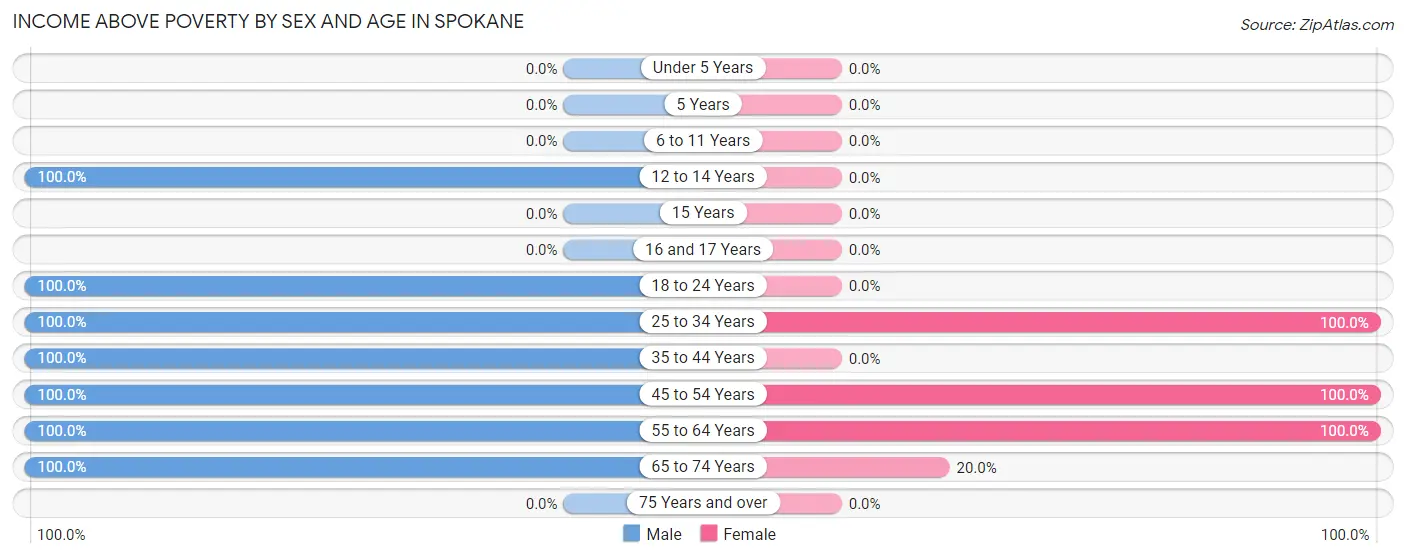
| Age Bracket | Male | Female |
| Under 5 Years | 0 (0.0%) | 0 (0.0%) |
| 5 Years | 0 (0.0%) | 0 (0.0%) |
| 6 to 11 Years | 0 (0.0%) | 0 (0.0%) |
| 12 to 14 Years | 19 (100.0%) | 0 (0.0%) |
| 15 Years | 0 (0.0%) | 0 (0.0%) |
| 16 and 17 Years | 0 (0.0%) | 0 (0.0%) |
| 18 to 24 Years | 6 (100.0%) | 0 (0.0%) |
| 25 to 34 Years | 13 (100.0%) | 48 (100.0%) |
| 35 to 44 Years | 17 (100.0%) | 0 (0.0%) |
| 45 to 54 Years | 23 (100.0%) | 25 (100.0%) |
| 55 to 64 Years | 16 (100.0%) | 11 (100.0%) |
| 65 to 74 Years | 11 (100.0%) | 4 (20.0%) |
| 75 Years and over | 0 (0.0%) | 0 (0.0%) |
| Total | 105 (100.0%) | 88 (84.6%) |
Income Below Poverty Among Married-Couple Families in Spokane
| Children | Above Poverty | Below Poverty |
| No Children | 19 (100.0%) | 0 (0.0%) |
| 1 or 2 Children | 21 (100.0%) | 0 (0.0%) |
| 3 or 4 Children | 0 (0.0%) | 0 (0.0%) |
| 5 or more Children | 0 (0.0%) | 0 (0.0%) |
| Total | 40 (100.0%) | 0 (0.0%) |
Income Below Poverty Among Single-Parent Households in Spokane
| Children | Single Father | Single Mother |
| No Children | 0 (0.0%) | 0 (0.0%) |
| 1 or 2 Children | 0 (0.0%) | 0 (0.0%) |
| 3 or 4 Children | 0 (0.0%) | 0 (0.0%) |
| 5 or more Children | 0 (0.0%) | 0 (0.0%) |
| Total | 0 (0.0%) | 0 (0.0%) |
Income Below Poverty Among Married-Couple vs Single-Parent Households in Spokane
| Children | Married-Couple Families | Single-Parent Households |
| No Children | 0 (0.0%) | 0 (0.0%) |
| 1 or 2 Children | 0 (0.0%) | 0 (0.0%) |
| 3 or 4 Children | 0 (0.0%) | 0 (0.0%) |
| 5 or more Children | 0 (0.0%) | 0 (0.0%) |
| Total | 0 (0.0%) | 0 (0.0%) |
Race in Spokane
The most populous races in Spokane are White / Caucasian (199 | 95.2%), Hispanic or Latino (10 | 4.8%), and Two or more Races (6 | 2.9%).
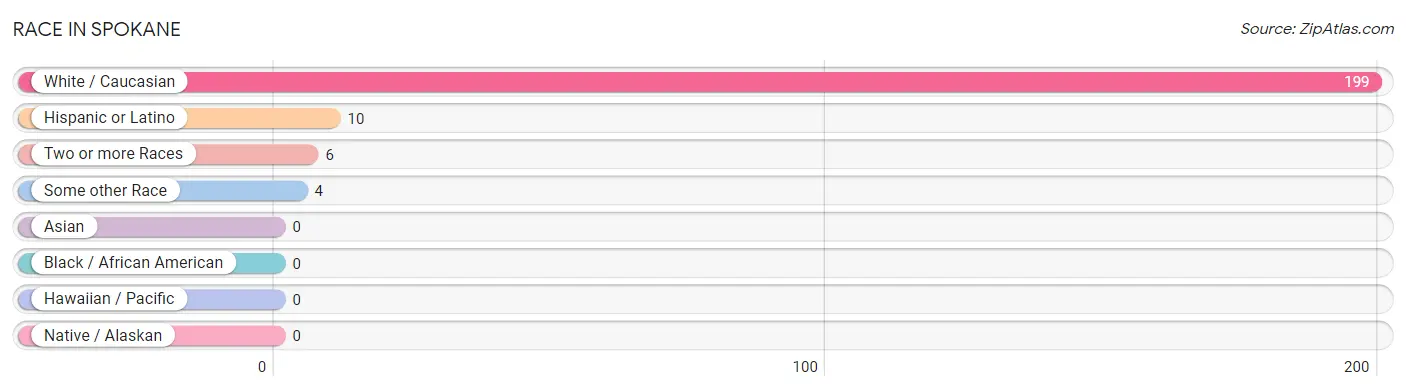
| Race | # Population | % Population |
| Asian | 0 | 0.0% |
| Black / African American | 0 | 0.0% |
| Hawaiian / Pacific | 0 | 0.0% |
| Hispanic or Latino | 10 | 4.8% |
| Native / Alaskan | 0 | 0.0% |
| White / Caucasian | 199 | 95.2% |
| Two or more Races | 6 | 2.9% |
| Some other Race | 4 | 1.9% |
| Total | 209 | 100.0% |
Ancestry in Spokane
The most populous ancestries reported in Spokane are German (38 | 18.2%), Scottish (30 | 14.3%), American (29 | 13.9%), English (18 | 8.6%), and French (18 | 8.6%), together accounting for 63.6% of all Spokane residents.
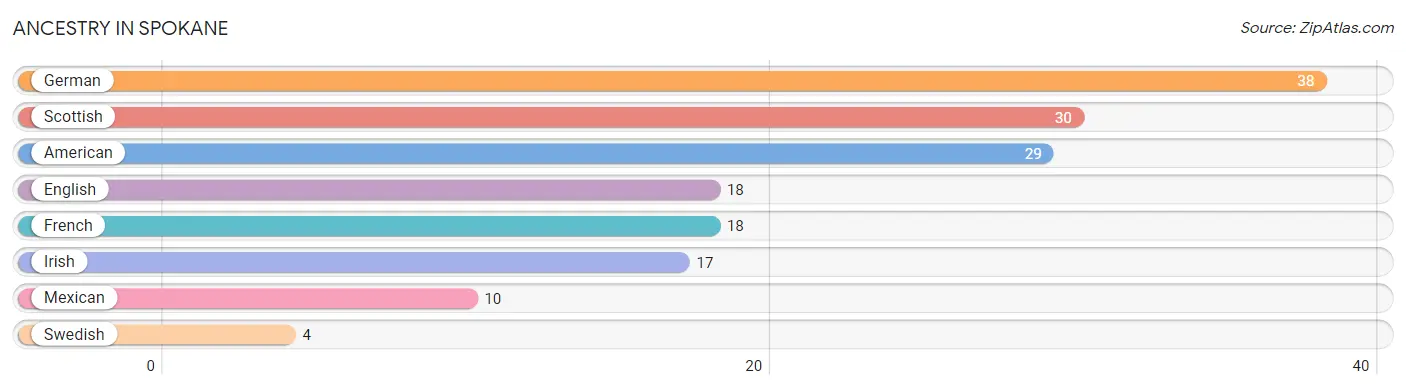
| Ancestry | # Population | % Population |
| American | 29 | 13.9% |
| English | 18 | 8.6% |
| French | 18 | 8.6% |
| German | 38 | 18.2% |
| Irish | 17 | 8.1% |
| Mexican | 10 | 4.8% |
| Scottish | 30 | 14.3% |
| Swedish | 4 | 1.9% | View All 8 Rows |
Immigrants in Spokane

| Immigration Origin | # Population | % Population | View All 0 Rows |
Sex and Age in Spokane
Sex and Age in Spokane
The most populous age groups in Spokane are 10 to 14 Years (19 | 18.1%) for men and 25 to 29 Years (48 | 46.2%) for women.
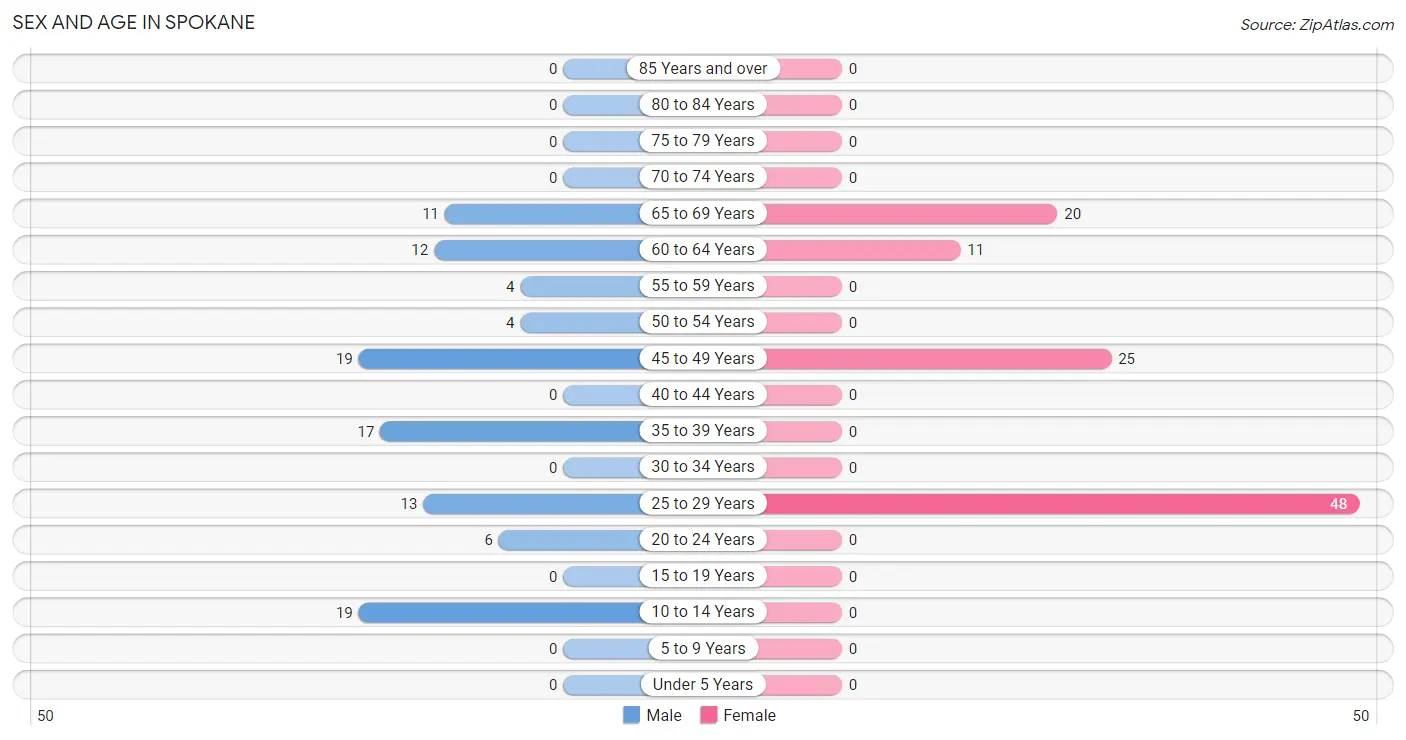
| Age Bracket | Male | Female |
| Under 5 Years | 0 (0.0%) | 0 (0.0%) |
| 5 to 9 Years | 0 (0.0%) | 0 (0.0%) |
| 10 to 14 Years | 19 (18.1%) | 0 (0.0%) |
| 15 to 19 Years | 0 (0.0%) | 0 (0.0%) |
| 20 to 24 Years | 6 (5.7%) | 0 (0.0%) |
| 25 to 29 Years | 13 (12.4%) | 48 (46.2%) |
| 30 to 34 Years | 0 (0.0%) | 0 (0.0%) |
| 35 to 39 Years | 17 (16.2%) | 0 (0.0%) |
| 40 to 44 Years | 0 (0.0%) | 0 (0.0%) |
| 45 to 49 Years | 19 (18.1%) | 25 (24.0%) |
| 50 to 54 Years | 4 (3.8%) | 0 (0.0%) |
| 55 to 59 Years | 4 (3.8%) | 0 (0.0%) |
| 60 to 64 Years | 12 (11.4%) | 11 (10.6%) |
| 65 to 69 Years | 11 (10.5%) | 20 (19.2%) |
| 70 to 74 Years | 0 (0.0%) | 0 (0.0%) |
| 75 to 79 Years | 0 (0.0%) | 0 (0.0%) |
| 80 to 84 Years | 0 (0.0%) | 0 (0.0%) |
| 85 Years and over | 0 (0.0%) | 0 (0.0%) |
| Total | 105 (100.0%) | 104 (100.0%) |
Families and Households in Spokane
Median Family Size in Spokane
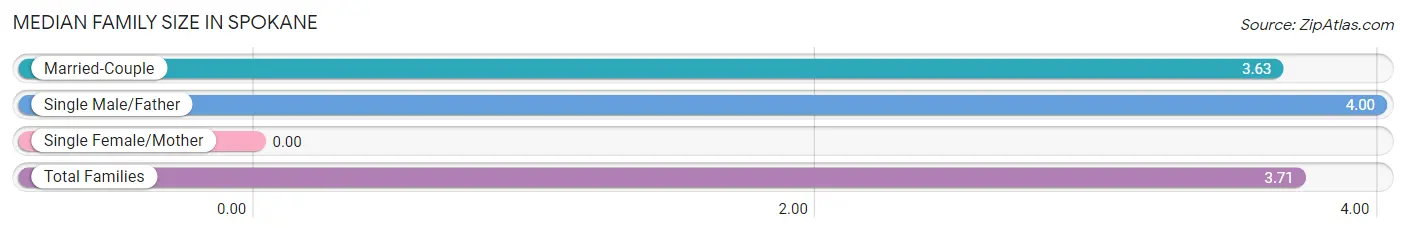
| Family Type | # Families | Family Size |
| Married-Couple | 40 (76.9%) | 3.63 |
| Single Male/Father | 12 (23.1%) | 4.00 |
| Single Female/Mother | 0 (0.0%) | - |
| Total Families | 52 (100.0%) | 3.71 |
Median Household Size in Spokane
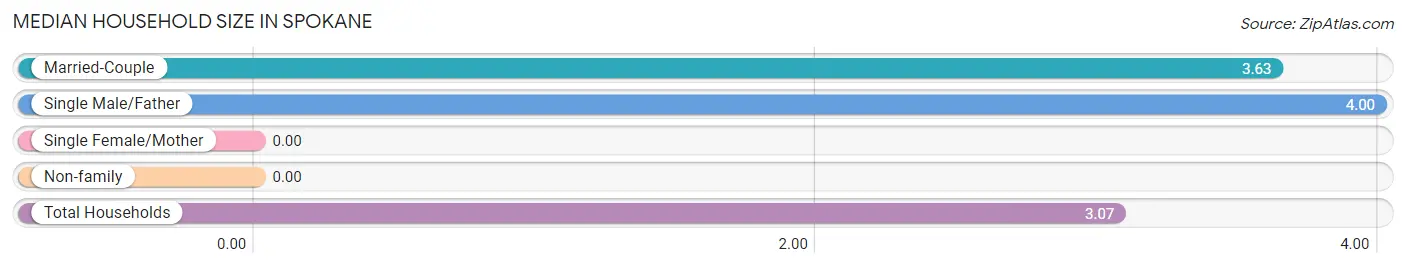
| Household Type | # Households | Household Size |
| Married-Couple | 40 (58.8%) | 3.63 |
| Single Male/Father | 12 (17.6%) | 4.00 |
| Single Female/Mother | 0 (0.0%) | - |
| Non-family | 16 (23.5%) | - |
| Total Households | 68 (100.0%) | 3.07 |
Household Size by Marriage Status in Spokane
Out of a total of 68 households in Spokane, 52 (76.5%) are family households, while 16 (23.5%) are nonfamily households. The most numerous type of family households are 3-person households, comprising 48, and the most common type of nonfamily households are 1-person households, comprising 16.
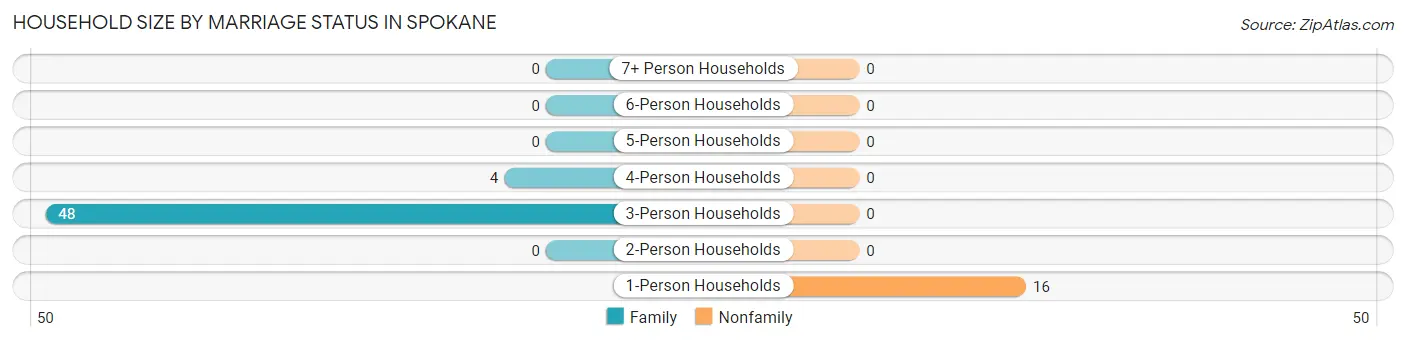
| Household Size | Family Households | Nonfamily Households |
| 1-Person Households | - | 16 (23.5%) |
| 2-Person Households | 0 (0.0%) | 0 (0.0%) |
| 3-Person Households | 48 (70.6%) | 0 (0.0%) |
| 4-Person Households | 4 (5.9%) | 0 (0.0%) |
| 5-Person Households | 0 (0.0%) | 0 (0.0%) |
| 6-Person Households | 0 (0.0%) | 0 (0.0%) |
| 7+ Person Households | 0 (0.0%) | 0 (0.0%) |
| Total | 52 (76.5%) | 16 (23.5%) |
Female Fertility in Spokane
Fertility by Age in Spokane
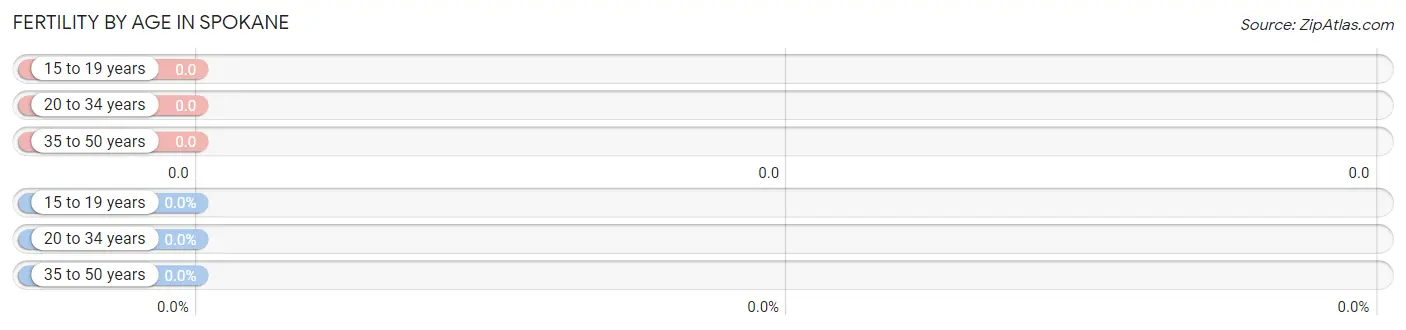
| Age Bracket | Women with Births | Births / 1,000 Women |
| 15 to 19 years | 0 (0.0%) | 0.0 |
| 20 to 34 years | 0 (0.0%) | 0.0 |
| 35 to 50 years | 0 (0.0%) | 0.0 |
| Total | 0 (0.0%) | 0.0 |
Fertility by Age by Marriage Status in Spokane
| Age Bracket | Married | Unmarried |
| 15 to 19 years | 0 (0.0%) | 0 (0.0%) |
| 20 to 34 years | 0 (0.0%) | 0 (0.0%) |
| 35 to 50 years | 0 (0.0%) | 0 (0.0%) |
| Total | 0 (0.0%) | 0 (0.0%) |
Fertility by Education in Spokane
| Educational Attainment | Women with Births | Births / 1,000 Women |
| Less than High School | 0 (0.0%) | 0.0 |
| High School Diploma | 0 (0.0%) | 0.0 |
| College or Associate's Degree | 0 (0.0%) | 0.0 |
| Bachelor's Degree | 0 (0.0%) | 0.0 |
| Graduate Degree | 0 (0.0%) | 0.0 |
| Total | 0 (0.0%) | 0.0 |
Fertility by Education by Marriage Status in Spokane
| Educational Attainment | Married | Unmarried |
| Less than High School | 0 (0.0%) | 0 (0.0%) |
| High School Diploma | 0 (0.0%) | 0 (0.0%) |
| College or Associate's Degree | 0 (0.0%) | 0 (0.0%) |
| Bachelor's Degree | 0 (0.0%) | 0 (0.0%) |
| Graduate Degree | 0 (0.0%) | 0 (0.0%) |
| Total | 0 (0.0%) | 0 (0.0%) |
Employment Characteristics in Spokane
Employment by Class of Employer in Spokane
Among the 139 employed individuals in Spokane, private company employees (106 | 76.3%), and local government employees (33 | 23.7%) make up the most common classes of employment.
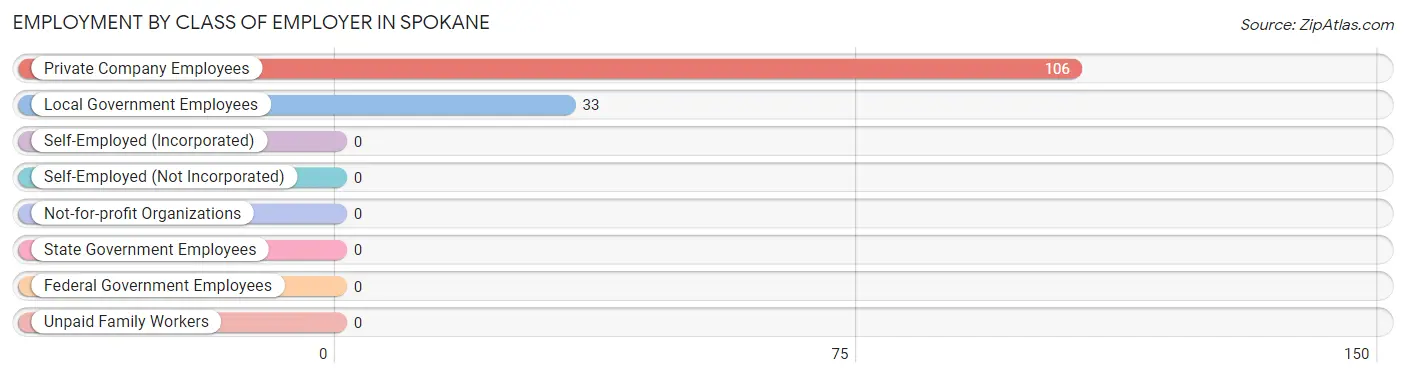
| Employer Class | # Employees | % Employees |
| Private Company Employees | 106 | 76.3% |
| Self-Employed (Incorporated) | 0 | 0.0% |
| Self-Employed (Not Incorporated) | 0 | 0.0% |
| Not-for-profit Organizations | 0 | 0.0% |
| Local Government Employees | 33 | 23.7% |
| State Government Employees | 0 | 0.0% |
| Federal Government Employees | 0 | 0.0% |
| Unpaid Family Workers | 0 | 0.0% |
| Total | 139 | 100.0% |
Employment Status by Age in Spokane
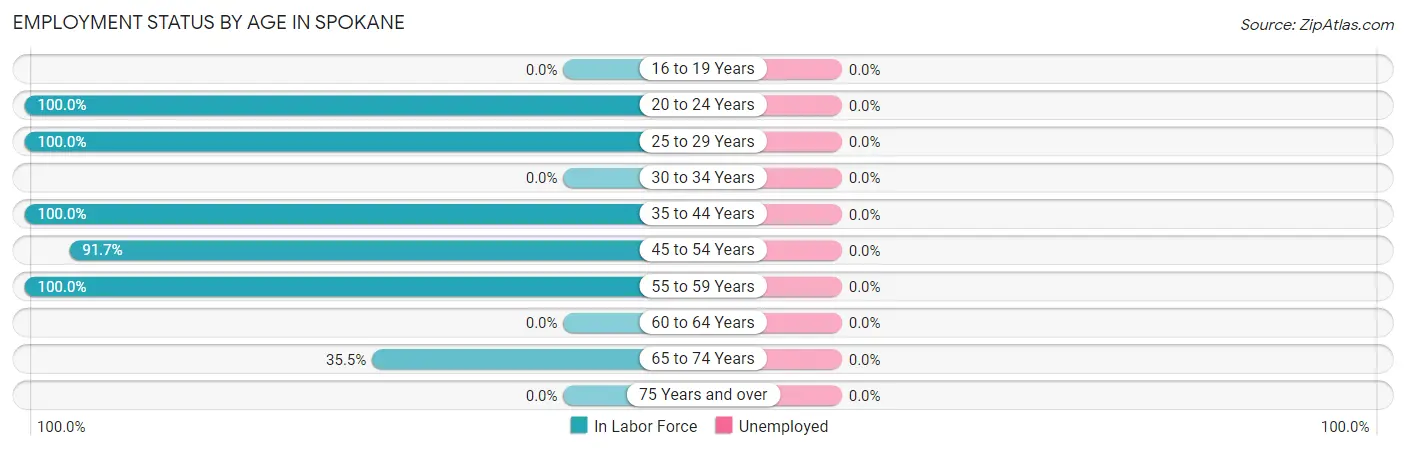
| Age Bracket | In Labor Force | Unemployed |
| 16 to 19 Years | 0 (0.0%) | 0 (0.0%) |
| 20 to 24 Years | 6 (100.0%) | 0 (0.0%) |
| 25 to 29 Years | 61 (100.0%) | 0 (0.0%) |
| 30 to 34 Years | 0 (0.0%) | 0 (0.0%) |
| 35 to 44 Years | 17 (100.0%) | 0 (0.0%) |
| 45 to 54 Years | 44 (91.7%) | 0 (0.0%) |
| 55 to 59 Years | 4 (100.0%) | 0 (0.0%) |
| 60 to 64 Years | 0 (0.0%) | 0 (0.0%) |
| 65 to 74 Years | 11 (35.5%) | 0 (0.0%) |
| 75 Years and over | 0 (0.0%) | 0 (0.0%) |
| Total | 143 (75.3%) | 0 (0.0%) |
Employment Status by Educational Attainment in Spokane
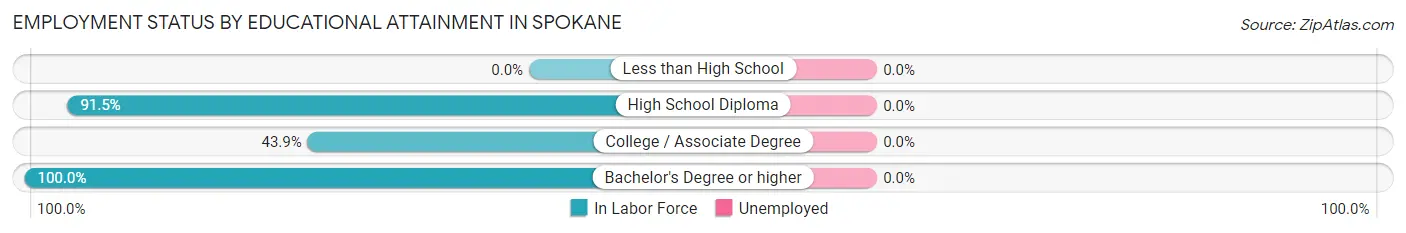
| Educational Attainment | In Labor Force | Unemployed |
| Less than High School | 0 (0.0%) | 0 (0.0%) |
| High School Diploma | 43 (91.5%) | 0 (0.0%) |
| College / Associate Degree | 18 (43.9%) | 0 (0.0%) |
| Bachelor's Degree or higher | 65 (100.0%) | 0 (0.0%) |
| Total | 126 (82.4%) | 0 (0.0%) |
Employment Occupations by Sex in Spokane
Management, Business, Science and Arts Occupations
The most common Management, Business, Science and Arts occupations in Spokane are Community & Social Service (33 | 23.1%), Education Instruction & Library (33 | 23.1%), Business & Financial (19 | 13.3%), Computers, Engineering & Science (13 | 9.1%), and Computers & Mathematics (13 | 9.1%).
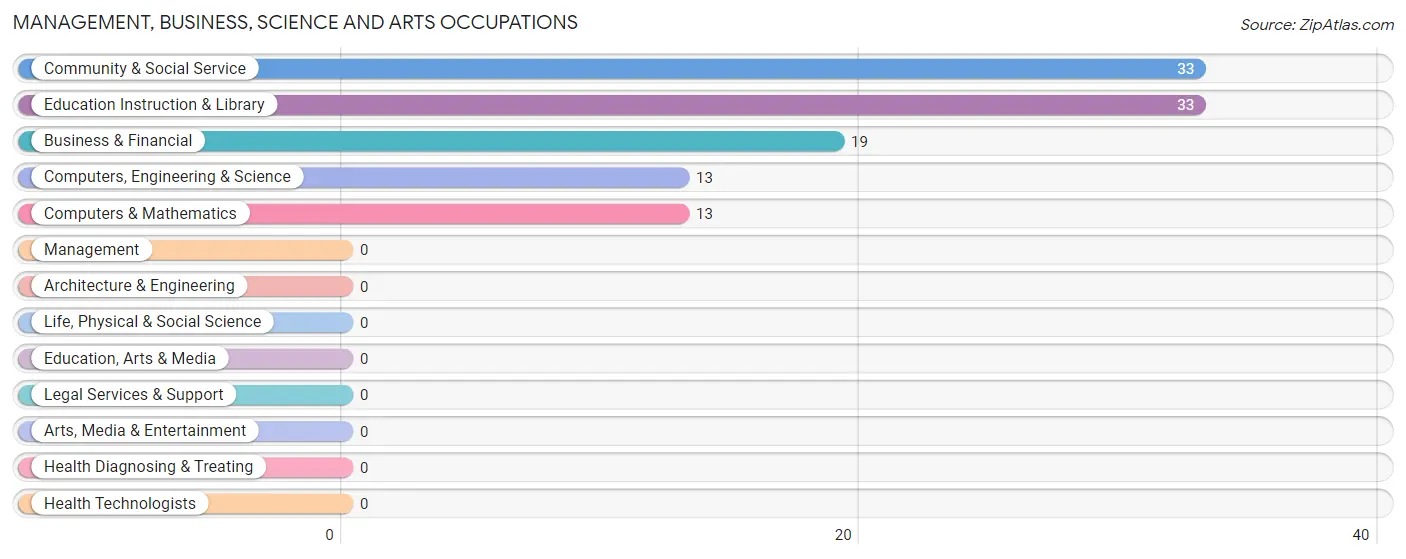
Management, Business, Science and Arts Occupations by Sex
Within the Management, Business, Science and Arts occupations in Spokane, the most male-oriented occupations are Business & Financial (100.0%), Computers, Engineering & Science (100.0%), and Computers & Mathematics (100.0%), while the most female-oriented occupations are Community & Social Service (100.0%), and Education Instruction & Library (100.0%).
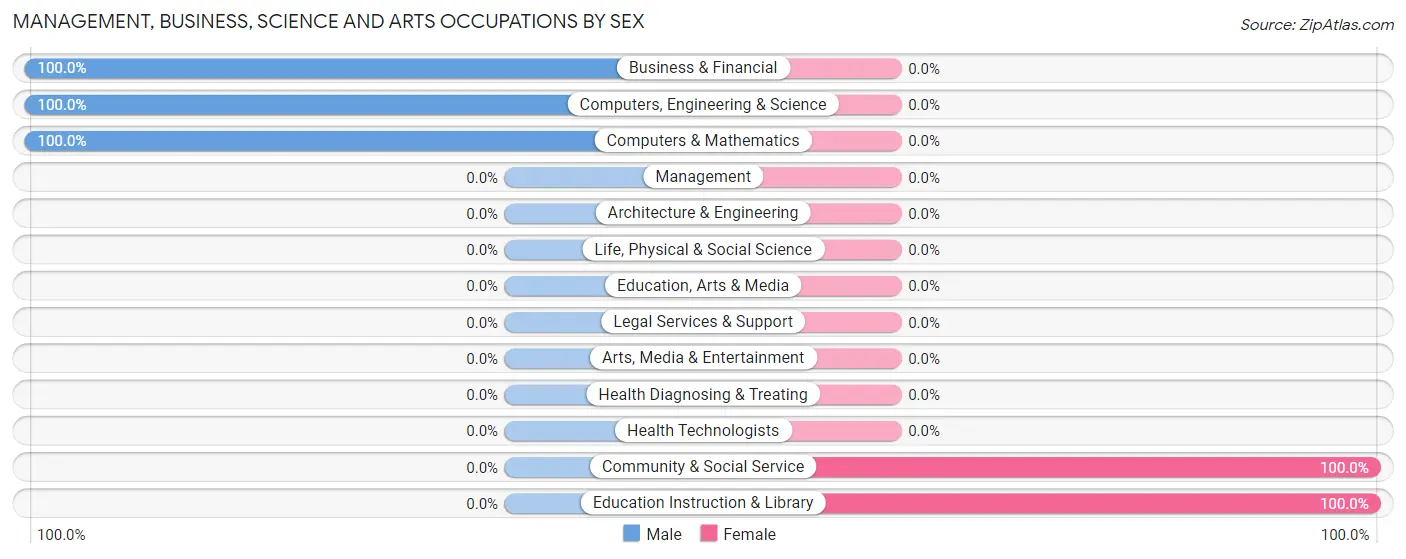
| Occupation | Male | Female |
| Management | 0 (0.0%) | 0 (0.0%) |
| Business & Financial | 19 (100.0%) | 0 (0.0%) |
| Computers, Engineering & Science | 13 (100.0%) | 0 (0.0%) |
| Computers & Mathematics | 13 (100.0%) | 0 (0.0%) |
| Architecture & Engineering | 0 (0.0%) | 0 (0.0%) |
| Life, Physical & Social Science | 0 (0.0%) | 0 (0.0%) |
| Community & Social Service | 0 (0.0%) | 33 (100.0%) |
| Education, Arts & Media | 0 (0.0%) | 0 (0.0%) |
| Legal Services & Support | 0 (0.0%) | 0 (0.0%) |
| Education Instruction & Library | 0 (0.0%) | 33 (100.0%) |
| Arts, Media & Entertainment | 0 (0.0%) | 0 (0.0%) |
| Health Diagnosing & Treating | 0 (0.0%) | 0 (0.0%) |
| Health Technologists | 0 (0.0%) | 0 (0.0%) |
| Total (Category) | 32 (49.2%) | 33 (50.8%) |
| Total (Overall) | 70 (48.9%) | 73 (51.0%) |
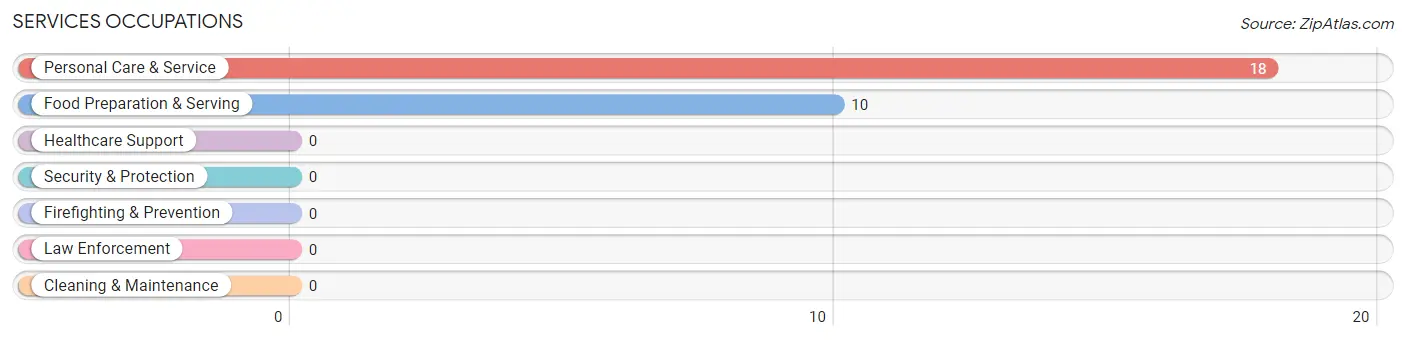
Services Occupations
The most common Services occupations in Spokane are Personal Care & Service (18 | 12.6%), and Food Preparation & Serving (10 | 7.0%).
Services Occupations by Sex
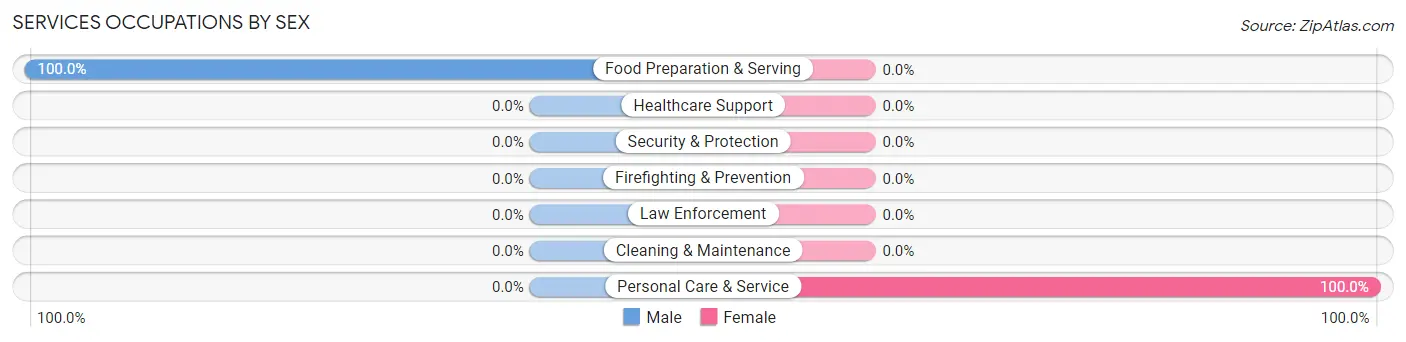
| Occupation | Male | Female |
| Healthcare Support | 0 (0.0%) | 0 (0.0%) |
| Security & Protection | 0 (0.0%) | 0 (0.0%) |
| Firefighting & Prevention | 0 (0.0%) | 0 (0.0%) |
| Law Enforcement | 0 (0.0%) | 0 (0.0%) |
| Food Preparation & Serving | 10 (100.0%) | 0 (0.0%) |
| Cleaning & Maintenance | 0 (0.0%) | 0 (0.0%) |
| Personal Care & Service | 0 (0.0%) | 18 (100.0%) |
| Total (Category) | 10 (35.7%) | 18 (64.3%) |
| Total (Overall) | 70 (48.9%) | 73 (51.0%) |
Sales and Office Occupations
The most common Sales and Office occupations in Spokane are Office & Administration (18 | 12.6%), and Sales & Related (15 | 10.5%).
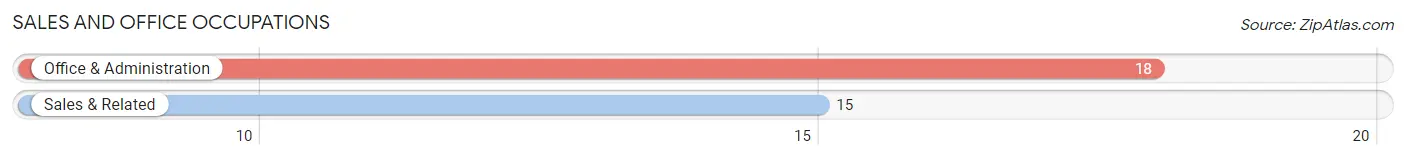
Sales and Office Occupations by Sex
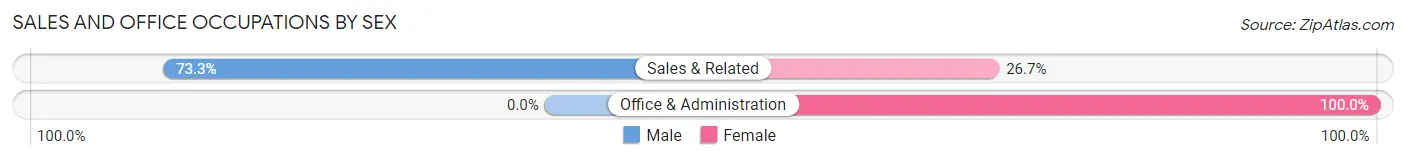
| Occupation | Male | Female |
| Sales & Related | 11 (73.3%) | 4 (26.7%) |
| Office & Administration | 0 (0.0%) | 18 (100.0%) |
| Total (Category) | 11 (33.3%) | 22 (66.7%) |
| Total (Overall) | 70 (48.9%) | 73 (51.0%) |
Natural Resources, Construction and Maintenance Occupations
Natural Resources, Construction and Maintenance Occupations by Sex
| Occupation | Male | Female |
| Farming, Fishing & Forestry | 0 (0.0%) | 0 (0.0%) |
| Construction & Extraction | 0 (0.0%) | 0 (0.0%) |
| Installation, Maintenance & Repair | 0 (0.0%) | 0 (0.0%) |
| Total (Category) | 0 (0.0%) | 0 (0.0%) |
| Total (Overall) | 70 (48.9%) | 73 (51.0%) |
Production, Transportation and Moving Occupations
The most common Production, Transportation and Moving occupations in Spokane are , and Material Moving (17 | 11.9%).
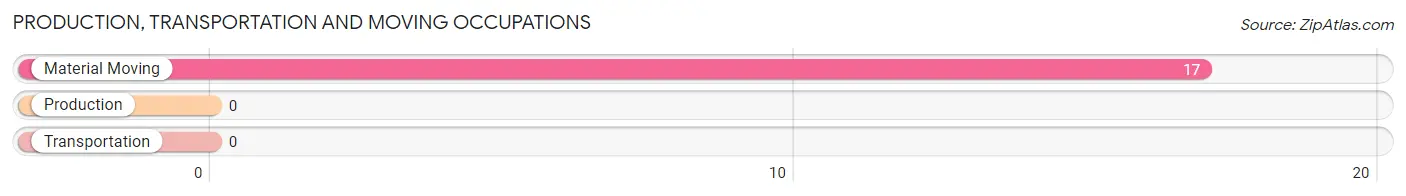
Production, Transportation and Moving Occupations by Sex
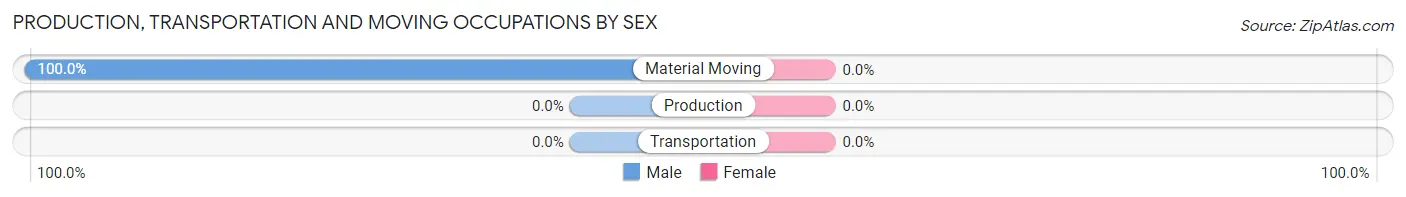
| Occupation | Male | Female |
| Production | 0 (0.0%) | 0 (0.0%) |
| Transportation | 0 (0.0%) | 0 (0.0%) |
| Material Moving | 17 (100.0%) | 0 (0.0%) |
| Total (Category) | 17 (100.0%) | 0 (0.0%) |
| Total (Overall) | 70 (48.9%) | 73 (51.0%) |
Employment Industries by Sex in Spokane
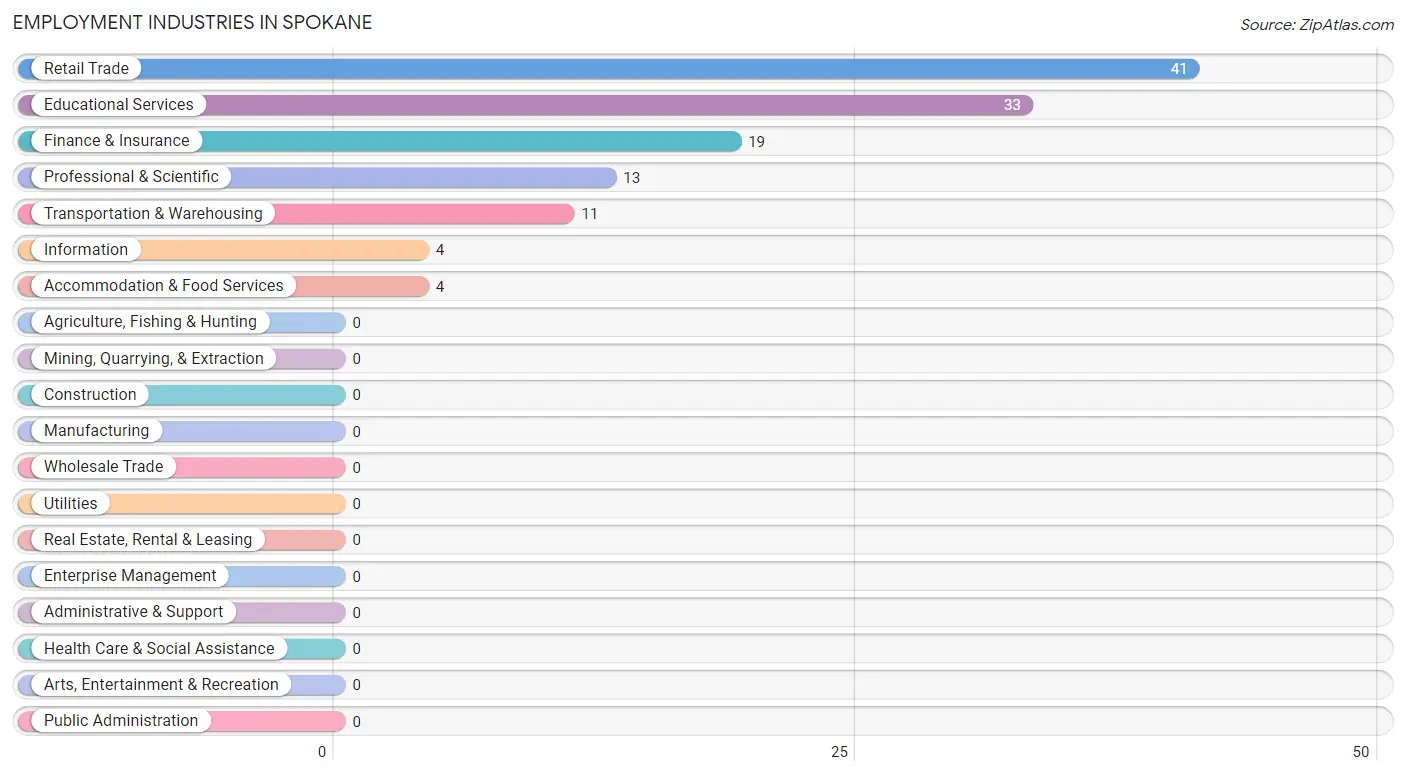
Employment Industries in Spokane
The major employment industries in Spokane include Retail Trade (41 | 28.7%), Educational Services (33 | 23.1%), Finance & Insurance (19 | 13.3%), Professional & Scientific (13 | 9.1%), and Transportation & Warehousing (11 | 7.7%).
Employment Industries by Sex in Spokane
The Spokane industries that see more men than women are Transportation & Warehousing (100.0%), Finance & Insurance (100.0%), and Professional & Scientific (100.0%), whereas the industries that tend to have a higher number of women are Information (100.0%), Educational Services (100.0%), and Retail Trade (43.9%).
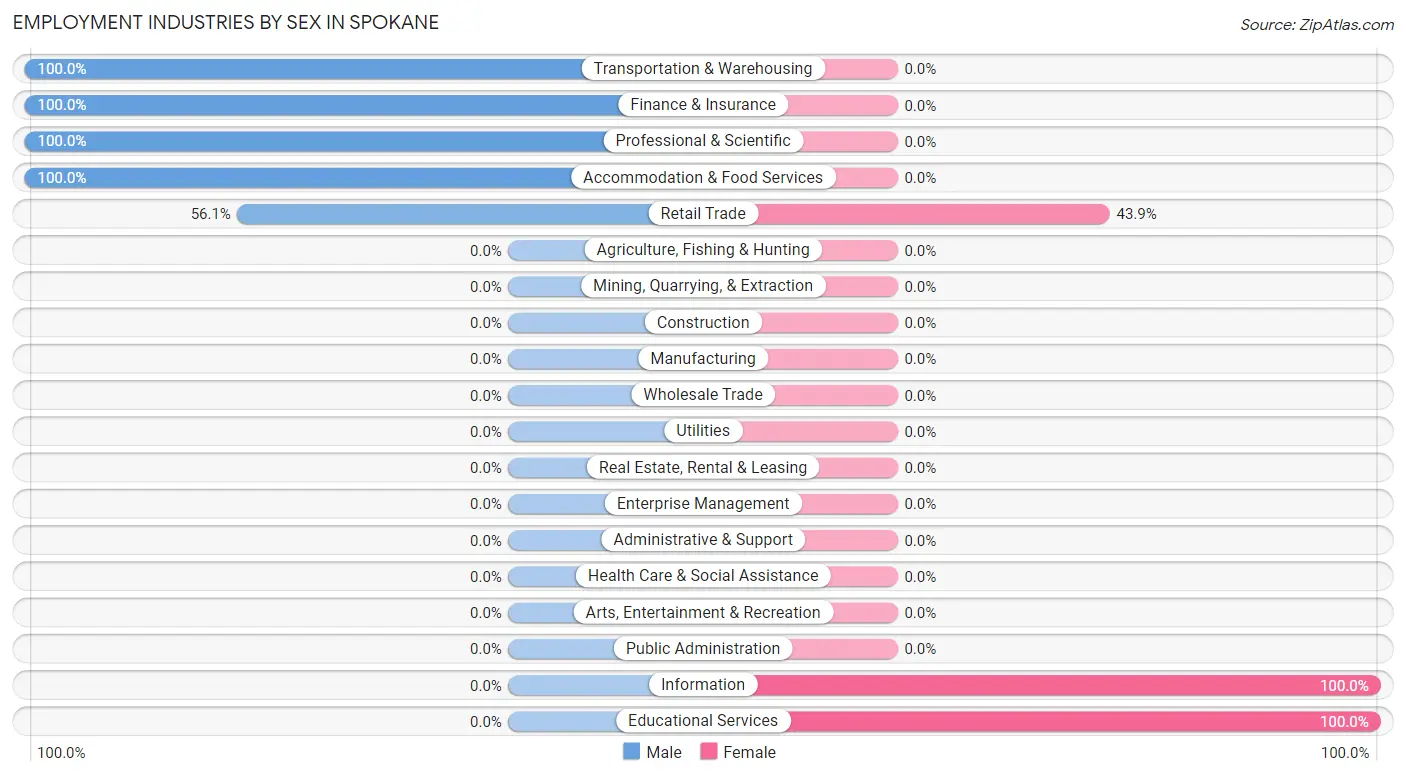
| Industry | Male | Female |
| Agriculture, Fishing & Hunting | 0 (0.0%) | 0 (0.0%) |
| Mining, Quarrying, & Extraction | 0 (0.0%) | 0 (0.0%) |
| Construction | 0 (0.0%) | 0 (0.0%) |
| Manufacturing | 0 (0.0%) | 0 (0.0%) |
| Wholesale Trade | 0 (0.0%) | 0 (0.0%) |
| Retail Trade | 23 (56.1%) | 18 (43.9%) |
| Transportation & Warehousing | 11 (100.0%) | 0 (0.0%) |
| Utilities | 0 (0.0%) | 0 (0.0%) |
| Information | 0 (0.0%) | 4 (100.0%) |
| Finance & Insurance | 19 (100.0%) | 0 (0.0%) |
| Real Estate, Rental & Leasing | 0 (0.0%) | 0 (0.0%) |
| Professional & Scientific | 13 (100.0%) | 0 (0.0%) |
| Enterprise Management | 0 (0.0%) | 0 (0.0%) |
| Administrative & Support | 0 (0.0%) | 0 (0.0%) |
| Educational Services | 0 (0.0%) | 33 (100.0%) |
| Health Care & Social Assistance | 0 (0.0%) | 0 (0.0%) |
| Arts, Entertainment & Recreation | 0 (0.0%) | 0 (0.0%) |
| Accommodation & Food Services | 4 (100.0%) | 0 (0.0%) |
| Public Administration | 0 (0.0%) | 0 (0.0%) |
| Total | 70 (48.9%) | 73 (51.0%) |
Education in Spokane
School Enrollment in Spokane
The most common levels of schooling among the 37 students in Spokane are middle school (19 | 51.3%), and college / undergraduate (18 | 48.6%).
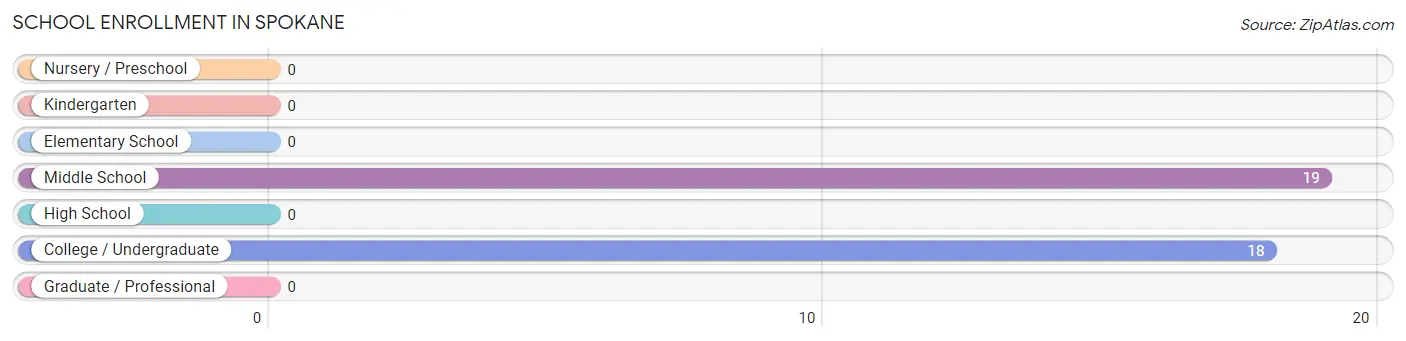
| School Level | # Students | % Students |
| Nursery / Preschool | 0 | 0.0% |
| Kindergarten | 0 | 0.0% |
| Elementary School | 0 | 0.0% |
| Middle School | 19 | 51.3% |
| High School | 0 | 0.0% |
| College / Undergraduate | 18 | 48.6% |
| Graduate / Professional | 0 | 0.0% |
| Total | 37 | 100.0% |
School Enrollment by Age by Funding Source in Spokane
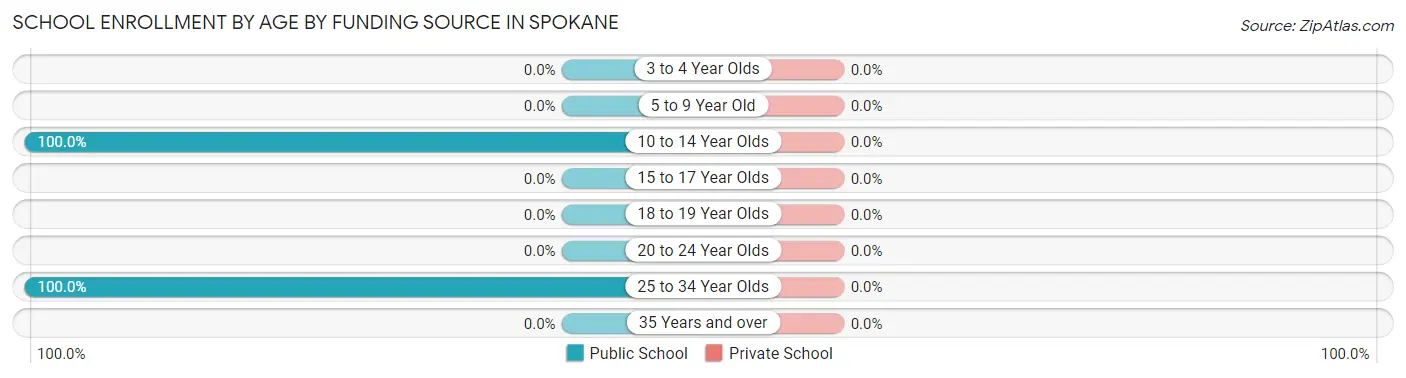
| Age Bracket | Public School | Private School |
| 3 to 4 Year Olds | 0 (0.0%) | 0 (0.0%) |
| 5 to 9 Year Old | 0 (0.0%) | 0 (0.0%) |
| 10 to 14 Year Olds | 19 (100.0%) | 0 (0.0%) |
| 15 to 17 Year Olds | 0 (0.0%) | 0 (0.0%) |
| 18 to 19 Year Olds | 0 (0.0%) | 0 (0.0%) |
| 20 to 24 Year Olds | 0 (0.0%) | 0 (0.0%) |
| 25 to 34 Year Olds | 18 (100.0%) | 0 (0.0%) |
| 35 Years and over | 0 (0.0%) | 0 (0.0%) |
| Total | 37 (100.0%) | 0 (0.0%) |
Educational Attainment by Field of Study in Spokane
Social sciences (21 | 32.3%), business (19 | 29.2%), computers & mathematics (13 | 20.0%), and education (12 | 18.5%) are the most common fields of study among 65 individuals in Spokane who have obtained a bachelor's degree or higher.
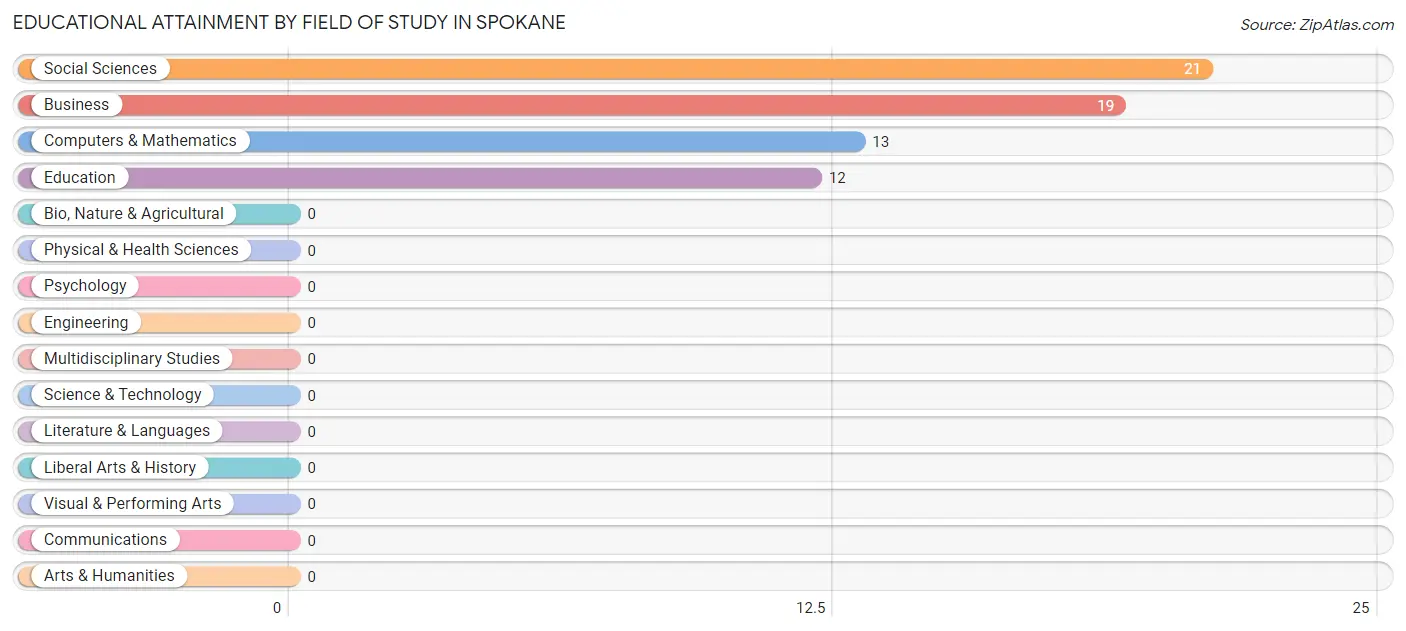
| Field of Study | # Graduates | % Graduates |
| Computers & Mathematics | 13 | 20.0% |
| Bio, Nature & Agricultural | 0 | 0.0% |
| Physical & Health Sciences | 0 | 0.0% |
| Psychology | 0 | 0.0% |
| Social Sciences | 21 | 32.3% |
| Engineering | 0 | 0.0% |
| Multidisciplinary Studies | 0 | 0.0% |
| Science & Technology | 0 | 0.0% |
| Business | 19 | 29.2% |
| Education | 12 | 18.5% |
| Literature & Languages | 0 | 0.0% |
| Liberal Arts & History | 0 | 0.0% |
| Visual & Performing Arts | 0 | 0.0% |
| Communications | 0 | 0.0% |
| Arts & Humanities | 0 | 0.0% |
| Total | 65 | 100.0% |
Transportation & Commute in Spokane
Vehicle Availability by Sex in Spokane
The most prevalent vehicle ownership categories in Spokane are males with no vehicle (28, accounting for 40.0%) and females with no vehicle (0, making up 40.6%).
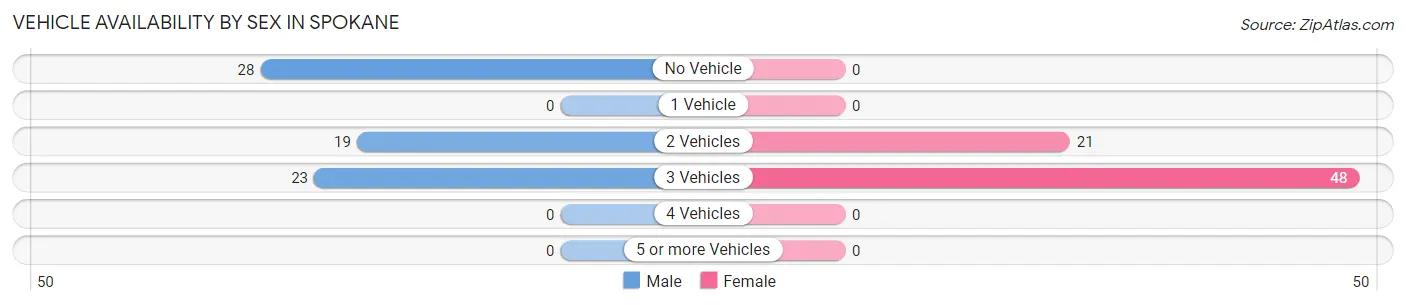
| Vehicles Available | Male | Female |
| No Vehicle | 28 (40.0%) | 0 (0.0%) |
| 1 Vehicle | 0 (0.0%) | 0 (0.0%) |
| 2 Vehicles | 19 (27.1%) | 21 (30.4%) |
| 3 Vehicles | 23 (32.9%) | 48 (69.6%) |
| 4 Vehicles | 0 (0.0%) | 0 (0.0%) |
| 5 or more Vehicles | 0 (0.0%) | 0 (0.0%) |
| Total | 70 (100.0%) | 69 (100.0%) |
Commute Time in Spokane
The most frequently occuring commute durations in Spokane are 30 to 34 minutes (64 commuters, 46.0%), 20 to 24 minutes (42 commuters, 30.2%), and less than 5 minutes (21 commuters, 15.1%).
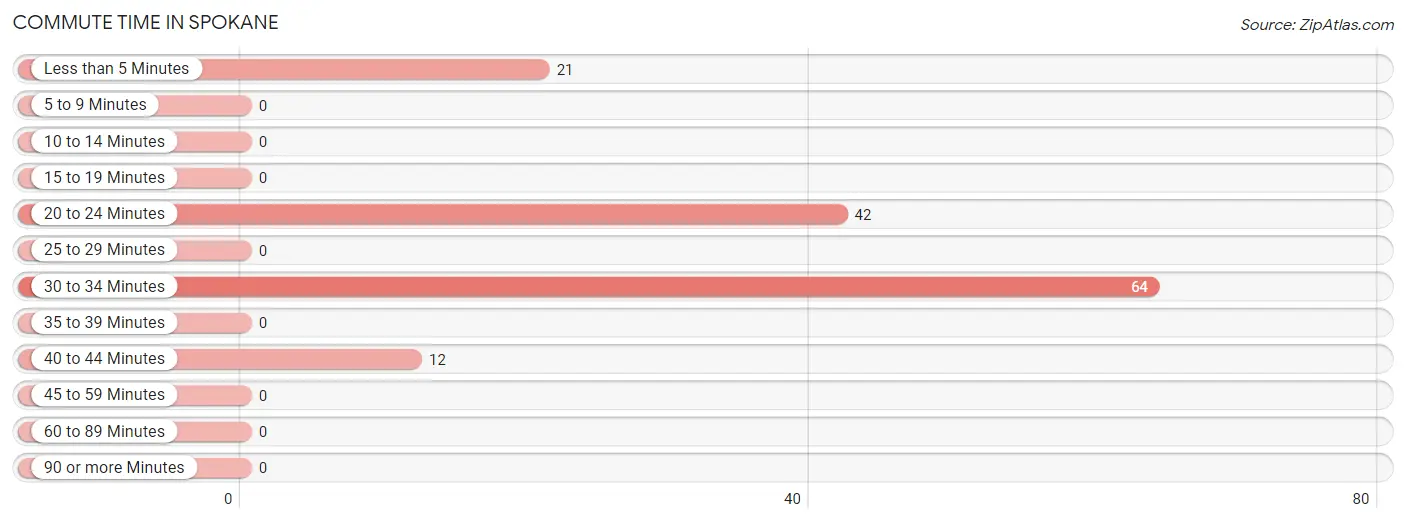
| Commute Time | # Commuters | % Commuters |
| Less than 5 Minutes | 21 | 15.1% |
| 5 to 9 Minutes | 0 | 0.0% |
| 10 to 14 Minutes | 0 | 0.0% |
| 15 to 19 Minutes | 0 | 0.0% |
| 20 to 24 Minutes | 42 | 30.2% |
| 25 to 29 Minutes | 0 | 0.0% |
| 30 to 34 Minutes | 64 | 46.0% |
| 35 to 39 Minutes | 0 | 0.0% |
| 40 to 44 Minutes | 12 | 8.6% |
| 45 to 59 Minutes | 0 | 0.0% |
| 60 to 89 Minutes | 0 | 0.0% |
| 90 or more Minutes | 0 | 0.0% |
Commute Time by Sex in Spokane
The most common commute times in Spokane are 20 to 24 minutes (42 commuters, 60.0%) for males and 30 to 34 minutes (36 commuters, 52.2%) for females.
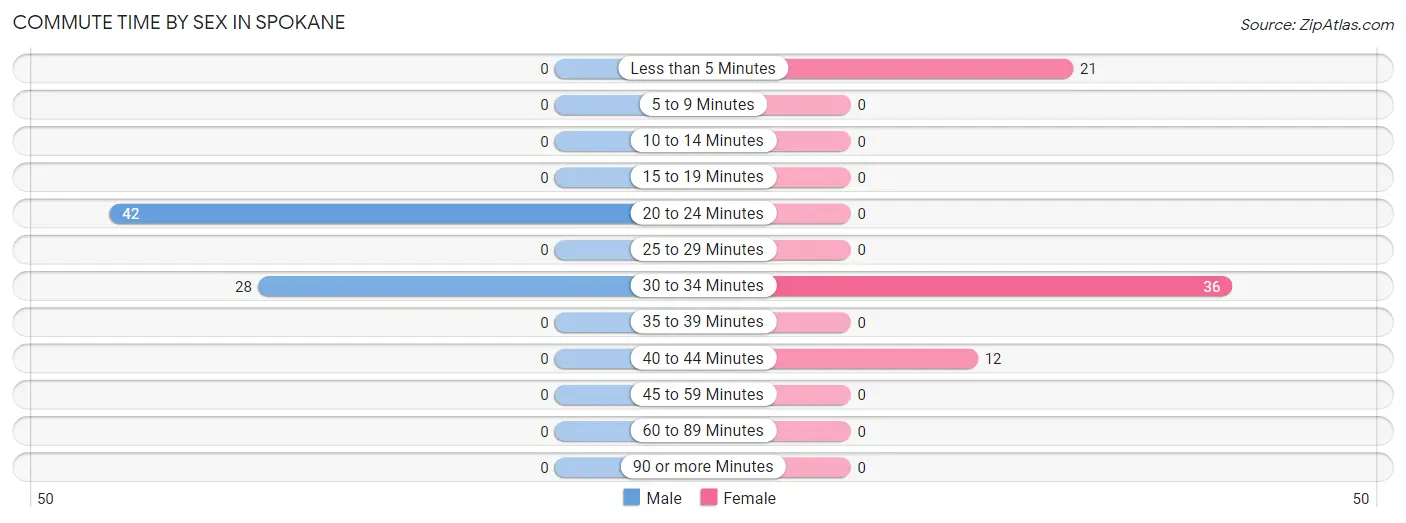
| Commute Time | Male | Female |
| Less than 5 Minutes | 0 (0.0%) | 21 (30.4%) |
| 5 to 9 Minutes | 0 (0.0%) | 0 (0.0%) |
| 10 to 14 Minutes | 0 (0.0%) | 0 (0.0%) |
| 15 to 19 Minutes | 0 (0.0%) | 0 (0.0%) |
| 20 to 24 Minutes | 42 (60.0%) | 0 (0.0%) |
| 25 to 29 Minutes | 0 (0.0%) | 0 (0.0%) |
| 30 to 34 Minutes | 28 (40.0%) | 36 (52.2%) |
| 35 to 39 Minutes | 0 (0.0%) | 0 (0.0%) |
| 40 to 44 Minutes | 0 (0.0%) | 12 (17.4%) |
| 45 to 59 Minutes | 0 (0.0%) | 0 (0.0%) |
| 60 to 89 Minutes | 0 (0.0%) | 0 (0.0%) |
| 90 or more Minutes | 0 (0.0%) | 0 (0.0%) |
Time of Departure to Work by Sex in Spokane
The most frequent times of departure to work in Spokane are 7:00 AM to 7:29 AM (32, 45.7%) for males and 8:00 AM to 8:29 AM (21, 30.4%) for females.
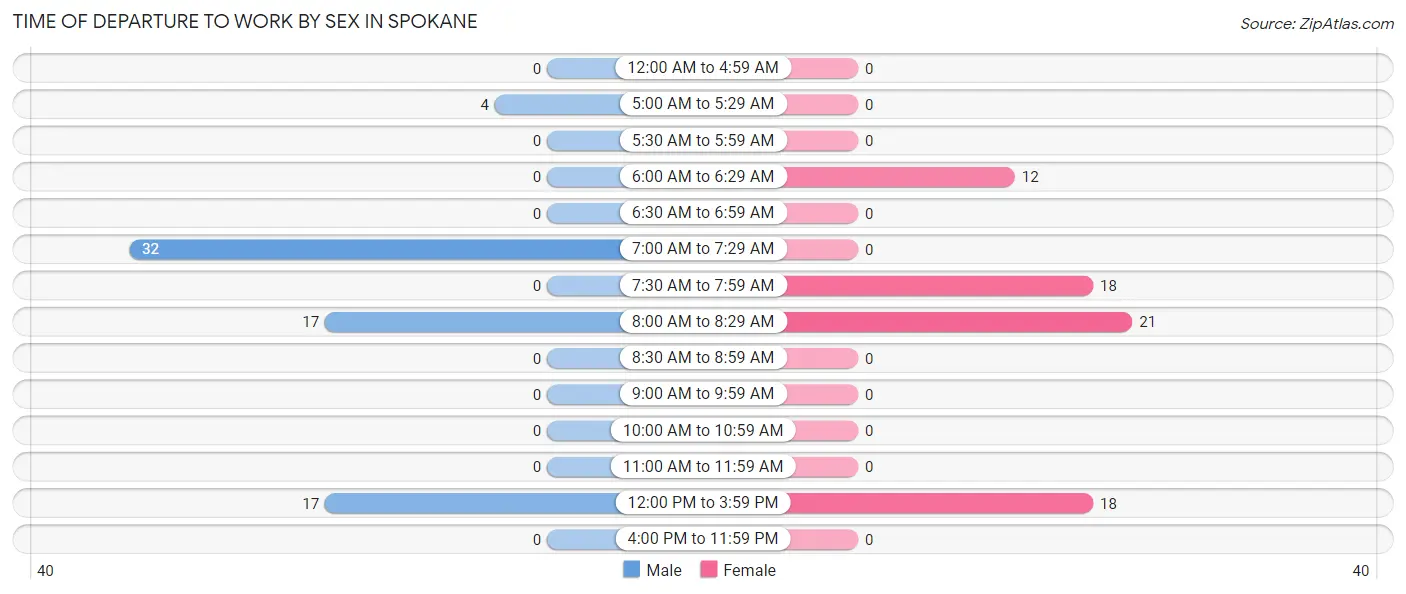
| Time of Departure | Male | Female |
| 12:00 AM to 4:59 AM | 0 (0.0%) | 0 (0.0%) |
| 5:00 AM to 5:29 AM | 4 (5.7%) | 0 (0.0%) |
| 5:30 AM to 5:59 AM | 0 (0.0%) | 0 (0.0%) |
| 6:00 AM to 6:29 AM | 0 (0.0%) | 12 (17.4%) |
| 6:30 AM to 6:59 AM | 0 (0.0%) | 0 (0.0%) |
| 7:00 AM to 7:29 AM | 32 (45.7%) | 0 (0.0%) |
| 7:30 AM to 7:59 AM | 0 (0.0%) | 18 (26.1%) |
| 8:00 AM to 8:29 AM | 17 (24.3%) | 21 (30.4%) |
| 8:30 AM to 8:59 AM | 0 (0.0%) | 0 (0.0%) |
| 9:00 AM to 9:59 AM | 0 (0.0%) | 0 (0.0%) |
| 10:00 AM to 10:59 AM | 0 (0.0%) | 0 (0.0%) |
| 11:00 AM to 11:59 AM | 0 (0.0%) | 0 (0.0%) |
| 12:00 PM to 3:59 PM | 17 (24.3%) | 18 (26.1%) |
| 4:00 PM to 11:59 PM | 0 (0.0%) | 0 (0.0%) |
| Total | 70 (100.0%) | 69 (100.0%) |
Housing Occupancy in Spokane
Occupancy by Ownership in Spokane
Of the total 68 dwellings in Spokane, owner-occupied units account for 68 (100.0%), while renter-occupied units make up 0 (0.0%).
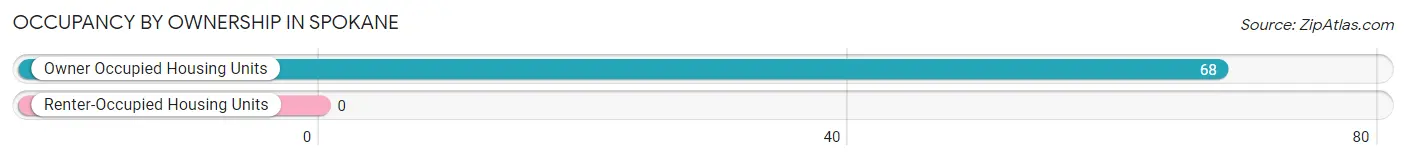
| Occupancy | # Housing Units | % Housing Units |
| Owner Occupied Housing Units | 68 | 100.0% |
| Renter-Occupied Housing Units | 0 | 0.0% |
| Total Occupied Housing Units | 68 | 100.0% |
Occupancy by Household Size in Spokane
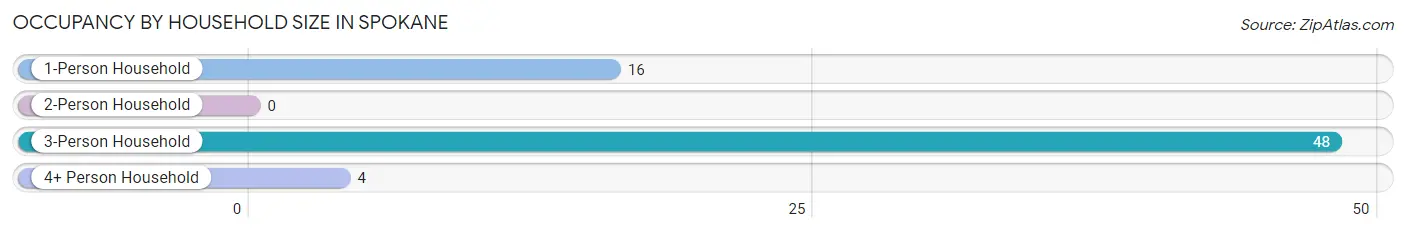
| Household Size | # Housing Units | % Housing Units |
| 1-Person Household | 16 | 23.5% |
| 2-Person Household | 0 | 0.0% |
| 3-Person Household | 48 | 70.6% |
| 4+ Person Household | 4 | 5.9% |
| Total Housing Units | 68 | 100.0% |
Occupancy by Ownership by Household Size in Spokane
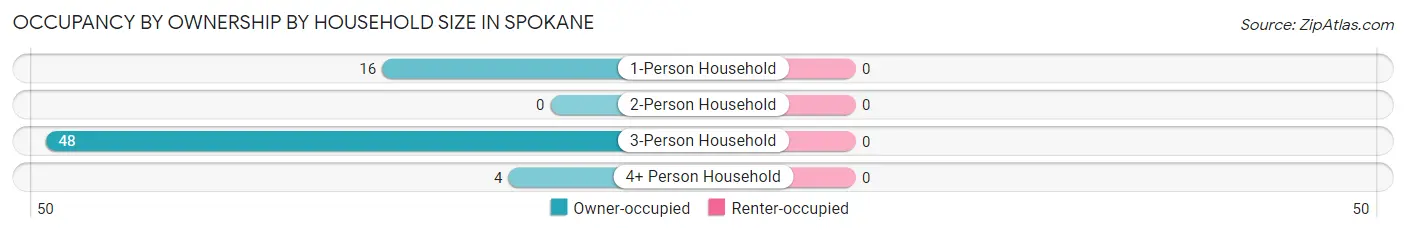
| Household Size | Owner-occupied | Renter-occupied |
| 1-Person Household | 16 (100.0%) | 0 (0.0%) |
| 2-Person Household | 0 (0.0%) | 0 (0.0%) |
| 3-Person Household | 48 (100.0%) | 0 (0.0%) |
| 4+ Person Household | 4 (100.0%) | 0 (0.0%) |
| Total Housing Units | 68 (100.0%) | 0 (0.0%) |
Occupancy by Educational Attainment in Spokane
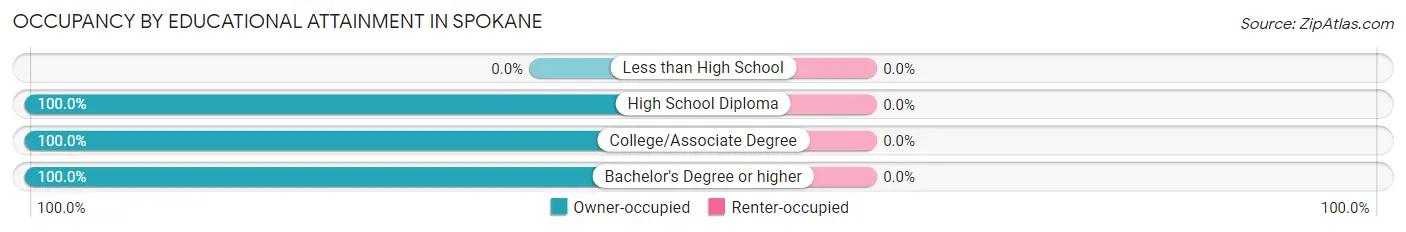
| Household Size | Owner-occupied | Renter-occupied |
| Less than High School | 0 (0.0%) | 0 (0.0%) |
| High School Diploma | 20 (100.0%) | 0 (0.0%) |
| College/Associate Degree | 27 (100.0%) | 0 (0.0%) |
| Bachelor's Degree or higher | 21 (100.0%) | 0 (0.0%) |
Occupancy by Age of Householder in Spokane
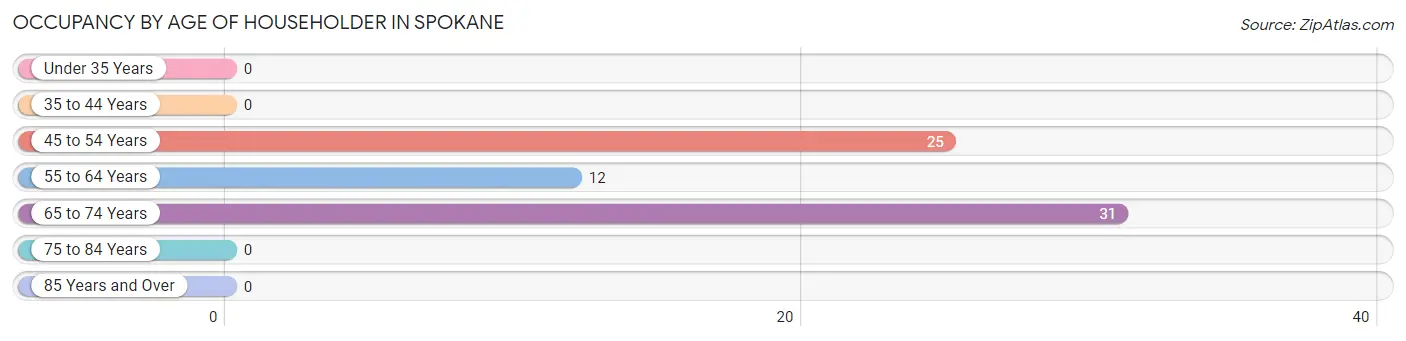
| Age Bracket | # Households | % Households |
| Under 35 Years | 0 | 0.0% |
| 35 to 44 Years | 0 | 0.0% |
| 45 to 54 Years | 25 | 36.8% |
| 55 to 64 Years | 12 | 17.6% |
| 65 to 74 Years | 31 | 45.6% |
| 75 to 84 Years | 0 | 0.0% |
| 85 Years and Over | 0 | 0.0% |
| Total | 68 | 100.0% |
Housing Finances in Spokane
Median Income by Occupancy in Spokane
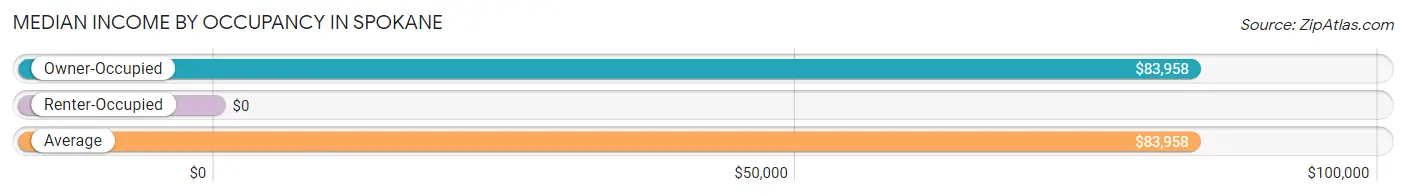
| Occupancy Type | # Households | Median Income |
| Owner-Occupied | 68 (100.0%) | $83,958 |
| Renter-Occupied | 0 (0.0%) | $0 |
| Average | 68 (100.0%) | $83,958 |
Occupancy by Householder Income Bracket in Spokane
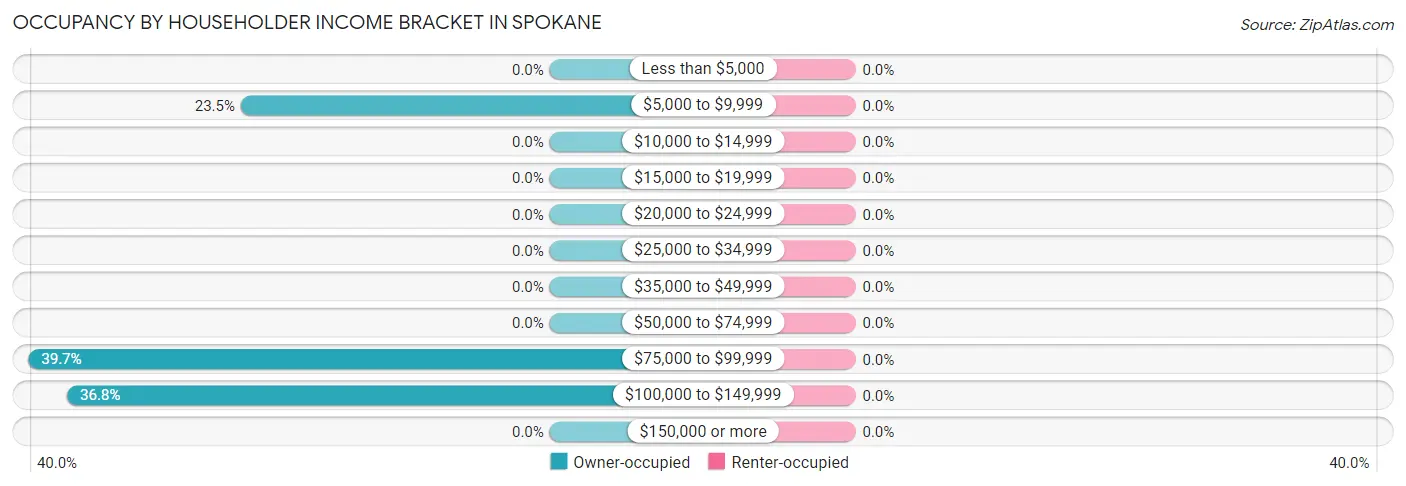
| Income Bracket | Owner-occupied | Renter-occupied |
| Less than $5,000 | 0 (0.0%) | 0 (0.0%) |
| $5,000 to $9,999 | 16 (23.5%) | 0 (0.0%) |
| $10,000 to $14,999 | 0 (0.0%) | 0 (0.0%) |
| $15,000 to $19,999 | 0 (0.0%) | 0 (0.0%) |
| $20,000 to $24,999 | 0 (0.0%) | 0 (0.0%) |
| $25,000 to $34,999 | 0 (0.0%) | 0 (0.0%) |
| $35,000 to $49,999 | 0 (0.0%) | 0 (0.0%) |
| $50,000 to $74,999 | 0 (0.0%) | 0 (0.0%) |
| $75,000 to $99,999 | 27 (39.7%) | 0 (0.0%) |
| $100,000 to $149,999 | 25 (36.8%) | 0 (0.0%) |
| $150,000 or more | 0 (0.0%) | 0 (0.0%) |
| Total | 68 (100.0%) | 0 (0.0%) |
Monthly Housing Cost Tiers in Spokane
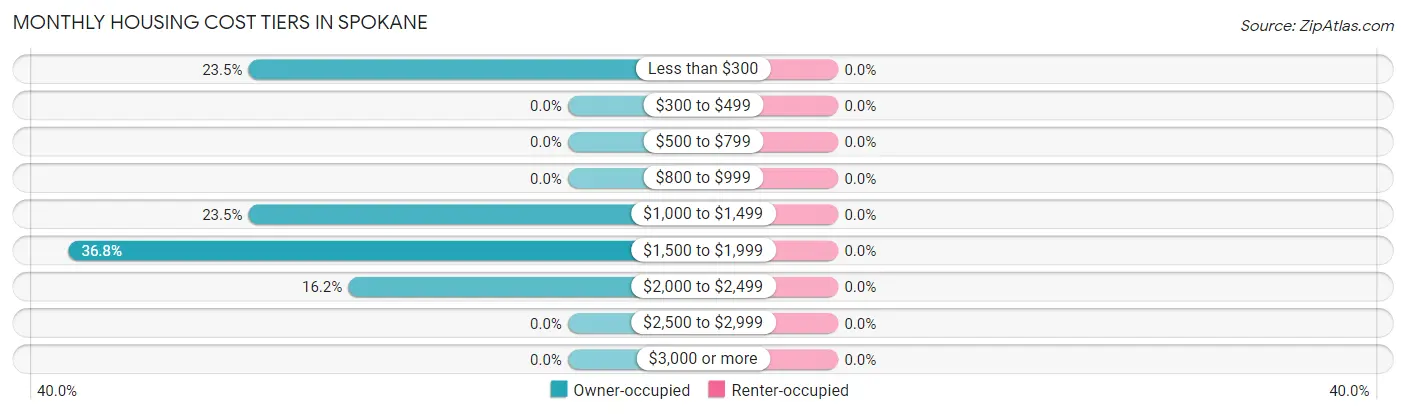
| Monthly Cost | Owner-occupied | Renter-occupied |
| Less than $300 | 16 (23.5%) | 0 (0.0%) |
| $300 to $499 | 0 (0.0%) | 0 (0.0%) |
| $500 to $799 | 0 (0.0%) | 0 (0.0%) |
| $800 to $999 | 0 (0.0%) | 0 (0.0%) |
| $1,000 to $1,499 | 16 (23.5%) | 0 (0.0%) |
| $1,500 to $1,999 | 25 (36.8%) | 0 (0.0%) |
| $2,000 to $2,499 | 11 (16.2%) | 0 (0.0%) |
| $2,500 to $2,999 | 0 (0.0%) | 0 (0.0%) |
| $3,000 or more | 0 (0.0%) | 0 (0.0%) |
| Total | 68 (100.0%) | 0 (0.0%) |
Physical Housing Characteristics in Spokane
Housing Structures in Spokane
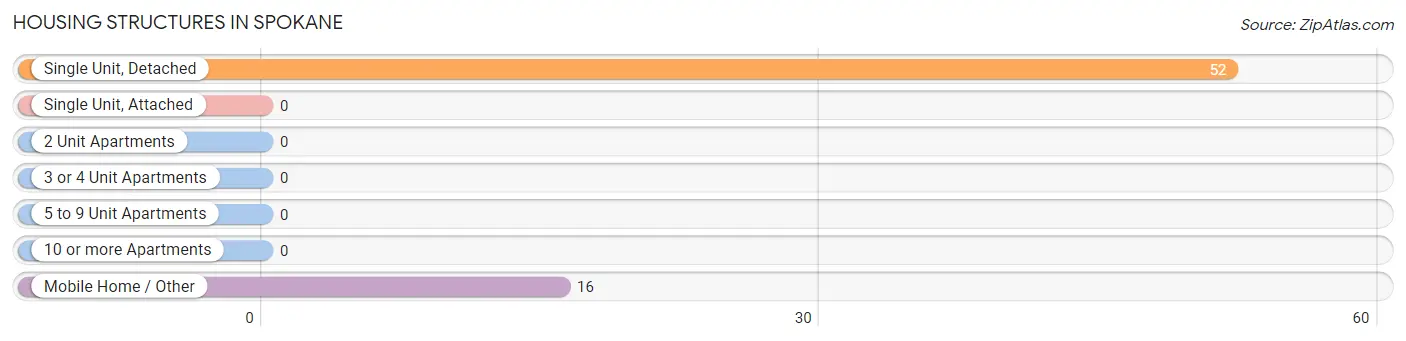
| Structure Type | # Housing Units | % Housing Units |
| Single Unit, Detached | 52 | 76.5% |
| Single Unit, Attached | 0 | 0.0% |
| 2 Unit Apartments | 0 | 0.0% |
| 3 or 4 Unit Apartments | 0 | 0.0% |
| 5 to 9 Unit Apartments | 0 | 0.0% |
| 10 or more Apartments | 0 | 0.0% |
| Mobile Home / Other | 16 | 23.5% |
| Total | 68 | 100.0% |
Housing Structures by Occupancy in Spokane
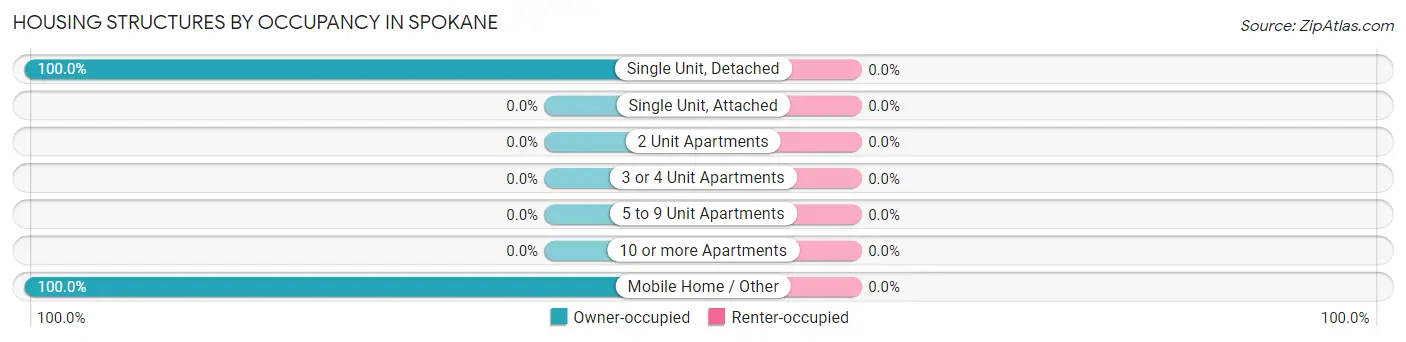
| Structure Type | Owner-occupied | Renter-occupied |
| Single Unit, Detached | 52 (100.0%) | 0 (0.0%) |
| Single Unit, Attached | 0 (0.0%) | 0 (0.0%) |
| 2 Unit Apartments | 0 (0.0%) | 0 (0.0%) |
| 3 or 4 Unit Apartments | 0 (0.0%) | 0 (0.0%) |
| 5 to 9 Unit Apartments | 0 (0.0%) | 0 (0.0%) |
| 10 or more Apartments | 0 (0.0%) | 0 (0.0%) |
| Mobile Home / Other | 16 (100.0%) | 0 (0.0%) |
| Total | 68 (100.0%) | 0 (0.0%) |
Housing Structures by Number of Rooms in Spokane
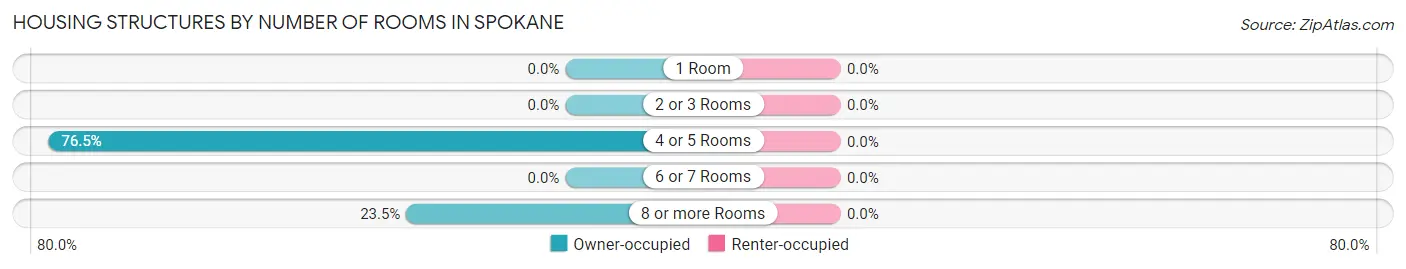
| Number of Rooms | Owner-occupied | Renter-occupied |
| 1 Room | 0 (0.0%) | 0 (0.0%) |
| 2 or 3 Rooms | 0 (0.0%) | 0 (0.0%) |
| 4 or 5 Rooms | 52 (76.5%) | 0 (0.0%) |
| 6 or 7 Rooms | 0 (0.0%) | 0 (0.0%) |
| 8 or more Rooms | 16 (23.5%) | 0 (0.0%) |
| Total | 68 (100.0%) | 0 (0.0%) |
Housing Structure by Heating Type in Spokane
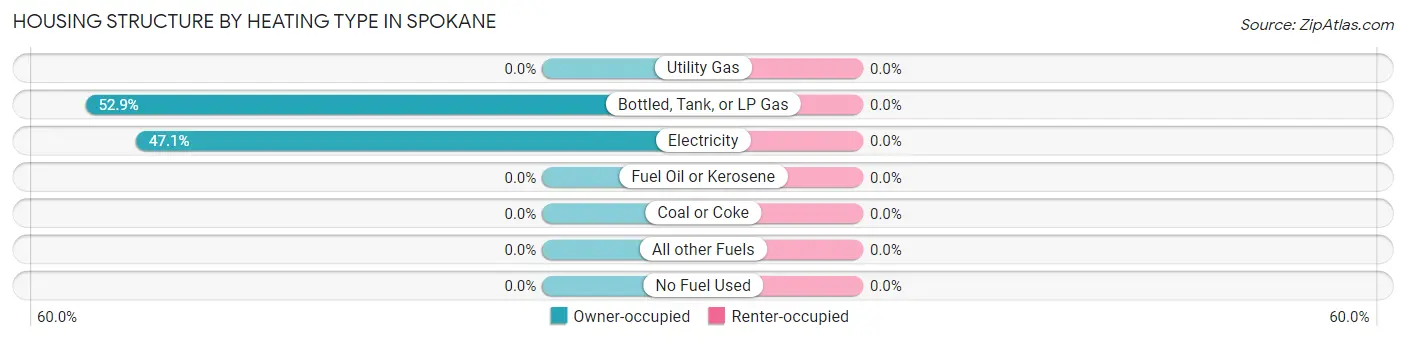
| Heating Type | Owner-occupied | Renter-occupied |
| Utility Gas | 0 (0.0%) | 0 (0.0%) |
| Bottled, Tank, or LP Gas | 36 (52.9%) | 0 (0.0%) |
| Electricity | 32 (47.1%) | 0 (0.0%) |
| Fuel Oil or Kerosene | 0 (0.0%) | 0 (0.0%) |
| Coal or Coke | 0 (0.0%) | 0 (0.0%) |
| All other Fuels | 0 (0.0%) | 0 (0.0%) |
| No Fuel Used | 0 (0.0%) | 0 (0.0%) |
| Total | 68 (100.0%) | 0 (0.0%) |
Household Vehicle Usage in Spokane
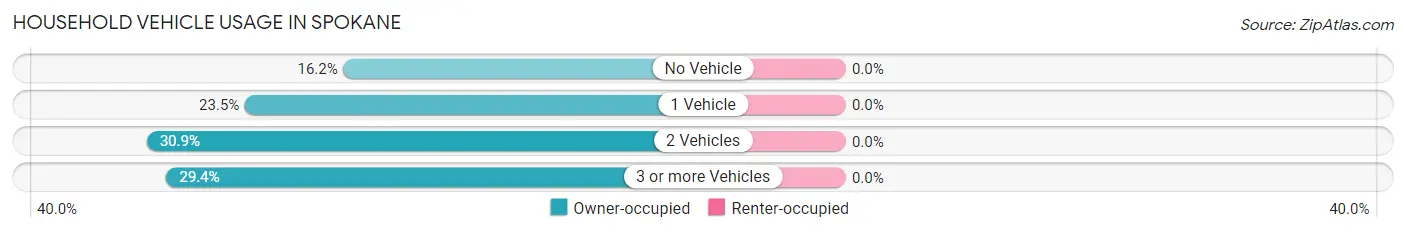
| Vehicles per Household | Owner-occupied | Renter-occupied |
| No Vehicle | 11 (16.2%) | 0 (0.0%) |
| 1 Vehicle | 16 (23.5%) | 0 (0.0%) |
| 2 Vehicles | 21 (30.9%) | 0 (0.0%) |
| 3 or more Vehicles | 20 (29.4%) | 0 (0.0%) |
| Total | 68 (100.0%) | 0 (0.0%) |
Real Estate & Mortgages in Spokane
Real Estate and Mortgage Overview in Spokane
| Characteristic | Without Mortgage | With Mortgage |
| Housing Units | 16 | 52 |
| Median Property Value | - | - |
| Median Household Income | - | - |
| Monthly Housing Costs | - | - |
| Real Estate Taxes | - | - |
Property Value by Mortgage Status in Spokane
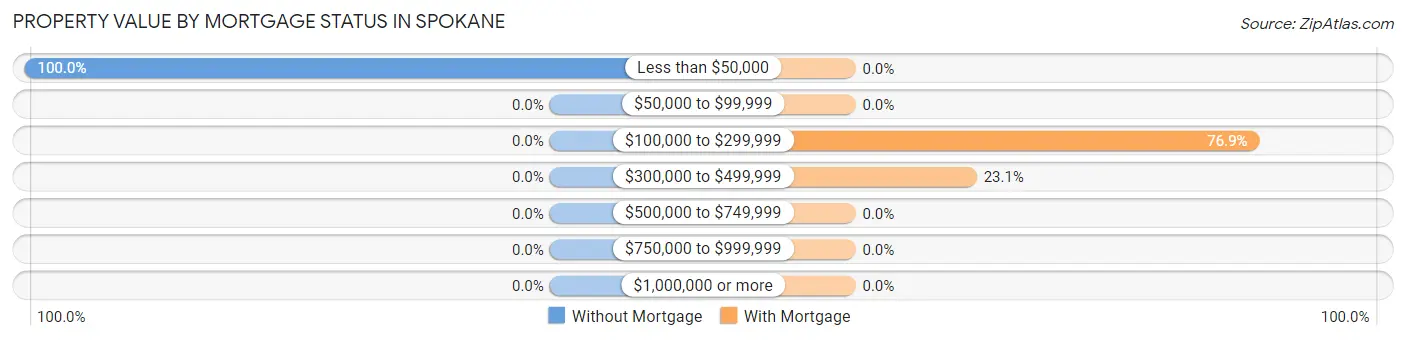
| Property Value | Without Mortgage | With Mortgage |
| Less than $50,000 | 16 (100.0%) | 0 (0.0%) |
| $50,000 to $99,999 | 0 (0.0%) | 0 (0.0%) |
| $100,000 to $299,999 | 0 (0.0%) | 40 (76.9%) |
| $300,000 to $499,999 | 0 (0.0%) | 12 (23.1%) |
| $500,000 to $749,999 | 0 (0.0%) | 0 (0.0%) |
| $750,000 to $999,999 | 0 (0.0%) | 0 (0.0%) |
| $1,000,000 or more | 0 (0.0%) | 0 (0.0%) |
| Total | 16 (100.0%) | 52 (100.0%) |
Household Income by Mortgage Status in Spokane
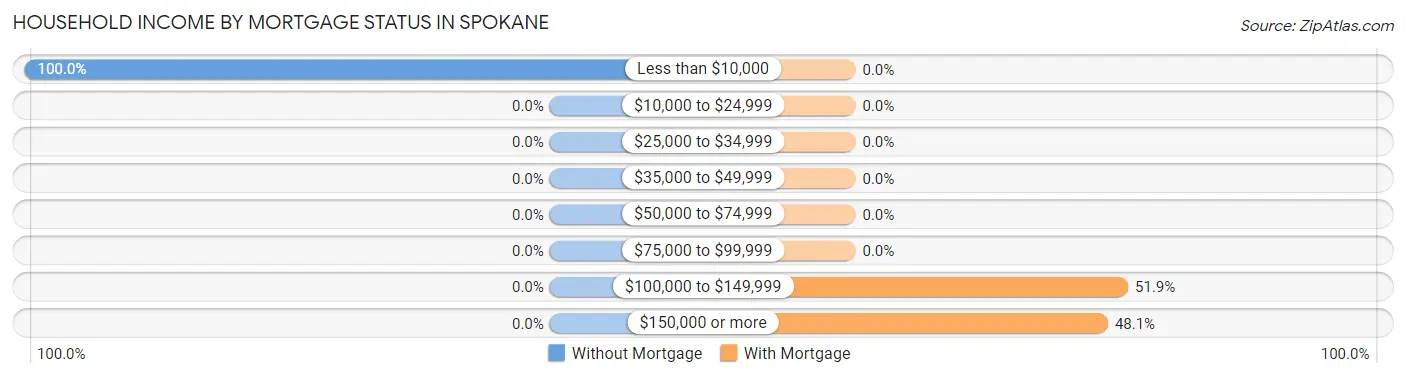
| Household Income | Without Mortgage | With Mortgage |
| Less than $10,000 | 16 (100.0%) | 0 (0.0%) |
| $10,000 to $24,999 | 0 (0.0%) | 0 (0.0%) |
| $25,000 to $34,999 | 0 (0.0%) | 0 (0.0%) |
| $35,000 to $49,999 | 0 (0.0%) | 0 (0.0%) |
| $50,000 to $74,999 | 0 (0.0%) | 0 (0.0%) |
| $75,000 to $99,999 | 0 (0.0%) | 0 (0.0%) |
| $100,000 to $149,999 | 0 (0.0%) | 27 (51.9%) |
| $150,000 or more | 0 (0.0%) | 25 (48.1%) |
| Total | 16 (100.0%) | 52 (100.0%) |
Property Value to Household Income Ratio in Spokane
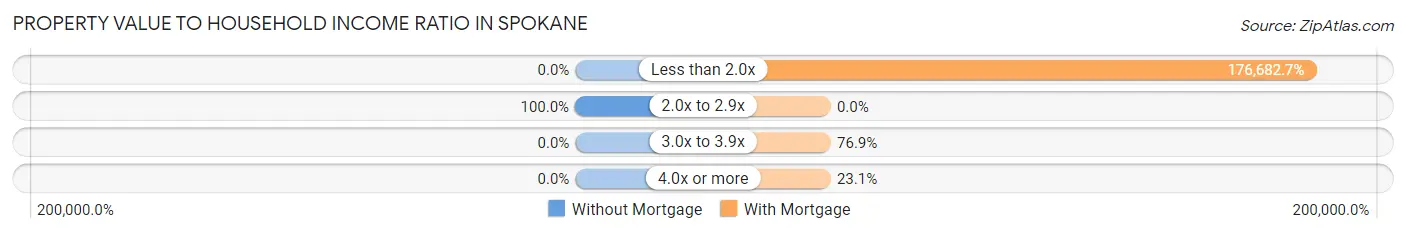
| Value-to-Income Ratio | Without Mortgage | With Mortgage |
| Less than 2.0x | 0 (0.0%) | 91,875 (176,682.7%) |
| 2.0x to 2.9x | 16 (100.0%) | 0 (0.0%) |
| 3.0x to 3.9x | 0 (0.0%) | 40 (76.9%) |
| 4.0x or more | 0 (0.0%) | 12 (23.1%) |
| Total | 16 (100.0%) | 52 (100.0%) |
Real Estate Taxes by Mortgage Status in Spokane
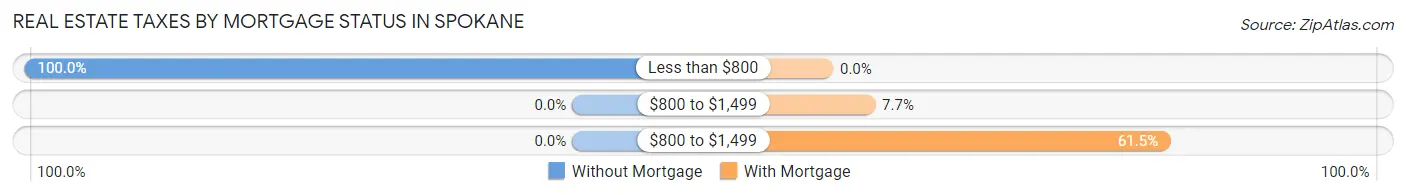
| Property Taxes | Without Mortgage | With Mortgage |
| Less than $800 | 16 (100.0%) | 0 (0.0%) |
| $800 to $1,499 | 0 (0.0%) | 4 (7.7%) |
| $800 to $1,499 | 0 (0.0%) | 32 (61.5%) |
| Total | 16 (100.0%) | 52 (100.0%) |
Health & Disability in Spokane
Health Insurance Coverage by Age in Spokane
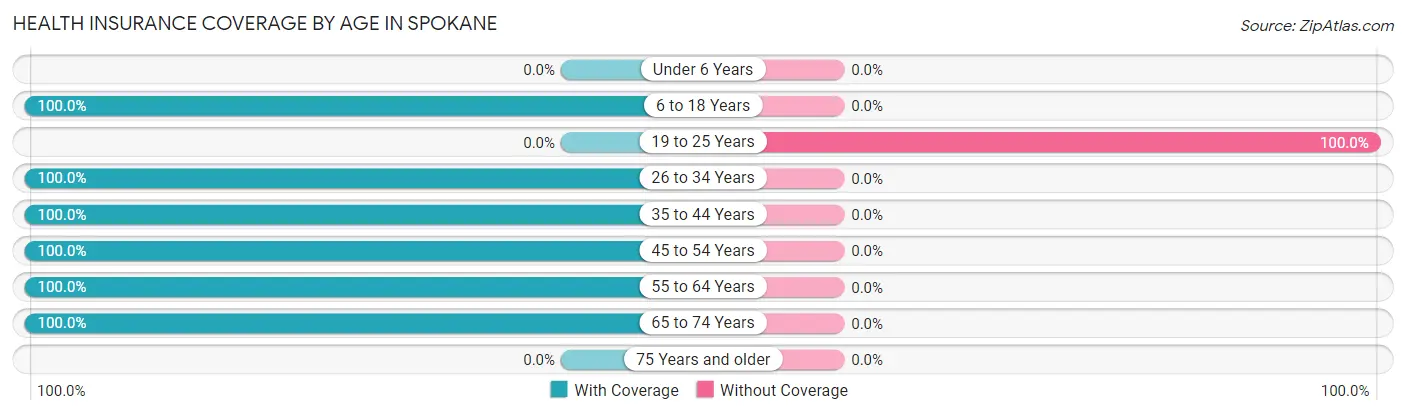
| Age Bracket | With Coverage | Without Coverage |
| Under 6 Years | 0 (0.0%) | 0 (0.0%) |
| 6 to 18 Years | 19 (100.0%) | 0 (0.0%) |
| 19 to 25 Years | 0 (0.0%) | 6 (100.0%) |
| 26 to 34 Years | 61 (100.0%) | 0 (0.0%) |
| 35 to 44 Years | 17 (100.0%) | 0 (0.0%) |
| 45 to 54 Years | 48 (100.0%) | 0 (0.0%) |
| 55 to 64 Years | 27 (100.0%) | 0 (0.0%) |
| 65 to 74 Years | 31 (100.0%) | 0 (0.0%) |
| 75 Years and older | 0 (0.0%) | 0 (0.0%) |
| Total | 203 (97.1%) | 6 (2.9%) |
Health Insurance Coverage by Citizenship Status in Spokane
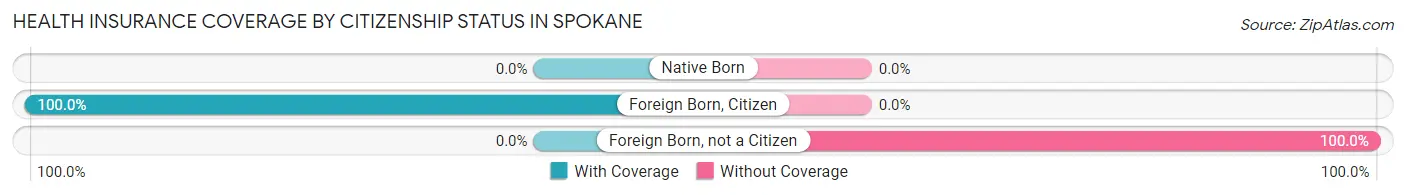
| Citizenship Status | With Coverage | Without Coverage |
| Native Born | 0 (0.0%) | 0 (0.0%) |
| Foreign Born, Citizen | 19 (100.0%) | 0 (0.0%) |
| Foreign Born, not a Citizen | 0 (0.0%) | 6 (100.0%) |
Health Insurance Coverage by Household Income in Spokane
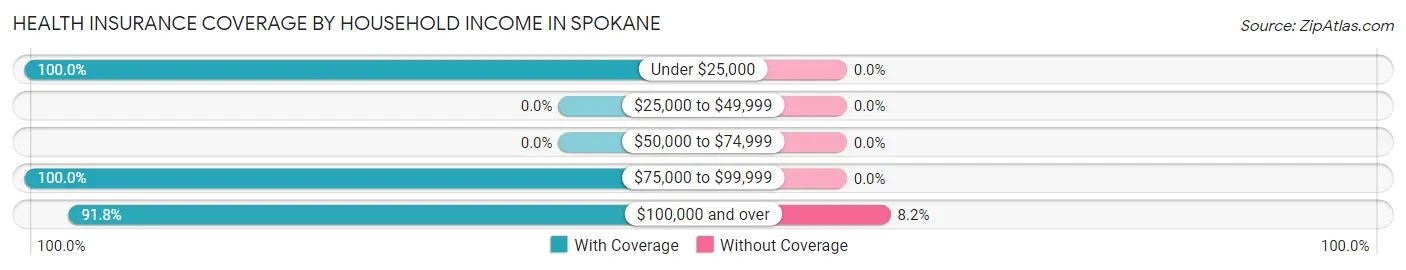
| Household Income | With Coverage | Without Coverage |
| Under $25,000 | 16 (100.0%) | 0 (0.0%) |
| $25,000 to $49,999 | 0 (0.0%) | 0 (0.0%) |
| $50,000 to $74,999 | 0 (0.0%) | 0 (0.0%) |
| $75,000 to $99,999 | 120 (100.0%) | 0 (0.0%) |
| $100,000 and over | 67 (91.8%) | 6 (8.2%) |
Public vs Private Health Insurance Coverage by Age in Spokane
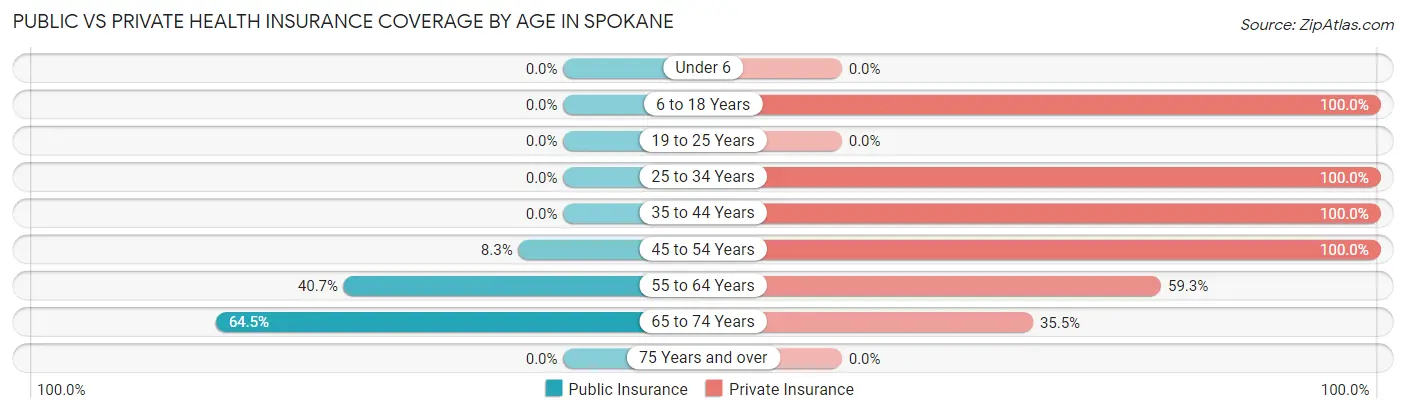
| Age Bracket | Public Insurance | Private Insurance |
| Under 6 | 0 (0.0%) | 0 (0.0%) |
| 6 to 18 Years | 0 (0.0%) | 19 (100.0%) |
| 19 to 25 Years | 0 (0.0%) | 0 (0.0%) |
| 25 to 34 Years | 0 (0.0%) | 61 (100.0%) |
| 35 to 44 Years | 0 (0.0%) | 17 (100.0%) |
| 45 to 54 Years | 4 (8.3%) | 48 (100.0%) |
| 55 to 64 Years | 11 (40.7%) | 16 (59.3%) |
| 65 to 74 Years | 20 (64.5%) | 11 (35.5%) |
| 75 Years and over | 0 (0.0%) | 0 (0.0%) |
| Total | 35 (16.8%) | 172 (82.3%) |
Disability Status by Sex by Age in Spokane
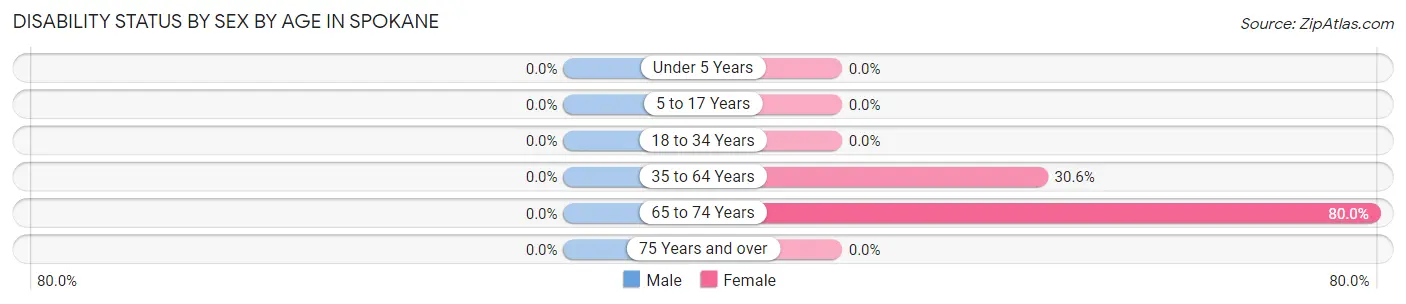
| Age Bracket | Male | Female |
| Under 5 Years | 0 (0.0%) | 0 (0.0%) |
| 5 to 17 Years | 0 (0.0%) | 0 (0.0%) |
| 18 to 34 Years | 0 (0.0%) | 0 (0.0%) |
| 35 to 64 Years | 0 (0.0%) | 11 (30.6%) |
| 65 to 74 Years | 0 (0.0%) | 16 (80.0%) |
| 75 Years and over | 0 (0.0%) | 0 (0.0%) |
Disability Class by Sex by Age in Spokane
Disability Class: Hearing Difficulty
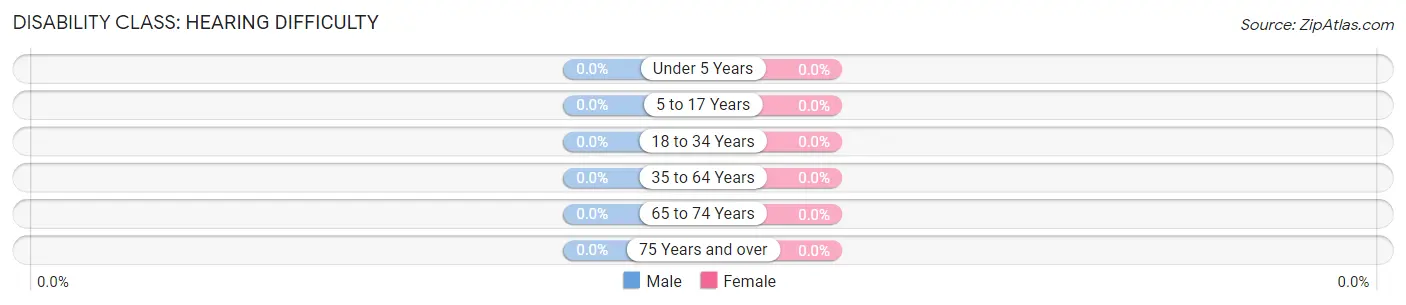
| Age Bracket | Male | Female |
| Under 5 Years | 0 (0.0%) | 0 (0.0%) |
| 5 to 17 Years | 0 (0.0%) | 0 (0.0%) |
| 18 to 34 Years | 0 (0.0%) | 0 (0.0%) |
| 35 to 64 Years | 0 (0.0%) | 0 (0.0%) |
| 65 to 74 Years | 0 (0.0%) | 0 (0.0%) |
| 75 Years and over | 0 (0.0%) | 0 (0.0%) |
Disability Class: Vision Difficulty
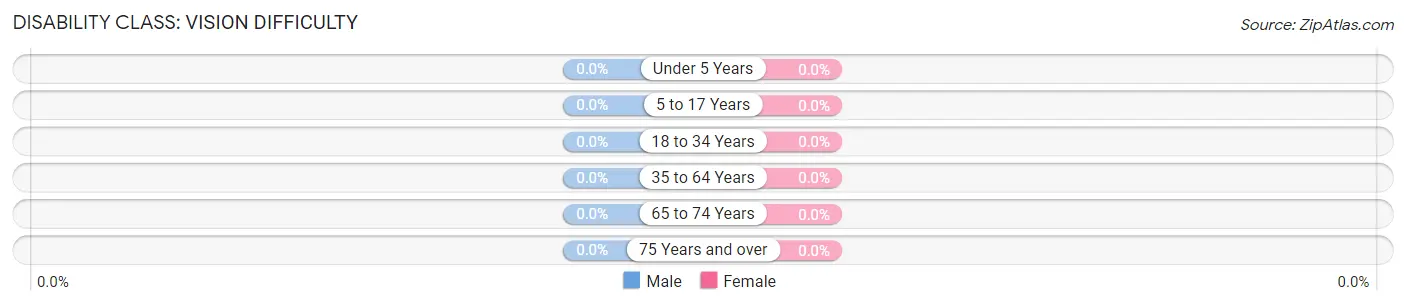
| Age Bracket | Male | Female |
| Under 5 Years | 0 (0.0%) | 0 (0.0%) |
| 5 to 17 Years | 0 (0.0%) | 0 (0.0%) |
| 18 to 34 Years | 0 (0.0%) | 0 (0.0%) |
| 35 to 64 Years | 0 (0.0%) | 0 (0.0%) |
| 65 to 74 Years | 0 (0.0%) | 0 (0.0%) |
| 75 Years and over | 0 (0.0%) | 0 (0.0%) |
Disability Class: Cognitive Difficulty
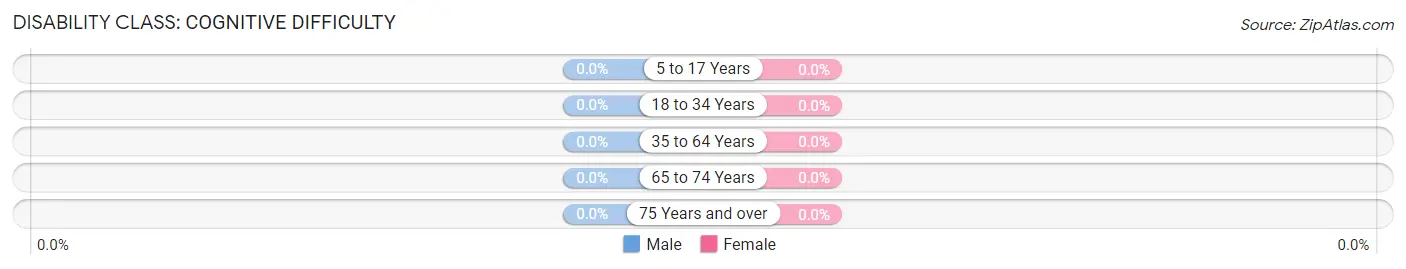
| Age Bracket | Male | Female |
| 5 to 17 Years | 0 (0.0%) | 0 (0.0%) |
| 18 to 34 Years | 0 (0.0%) | 0 (0.0%) |
| 35 to 64 Years | 0 (0.0%) | 0 (0.0%) |
| 65 to 74 Years | 0 (0.0%) | 0 (0.0%) |
| 75 Years and over | 0 (0.0%) | 0 (0.0%) |
Disability Class: Ambulatory Difficulty
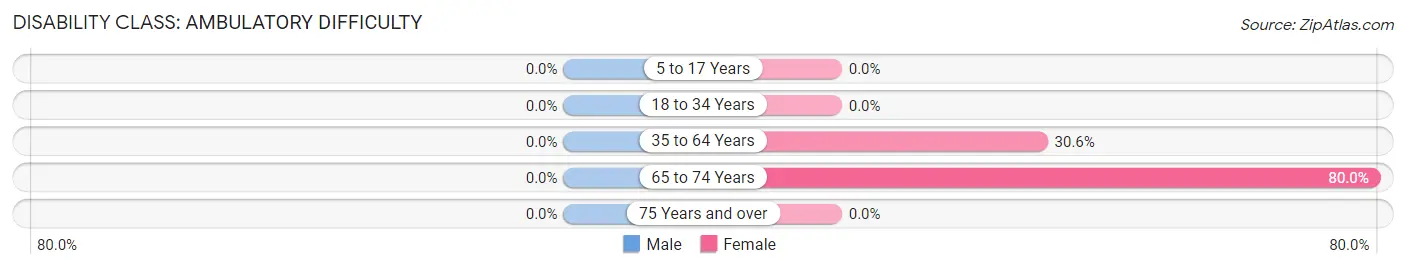
| Age Bracket | Male | Female |
| 5 to 17 Years | 0 (0.0%) | 0 (0.0%) |
| 18 to 34 Years | 0 (0.0%) | 0 (0.0%) |
| 35 to 64 Years | 0 (0.0%) | 11 (30.6%) |
| 65 to 74 Years | 0 (0.0%) | 16 (80.0%) |
| 75 Years and over | 0 (0.0%) | 0 (0.0%) |
Disability Class: Self-Care Difficulty

| Age Bracket | Male | Female |
| 5 to 17 Years | 0 (0.0%) | 0 (0.0%) |
| 18 to 34 Years | 0 (0.0%) | 0 (0.0%) |
| 35 to 64 Years | 0 (0.0%) | 0 (0.0%) |
| 65 to 74 Years | 0 (0.0%) | 0 (0.0%) |
| 75 Years and over | 0 (0.0%) | 0 (0.0%) |
Technology Access in Spokane
Computing Device Access in Spokane
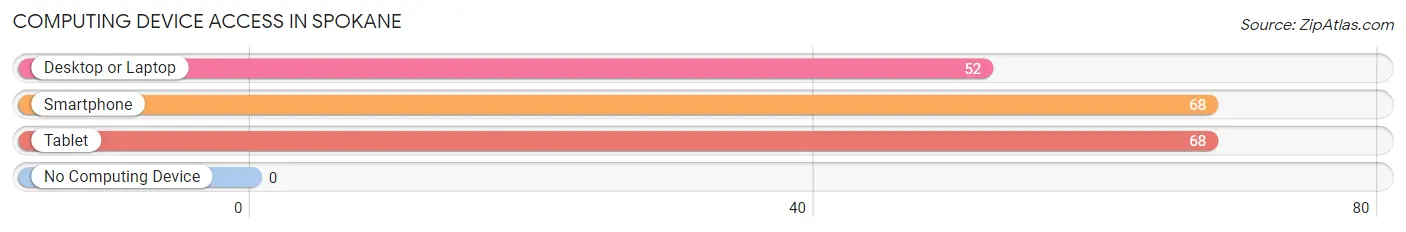
| Device Type | # Households | % Households |
| Desktop or Laptop | 52 | 76.5% |
| Smartphone | 68 | 100.0% |
| Tablet | 68 | 100.0% |
| No Computing Device | 0 | 0.0% |
| Total | 68 | 100.0% |
Internet Access in Spokane
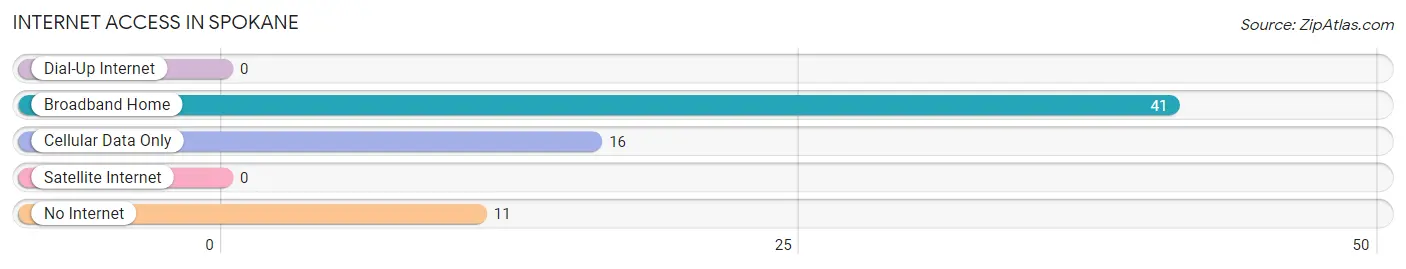
| Internet Type | # Households | % Households |
| Dial-Up Internet | 0 | 0.0% |
| Broadband Home | 41 | 60.3% |
| Cellular Data Only | 16 | 23.5% |
| Satellite Internet | 0 | 0.0% |
| No Internet | 11 | 16.2% |
| Total | 68 | 100.0% |
Spokane Summary
Spokane is a small city located in southwest Missouri, in the Ozarks region. It is situated in the county of Wright, and is the county seat. The city is located on the banks of the James River, and is surrounded by rolling hills and forests. The population of Spokane was 1,845 in the 2010 census, making it the smallest city in the county.
History
The area that is now Spokane was first settled in the early 1800s by settlers from Kentucky and Tennessee. The first post office was established in 1837, and the town was officially incorporated in 1883. The city was named after the Spokane River, which was named by Native Americans who lived in the area.
The city was an important stop on the Ozark Trail, a major route for settlers heading west. The trail was used by wagon trains, stagecoaches, and freight wagons. The city was also a major stop on the St. Louis-San Francisco Railway, which ran through the city from 1882 to 1932.
The city was an important center for the timber industry in the late 19th and early 20th centuries. The city was home to several sawmills and lumber yards, and the timber industry was a major employer in the area.
Geography
Spokane is located in the Ozarks region of southwest Missouri. The city is situated on the banks of the James River, and is surrounded by rolling hills and forests. The city is located at an elevation of 890 feet above sea level.
The climate in Spokane is humid subtropical, with hot, humid summers and mild winters. The average annual temperature is around 60 degrees Fahrenheit, and the average annual precipitation is around 40 inches.
Economy
The economy of Spokane is largely based on agriculture and tourism. The city is home to several farms, and the surrounding area is known for its production of beef, pork, and poultry. The city is also home to several wineries, and the area is known for its production of wine.
Tourism is also an important part of the economy. The city is home to several historic sites, including the Wright County Courthouse, the Spokane Opera House, and the Spokane Museum. The city is also home to several parks, including the James River Park and the Spokane State Park.
Demographics
As of the 2010 census, the population of Spokane was 1,845. The racial makeup of the city was 97.3% White, 0.7% African American, 0.3% Native American, 0.2% Asian, 0.1% Pacific Islander, 0.2% from other races, and 1.2% from two or more races. Hispanic or Latino of any race were 1.2% of the population.
The median income for a household in the city was $30,938, and the median income for a family was $37,813. The per capita income for the city was $17,845. About 16.2% of families and 19.2% of the population were below the poverty line, including 25.2% of those under age 18 and 11.2% of those age 65 or over.
Common Questions
What is Per Capita Income in Spokane?
Per Capita income in Spokane is $29,725.
What is the Median Family Income in Spokane?
Median Family Income in Spokane is $91,875.
What is the Median Household income in Spokane?
Median Household Income in Spokane is $83,958.
What is Inequality or Gini Index in Spokane?
Inequality or Gini Index in Spokane is 0.29.
What is the Total Population of Spokane?
Total Population of Spokane is 209.
What is the Total Male Population of Spokane?
Total Male Population of Spokane is 105.
What is the Total Female Population of Spokane?
Total Female Population of Spokane is 104.
What is the Ratio of Males per 100 Females in Spokane?
There are 100.96 Males per 100 Females in Spokane.
What is the Ratio of Females per 100 Males in Spokane?
There are 99.05 Females per 100 Males in Spokane.
What is the Median Population Age in Spokane?
Median Population Age in Spokane is 45.4 Years.
What is the Average Family Size in Spokane
Average Family Size in Spokane is 3.7 People.
What is the Average Household Size in Spokane
Average Household Size in Spokane is 3.1 People.
How Large is the Labor Force in Spokane?
There are 143 People in the Labor Forcein in Spokane.
What is the Percentage of People in the Labor Force in Spokane?
75.3% of People are in the Labor Force in Spokane.