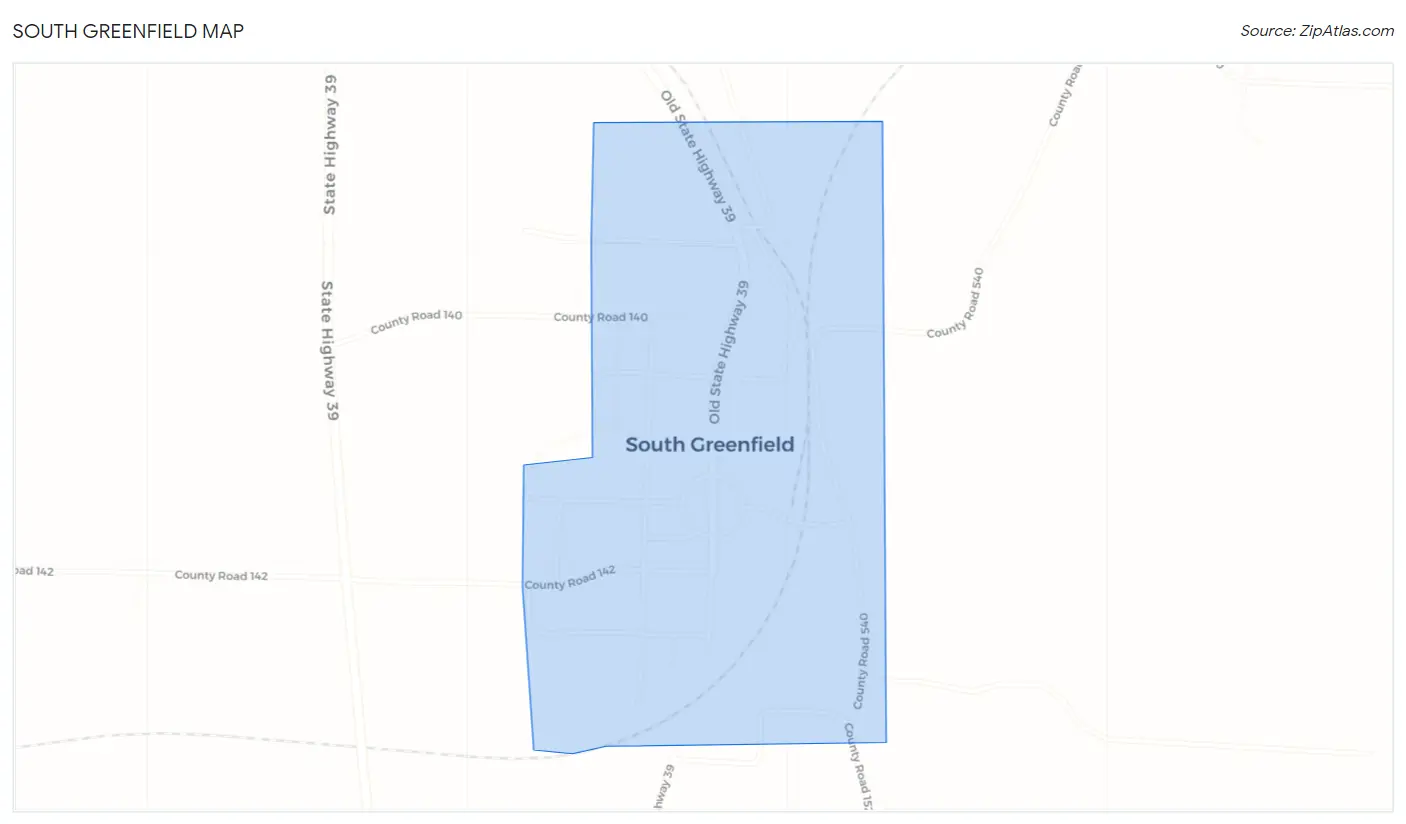
South Greenfield, MO Map & Demographics
South Greenfield Map
South Greenfield Overview
$11,890
PER CAPITA INCOME
0.45
INEQUALITY / GINI INDEX
106
TOTAL POPULATION
54
MALE POPULATION
52
FEMALE POPULATION
103.85
MALES / 100 FEMALES
96.30
FEMALES / 100 MALES
38.3
MEDIAN AGE
3.0
AVG FAMILY SIZE
2.7
AVG HOUSEHOLD SIZE
42
LABOR FORCE [ PEOPLE ]
52.5%
PERCENT IN LABOR FORCE
South Greenfield Zip Codes
South Greenfield Area Codes
Income in South Greenfield
Income Overview in South Greenfield
| Characteristic | Number | Measure |
| Per Capita Income | 106 | $11,890 |
| Median Family Income | 32 | $0 |
| Mean Family Income | 32 | $29,266 |
| Median Household Income | 39 | $0 |
| Mean Household Income | 39 | $29,246 |
| Income Deficit | 32 | $0 |
| Wage / Income Gap (%) | 106 | 0.00% |
| Wage / Income Gap ($) | 106 | 100.00¢ per $1 |
| Gini / Inequality Index | 106 | 0.45 |
Earnings by Sex in South Greenfield
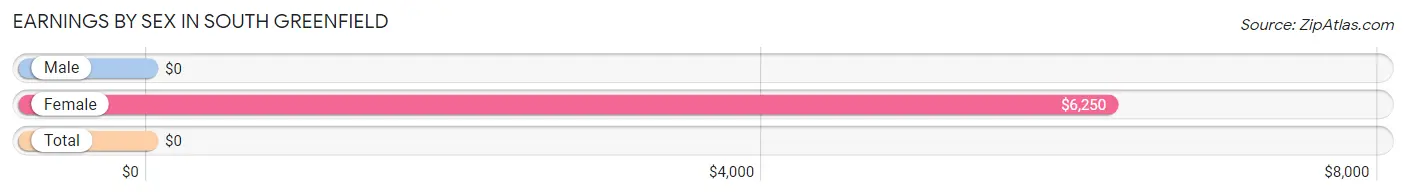
| Sex | Number | Average Earnings |
| Male | 25 (59.5%) | $0 |
| Female | 17 (40.5%) | $6,250 |
| Total | 42 (100.0%) | $0 |
Earnings by Sex by Income Bracket in South Greenfield
The most common earnings brackets in South Greenfield are $2,499 or less for men (9 | 36.0%) and $5,000 to $7,499 for women (7 | 41.2%).
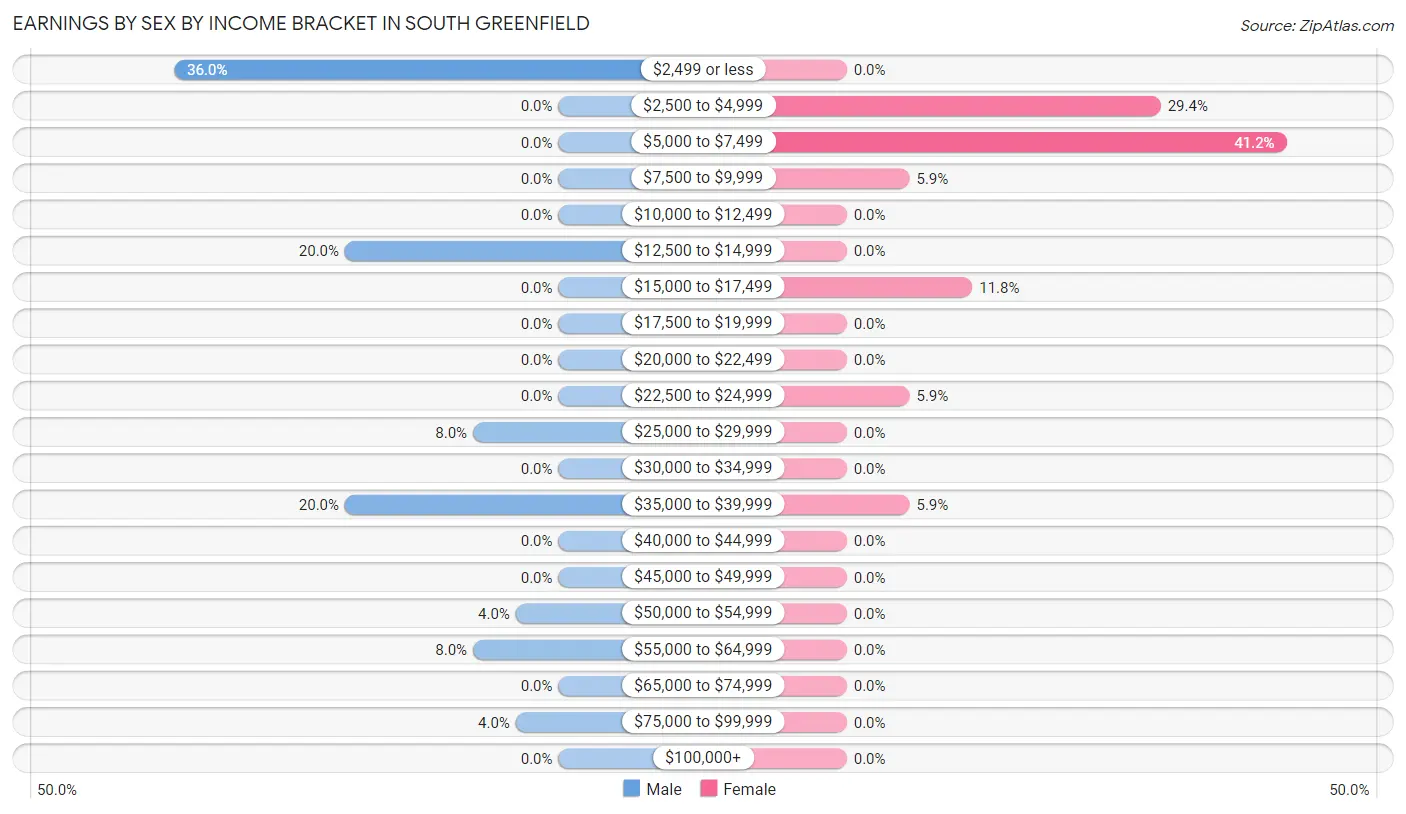
| Income | Male | Female |
| $2,499 or less | 9 (36.0%) | 0 (0.0%) |
| $2,500 to $4,999 | 0 (0.0%) | 5 (29.4%) |
| $5,000 to $7,499 | 0 (0.0%) | 7 (41.2%) |
| $7,500 to $9,999 | 0 (0.0%) | 1 (5.9%) |
| $10,000 to $12,499 | 0 (0.0%) | 0 (0.0%) |
| $12,500 to $14,999 | 5 (20.0%) | 0 (0.0%) |
| $15,000 to $17,499 | 0 (0.0%) | 2 (11.8%) |
| $17,500 to $19,999 | 0 (0.0%) | 0 (0.0%) |
| $20,000 to $22,499 | 0 (0.0%) | 0 (0.0%) |
| $22,500 to $24,999 | 0 (0.0%) | 1 (5.9%) |
| $25,000 to $29,999 | 2 (8.0%) | 0 (0.0%) |
| $30,000 to $34,999 | 0 (0.0%) | 0 (0.0%) |
| $35,000 to $39,999 | 5 (20.0%) | 1 (5.9%) |
| $40,000 to $44,999 | 0 (0.0%) | 0 (0.0%) |
| $45,000 to $49,999 | 0 (0.0%) | 0 (0.0%) |
| $50,000 to $54,999 | 1 (4.0%) | 0 (0.0%) |
| $55,000 to $64,999 | 2 (8.0%) | 0 (0.0%) |
| $65,000 to $74,999 | 0 (0.0%) | 0 (0.0%) |
| $75,000 to $99,999 | 1 (4.0%) | 0 (0.0%) |
| $100,000+ | 0 (0.0%) | 0 (0.0%) |
| Total | 25 (100.0%) | 17 (100.0%) |
Earnings by Sex by Educational Attainment in South Greenfield
| Educational Attainment | Male Income | Female Income |
| Less than High School | - | - |
| High School Diploma | - | - |
| College or Associate's Degree | - | - |
| Bachelor's Degree | - | - |
| Graduate Degree | - | - |
| Total | - | - |
Family Income in South Greenfield
Family Income Brackets in South Greenfield
According to the South Greenfield family income data, there are 12 families falling into the less than $10,000 income range, which is the most common income bracket and makes up 37.5% of all families.
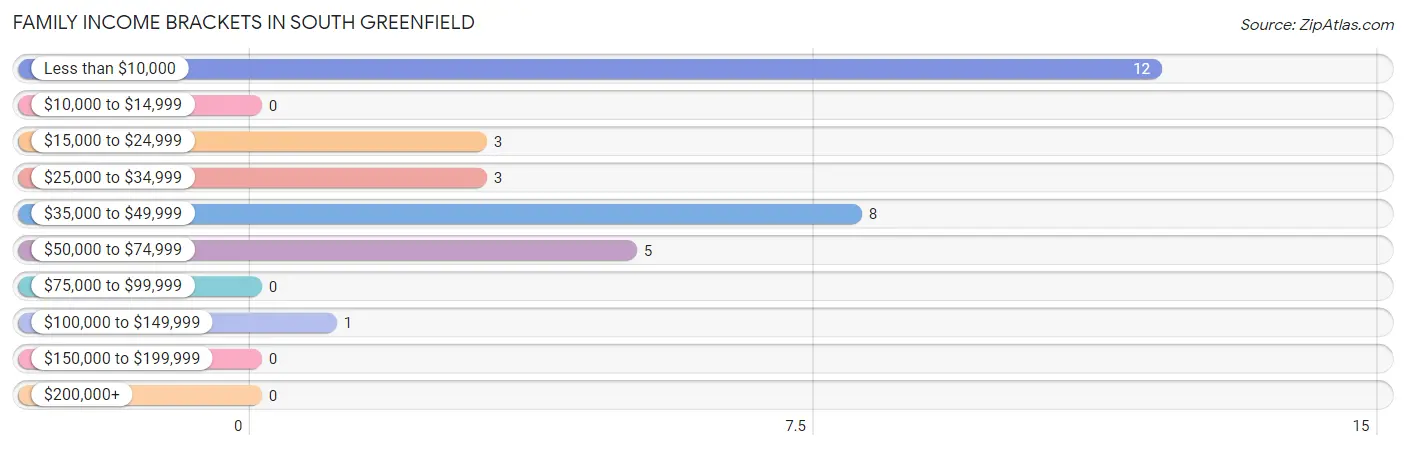
| Income Bracket | # Families | % Families |
| Less than $10,000 | 12 | 37.5% |
| $10,000 to $14,999 | 0 | 0.0% |
| $15,000 to $24,999 | 3 | 9.4% |
| $25,000 to $34,999 | 3 | 9.4% |
| $35,000 to $49,999 | 8 | 25.0% |
| $50,000 to $74,999 | 5 | 15.6% |
| $75,000 to $99,999 | 0 | 0.0% |
| $100,000 to $149,999 | 1 | 3.1% |
| $150,000 to $199,999 | 0 | 0.0% |
| $200,000+ | 0 | 0.0% |
Family Income by Famaliy Size in South Greenfield
| Income Bracket | # Families | Median Income |
| 2-Person Families | 16 (50.0%) | $0 |
| 3-Person Families | 1 (3.1%) | $0 |
| 4-Person Families | 10 (31.2%) | $0 |
| 5-Person Families | 1 (3.1%) | $0 |
| 6-Person Families | 4 (12.5%) | $0 |
| 7+ Person Families | 0 (0.0%) | $0 |
| Total | 32 (100.0%) | $0 |
Family Income by Number of Earners in South Greenfield
| Number of Earners | # Families | Median Income |
| No Earners | 4 (12.5%) | $0 |
| 1 Earner | 16 (50.0%) | $0 |
| 2 Earners | 11 (34.4%) | $0 |
| 3+ Earners | 1 (3.1%) | $0 |
| Total | 32 (100.0%) | $0 |
Household Income in South Greenfield
Household Income Brackets in South Greenfield
With 12 households falling in the category, the less than $10,000 income range is the most frequent in South Greenfield, accounting for 30.8% of all households.
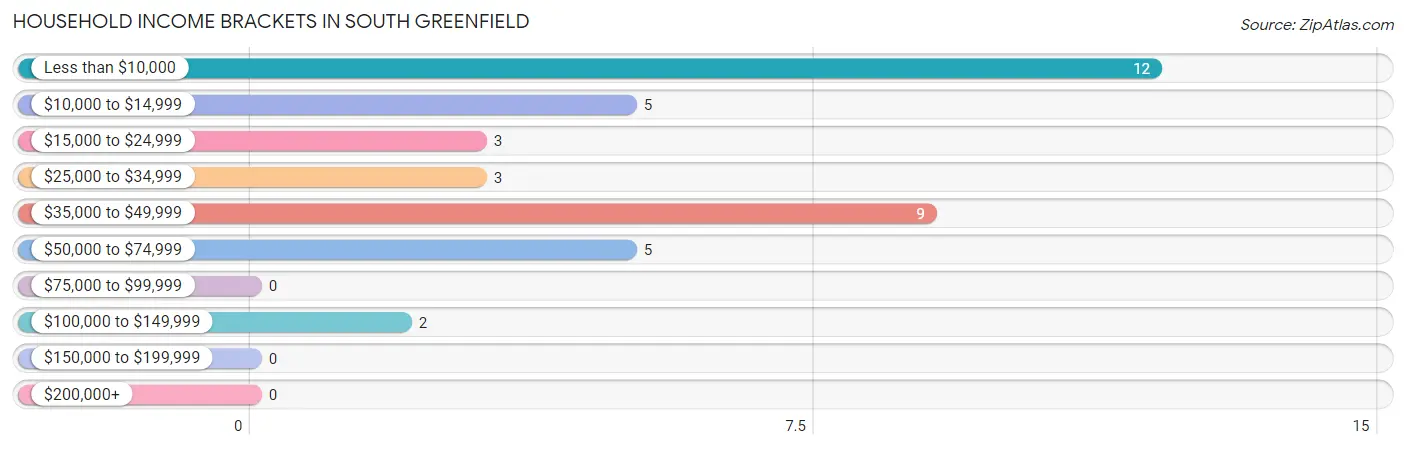
| Income Bracket | # Households | % Households |
| Less than $10,000 | 12 | 30.8% |
| $10,000 to $14,999 | 5 | 12.8% |
| $15,000 to $24,999 | 3 | 7.7% |
| $25,000 to $34,999 | 3 | 7.7% |
| $35,000 to $49,999 | 9 | 23.1% |
| $50,000 to $74,999 | 5 | 12.8% |
| $75,000 to $99,999 | 0 | 0.0% |
| $100,000 to $149,999 | 2 | 5.1% |
| $150,000 to $199,999 | 0 | 0.0% |
| $200,000+ | 0 | 0.0% |
Household Income by Householder Age in South Greenfield
The median household income in South Greenfield is $0, with the highest median household income of $40,625 found in the 65+ years age bracket for the primary householder. A total of 12 households (30.8%) fall into this category.
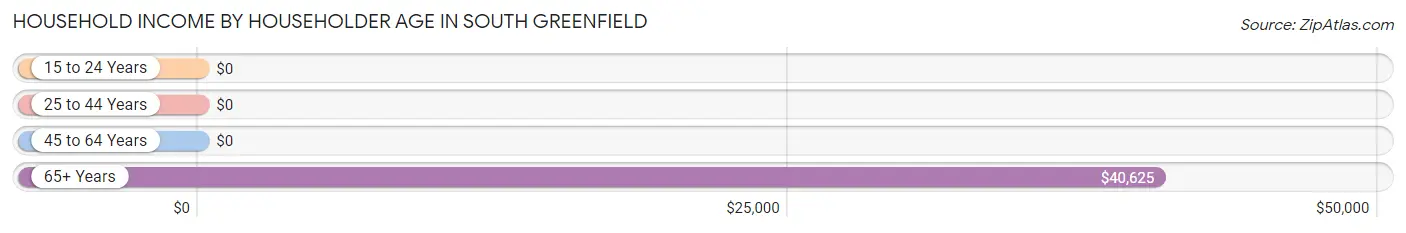
| Income Bracket | # Households | Median Income |
| 15 to 24 Years | 0 (0.0%) | $0 |
| 25 to 44 Years | 15 (38.5%) | $0 |
| 45 to 64 Years | 12 (30.8%) | $0 |
| 65+ Years | 12 (30.8%) | $40,625 |
| Total | 39 (100.0%) | $0 |
Poverty in South Greenfield
Income Below Poverty by Sex and Age in South Greenfield
With 48.1% poverty level for males and 59.6% for females among the residents of South Greenfield, 12 to 14 year old males and 15 year old females are the most vulnerable to poverty, with 4 males (100.0%) and 2 females (100.0%) in their respective age groups living below the poverty level.
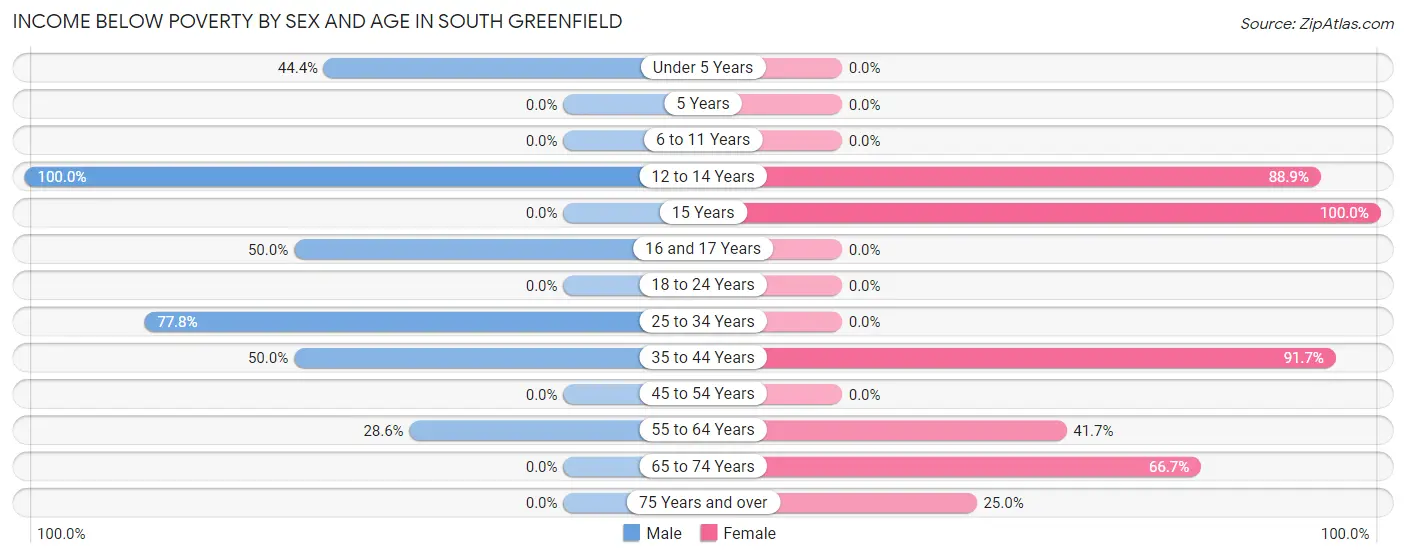
| Age Bracket | Male | Female |
| Under 5 Years | 4 (44.4%) | 0 (0.0%) |
| 5 Years | 0 (0.0%) | 0 (0.0%) |
| 6 to 11 Years | 0 (0.0%) | 0 (0.0%) |
| 12 to 14 Years | 4 (100.0%) | 8 (88.9%) |
| 15 Years | 0 (0.0%) | 2 (100.0%) |
| 16 and 17 Years | 4 (50.0%) | 0 (0.0%) |
| 18 to 24 Years | 0 (0.0%) | 0 (0.0%) |
| 25 to 34 Years | 7 (77.8%) | 0 (0.0%) |
| 35 to 44 Years | 5 (50.0%) | 11 (91.7%) |
| 45 to 54 Years | 0 (0.0%) | 0 (0.0%) |
| 55 to 64 Years | 2 (28.6%) | 5 (41.7%) |
| 65 to 74 Years | 0 (0.0%) | 2 (66.7%) |
| 75 Years and over | 0 (0.0%) | 3 (25.0%) |
| Total | 26 (48.1%) | 31 (59.6%) |
Income Above Poverty by Sex and Age in South Greenfield
According to the poverty statistics in South Greenfield, males aged 6 to 11 years and females aged 25 to 34 years are the age groups that are most secure financially, with 100.0% of males and 100.0% of females in these age groups living above the poverty line.
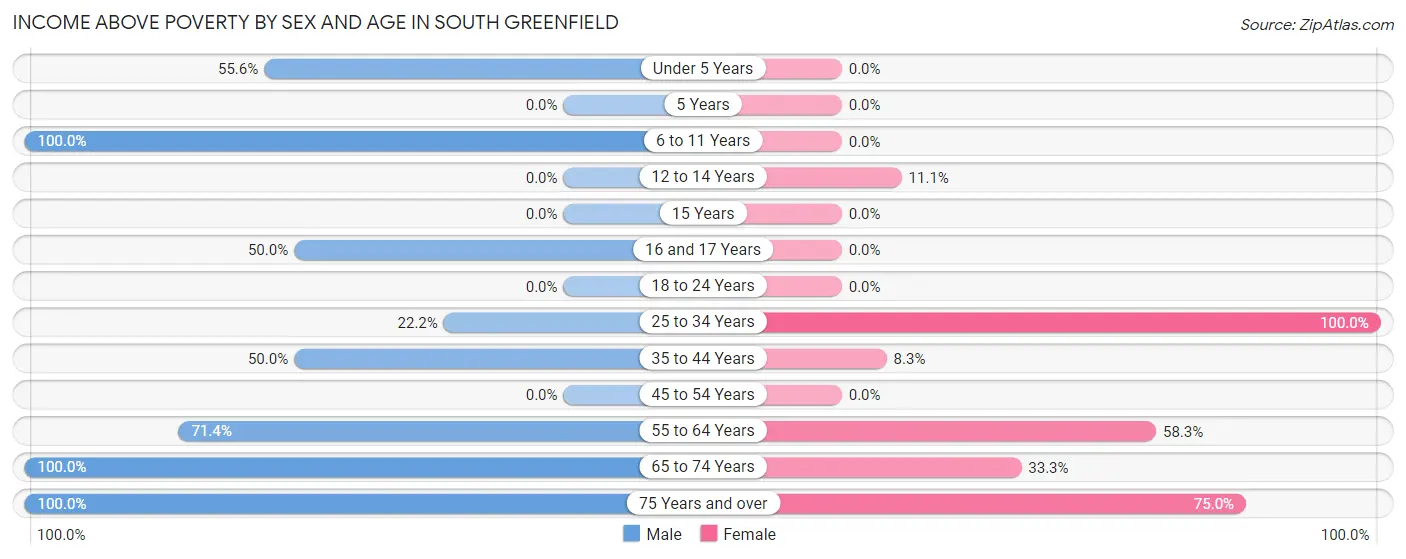
| Age Bracket | Male | Female |
| Under 5 Years | 5 (55.6%) | 0 (0.0%) |
| 5 Years | 0 (0.0%) | 0 (0.0%) |
| 6 to 11 Years | 2 (100.0%) | 0 (0.0%) |
| 12 to 14 Years | 0 (0.0%) | 1 (11.1%) |
| 15 Years | 0 (0.0%) | 0 (0.0%) |
| 16 and 17 Years | 4 (50.0%) | 0 (0.0%) |
| 18 to 24 Years | 0 (0.0%) | 0 (0.0%) |
| 25 to 34 Years | 2 (22.2%) | 2 (100.0%) |
| 35 to 44 Years | 5 (50.0%) | 1 (8.3%) |
| 45 to 54 Years | 0 (0.0%) | 0 (0.0%) |
| 55 to 64 Years | 5 (71.4%) | 7 (58.3%) |
| 65 to 74 Years | 1 (100.0%) | 1 (33.3%) |
| 75 Years and over | 4 (100.0%) | 9 (75.0%) |
| Total | 28 (51.8%) | 21 (40.4%) |
Income Below Poverty Among Married-Couple Families in South Greenfield
The poverty statistics for married-couple families in South Greenfield show that 25.0% or 4 of the total 16 families live below the poverty line. Families with 3 or 4 children have the highest poverty rate of 80.0%, comprising of 4 families. On the other hand, families with no children have the lowest poverty rate of 0.0%, which includes 0 families.
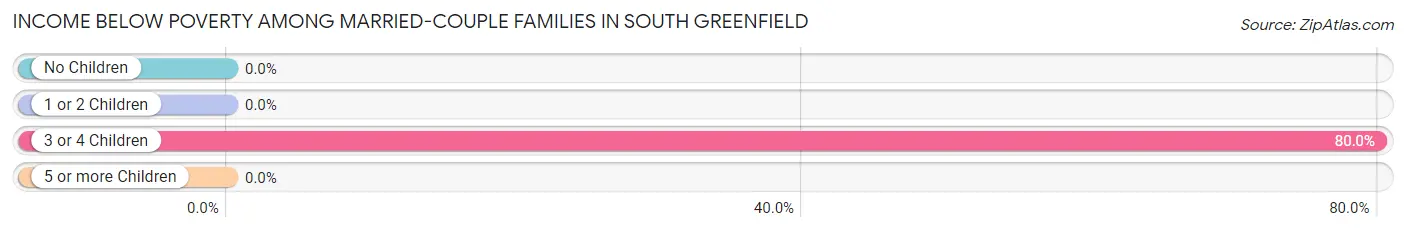
| Children | Above Poverty | Below Poverty |
| No Children | 8 (100.0%) | 0 (0.0%) |
| 1 or 2 Children | 3 (100.0%) | 0 (0.0%) |
| 3 or 4 Children | 1 (20.0%) | 4 (80.0%) |
| 5 or more Children | 0 (0.0%) | 0 (0.0%) |
| Total | 12 (75.0%) | 4 (25.0%) |
Income Below Poverty Among Single-Parent Households in South Greenfield
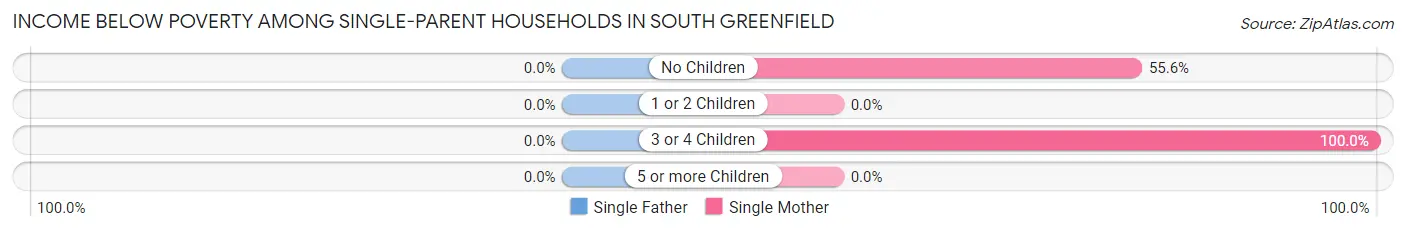
| Children | Single Father | Single Mother |
| No Children | 0 (0.0%) | 5 (55.6%) |
| 1 or 2 Children | 0 (0.0%) | 0 (0.0%) |
| 3 or 4 Children | 0 (0.0%) | 7 (100.0%) |
| 5 or more Children | 0 (0.0%) | 0 (0.0%) |
| Total | 0 (0.0%) | 12 (75.0%) |
Income Below Poverty Among Married-Couple vs Single-Parent Households in South Greenfield
The poverty data for South Greenfield shows that 4 of the married-couple family households (25.0%) and 12 of the single-parent households (75.0%) are living below the poverty level. Within the married-couple family households, those with 3 or 4 children have the highest poverty rate, with 4 households (80.0%) falling below the poverty line. Among the single-parent households, those with 3 or 4 children have the highest poverty rate, with 7 household (100.0%) living below poverty.
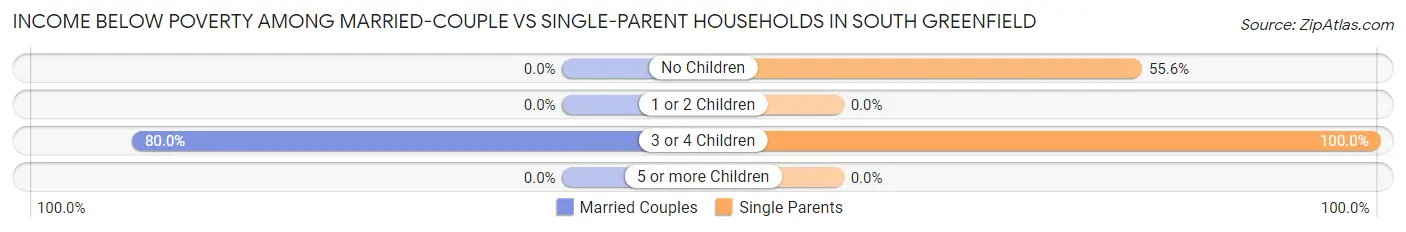
| Children | Married-Couple Families | Single-Parent Households |
| No Children | 0 (0.0%) | 5 (55.6%) |
| 1 or 2 Children | 0 (0.0%) | 0 (0.0%) |
| 3 or 4 Children | 4 (80.0%) | 7 (100.0%) |
| 5 or more Children | 0 (0.0%) | 0 (0.0%) |
| Total | 4 (25.0%) | 12 (75.0%) |
Race in South Greenfield
The most populous races in South Greenfield are White / Caucasian (92 | 86.8%), and Two or more Races (14 | 13.2%).
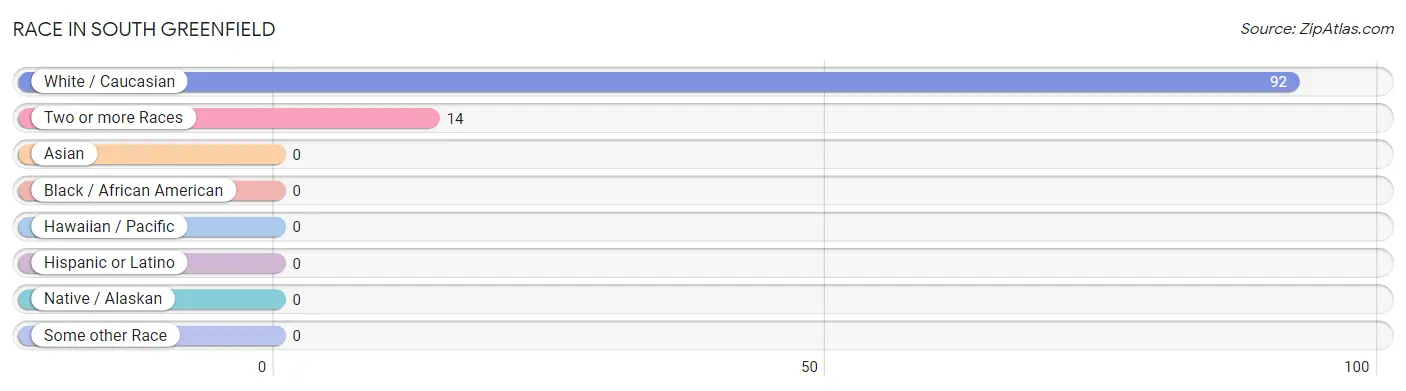
| Race | # Population | % Population |
| Asian | 0 | 0.0% |
| Black / African American | 0 | 0.0% |
| Hawaiian / Pacific | 0 | 0.0% |
| Hispanic or Latino | 0 | 0.0% |
| Native / Alaskan | 0 | 0.0% |
| White / Caucasian | 92 | 86.8% |
| Two or more Races | 14 | 13.2% |
| Some other Race | 0 | 0.0% |
| Total | 106 | 100.0% |
Ancestry in South Greenfield
The most populous ancestries reported in South Greenfield are German (34 | 32.1%), Cherokee (14 | 13.2%), Blackfeet (13 | 12.3%), Swedish (13 | 12.3%), and European (12 | 11.3%), together accounting for 81.1% of all South Greenfield residents.
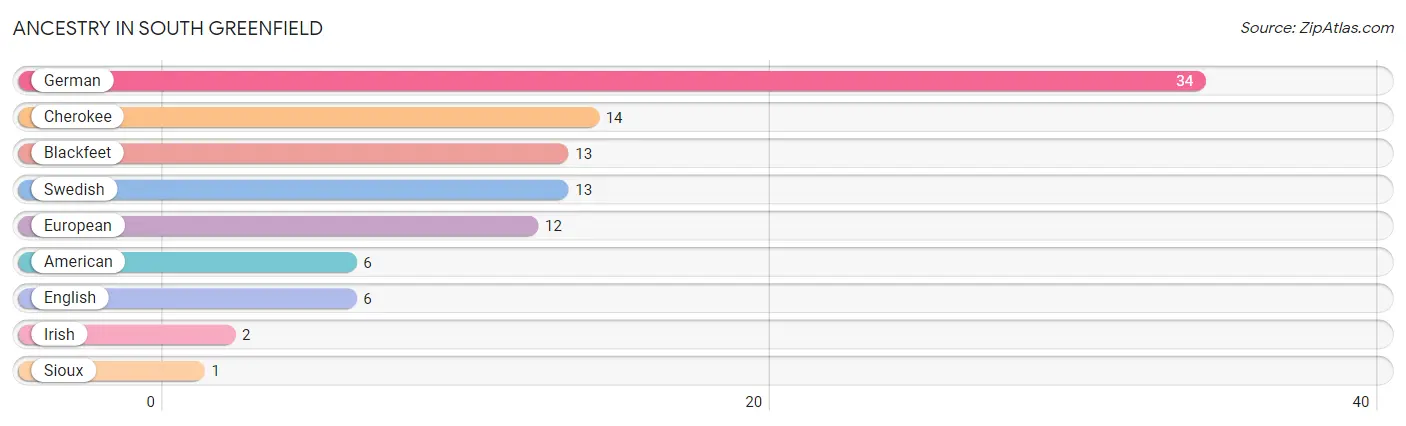
| Ancestry | # Population | % Population |
| American | 6 | 5.7% |
| Blackfeet | 13 | 12.3% |
| Cherokee | 14 | 13.2% |
| English | 6 | 5.7% |
| European | 12 | 11.3% |
| German | 34 | 32.1% |
| Irish | 2 | 1.9% |
| Sioux | 1 | 0.9% |
| Swedish | 13 | 12.3% | View All 9 Rows |
Immigrants in South Greenfield

| Immigration Origin | # Population | % Population | View All 0 Rows |
Sex and Age in South Greenfield
Sex and Age in South Greenfield
The most populous age groups in South Greenfield are 35 to 39 Years (10 | 18.5%) for men and 35 to 39 Years (12 | 23.1%) for women.
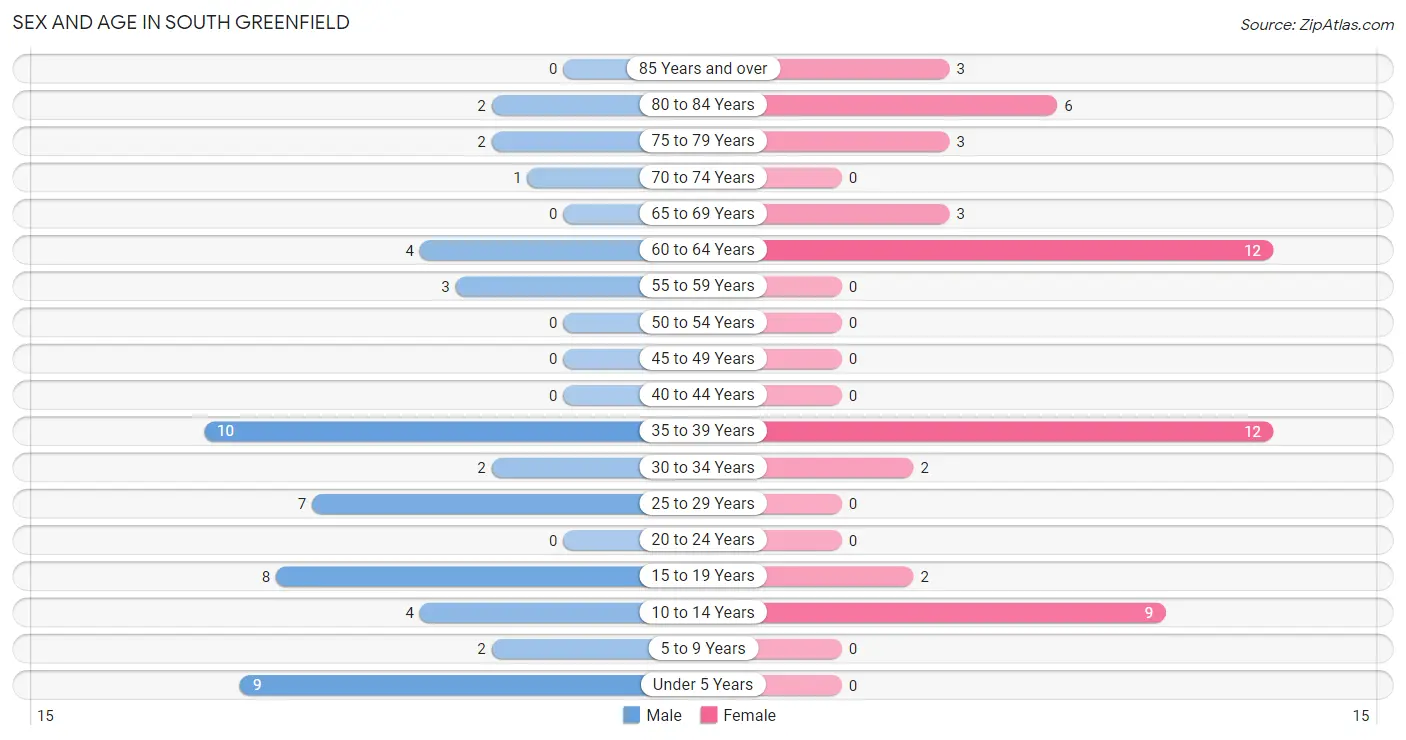
| Age Bracket | Male | Female |
| Under 5 Years | 9 (16.7%) | 0 (0.0%) |
| 5 to 9 Years | 2 (3.7%) | 0 (0.0%) |
| 10 to 14 Years | 4 (7.4%) | 9 (17.3%) |
| 15 to 19 Years | 8 (14.8%) | 2 (3.8%) |
| 20 to 24 Years | 0 (0.0%) | 0 (0.0%) |
| 25 to 29 Years | 7 (13.0%) | 0 (0.0%) |
| 30 to 34 Years | 2 (3.7%) | 2 (3.8%) |
| 35 to 39 Years | 10 (18.5%) | 12 (23.1%) |
| 40 to 44 Years | 0 (0.0%) | 0 (0.0%) |
| 45 to 49 Years | 0 (0.0%) | 0 (0.0%) |
| 50 to 54 Years | 0 (0.0%) | 0 (0.0%) |
| 55 to 59 Years | 3 (5.6%) | 0 (0.0%) |
| 60 to 64 Years | 4 (7.4%) | 12 (23.1%) |
| 65 to 69 Years | 0 (0.0%) | 3 (5.8%) |
| 70 to 74 Years | 1 (1.8%) | 0 (0.0%) |
| 75 to 79 Years | 2 (3.7%) | 3 (5.8%) |
| 80 to 84 Years | 2 (3.7%) | 6 (11.5%) |
| 85 Years and over | 0 (0.0%) | 3 (5.8%) |
| Total | 54 (100.0%) | 52 (100.0%) |
Families and Households in South Greenfield
Median Family Size in South Greenfield
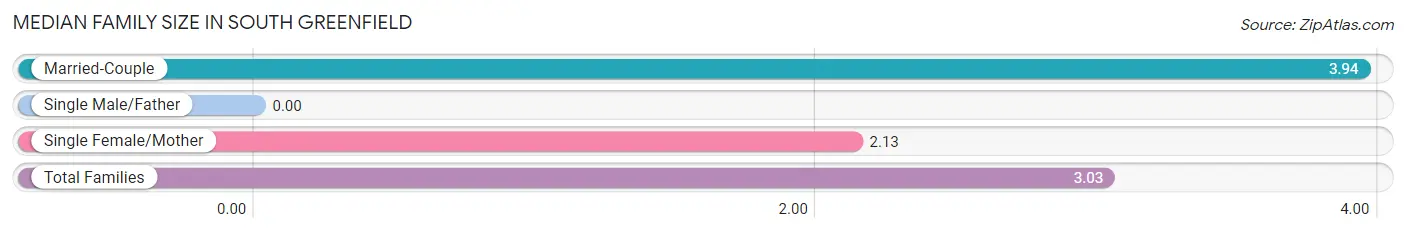
| Family Type | # Families | Family Size |
| Married-Couple | 16 (50.0%) | 3.94 |
| Single Male/Father | 0 (0.0%) | - |
| Single Female/Mother | 16 (50.0%) | 2.13 |
| Total Families | 32 (100.0%) | 3.03 |
Median Household Size in South Greenfield
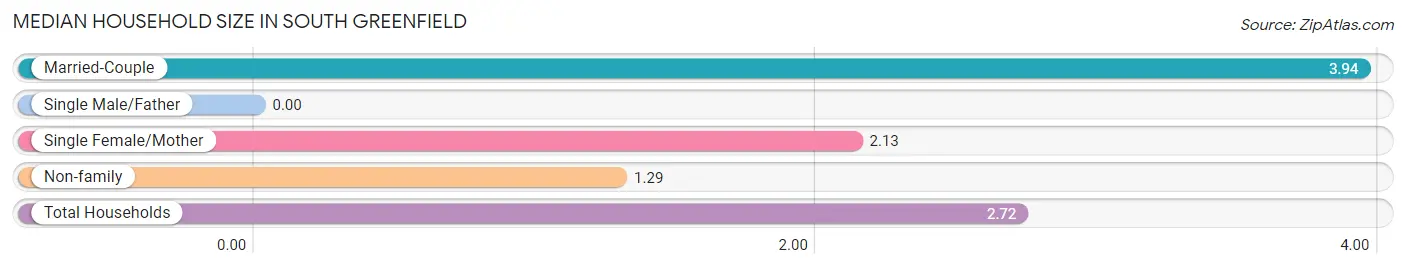
| Household Type | # Households | Household Size |
| Married-Couple | 16 (41.0%) | 3.94 |
| Single Male/Father | 0 (0.0%) | - |
| Single Female/Mother | 16 (41.0%) | 2.13 |
| Non-family | 7 (17.9%) | 1.29 |
| Total Households | 39 (100.0%) | 2.72 |
Household Size by Marriage Status in South Greenfield
Out of a total of 39 households in South Greenfield, 32 (82.1%) are family households, while 7 (17.9%) are nonfamily households. The most numerous type of family households are 2-person households, comprising 16, and the most common type of nonfamily households are 1-person households, comprising 6.
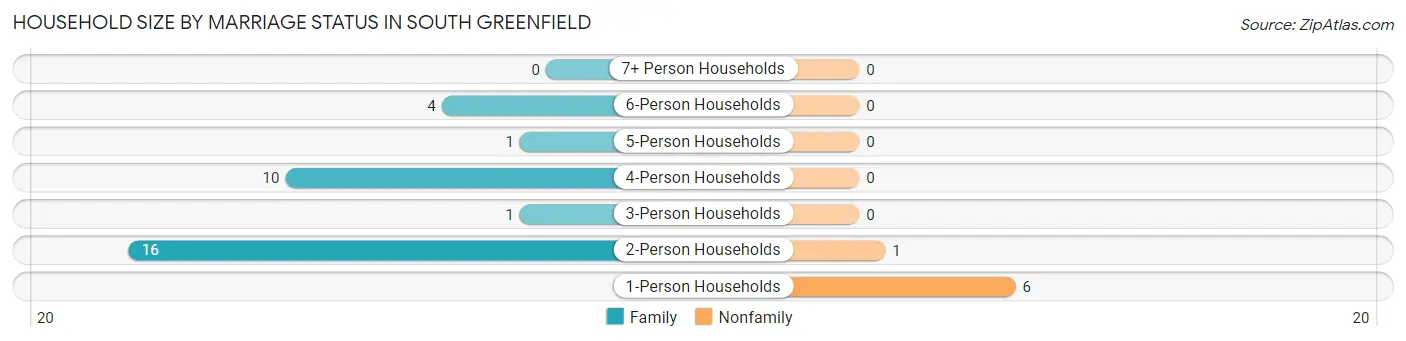
| Household Size | Family Households | Nonfamily Households |
| 1-Person Households | - | 6 (15.4%) |
| 2-Person Households | 16 (41.0%) | 1 (2.6%) |
| 3-Person Households | 1 (2.6%) | 0 (0.0%) |
| 4-Person Households | 10 (25.6%) | 0 (0.0%) |
| 5-Person Households | 1 (2.6%) | 0 (0.0%) |
| 6-Person Households | 4 (10.3%) | 0 (0.0%) |
| 7+ Person Households | 0 (0.0%) | 0 (0.0%) |
| Total | 32 (82.1%) | 7 (17.9%) |
Female Fertility in South Greenfield
Fertility by Age in South Greenfield
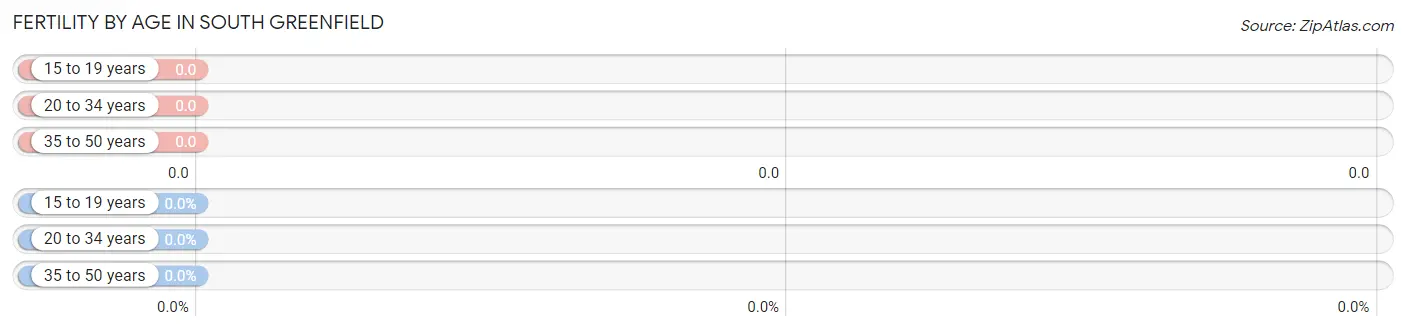
| Age Bracket | Women with Births | Births / 1,000 Women |
| 15 to 19 years | 0 (0.0%) | 0.0 |
| 20 to 34 years | 0 (0.0%) | 0.0 |
| 35 to 50 years | 0 (0.0%) | 0.0 |
| Total | 0 (0.0%) | 0.0 |
Fertility by Age by Marriage Status in South Greenfield
| Age Bracket | Married | Unmarried |
| 15 to 19 years | 0 (0.0%) | 0 (0.0%) |
| 20 to 34 years | 0 (0.0%) | 0 (0.0%) |
| 35 to 50 years | 0 (0.0%) | 0 (0.0%) |
| Total | 0 (0.0%) | 0 (0.0%) |
Fertility by Education in South Greenfield
| Educational Attainment | Women with Births | Births / 1,000 Women |
| Less than High School | 0 (0.0%) | 0.0 |
| High School Diploma | 0 (0.0%) | 0.0 |
| College or Associate's Degree | 0 (0.0%) | 0.0 |
| Bachelor's Degree | 0 (0.0%) | 0.0 |
| Graduate Degree | 0 (0.0%) | 0.0 |
| Total | 0 (0.0%) | 0.0 |
Fertility by Education by Marriage Status in South Greenfield
| Educational Attainment | Married | Unmarried |
| Less than High School | 0 (0.0%) | 0 (0.0%) |
| High School Diploma | 0 (0.0%) | 0 (0.0%) |
| College or Associate's Degree | 0 (0.0%) | 0 (0.0%) |
| Bachelor's Degree | 0 (0.0%) | 0 (0.0%) |
| Graduate Degree | 0 (0.0%) | 0 (0.0%) |
| Total | 0 (0.0%) | 0 (0.0%) |
Employment Characteristics in South Greenfield
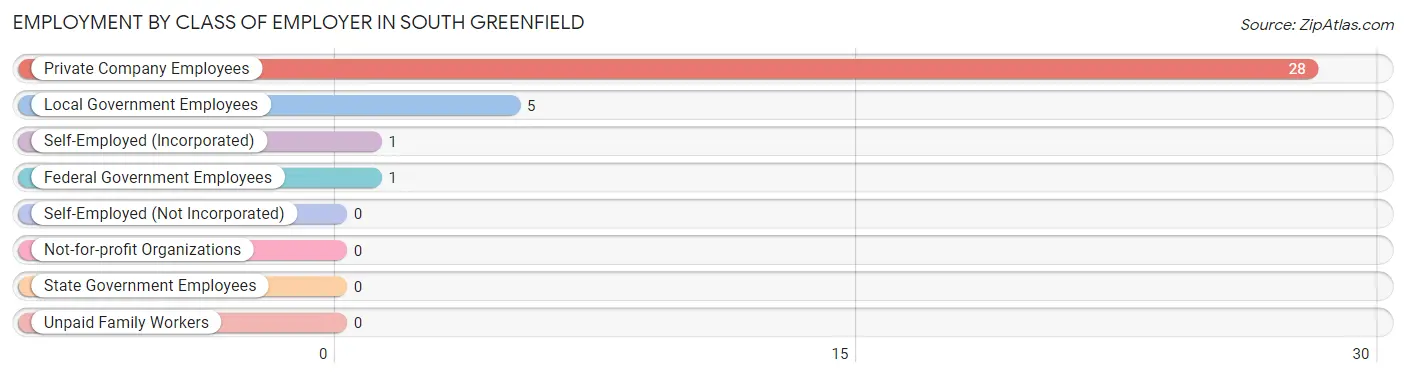
Employment by Class of Employer in South Greenfield
Among the 35 employed individuals in South Greenfield, private company employees (28 | 80.0%), local government employees (5 | 14.3%), and self-employed (incorporated) (1 | 2.9%) make up the most common classes of employment.
| Employer Class | # Employees | % Employees |
| Private Company Employees | 28 | 80.0% |
| Self-Employed (Incorporated) | 1 | 2.9% |
| Self-Employed (Not Incorporated) | 0 | 0.0% |
| Not-for-profit Organizations | 0 | 0.0% |
| Local Government Employees | 5 | 14.3% |
| State Government Employees | 0 | 0.0% |
| Federal Government Employees | 1 | 2.9% |
| Unpaid Family Workers | 0 | 0.0% |
| Total | 35 | 100.0% |
Employment Status by Age in South Greenfield
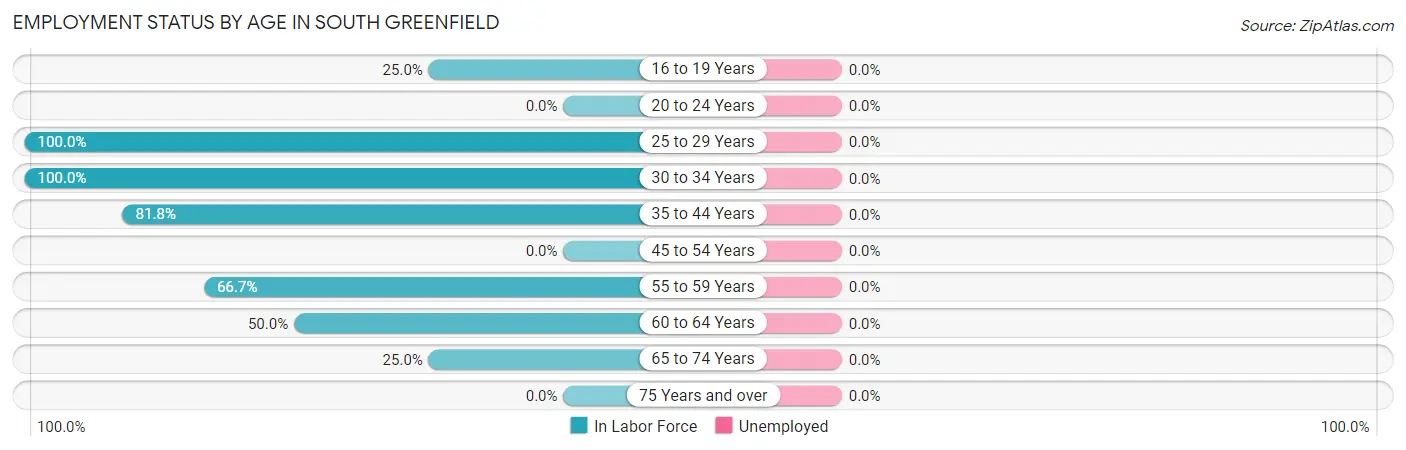
| Age Bracket | In Labor Force | Unemployed |
| 16 to 19 Years | 2 (25.0%) | 0 (0.0%) |
| 20 to 24 Years | 0 (0.0%) | 0 (0.0%) |
| 25 to 29 Years | 7 (100.0%) | 0 (0.0%) |
| 30 to 34 Years | 4 (100.0%) | 0 (0.0%) |
| 35 to 44 Years | 18 (81.8%) | 0 (0.0%) |
| 45 to 54 Years | 0 (0.0%) | 0 (0.0%) |
| 55 to 59 Years | 2 (66.7%) | 0 (0.0%) |
| 60 to 64 Years | 8 (50.0%) | 0 (0.0%) |
| 65 to 74 Years | 1 (25.0%) | 0 (0.0%) |
| 75 Years and over | 0 (0.0%) | 0 (0.0%) |
| Total | 42 (52.5%) | 0 (0.0%) |
Employment Status by Educational Attainment in South Greenfield
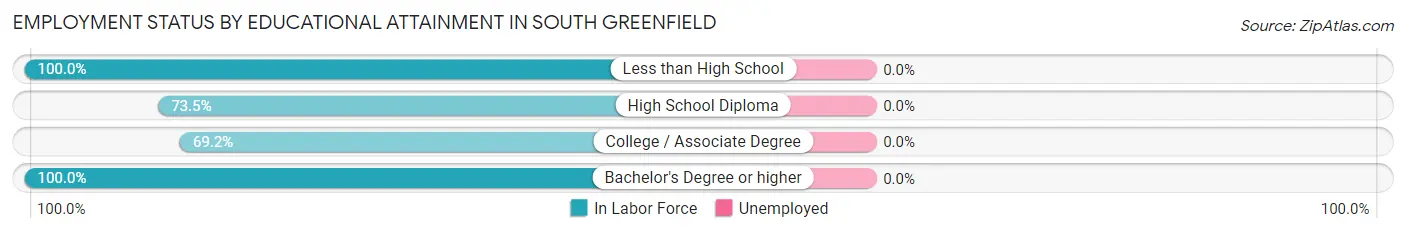
| Educational Attainment | In Labor Force | Unemployed |
| Less than High School | 3 (100.0%) | 0 (0.0%) |
| High School Diploma | 25 (73.5%) | 0 (0.0%) |
| College / Associate Degree | 9 (69.2%) | 0 (0.0%) |
| Bachelor's Degree or higher | 2 (100.0%) | 0 (0.0%) |
| Total | 39 (75.0%) | 0 (0.0%) |
Employment Occupations by Sex in South Greenfield
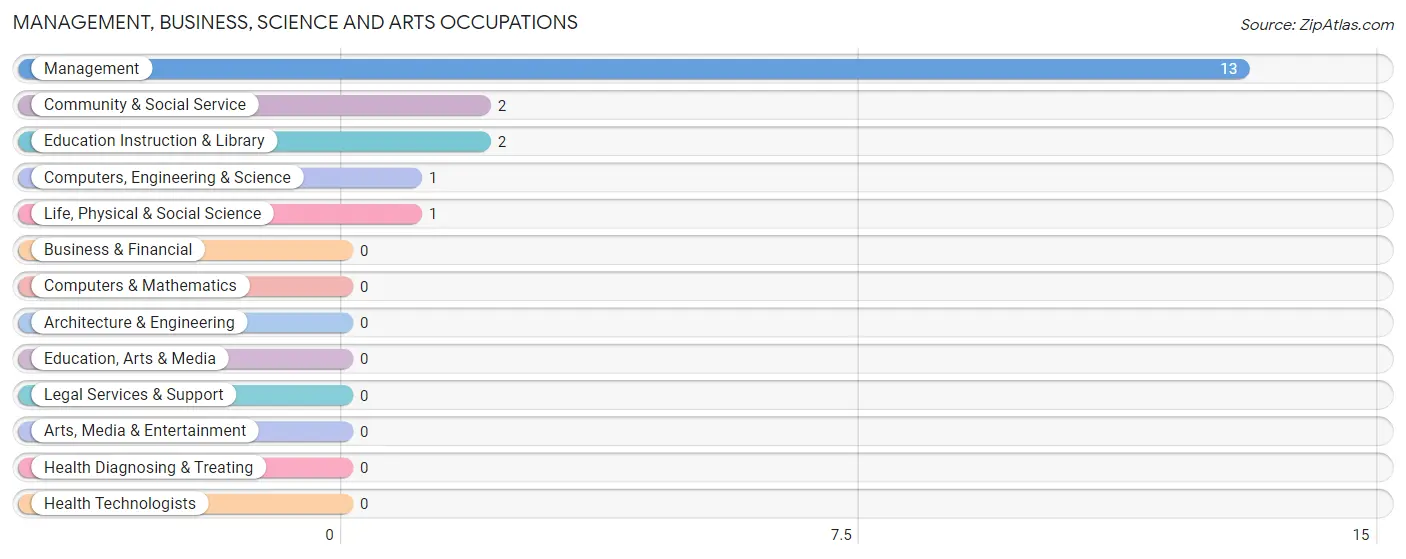
Management, Business, Science and Arts Occupations
The most common Management, Business, Science and Arts occupations in South Greenfield are Management (13 | 30.9%), Community & Social Service (2 | 4.8%), Education Instruction & Library (2 | 4.8%), Computers, Engineering & Science (1 | 2.4%), and Life, Physical & Social Science (1 | 2.4%).
Management, Business, Science and Arts Occupations by Sex
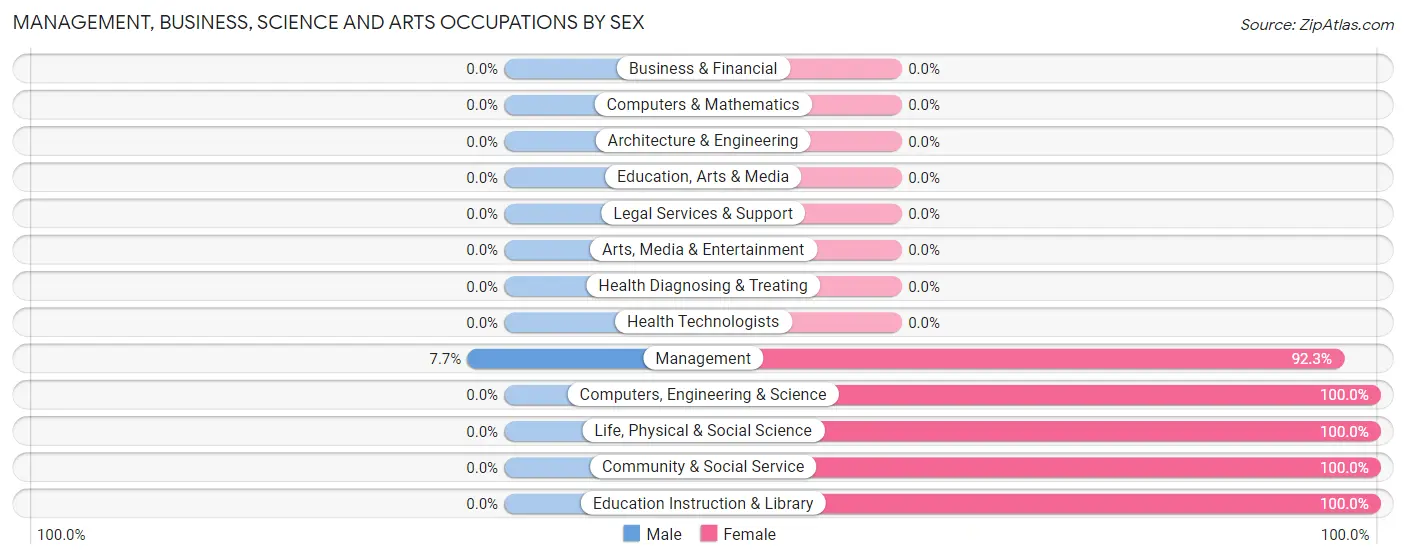
| Occupation | Male | Female |
| Management | 1 (7.7%) | 12 (92.3%) |
| Business & Financial | 0 (0.0%) | 0 (0.0%) |
| Computers, Engineering & Science | 0 (0.0%) | 1 (100.0%) |
| Computers & Mathematics | 0 (0.0%) | 0 (0.0%) |
| Architecture & Engineering | 0 (0.0%) | 0 (0.0%) |
| Life, Physical & Social Science | 0 (0.0%) | 1 (100.0%) |
| Community & Social Service | 0 (0.0%) | 2 (100.0%) |
| Education, Arts & Media | 0 (0.0%) | 0 (0.0%) |
| Legal Services & Support | 0 (0.0%) | 0 (0.0%) |
| Education Instruction & Library | 0 (0.0%) | 2 (100.0%) |
| Arts, Media & Entertainment | 0 (0.0%) | 0 (0.0%) |
| Health Diagnosing & Treating | 0 (0.0%) | 0 (0.0%) |
| Health Technologists | 0 (0.0%) | 0 (0.0%) |
| Total (Category) | 1 (6.2%) | 15 (93.8%) |
| Total (Overall) | 25 (59.5%) | 17 (40.5%) |
Services Occupations
The most common Services occupations in South Greenfield are , and Healthcare Support (1 | 2.4%).
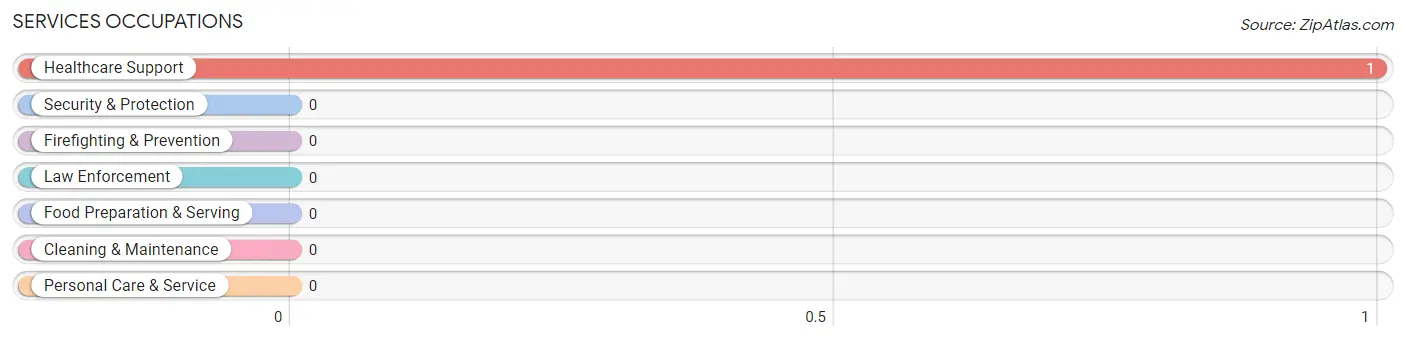
Services Occupations by Sex
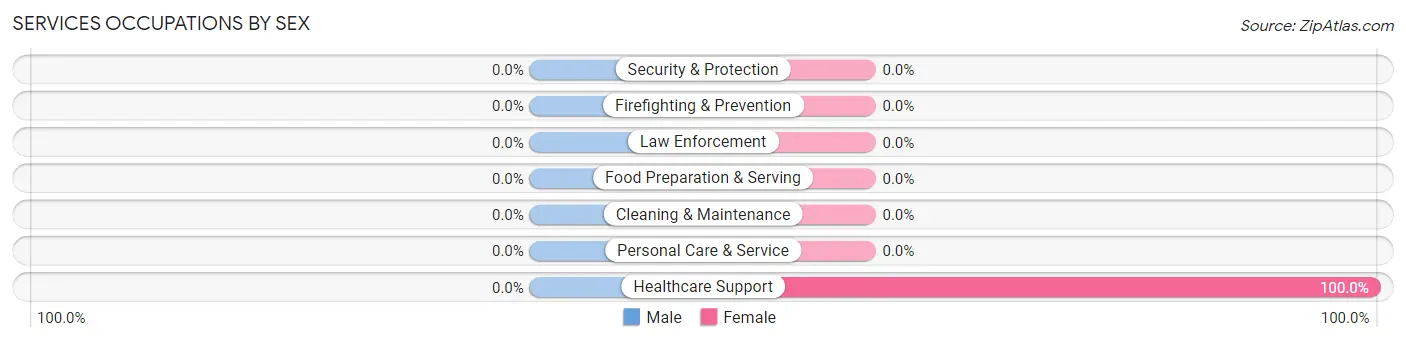
| Occupation | Male | Female |
| Healthcare Support | 0 (0.0%) | 1 (100.0%) |
| Security & Protection | 0 (0.0%) | 0 (0.0%) |
| Firefighting & Prevention | 0 (0.0%) | 0 (0.0%) |
| Law Enforcement | 0 (0.0%) | 0 (0.0%) |
| Food Preparation & Serving | 0 (0.0%) | 0 (0.0%) |
| Cleaning & Maintenance | 0 (0.0%) | 0 (0.0%) |
| Personal Care & Service | 0 (0.0%) | 0 (0.0%) |
| Total (Category) | 0 (0.0%) | 1 (100.0%) |
| Total (Overall) | 25 (59.5%) | 17 (40.5%) |
Sales and Office Occupations
The most common Sales and Office occupations in South Greenfield are Sales & Related (5 | 11.9%), and Office & Administration (1 | 2.4%).
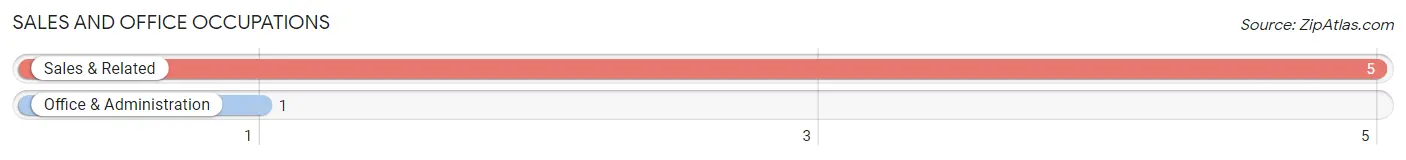
Sales and Office Occupations by Sex
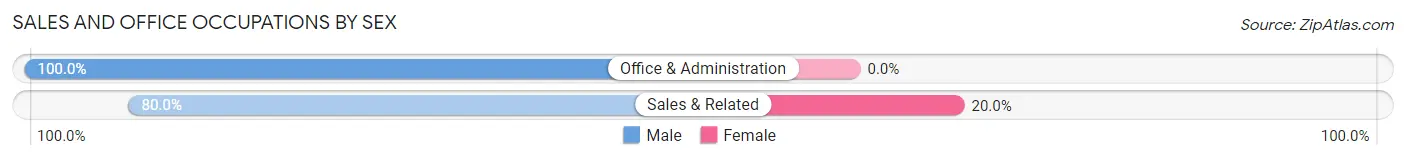
| Occupation | Male | Female |
| Sales & Related | 4 (80.0%) | 1 (20.0%) |
| Office & Administration | 1 (100.0%) | 0 (0.0%) |
| Total (Category) | 5 (83.3%) | 1 (16.7%) |
| Total (Overall) | 25 (59.5%) | 17 (40.5%) |
Natural Resources, Construction and Maintenance Occupations
The most common Natural Resources, Construction and Maintenance occupations in South Greenfield are , and Construction & Extraction (5 | 11.9%).
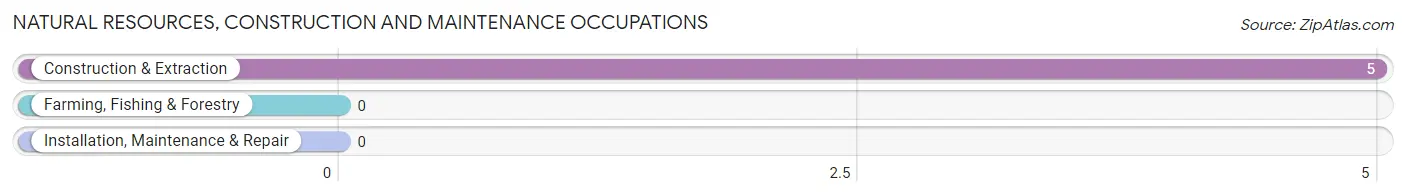
Natural Resources, Construction and Maintenance Occupations by Sex
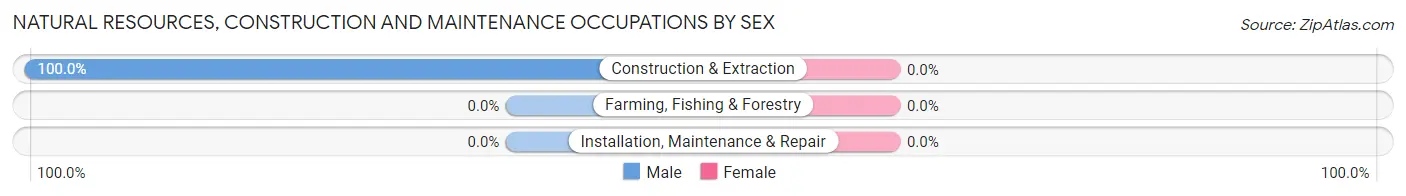
| Occupation | Male | Female |
| Farming, Fishing & Forestry | 0 (0.0%) | 0 (0.0%) |
| Construction & Extraction | 5 (100.0%) | 0 (0.0%) |
| Installation, Maintenance & Repair | 0 (0.0%) | 0 (0.0%) |
| Total (Category) | 5 (100.0%) | 0 (0.0%) |
| Total (Overall) | 25 (59.5%) | 17 (40.5%) |
Production, Transportation and Moving Occupations
The most common Production, Transportation and Moving occupations in South Greenfield are Material Moving (9 | 21.4%), Production (3 | 7.1%), and Transportation (2 | 4.8%).
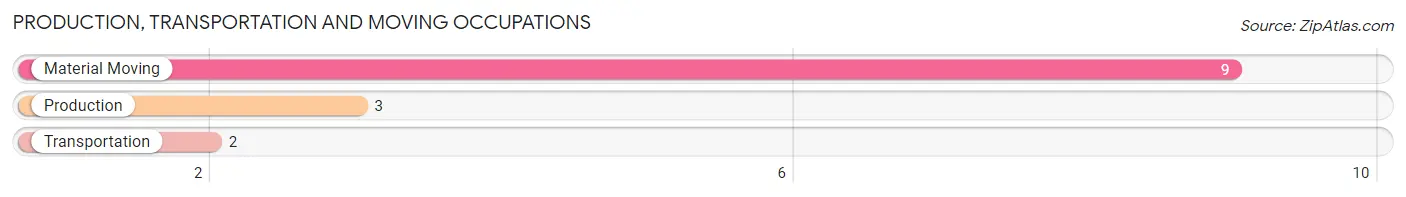
Production, Transportation and Moving Occupations by Sex
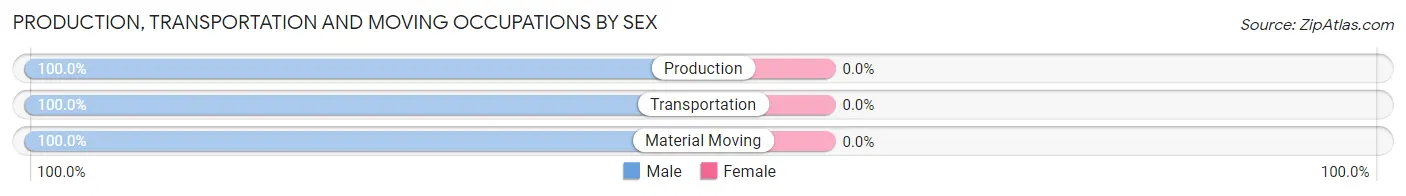
| Occupation | Male | Female |
| Production | 3 (100.0%) | 0 (0.0%) |
| Transportation | 2 (100.0%) | 0 (0.0%) |
| Material Moving | 9 (100.0%) | 0 (0.0%) |
| Total (Category) | 14 (100.0%) | 0 (0.0%) |
| Total (Overall) | 25 (59.5%) | 17 (40.5%) |
Employment Industries by Sex in South Greenfield
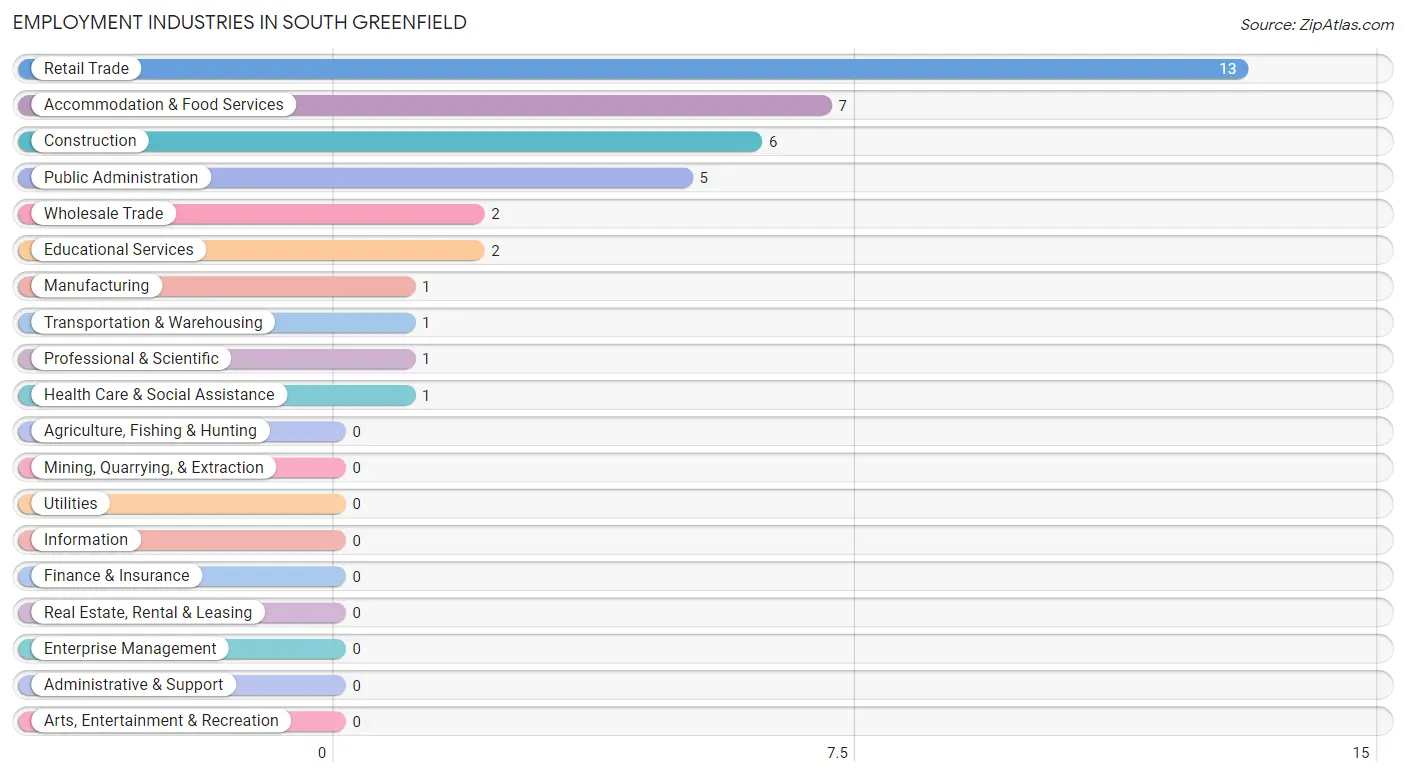
Employment Industries in South Greenfield
The major employment industries in South Greenfield include Retail Trade (13 | 30.9%), Accommodation & Food Services (7 | 16.7%), Construction (6 | 14.3%), Public Administration (5 | 11.9%), and Wholesale Trade (2 | 4.8%).
Employment Industries by Sex in South Greenfield
The South Greenfield industries that see more men than women are Construction (100.0%), Wholesale Trade (100.0%), and Retail Trade (100.0%), whereas the industries that tend to have a higher number of women are Manufacturing (100.0%), Professional & Scientific (100.0%), and Educational Services (100.0%).
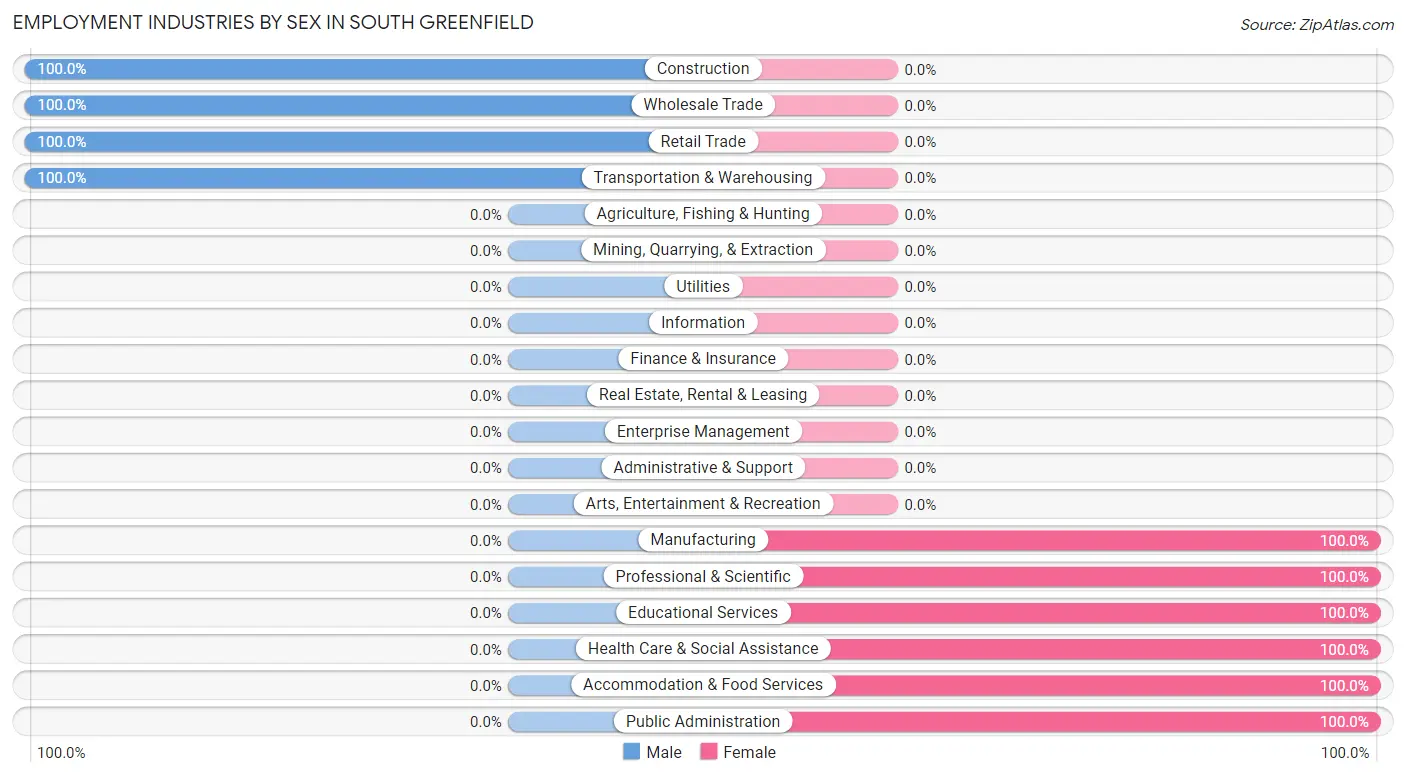
| Industry | Male | Female |
| Agriculture, Fishing & Hunting | 0 (0.0%) | 0 (0.0%) |
| Mining, Quarrying, & Extraction | 0 (0.0%) | 0 (0.0%) |
| Construction | 6 (100.0%) | 0 (0.0%) |
| Manufacturing | 0 (0.0%) | 1 (100.0%) |
| Wholesale Trade | 2 (100.0%) | 0 (0.0%) |
| Retail Trade | 13 (100.0%) | 0 (0.0%) |
| Transportation & Warehousing | 1 (100.0%) | 0 (0.0%) |
| Utilities | 0 (0.0%) | 0 (0.0%) |
| Information | 0 (0.0%) | 0 (0.0%) |
| Finance & Insurance | 0 (0.0%) | 0 (0.0%) |
| Real Estate, Rental & Leasing | 0 (0.0%) | 0 (0.0%) |
| Professional & Scientific | 0 (0.0%) | 1 (100.0%) |
| Enterprise Management | 0 (0.0%) | 0 (0.0%) |
| Administrative & Support | 0 (0.0%) | 0 (0.0%) |
| Educational Services | 0 (0.0%) | 2 (100.0%) |
| Health Care & Social Assistance | 0 (0.0%) | 1 (100.0%) |
| Arts, Entertainment & Recreation | 0 (0.0%) | 0 (0.0%) |
| Accommodation & Food Services | 0 (0.0%) | 7 (100.0%) |
| Public Administration | 0 (0.0%) | 5 (100.0%) |
| Total | 25 (59.5%) | 17 (40.5%) |
Education in South Greenfield
School Enrollment in South Greenfield
The most common levels of schooling among the 27 students in South Greenfield are high school (14 | 51.8%), middle school (9 | 33.3%), and nursery / preschool (2 | 7.4%).
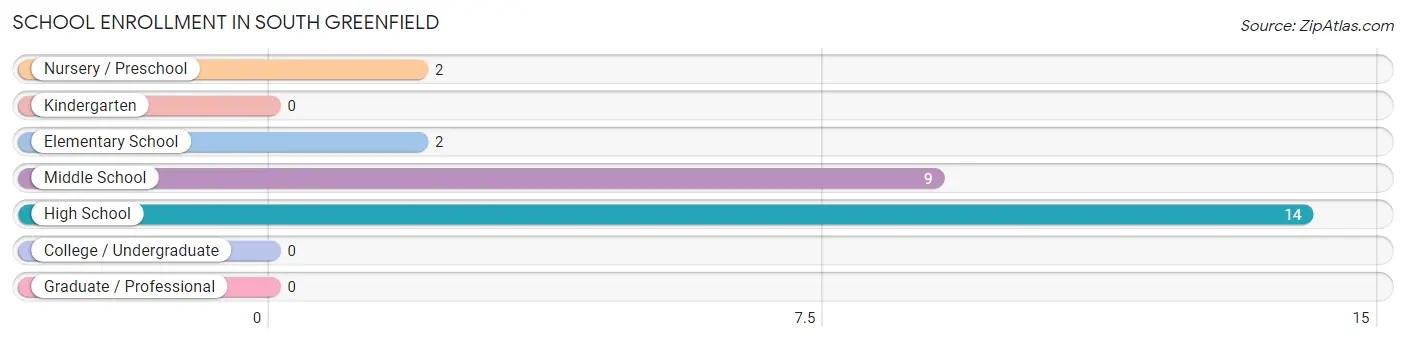
| School Level | # Students | % Students |
| Nursery / Preschool | 2 | 7.4% |
| Kindergarten | 0 | 0.0% |
| Elementary School | 2 | 7.4% |
| Middle School | 9 | 33.3% |
| High School | 14 | 51.8% |
| College / Undergraduate | 0 | 0.0% |
| Graduate / Professional | 0 | 0.0% |
| Total | 27 | 100.0% |
School Enrollment by Age by Funding Source in South Greenfield
Out of a total of 27 students who are enrolled in schools in South Greenfield, 8 (29.6%) attend a private institution, while the remaining 19 (70.4%) are enrolled in public schools. The age group of 3 to 4 year olds has the highest likelihood of being enrolled in private schools, with 2 (100.0% in the age bracket) enrolled. Conversely, the age group of 5 to 9 year old has the lowest likelihood of being enrolled in a private school, with 2 (100.0% in the age bracket) attending a public institution.
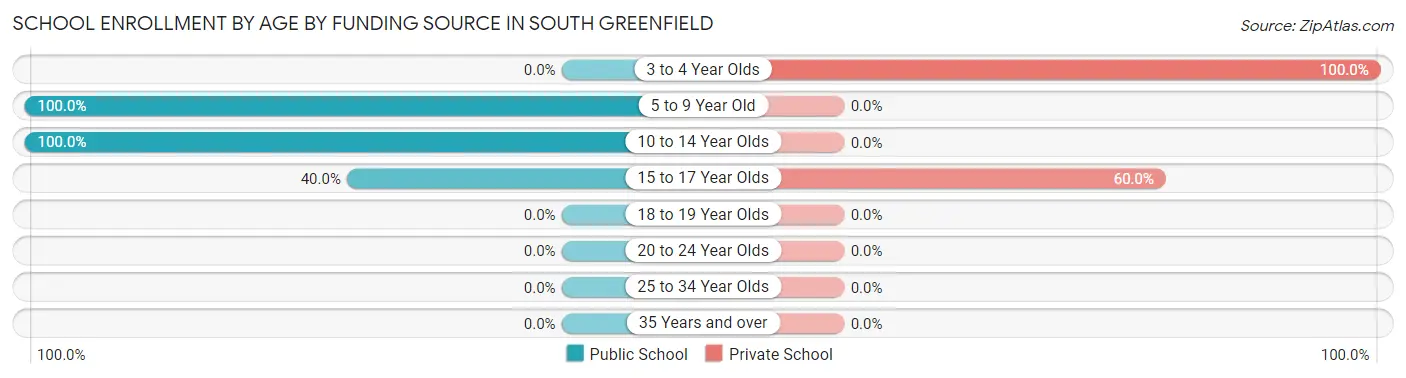
| Age Bracket | Public School | Private School |
| 3 to 4 Year Olds | 0 (0.0%) | 2 (100.0%) |
| 5 to 9 Year Old | 2 (100.0%) | 0 (0.0%) |
| 10 to 14 Year Olds | 13 (100.0%) | 0 (0.0%) |
| 15 to 17 Year Olds | 4 (40.0%) | 6 (60.0%) |
| 18 to 19 Year Olds | 0 (0.0%) | 0 (0.0%) |
| 20 to 24 Year Olds | 0 (0.0%) | 0 (0.0%) |
| 25 to 34 Year Olds | 0 (0.0%) | 0 (0.0%) |
| 35 Years and over | 0 (0.0%) | 0 (0.0%) |
| Total | 19 (70.4%) | 8 (29.6%) |
Educational Attainment by Field of Study in South Greenfield
, and arts & humanities (2 | 100.0%) are the most common fields of study among 2 individuals in South Greenfield who have obtained a bachelor's degree or higher.
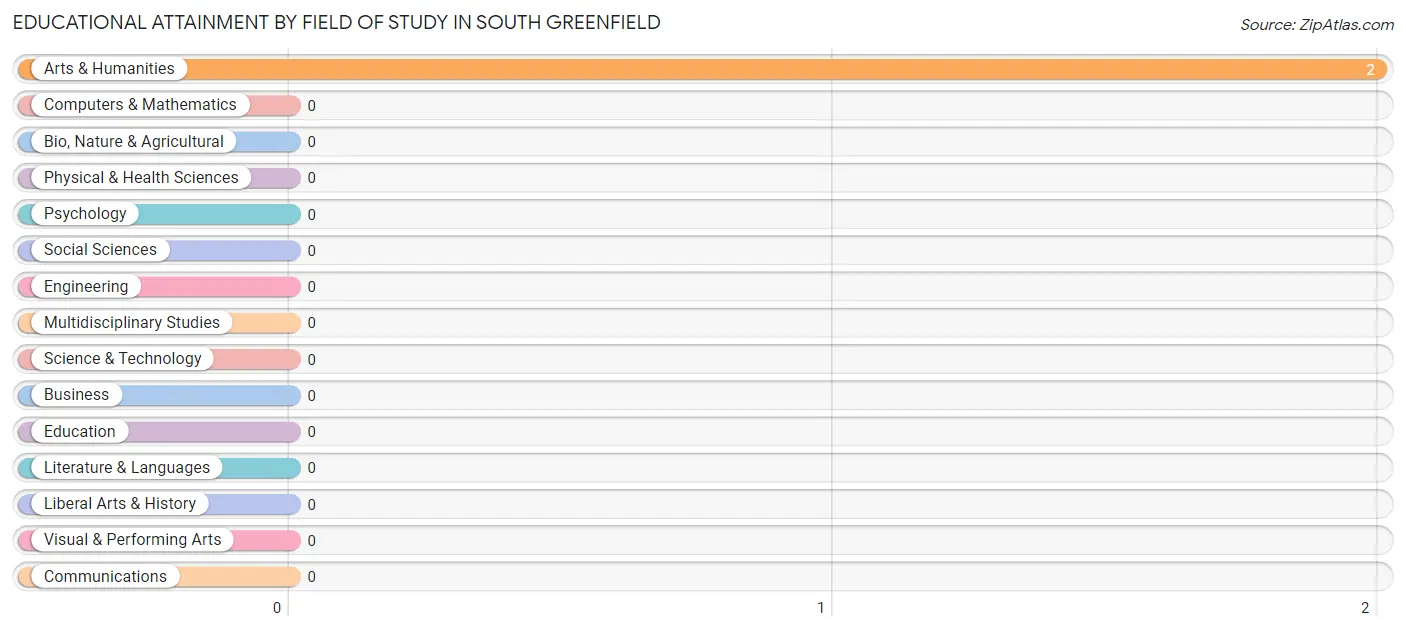
| Field of Study | # Graduates | % Graduates |
| Computers & Mathematics | 0 | 0.0% |
| Bio, Nature & Agricultural | 0 | 0.0% |
| Physical & Health Sciences | 0 | 0.0% |
| Psychology | 0 | 0.0% |
| Social Sciences | 0 | 0.0% |
| Engineering | 0 | 0.0% |
| Multidisciplinary Studies | 0 | 0.0% |
| Science & Technology | 0 | 0.0% |
| Business | 0 | 0.0% |
| Education | 0 | 0.0% |
| Literature & Languages | 0 | 0.0% |
| Liberal Arts & History | 0 | 0.0% |
| Visual & Performing Arts | 0 | 0.0% |
| Communications | 0 | 0.0% |
| Arts & Humanities | 2 | 100.0% |
| Total | 2 | 100.0% |
Transportation & Commute in South Greenfield
Vehicle Availability by Sex in South Greenfield
The most prevalent vehicle ownership categories in South Greenfield are males with 2 vehicles (16, accounting for 64.0%) and females with 2 vehicles (7, making up 160.0%).
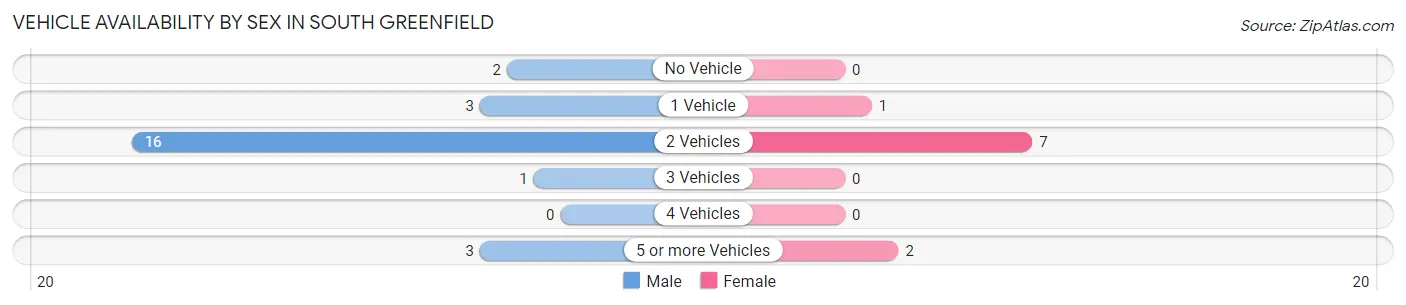
| Vehicles Available | Male | Female |
| No Vehicle | 2 (8.0%) | 0 (0.0%) |
| 1 Vehicle | 3 (12.0%) | 1 (10.0%) |
| 2 Vehicles | 16 (64.0%) | 7 (70.0%) |
| 3 Vehicles | 1 (4.0%) | 0 (0.0%) |
| 4 Vehicles | 0 (0.0%) | 0 (0.0%) |
| 5 or more Vehicles | 3 (12.0%) | 2 (20.0%) |
| Total | 25 (100.0%) | 10 (100.0%) |
Commute Time in South Greenfield
The most frequently occuring commute durations in South Greenfield are 45 to 59 minutes (12 commuters, 34.3%), less than 5 minutes (6 commuters, 17.1%), and 5 to 9 minutes (6 commuters, 17.1%).
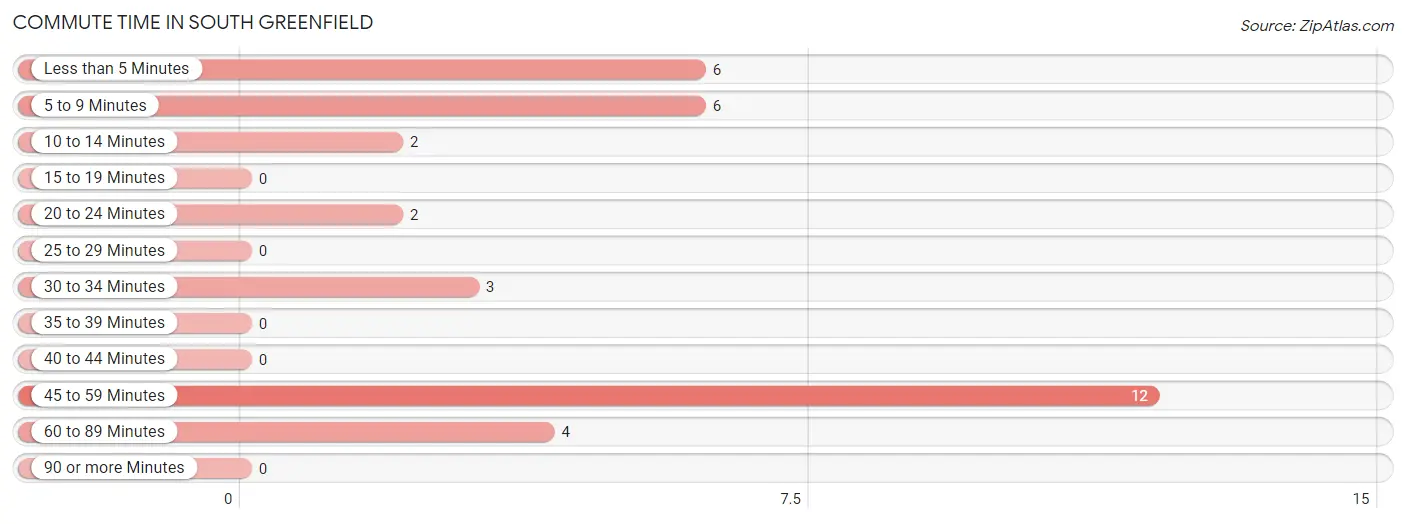
| Commute Time | # Commuters | % Commuters |
| Less than 5 Minutes | 6 | 17.1% |
| 5 to 9 Minutes | 6 | 17.1% |
| 10 to 14 Minutes | 2 | 5.7% |
| 15 to 19 Minutes | 0 | 0.0% |
| 20 to 24 Minutes | 2 | 5.7% |
| 25 to 29 Minutes | 0 | 0.0% |
| 30 to 34 Minutes | 3 | 8.6% |
| 35 to 39 Minutes | 0 | 0.0% |
| 40 to 44 Minutes | 0 | 0.0% |
| 45 to 59 Minutes | 12 | 34.3% |
| 60 to 89 Minutes | 4 | 11.4% |
| 90 or more Minutes | 0 | 0.0% |
Commute Time by Sex in South Greenfield
The most common commute times in South Greenfield are 45 to 59 minutes (12 commuters, 48.0%) for males and less than 5 minutes (5 commuters, 50.0%) for females.
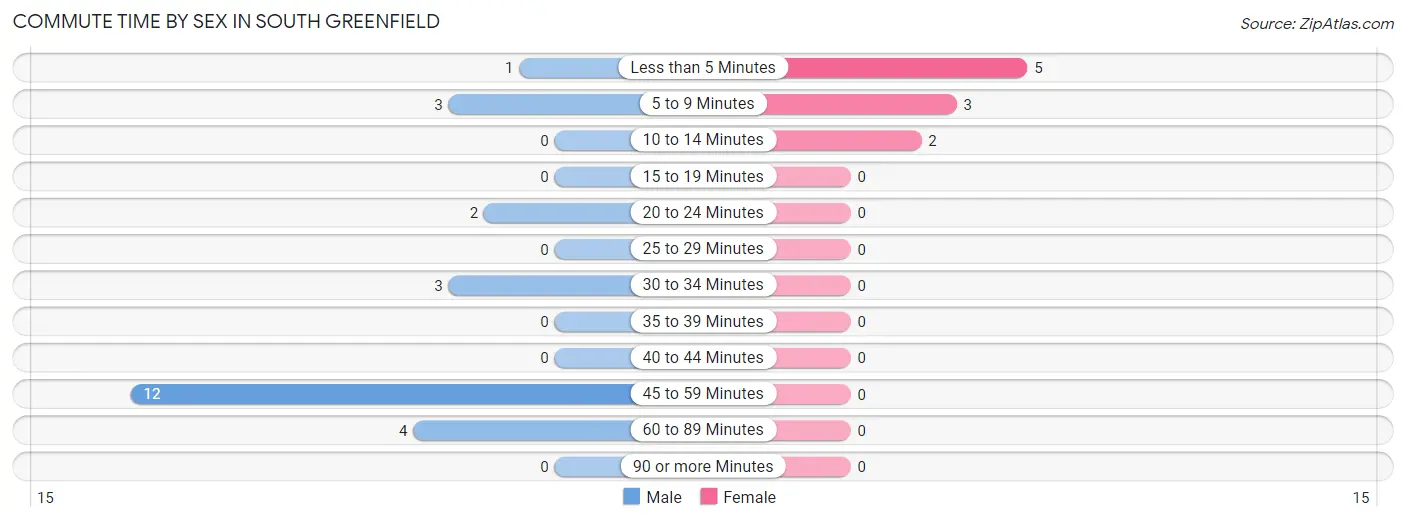
| Commute Time | Male | Female |
| Less than 5 Minutes | 1 (4.0%) | 5 (50.0%) |
| 5 to 9 Minutes | 3 (12.0%) | 3 (30.0%) |
| 10 to 14 Minutes | 0 (0.0%) | 2 (20.0%) |
| 15 to 19 Minutes | 0 (0.0%) | 0 (0.0%) |
| 20 to 24 Minutes | 2 (8.0%) | 0 (0.0%) |
| 25 to 29 Minutes | 0 (0.0%) | 0 (0.0%) |
| 30 to 34 Minutes | 3 (12.0%) | 0 (0.0%) |
| 35 to 39 Minutes | 0 (0.0%) | 0 (0.0%) |
| 40 to 44 Minutes | 0 (0.0%) | 0 (0.0%) |
| 45 to 59 Minutes | 12 (48.0%) | 0 (0.0%) |
| 60 to 89 Minutes | 4 (16.0%) | 0 (0.0%) |
| 90 or more Minutes | 0 (0.0%) | 0 (0.0%) |
Time of Departure to Work by Sex in South Greenfield
The most frequent times of departure to work in South Greenfield are 4:00 PM to 11:59 PM (7, 28.0%) for males and 12:00 PM to 3:59 PM (5, 50.0%) for females.
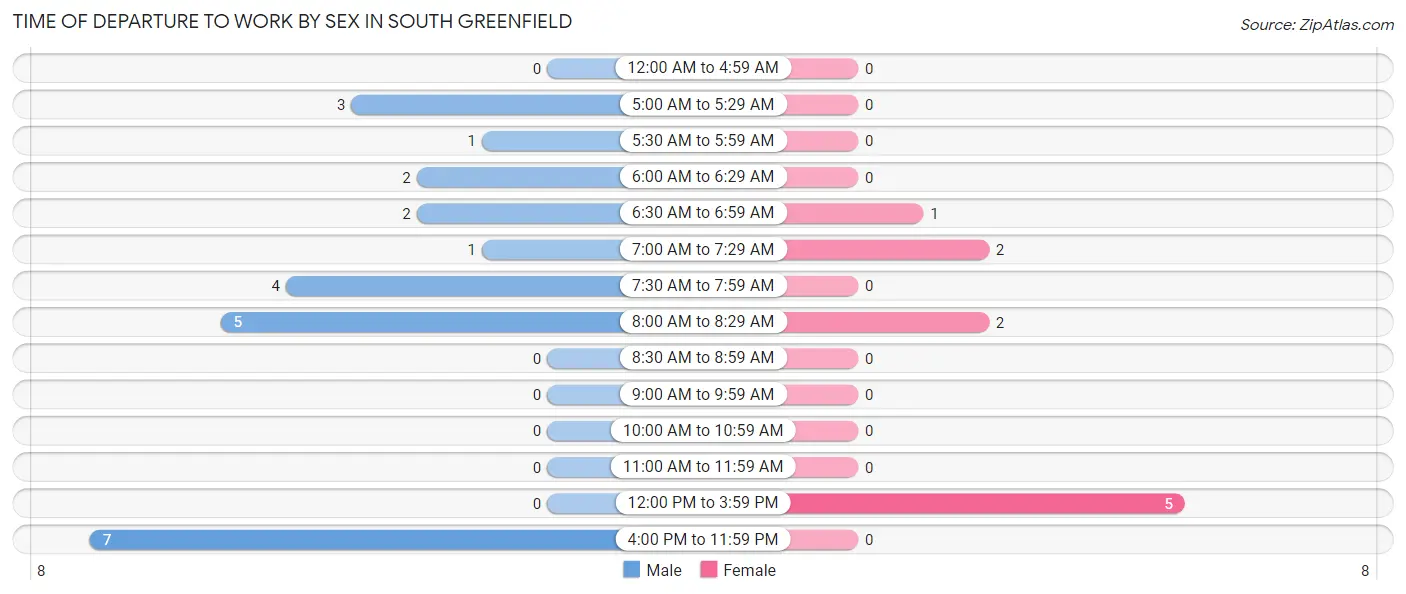
| Time of Departure | Male | Female |
| 12:00 AM to 4:59 AM | 0 (0.0%) | 0 (0.0%) |
| 5:00 AM to 5:29 AM | 3 (12.0%) | 0 (0.0%) |
| 5:30 AM to 5:59 AM | 1 (4.0%) | 0 (0.0%) |
| 6:00 AM to 6:29 AM | 2 (8.0%) | 0 (0.0%) |
| 6:30 AM to 6:59 AM | 2 (8.0%) | 1 (10.0%) |
| 7:00 AM to 7:29 AM | 1 (4.0%) | 2 (20.0%) |
| 7:30 AM to 7:59 AM | 4 (16.0%) | 0 (0.0%) |
| 8:00 AM to 8:29 AM | 5 (20.0%) | 2 (20.0%) |
| 8:30 AM to 8:59 AM | 0 (0.0%) | 0 (0.0%) |
| 9:00 AM to 9:59 AM | 0 (0.0%) | 0 (0.0%) |
| 10:00 AM to 10:59 AM | 0 (0.0%) | 0 (0.0%) |
| 11:00 AM to 11:59 AM | 0 (0.0%) | 0 (0.0%) |
| 12:00 PM to 3:59 PM | 0 (0.0%) | 5 (50.0%) |
| 4:00 PM to 11:59 PM | 7 (28.0%) | 0 (0.0%) |
| Total | 25 (100.0%) | 10 (100.0%) |
Housing Occupancy in South Greenfield
Occupancy by Ownership in South Greenfield
Of the total 39 dwellings in South Greenfield, owner-occupied units account for 32 (82.1%), while renter-occupied units make up 7 (17.9%).
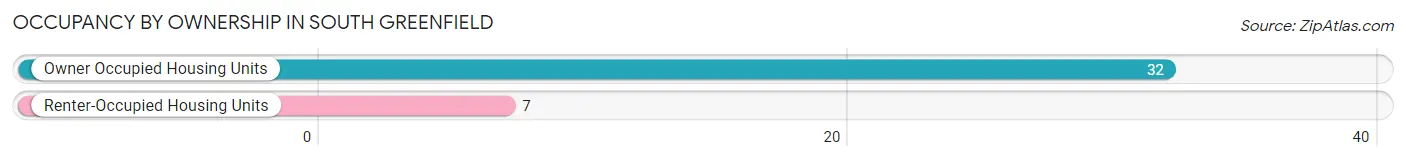
| Occupancy | # Housing Units | % Housing Units |
| Owner Occupied Housing Units | 32 | 82.1% |
| Renter-Occupied Housing Units | 7 | 17.9% |
| Total Occupied Housing Units | 39 | 100.0% |
Occupancy by Household Size in South Greenfield
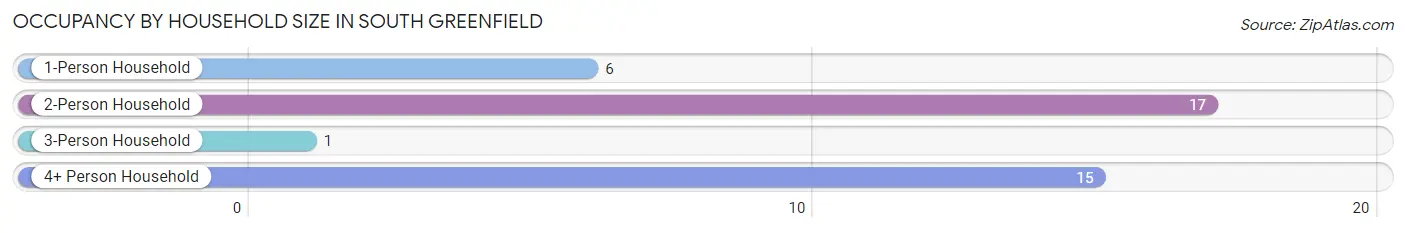
| Household Size | # Housing Units | % Housing Units |
| 1-Person Household | 6 | 15.4% |
| 2-Person Household | 17 | 43.6% |
| 3-Person Household | 1 | 2.6% |
| 4+ Person Household | 15 | 38.5% |
| Total Housing Units | 39 | 100.0% |
Occupancy by Ownership by Household Size in South Greenfield
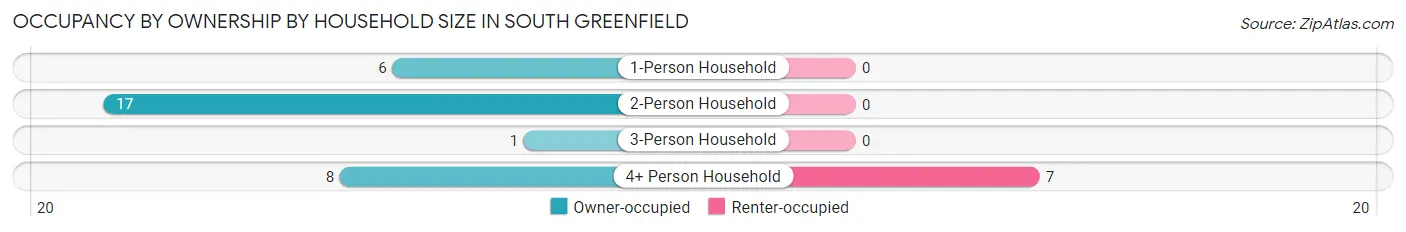
| Household Size | Owner-occupied | Renter-occupied |
| 1-Person Household | 6 (100.0%) | 0 (0.0%) |
| 2-Person Household | 17 (100.0%) | 0 (0.0%) |
| 3-Person Household | 1 (100.0%) | 0 (0.0%) |
| 4+ Person Household | 8 (53.3%) | 7 (46.7%) |
| Total Housing Units | 32 (82.1%) | 7 (17.9%) |
Occupancy by Educational Attainment in South Greenfield
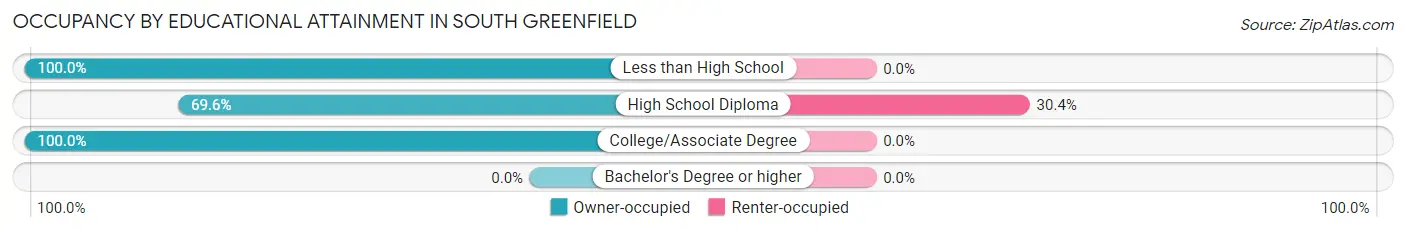
| Household Size | Owner-occupied | Renter-occupied |
| Less than High School | 3 (100.0%) | 0 (0.0%) |
| High School Diploma | 16 (69.6%) | 7 (30.4%) |
| College/Associate Degree | 13 (100.0%) | 0 (0.0%) |
| Bachelor's Degree or higher | 0 (0.0%) | 0 (0.0%) |
Occupancy by Age of Householder in South Greenfield
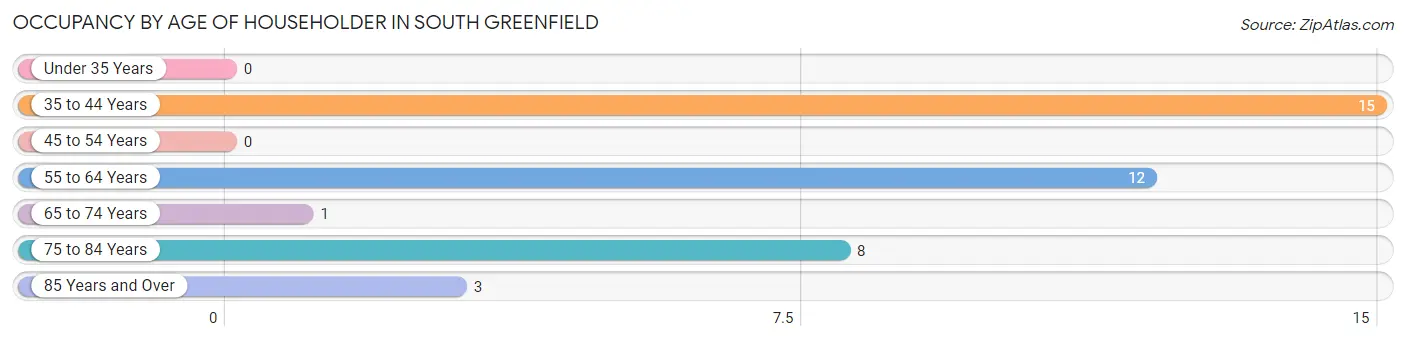
| Age Bracket | # Households | % Households |
| Under 35 Years | 0 | 0.0% |
| 35 to 44 Years | 15 | 38.5% |
| 45 to 54 Years | 0 | 0.0% |
| 55 to 64 Years | 12 | 30.8% |
| 65 to 74 Years | 1 | 2.6% |
| 75 to 84 Years | 8 | 20.5% |
| 85 Years and Over | 3 | 7.7% |
| Total | 39 | 100.0% |
Housing Finances in South Greenfield
Median Income by Occupancy in South Greenfield
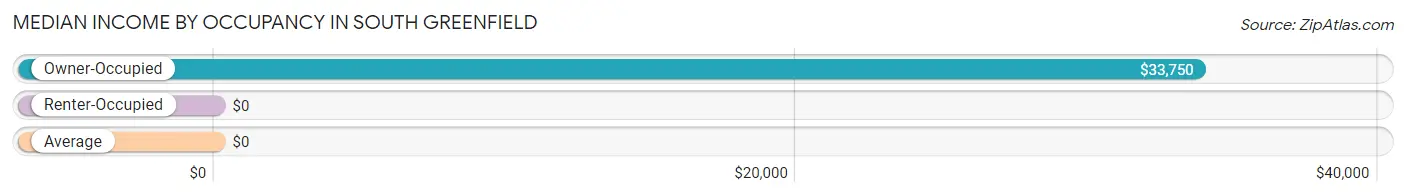
| Occupancy Type | # Households | Median Income |
| Owner-Occupied | 32 (82.1%) | $33,750 |
| Renter-Occupied | 7 (17.9%) | $0 |
| Average | 39 (100.0%) | $0 |
Occupancy by Householder Income Bracket in South Greenfield
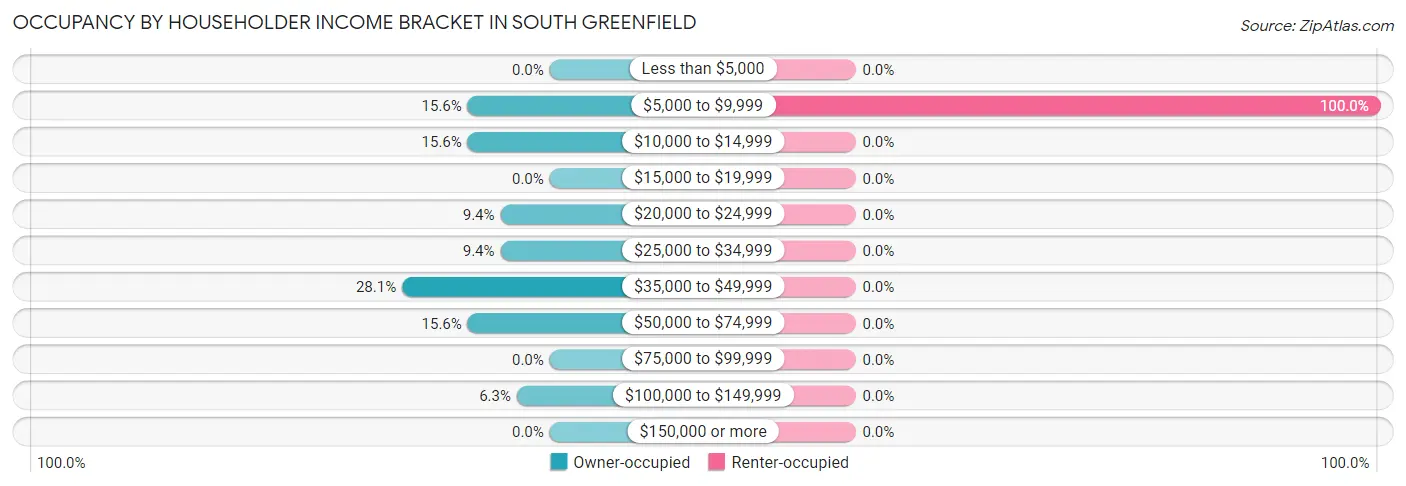
| Income Bracket | Owner-occupied | Renter-occupied |
| Less than $5,000 | 0 (0.0%) | 0 (0.0%) |
| $5,000 to $9,999 | 5 (15.6%) | 7 (100.0%) |
| $10,000 to $14,999 | 5 (15.6%) | 0 (0.0%) |
| $15,000 to $19,999 | 0 (0.0%) | 0 (0.0%) |
| $20,000 to $24,999 | 3 (9.4%) | 0 (0.0%) |
| $25,000 to $34,999 | 3 (9.4%) | 0 (0.0%) |
| $35,000 to $49,999 | 9 (28.1%) | 0 (0.0%) |
| $50,000 to $74,999 | 5 (15.6%) | 0 (0.0%) |
| $75,000 to $99,999 | 0 (0.0%) | 0 (0.0%) |
| $100,000 to $149,999 | 2 (6.2%) | 0 (0.0%) |
| $150,000 or more | 0 (0.0%) | 0 (0.0%) |
| Total | 32 (100.0%) | 7 (100.0%) |
Monthly Housing Cost Tiers in South Greenfield
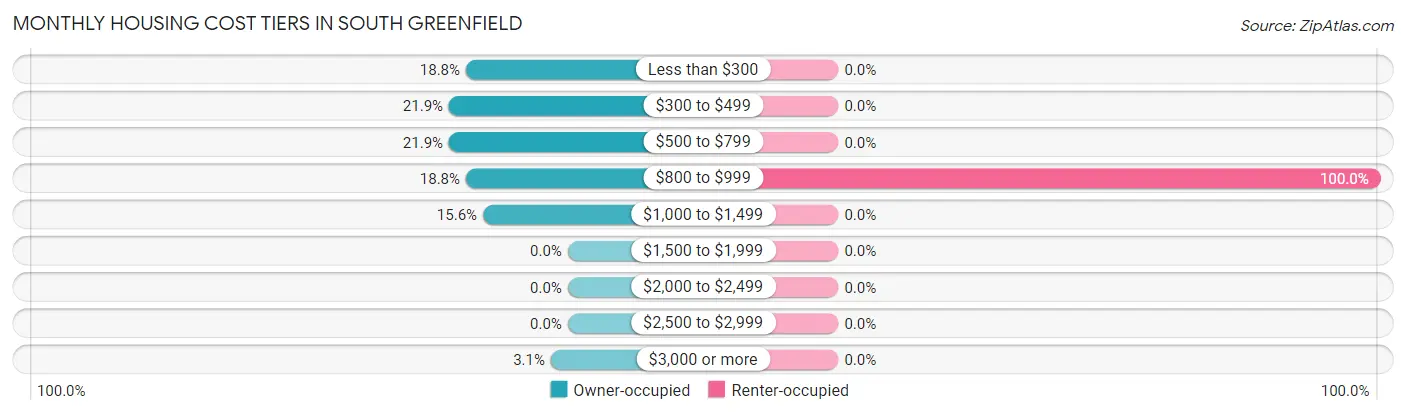
| Monthly Cost | Owner-occupied | Renter-occupied |
| Less than $300 | 6 (18.8%) | 0 (0.0%) |
| $300 to $499 | 7 (21.9%) | 0 (0.0%) |
| $500 to $799 | 7 (21.9%) | 0 (0.0%) |
| $800 to $999 | 6 (18.8%) | 7 (100.0%) |
| $1,000 to $1,499 | 5 (15.6%) | 0 (0.0%) |
| $1,500 to $1,999 | 0 (0.0%) | 0 (0.0%) |
| $2,000 to $2,499 | 0 (0.0%) | 0 (0.0%) |
| $2,500 to $2,999 | 0 (0.0%) | 0 (0.0%) |
| $3,000 or more | 1 (3.1%) | 0 (0.0%) |
| Total | 32 (100.0%) | 7 (100.0%) |
Physical Housing Characteristics in South Greenfield
Housing Structures in South Greenfield
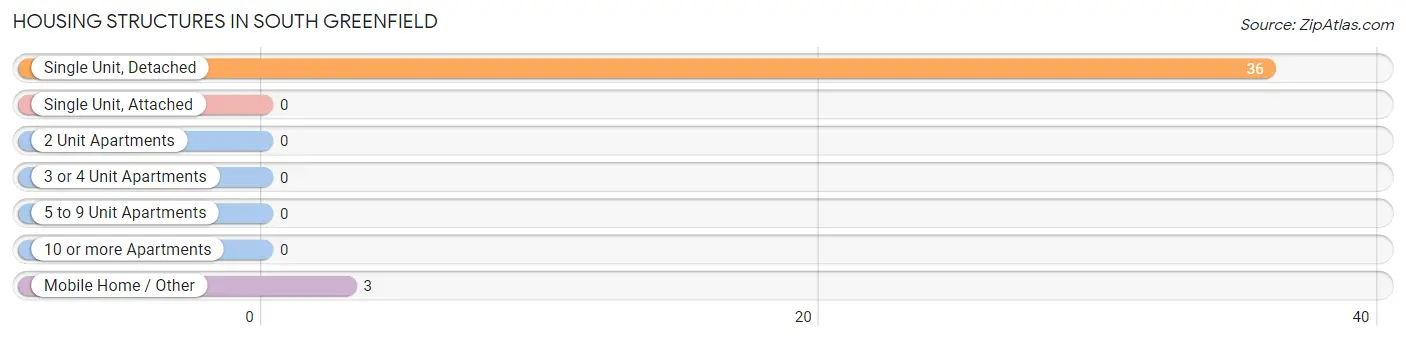
| Structure Type | # Housing Units | % Housing Units |
| Single Unit, Detached | 36 | 92.3% |
| Single Unit, Attached | 0 | 0.0% |
| 2 Unit Apartments | 0 | 0.0% |
| 3 or 4 Unit Apartments | 0 | 0.0% |
| 5 to 9 Unit Apartments | 0 | 0.0% |
| 10 or more Apartments | 0 | 0.0% |
| Mobile Home / Other | 3 | 7.7% |
| Total | 39 | 100.0% |
Housing Structures by Occupancy in South Greenfield
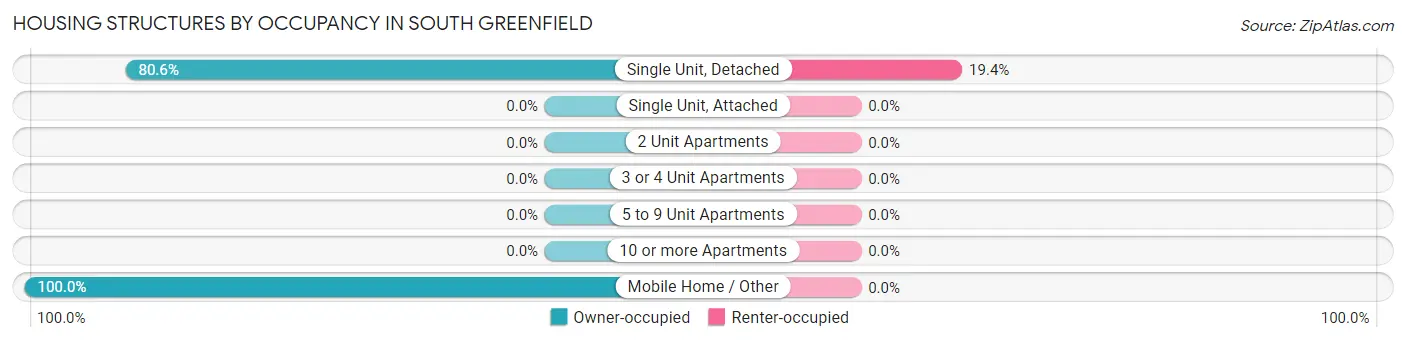
| Structure Type | Owner-occupied | Renter-occupied |
| Single Unit, Detached | 29 (80.6%) | 7 (19.4%) |
| Single Unit, Attached | 0 (0.0%) | 0 (0.0%) |
| 2 Unit Apartments | 0 (0.0%) | 0 (0.0%) |
| 3 or 4 Unit Apartments | 0 (0.0%) | 0 (0.0%) |
| 5 to 9 Unit Apartments | 0 (0.0%) | 0 (0.0%) |
| 10 or more Apartments | 0 (0.0%) | 0 (0.0%) |
| Mobile Home / Other | 3 (100.0%) | 0 (0.0%) |
| Total | 32 (82.1%) | 7 (17.9%) |
Housing Structures by Number of Rooms in South Greenfield
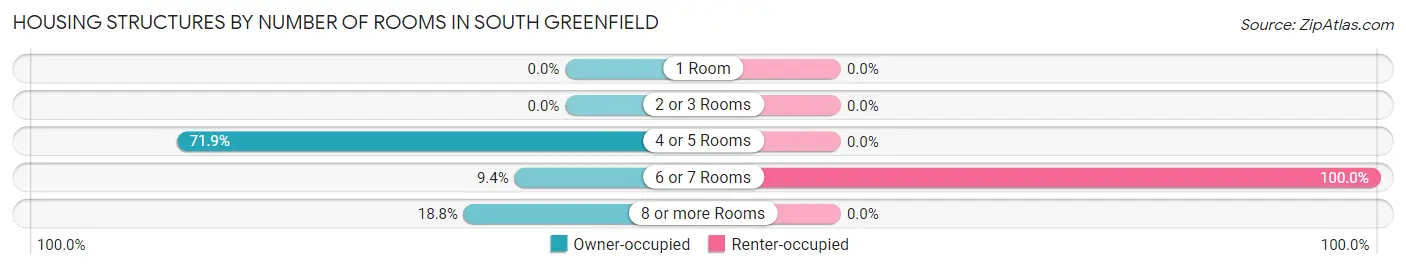
| Number of Rooms | Owner-occupied | Renter-occupied |
| 1 Room | 0 (0.0%) | 0 (0.0%) |
| 2 or 3 Rooms | 0 (0.0%) | 0 (0.0%) |
| 4 or 5 Rooms | 23 (71.9%) | 0 (0.0%) |
| 6 or 7 Rooms | 3 (9.4%) | 7 (100.0%) |
| 8 or more Rooms | 6 (18.8%) | 0 (0.0%) |
| Total | 32 (100.0%) | 7 (100.0%) |
Housing Structure by Heating Type in South Greenfield
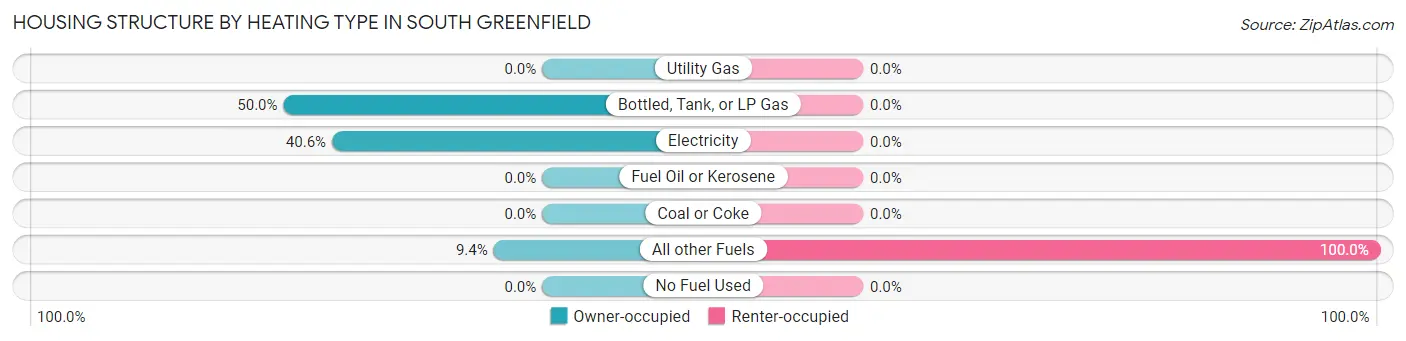
| Heating Type | Owner-occupied | Renter-occupied |
| Utility Gas | 0 (0.0%) | 0 (0.0%) |
| Bottled, Tank, or LP Gas | 16 (50.0%) | 0 (0.0%) |
| Electricity | 13 (40.6%) | 0 (0.0%) |
| Fuel Oil or Kerosene | 0 (0.0%) | 0 (0.0%) |
| Coal or Coke | 0 (0.0%) | 0 (0.0%) |
| All other Fuels | 3 (9.4%) | 7 (100.0%) |
| No Fuel Used | 0 (0.0%) | 0 (0.0%) |
| Total | 32 (100.0%) | 7 (100.0%) |
Household Vehicle Usage in South Greenfield
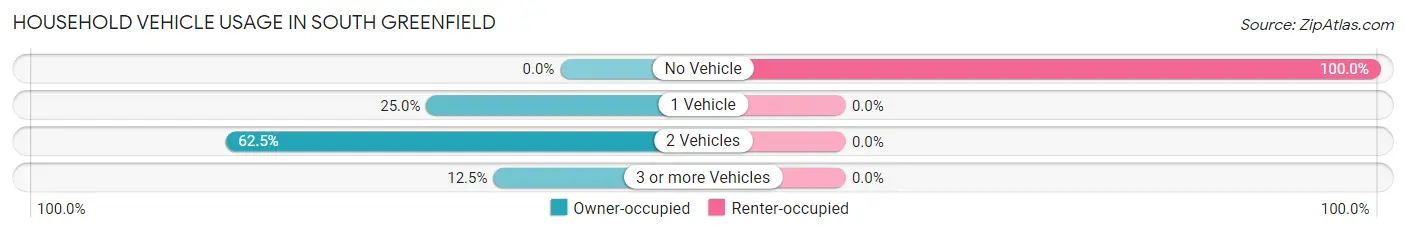
| Vehicles per Household | Owner-occupied | Renter-occupied |
| No Vehicle | 0 (0.0%) | 7 (100.0%) |
| 1 Vehicle | 8 (25.0%) | 0 (0.0%) |
| 2 Vehicles | 20 (62.5%) | 0 (0.0%) |
| 3 or more Vehicles | 4 (12.5%) | 0 (0.0%) |
| Total | 32 (100.0%) | 7 (100.0%) |
Real Estate & Mortgages in South Greenfield
Real Estate and Mortgage Overview in South Greenfield
| Characteristic | Without Mortgage | With Mortgage |
| Housing Units | 16 | 16 |
| Median Property Value | - | - |
| Median Household Income | $28,333 | $0 |
| Monthly Housing Costs | $333 | $1 |
| Real Estate Taxes | $373 | $0 |
Property Value by Mortgage Status in South Greenfield
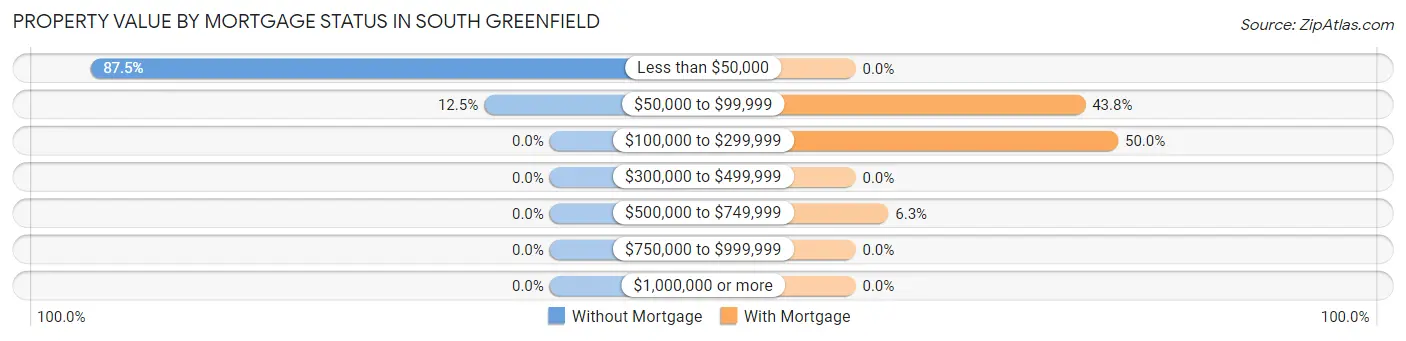
| Property Value | Without Mortgage | With Mortgage |
| Less than $50,000 | 14 (87.5%) | 0 (0.0%) |
| $50,000 to $99,999 | 2 (12.5%) | 7 (43.8%) |
| $100,000 to $299,999 | 0 (0.0%) | 8 (50.0%) |
| $300,000 to $499,999 | 0 (0.0%) | 0 (0.0%) |
| $500,000 to $749,999 | 0 (0.0%) | 1 (6.2%) |
| $750,000 to $999,999 | 0 (0.0%) | 0 (0.0%) |
| $1,000,000 or more | 0 (0.0%) | 0 (0.0%) |
| Total | 16 (100.0%) | 16 (100.0%) |
Household Income by Mortgage Status in South Greenfield
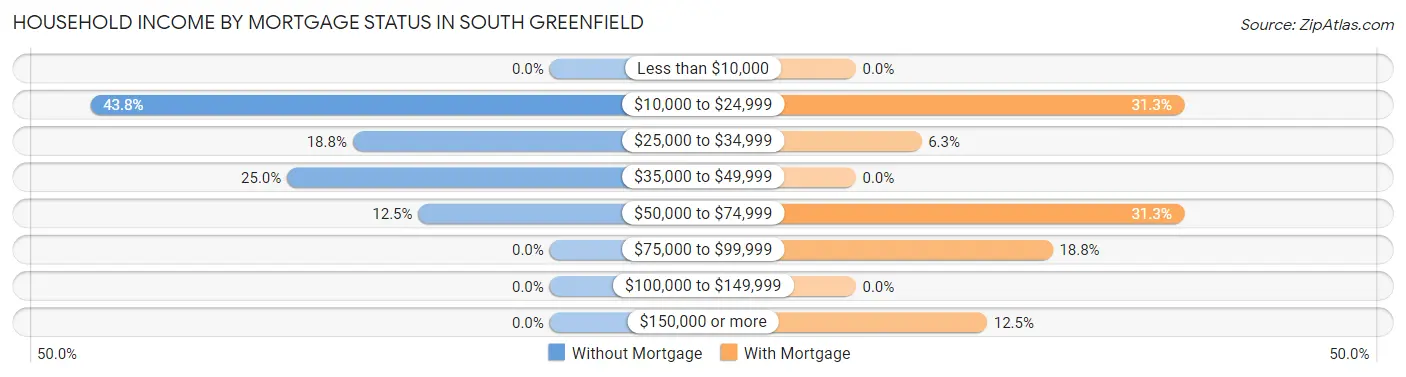
| Household Income | Without Mortgage | With Mortgage |
| Less than $10,000 | 0 (0.0%) | 0 (0.0%) |
| $10,000 to $24,999 | 7 (43.8%) | 5 (31.2%) |
| $25,000 to $34,999 | 3 (18.8%) | 1 (6.2%) |
| $35,000 to $49,999 | 4 (25.0%) | 0 (0.0%) |
| $50,000 to $74,999 | 2 (12.5%) | 5 (31.2%) |
| $75,000 to $99,999 | 0 (0.0%) | 3 (18.8%) |
| $100,000 to $149,999 | 0 (0.0%) | 0 (0.0%) |
| $150,000 or more | 0 (0.0%) | 2 (12.5%) |
| Total | 16 (100.0%) | 16 (100.0%) |
Property Value to Household Income Ratio in South Greenfield
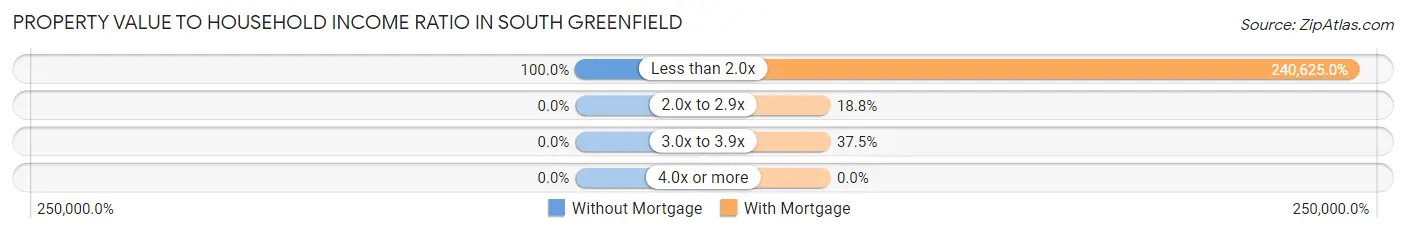
| Value-to-Income Ratio | Without Mortgage | With Mortgage |
| Less than 2.0x | 16 (100.0%) | 38,500 (240,625.0%) |
| 2.0x to 2.9x | 0 (0.0%) | 3 (18.8%) |
| 3.0x to 3.9x | 0 (0.0%) | 6 (37.5%) |
| 4.0x or more | 0 (0.0%) | 0 (0.0%) |
| Total | 16 (100.0%) | 16 (100.0%) |
Real Estate Taxes by Mortgage Status in South Greenfield
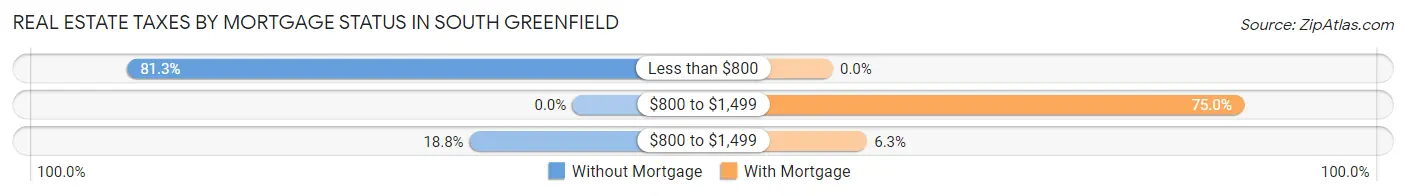
| Property Taxes | Without Mortgage | With Mortgage |
| Less than $800 | 13 (81.2%) | 0 (0.0%) |
| $800 to $1,499 | 0 (0.0%) | 12 (75.0%) |
| $800 to $1,499 | 3 (18.8%) | 1 (6.2%) |
| Total | 16 (100.0%) | 16 (100.0%) |
Health & Disability in South Greenfield
Health Insurance Coverage by Age in South Greenfield
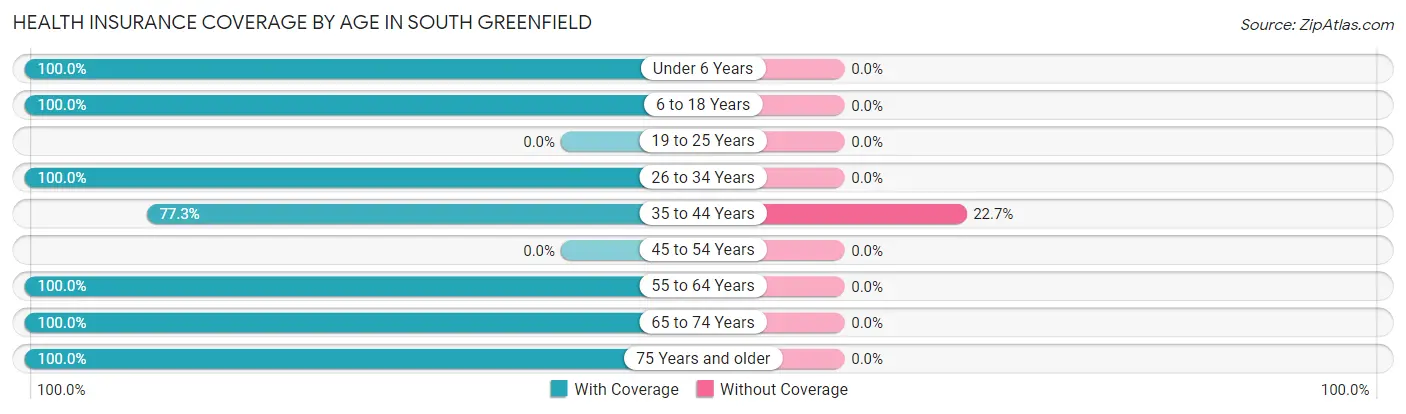
| Age Bracket | With Coverage | Without Coverage |
| Under 6 Years | 9 (100.0%) | 0 (0.0%) |
| 6 to 18 Years | 25 (100.0%) | 0 (0.0%) |
| 19 to 25 Years | 0 (0.0%) | 0 (0.0%) |
| 26 to 34 Years | 11 (100.0%) | 0 (0.0%) |
| 35 to 44 Years | 17 (77.3%) | 5 (22.7%) |
| 45 to 54 Years | 0 (0.0%) | 0 (0.0%) |
| 55 to 64 Years | 19 (100.0%) | 0 (0.0%) |
| 65 to 74 Years | 4 (100.0%) | 0 (0.0%) |
| 75 Years and older | 16 (100.0%) | 0 (0.0%) |
| Total | 101 (95.3%) | 5 (4.7%) |
Health Insurance Coverage by Citizenship Status in South Greenfield
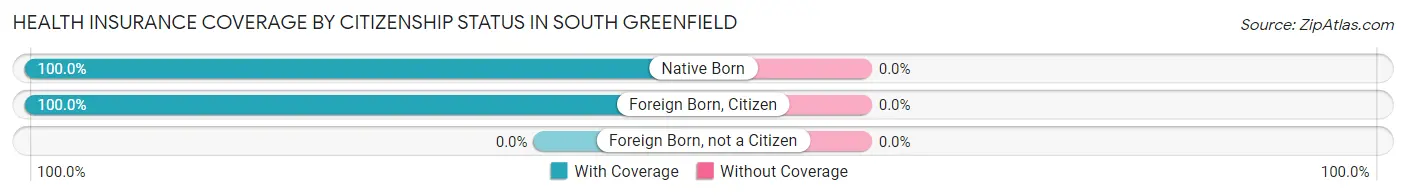
| Citizenship Status | With Coverage | Without Coverage |
| Native Born | 9 (100.0%) | 0 (0.0%) |
| Foreign Born, Citizen | 25 (100.0%) | 0 (0.0%) |
| Foreign Born, not a Citizen | 0 (0.0%) | 0 (0.0%) |
Health Insurance Coverage by Household Income in South Greenfield
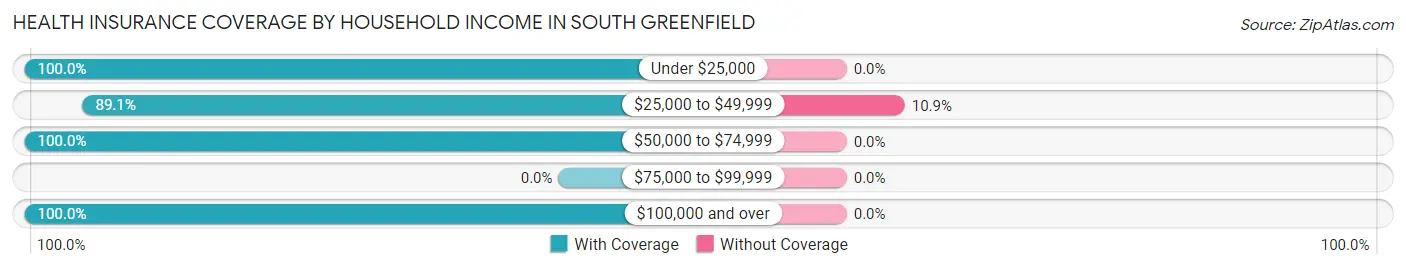
| Household Income | With Coverage | Without Coverage |
| Under $25,000 | 36 (100.0%) | 0 (0.0%) |
| $25,000 to $49,999 | 41 (89.1%) | 5 (10.9%) |
| $50,000 to $74,999 | 19 (100.0%) | 0 (0.0%) |
| $75,000 to $99,999 | 0 (0.0%) | 0 (0.0%) |
| $100,000 and over | 5 (100.0%) | 0 (0.0%) |
Public vs Private Health Insurance Coverage by Age in South Greenfield
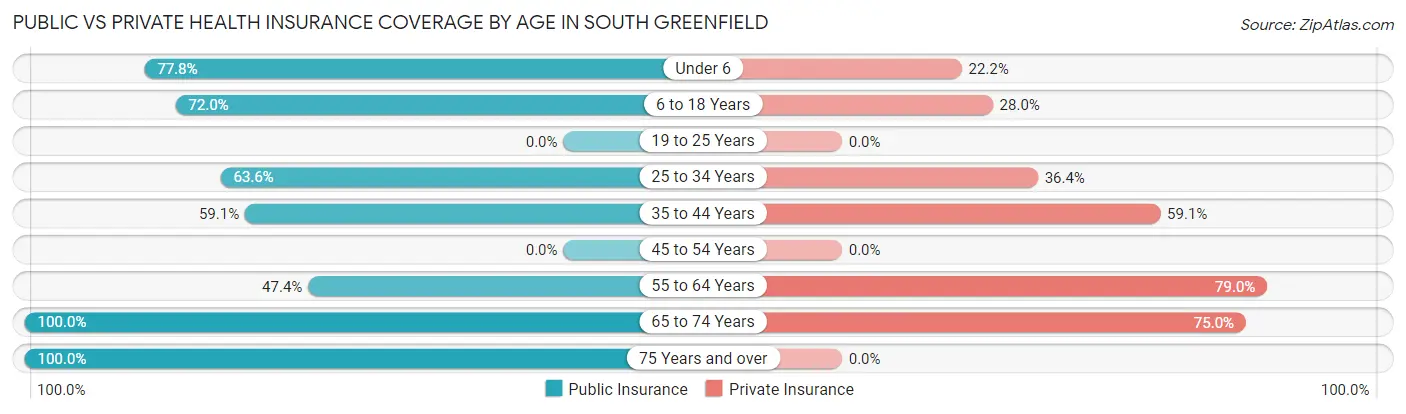
| Age Bracket | Public Insurance | Private Insurance |
| Under 6 | 7 (77.8%) | 2 (22.2%) |
| 6 to 18 Years | 18 (72.0%) | 7 (28.0%) |
| 19 to 25 Years | 0 (0.0%) | 0 (0.0%) |
| 25 to 34 Years | 7 (63.6%) | 4 (36.4%) |
| 35 to 44 Years | 13 (59.1%) | 13 (59.1%) |
| 45 to 54 Years | 0 (0.0%) | 0 (0.0%) |
| 55 to 64 Years | 9 (47.4%) | 15 (78.9%) |
| 65 to 74 Years | 4 (100.0%) | 3 (75.0%) |
| 75 Years and over | 16 (100.0%) | 0 (0.0%) |
| Total | 74 (69.8%) | 44 (41.5%) |
Disability Status by Sex by Age in South Greenfield
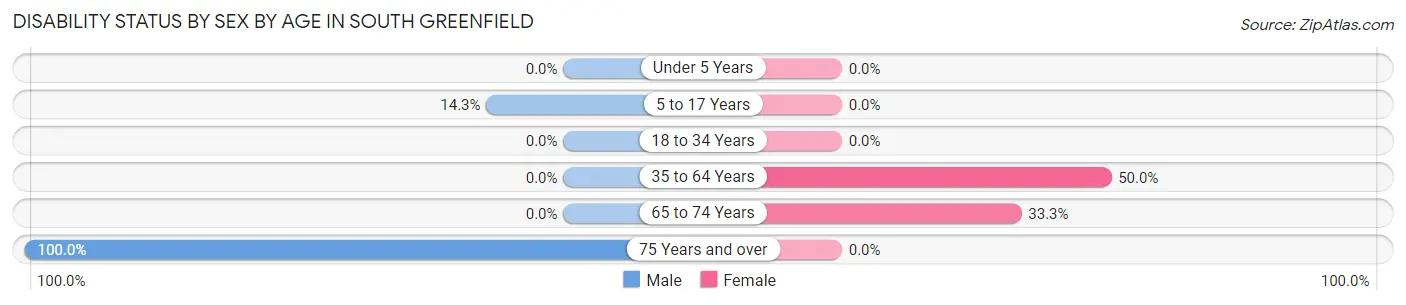
| Age Bracket | Male | Female |
| Under 5 Years | 0 (0.0%) | 0 (0.0%) |
| 5 to 17 Years | 2 (14.3%) | 0 (0.0%) |
| 18 to 34 Years | 0 (0.0%) | 0 (0.0%) |
| 35 to 64 Years | 0 (0.0%) | 12 (50.0%) |
| 65 to 74 Years | 0 (0.0%) | 1 (33.3%) |
| 75 Years and over | 4 (100.0%) | 0 (0.0%) |
Disability Class by Sex by Age in South Greenfield
Disability Class: Hearing Difficulty
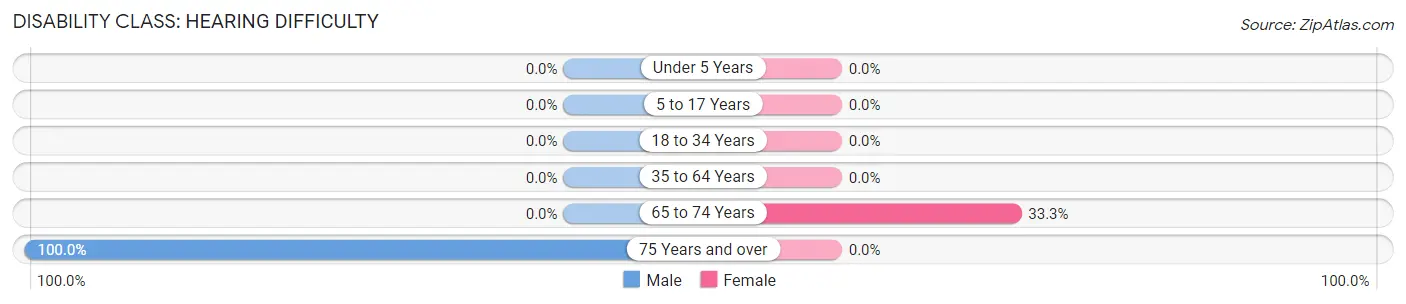
| Age Bracket | Male | Female |
| Under 5 Years | 0 (0.0%) | 0 (0.0%) |
| 5 to 17 Years | 0 (0.0%) | 0 (0.0%) |
| 18 to 34 Years | 0 (0.0%) | 0 (0.0%) |
| 35 to 64 Years | 0 (0.0%) | 0 (0.0%) |
| 65 to 74 Years | 0 (0.0%) | 1 (33.3%) |
| 75 Years and over | 4 (100.0%) | 0 (0.0%) |
Disability Class: Vision Difficulty
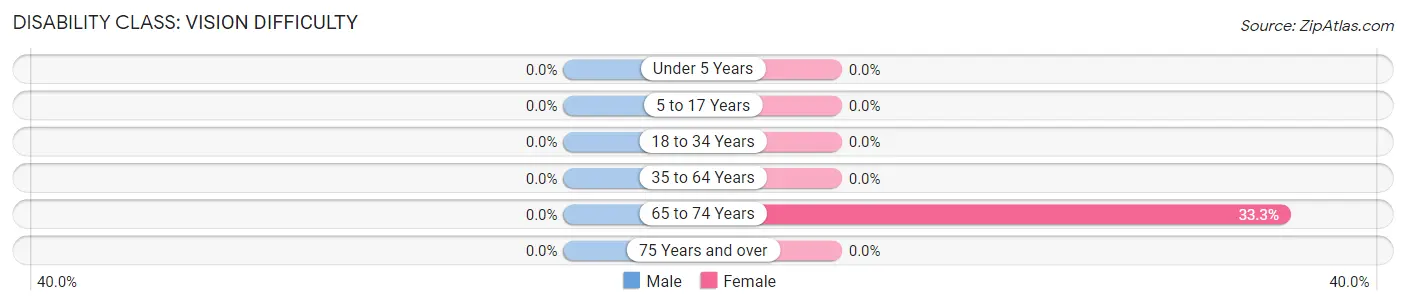
| Age Bracket | Male | Female |
| Under 5 Years | 0 (0.0%) | 0 (0.0%) |
| 5 to 17 Years | 0 (0.0%) | 0 (0.0%) |
| 18 to 34 Years | 0 (0.0%) | 0 (0.0%) |
| 35 to 64 Years | 0 (0.0%) | 0 (0.0%) |
| 65 to 74 Years | 0 (0.0%) | 1 (33.3%) |
| 75 Years and over | 0 (0.0%) | 0 (0.0%) |
Disability Class: Cognitive Difficulty
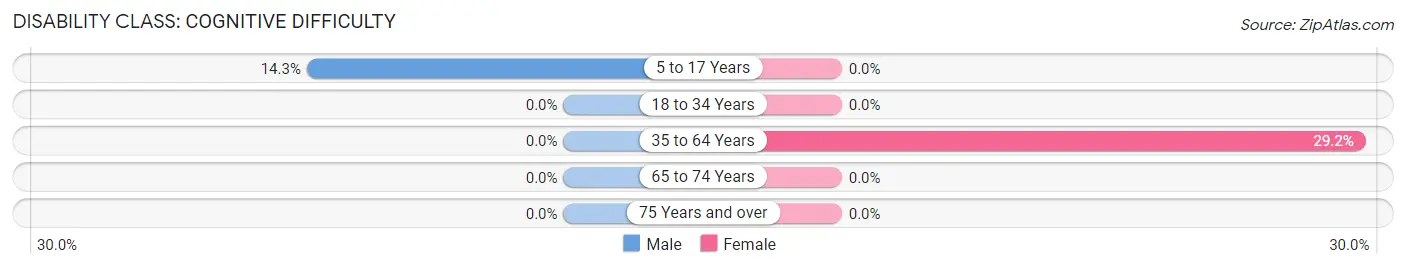
| Age Bracket | Male | Female |
| 5 to 17 Years | 2 (14.3%) | 0 (0.0%) |
| 18 to 34 Years | 0 (0.0%) | 0 (0.0%) |
| 35 to 64 Years | 0 (0.0%) | 7 (29.2%) |
| 65 to 74 Years | 0 (0.0%) | 0 (0.0%) |
| 75 Years and over | 0 (0.0%) | 0 (0.0%) |
Disability Class: Ambulatory Difficulty
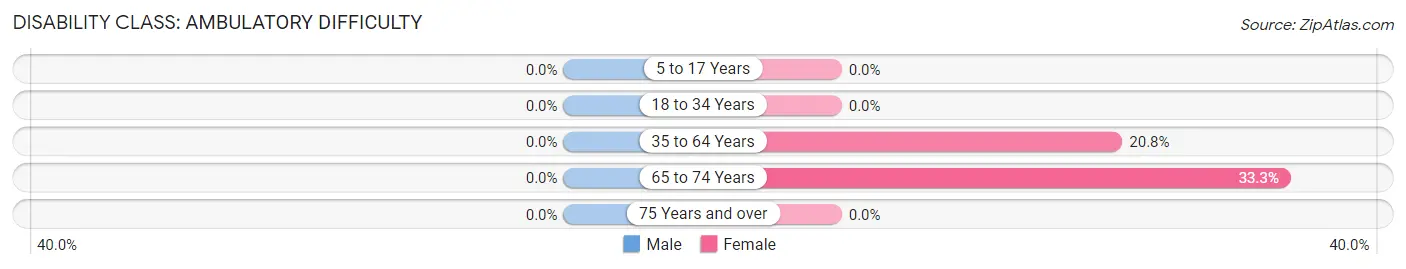
| Age Bracket | Male | Female |
| 5 to 17 Years | 0 (0.0%) | 0 (0.0%) |
| 18 to 34 Years | 0 (0.0%) | 0 (0.0%) |
| 35 to 64 Years | 0 (0.0%) | 5 (20.8%) |
| 65 to 74 Years | 0 (0.0%) | 1 (33.3%) |
| 75 Years and over | 0 (0.0%) | 0 (0.0%) |
Disability Class: Self-Care Difficulty
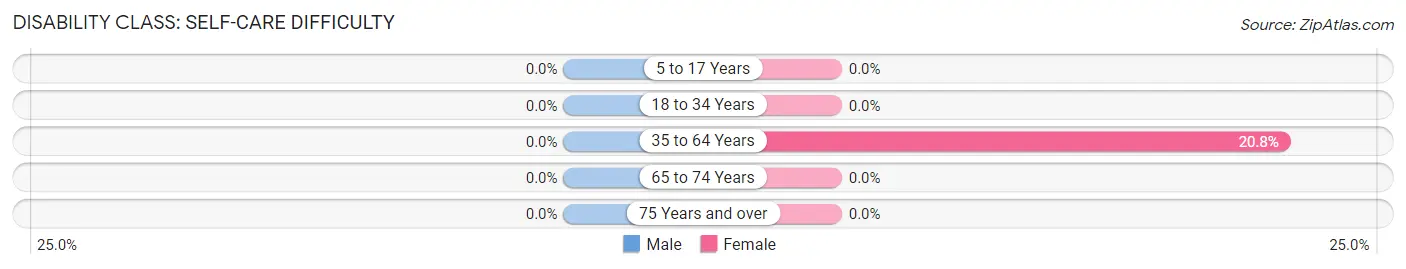
| Age Bracket | Male | Female |
| 5 to 17 Years | 0 (0.0%) | 0 (0.0%) |
| 18 to 34 Years | 0 (0.0%) | 0 (0.0%) |
| 35 to 64 Years | 0 (0.0%) | 5 (20.8%) |
| 65 to 74 Years | 0 (0.0%) | 0 (0.0%) |
| 75 Years and over | 0 (0.0%) | 0 (0.0%) |
Technology Access in South Greenfield
Computing Device Access in South Greenfield
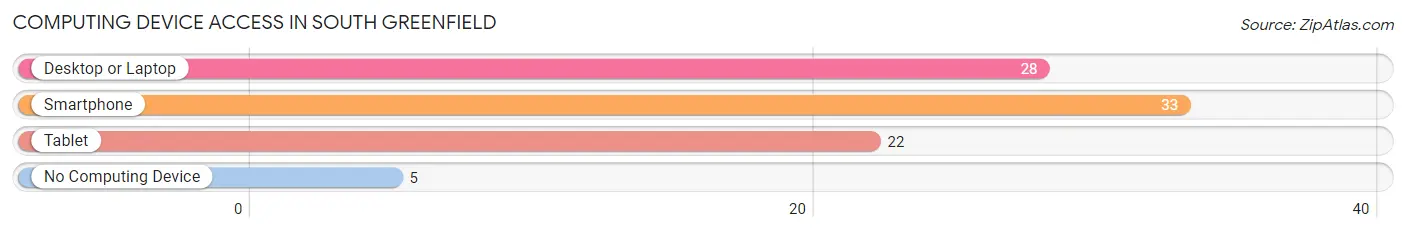
| Device Type | # Households | % Households |
| Desktop or Laptop | 28 | 71.8% |
| Smartphone | 33 | 84.6% |
| Tablet | 22 | 56.4% |
| No Computing Device | 5 | 12.8% |
| Total | 39 | 100.0% |
Internet Access in South Greenfield
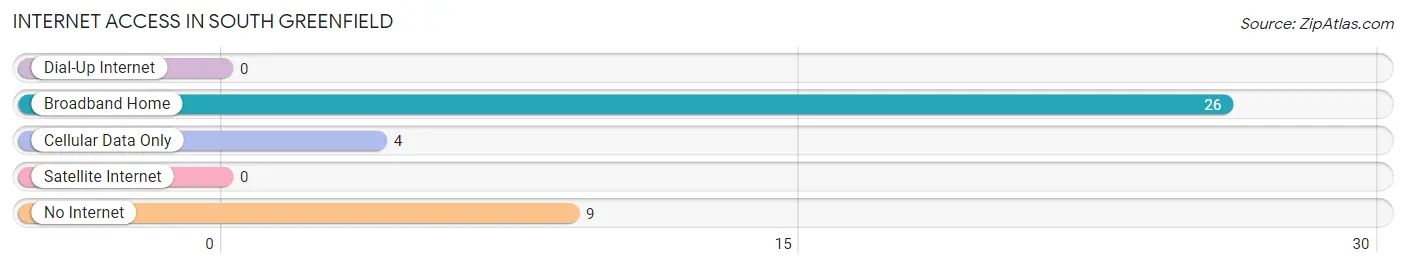
| Internet Type | # Households | % Households |
| Dial-Up Internet | 0 | 0.0% |
| Broadband Home | 26 | 66.7% |
| Cellular Data Only | 4 | 10.3% |
| Satellite Internet | 0 | 0.0% |
| No Internet | 9 | 23.1% |
| Total | 39 | 100.0% |
South Greenfield Summary
Greenfield, Missouri is a small town located in the southwestern corner of the state, in Dade County. It is situated on the banks of the Sac River, and is surrounded by rolling hills and farmland. The town was founded in 1845, and has a population of approximately 1,000 people.
History
Greenfield was founded in 1845 by a group of settlers from Kentucky and Tennessee. The town was named after the Greenfield family, who were among the first settlers. The town was originally a farming community, and the main crops grown were corn, wheat, and oats. In the late 1800s, the town began to grow and develop, and a number of businesses were established. These included a general store, a blacksmith shop, a hotel, and a post office.
In the early 1900s, the town began to experience a period of growth and prosperity. The railroad was extended to Greenfield in 1906, and this allowed for the transportation of goods and people to and from the town. This led to the establishment of several new businesses, including a lumber yard, a grain elevator, and a creamery.
Geography
Greenfield is located in the southwestern corner of Missouri, in Dade County. It is situated on the banks of the Sac River, and is surrounded by rolling hills and farmland. The town is located approximately 30 miles from Springfield, the state capital. The climate in Greenfield is generally mild, with hot summers and cold winters.
Economy
Greenfield’s economy is largely based on agriculture. The main crops grown in the area are corn, wheat, and oats. The town also has a number of small businesses, including a general store, a lumber yard, and a grain elevator. In recent years, the town has seen an increase in tourism, as visitors come to explore the area’s natural beauty and enjoy the small-town atmosphere.
Demographics
As of the 2010 census, Greenfield had a population of 1,000 people. The racial makeup of the town was 97.2% White, 0.7% African American, 0.3% Native American, 0.2% Asian, and 1.6% from other races. The median household income was $35,000, and the median age was 40 years.
Conclusion
Greenfield, Missouri is a small town located in the southwestern corner of the state, in Dade County. It was founded in 1845, and has a population of approximately 1,000 people. The town’s economy is largely based on agriculture, and it also has a number of small businesses. The town has seen an increase in tourism in recent years, as visitors come to explore the area’s natural beauty and enjoy the small-town atmosphere.
Common Questions
What is Per Capita Income in South Greenfield?
Per Capita income in South Greenfield is $11,890.
What is Inequality or Gini Index in South Greenfield?
Inequality or Gini Index in South Greenfield is 0.45.
What is the Total Population of South Greenfield?
Total Population of South Greenfield is 106.
What is the Total Male Population of South Greenfield?
Total Male Population of South Greenfield is 54.
What is the Total Female Population of South Greenfield?
Total Female Population of South Greenfield is 52.
What is the Ratio of Males per 100 Females in South Greenfield?
There are 103.85 Males per 100 Females in South Greenfield.
What is the Ratio of Females per 100 Males in South Greenfield?
There are 96.30 Females per 100 Males in South Greenfield.
What is the Median Population Age in South Greenfield?
Median Population Age in South Greenfield is 38.3 Years.
What is the Average Family Size in South Greenfield
Average Family Size in South Greenfield is 3.0 People.
What is the Average Household Size in South Greenfield
Average Household Size in South Greenfield is 2.7 People.
How Large is the Labor Force in South Greenfield?
There are 42 People in the Labor Forcein in South Greenfield.
What is the Percentage of People in the Labor Force in South Greenfield?
52.5% of People are in the Labor Force in South Greenfield.