Preston, MO Map & Demographics
Preston Map
Preston Overview
$15,453
PER CAPITA INCOME
$47,500
AVG FAMILY INCOME
$30,536
AVG HOUSEHOLD INCOME
0.46
INEQUALITY / GINI INDEX
344
TOTAL POPULATION
167
MALE POPULATION
177
FEMALE POPULATION
94.35
MALES / 100 FEMALES
105.99
FEMALES / 100 MALES
32.2
MEDIAN AGE
3.6
AVG FAMILY SIZE
2.6
AVG HOUSEHOLD SIZE
155
LABOR FORCE [ PEOPLE ]
63.8%
PERCENT IN LABOR FORCE
7.7%
UNEMPLOYMENT RATE
Preston Zip Codes
Preston Area Codes
Income in Preston
Income Overview in Preston
Per Capita Income in Preston is $15,453, while median incomes of families and households are $47,500 and $30,536 respectively.
| Characteristic | Number | Measure |
| Per Capita Income | 344 | $15,453 |
| Median Family Income | 78 | $47,500 |
| Mean Family Income | 78 | $55,932 |
| Median Household Income | 133 | $30,536 |
| Mean Household Income | 133 | $40,820 |
| Income Deficit | 78 | $0 |
| Wage / Income Gap (%) | 344 | 0.00% |
| Wage / Income Gap ($) | 344 | 100.00¢ per $1 |
| Gini / Inequality Index | 344 | 0.46 |
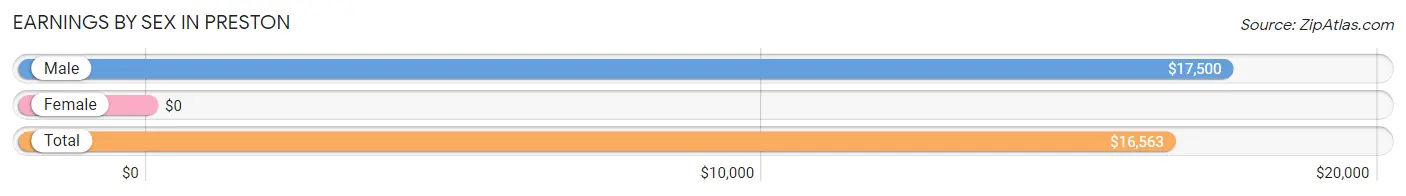
Earnings by Sex in Preston
| Sex | Number | Average Earnings |
| Male | 82 (51.6%) | $17,500 |
| Female | 77 (48.4%) | $0 |
| Total | 159 (100.0%) | $16,563 |
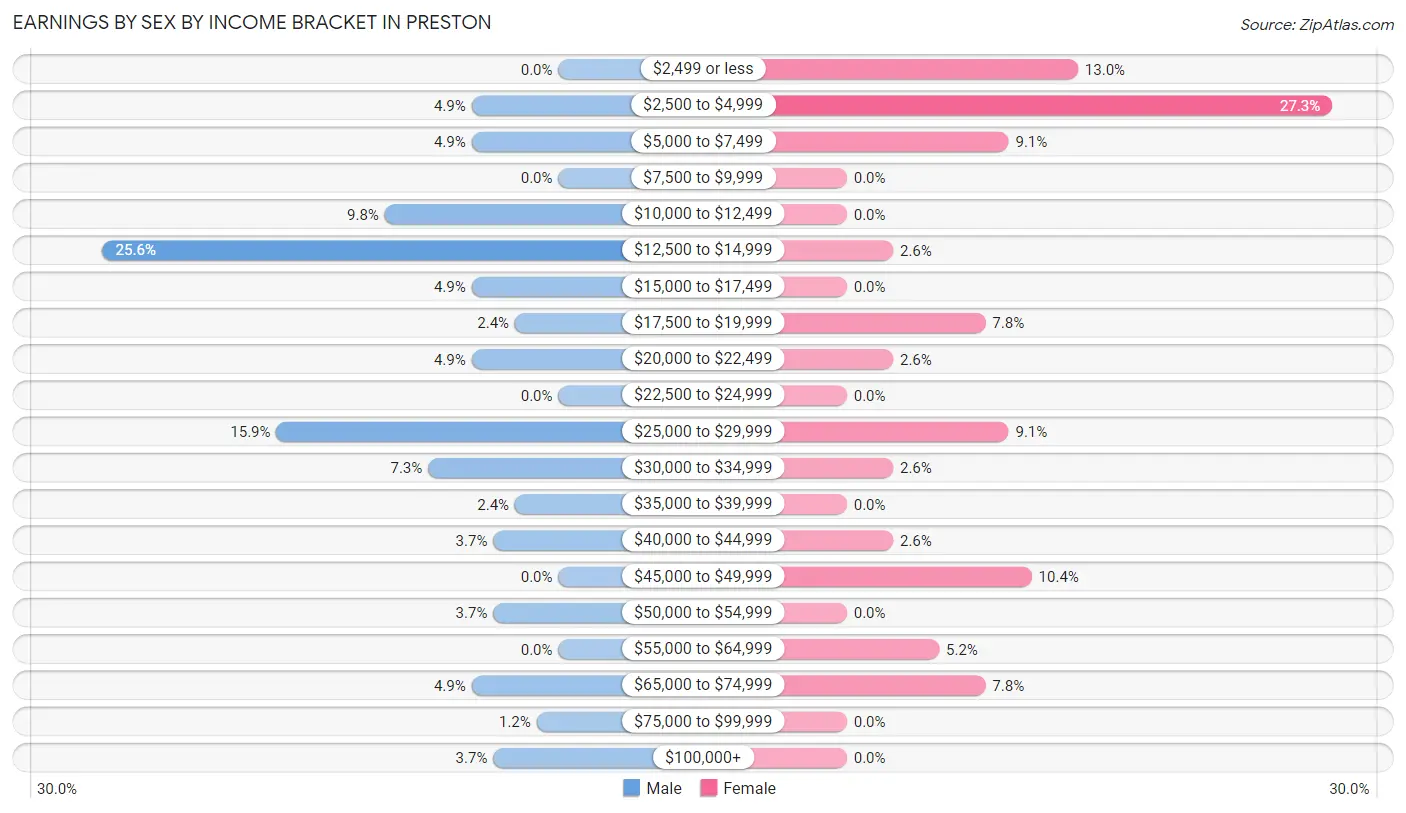
Earnings by Sex by Income Bracket in Preston
The most common earnings brackets in Preston are $12,500 to $14,999 for men (21 | 25.6%) and $2,500 to $4,999 for women (21 | 27.3%).
| Income | Male | Female |
| $2,499 or less | 0 (0.0%) | 10 (13.0%) |
| $2,500 to $4,999 | 4 (4.9%) | 21 (27.3%) |
| $5,000 to $7,499 | 4 (4.9%) | 7 (9.1%) |
| $7,500 to $9,999 | 0 (0.0%) | 0 (0.0%) |
| $10,000 to $12,499 | 8 (9.8%) | 0 (0.0%) |
| $12,500 to $14,999 | 21 (25.6%) | 2 (2.6%) |
| $15,000 to $17,499 | 4 (4.9%) | 0 (0.0%) |
| $17,500 to $19,999 | 2 (2.4%) | 6 (7.8%) |
| $20,000 to $22,499 | 4 (4.9%) | 2 (2.6%) |
| $22,500 to $24,999 | 0 (0.0%) | 0 (0.0%) |
| $25,000 to $29,999 | 13 (15.9%) | 7 (9.1%) |
| $30,000 to $34,999 | 6 (7.3%) | 2 (2.6%) |
| $35,000 to $39,999 | 2 (2.4%) | 0 (0.0%) |
| $40,000 to $44,999 | 3 (3.7%) | 2 (2.6%) |
| $45,000 to $49,999 | 0 (0.0%) | 8 (10.4%) |
| $50,000 to $54,999 | 3 (3.7%) | 0 (0.0%) |
| $55,000 to $64,999 | 0 (0.0%) | 4 (5.2%) |
| $65,000 to $74,999 | 4 (4.9%) | 6 (7.8%) |
| $75,000 to $99,999 | 1 (1.2%) | 0 (0.0%) |
| $100,000+ | 3 (3.7%) | 0 (0.0%) |
| Total | 82 (100.0%) | 77 (100.0%) |
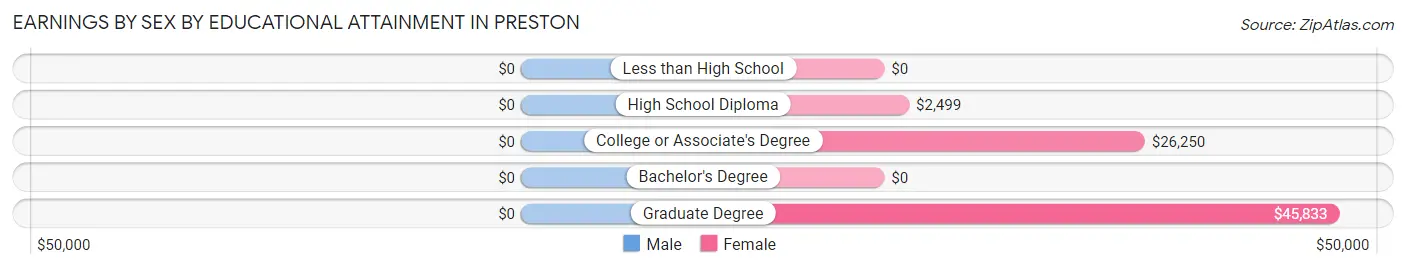
Earnings by Sex by Educational Attainment in Preston
| Educational Attainment | Male Income | Female Income |
| Less than High School | - | - |
| High School Diploma | - | - |
| College or Associate's Degree | - | - |
| Bachelor's Degree | - | - |
| Graduate Degree | - | - |
| Total | $26,500 | $23,750 |
Family Income in Preston
Family Income Brackets in Preston
According to the Preston family income data, there are 20 families falling into the $25,000 to $34,999 income range, which is the most common income bracket and makes up 25.6% of all families.
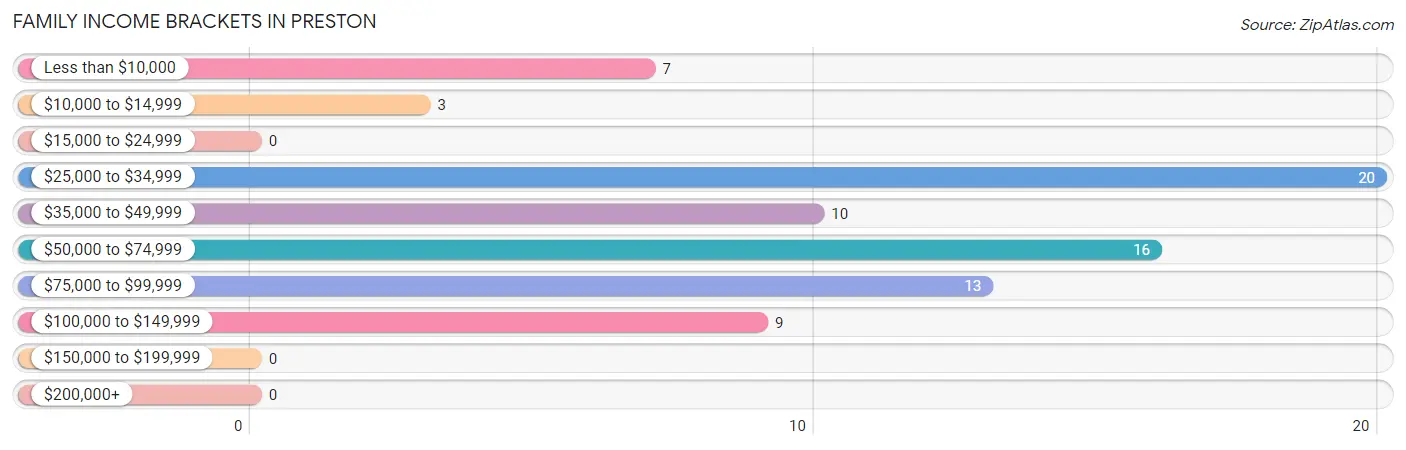
| Income Bracket | # Families | % Families |
| Less than $10,000 | 7 | 9.0% |
| $10,000 to $14,999 | 3 | 3.8% |
| $15,000 to $24,999 | 0 | 0.0% |
| $25,000 to $34,999 | 20 | 25.6% |
| $35,000 to $49,999 | 10 | 12.8% |
| $50,000 to $74,999 | 16 | 20.5% |
| $75,000 to $99,999 | 13 | 16.7% |
| $100,000 to $149,999 | 9 | 11.5% |
| $150,000 to $199,999 | 0 | 0.0% |
| $200,000+ | 0 | 0.0% |
Family Income by Famaliy Size in Preston
3-person families (27 | 34.6%) account for the highest median family income in Preston with $65,417 per family, while 2-person families (29 | 37.2%) have the highest median income of $31,562 per family member.
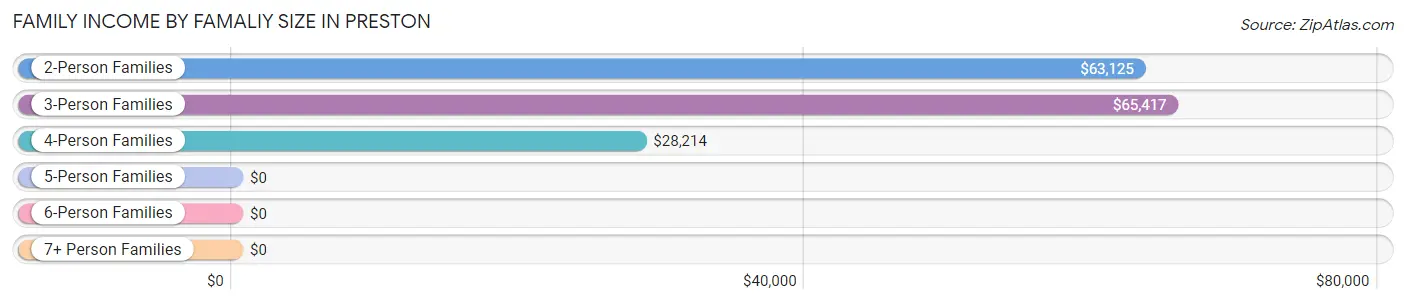
| Income Bracket | # Families | Median Income |
| 2-Person Families | 29 (37.2%) | $63,125 |
| 3-Person Families | 27 (34.6%) | $65,417 |
| 4-Person Families | 18 (23.1%) | $28,214 |
| 5-Person Families | 4 (5.1%) | $0 |
| 6-Person Families | 0 (0.0%) | $0 |
| 7+ Person Families | 0 (0.0%) | $0 |
| Total | 78 (100.0%) | $47,500 |
Family Income by Number of Earners in Preston
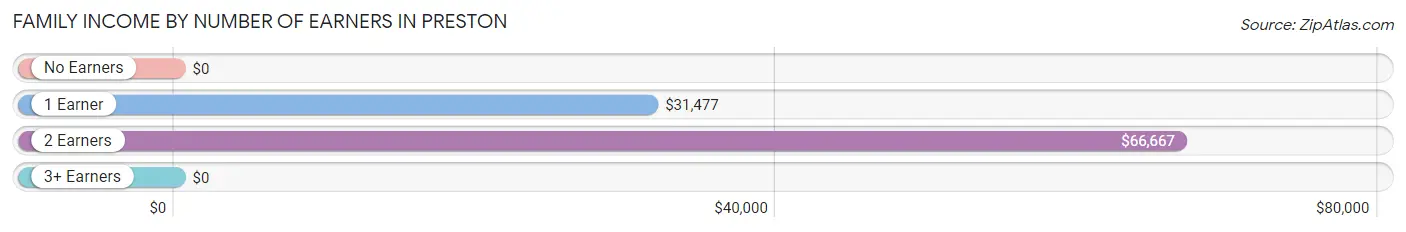
| Number of Earners | # Families | Median Income |
| No Earners | 7 (9.0%) | $0 |
| 1 Earner | 33 (42.3%) | $31,477 |
| 2 Earners | 34 (43.6%) | $66,667 |
| 3+ Earners | 4 (5.1%) | $0 |
| Total | 78 (100.0%) | $47,500 |
Household Income in Preston
Household Income Brackets in Preston
With 28 households falling in the category, the less than $10,000 income range is the most frequent in Preston, accounting for 21.0% of all households.
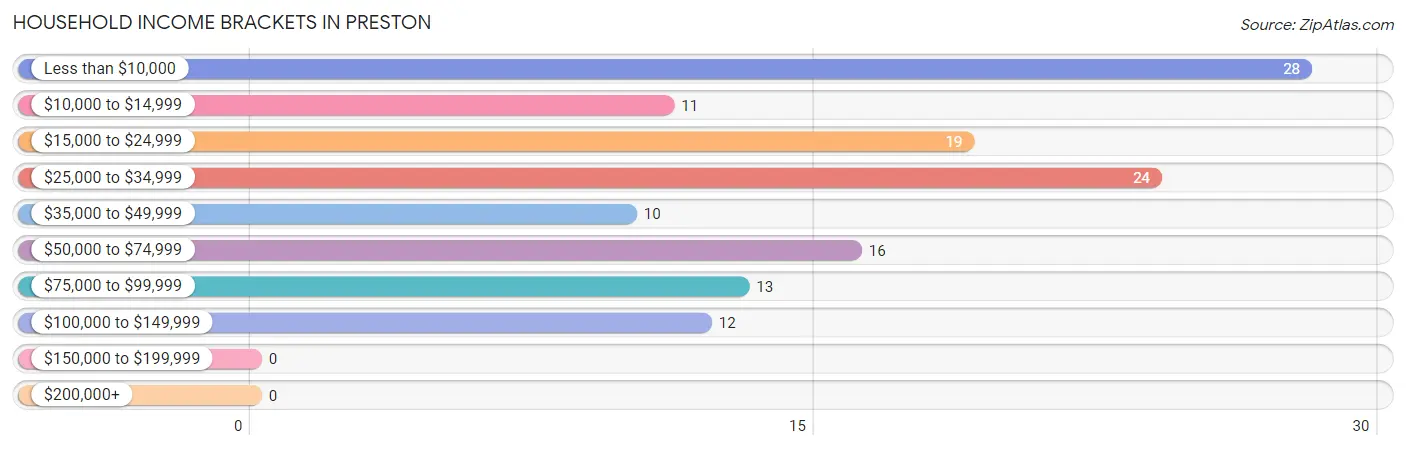
| Income Bracket | # Households | % Households |
| Less than $10,000 | 28 | 21.1% |
| $10,000 to $14,999 | 11 | 8.3% |
| $15,000 to $24,999 | 19 | 14.3% |
| $25,000 to $34,999 | 24 | 18.0% |
| $35,000 to $49,999 | 10 | 7.5% |
| $50,000 to $74,999 | 16 | 12.0% |
| $75,000 to $99,999 | 13 | 9.8% |
| $100,000 to $149,999 | 12 | 9.0% |
| $150,000 to $199,999 | 0 | 0.0% |
| $200,000+ | 0 | 0.0% |
Household Income by Householder Age in Preston
The median household income in Preston is $30,536, with the highest median household income of $31,786 found in the 45 to 64 years age bracket for the primary householder. A total of 34 households (25.6%) fall into this category. Meanwhile, the 15 to 24 years age bracket for the primary householder has the lowest median household income of $0, with 9 households (6.8%) in this group.
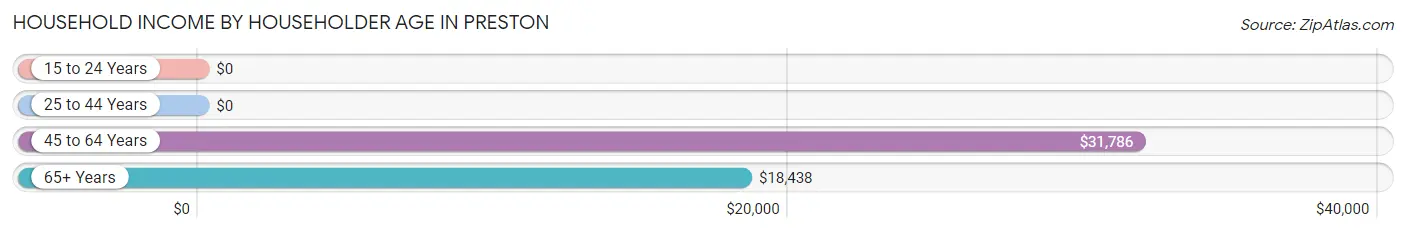
| Income Bracket | # Households | Median Income |
| 15 to 24 Years | 9 (6.8%) | $0 |
| 25 to 44 Years | 39 (29.3%) | $0 |
| 45 to 64 Years | 34 (25.6%) | $31,786 |
| 65+ Years | 51 (38.4%) | $18,438 |
| Total | 133 (100.0%) | $30,536 |
Poverty in Preston
Income Below Poverty by Sex and Age in Preston
With 22.8% poverty level for males and 41.8% for females among the residents of Preston, 5 year old males and 18 to 24 year old females are the most vulnerable to poverty, with 6 males (100.0%) and 21 females (70.0%) in their respective age groups living below the poverty level.
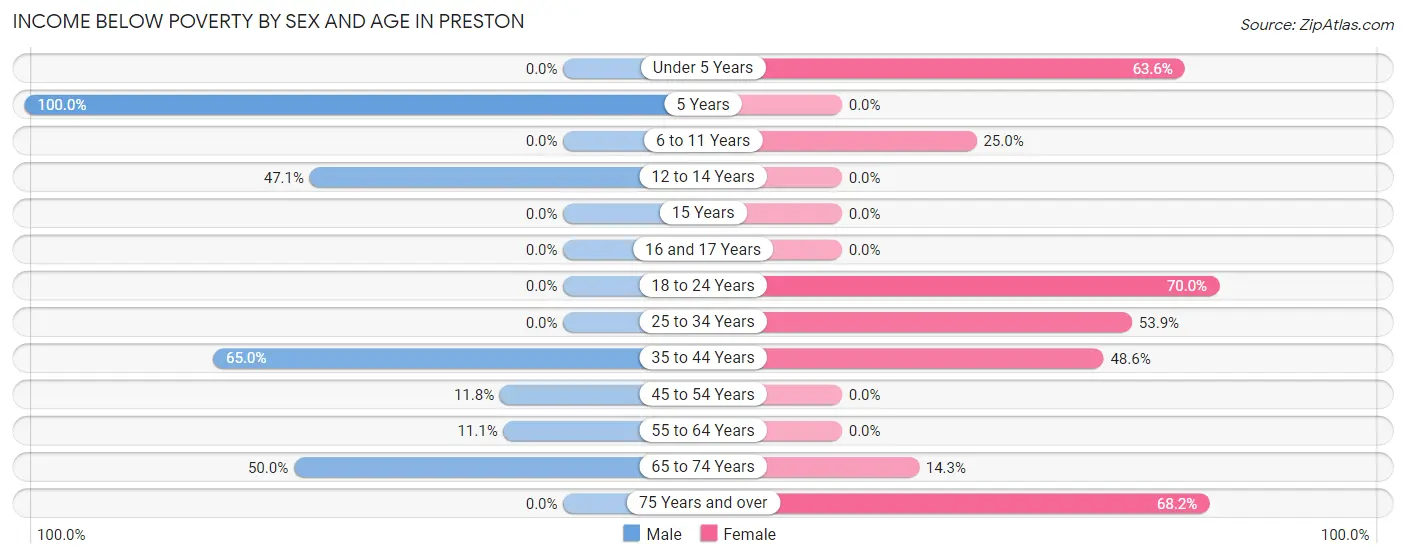
| Age Bracket | Male | Female |
| Under 5 Years | 0 (0.0%) | 7 (63.6%) |
| 5 Years | 6 (100.0%) | 0 (0.0%) |
| 6 to 11 Years | 0 (0.0%) | 5 (25.0%) |
| 12 to 14 Years | 8 (47.1%) | 0 (0.0%) |
| 15 Years | 0 (0.0%) | 0 (0.0%) |
| 16 and 17 Years | 0 (0.0%) | 0 (0.0%) |
| 18 to 24 Years | 0 (0.0%) | 21 (70.0%) |
| 25 to 34 Years | 0 (0.0%) | 7 (53.8%) |
| 35 to 44 Years | 13 (65.0%) | 17 (48.6%) |
| 45 to 54 Years | 2 (11.8%) | 0 (0.0%) |
| 55 to 64 Years | 2 (11.1%) | 0 (0.0%) |
| 65 to 74 Years | 7 (50.0%) | 2 (14.3%) |
| 75 Years and over | 0 (0.0%) | 15 (68.2%) |
| Total | 38 (22.8%) | 74 (41.8%) |
Income Above Poverty by Sex and Age in Preston
According to the poverty statistics in Preston, males aged under 5 years and females aged 5 years are the age groups that are most secure financially, with 100.0% of males and 100.0% of females in these age groups living above the poverty line.
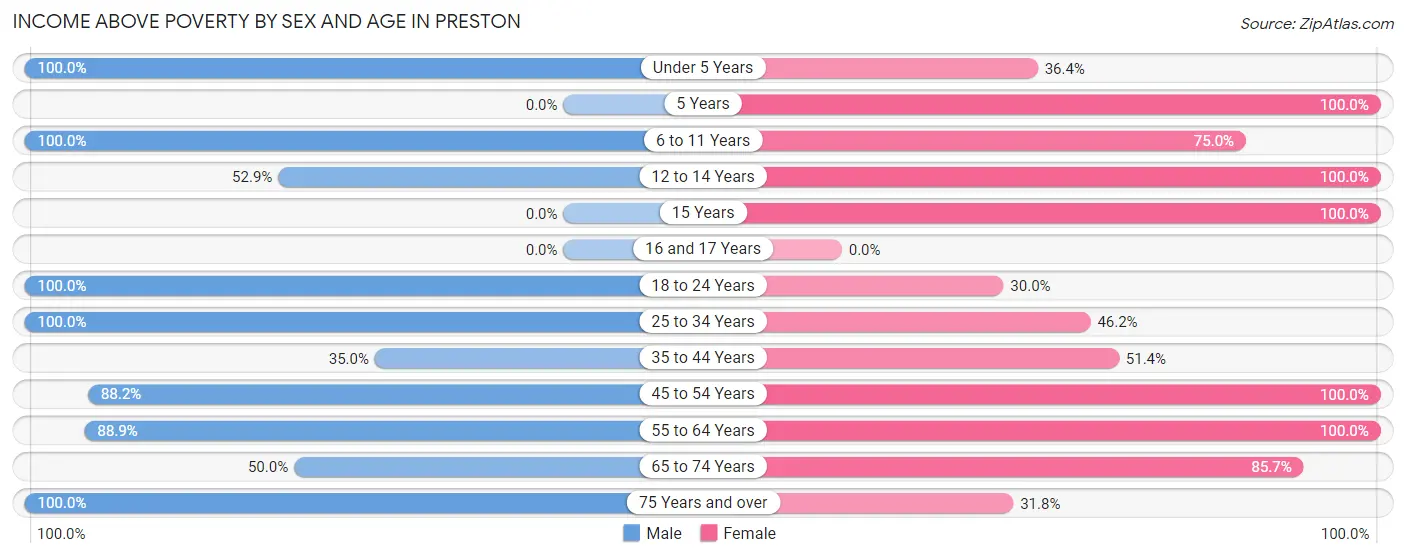
| Age Bracket | Male | Female |
| Under 5 Years | 23 (100.0%) | 4 (36.4%) |
| 5 Years | 0 (0.0%) | 3 (100.0%) |
| 6 to 11 Years | 5 (100.0%) | 15 (75.0%) |
| 12 to 14 Years | 9 (52.9%) | 2 (100.0%) |
| 15 Years | 0 (0.0%) | 14 (100.0%) |
| 16 and 17 Years | 0 (0.0%) | 0 (0.0%) |
| 18 to 24 Years | 36 (100.0%) | 9 (30.0%) |
| 25 to 34 Years | 2 (100.0%) | 6 (46.2%) |
| 35 to 44 Years | 7 (35.0%) | 18 (51.4%) |
| 45 to 54 Years | 15 (88.2%) | 10 (100.0%) |
| 55 to 64 Years | 16 (88.9%) | 3 (100.0%) |
| 65 to 74 Years | 7 (50.0%) | 12 (85.7%) |
| 75 Years and over | 9 (100.0%) | 7 (31.8%) |
| Total | 129 (77.2%) | 103 (58.2%) |
Income Below Poverty Among Married-Couple Families in Preston
The poverty statistics for married-couple families in Preston show that 14.9% or 7 of the total 47 families live below the poverty line. Families with 1 or 2 children have the highest poverty rate of 25.0%, comprising of 7 families. On the other hand, families with no children have the lowest poverty rate of 0.0%, which includes 0 families.
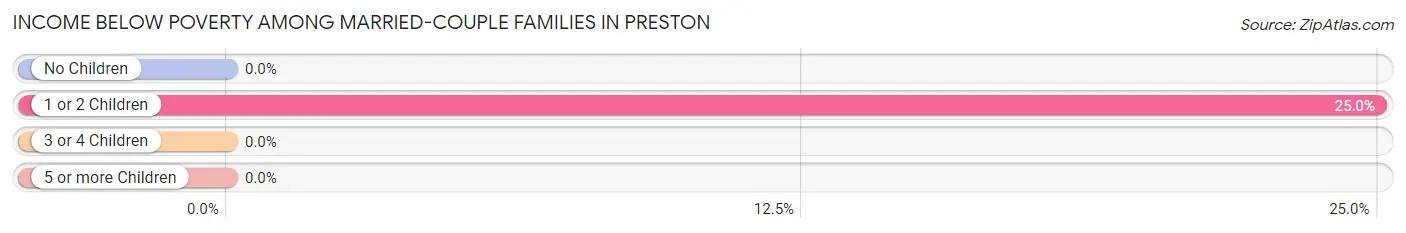
| Children | Above Poverty | Below Poverty |
| No Children | 19 (100.0%) | 0 (0.0%) |
| 1 or 2 Children | 21 (75.0%) | 7 (25.0%) |
| 3 or 4 Children | 0 (0.0%) | 0 (0.0%) |
| 5 or more Children | 0 (0.0%) | 0 (0.0%) |
| Total | 40 (85.1%) | 7 (14.9%) |
Income Below Poverty Among Single-Parent Households in Preston
According to the poverty data in Preston, 18.8% or 3 single-father households and 46.7% or 7 single-mother households are living below the poverty line. Among single-father households, those with no children have the highest poverty rate, with 3 households (25.0%) experiencing poverty. Likewise, among single-mother households, those with 1 or 2 children have the highest poverty rate, with 7 households (46.7%) falling below the poverty line.
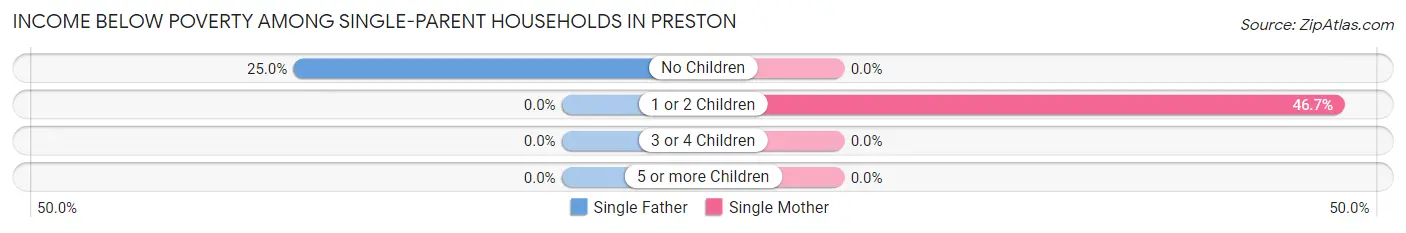
| Children | Single Father | Single Mother |
| No Children | 3 (25.0%) | 0 (0.0%) |
| 1 or 2 Children | 0 (0.0%) | 7 (46.7%) |
| 3 or 4 Children | 0 (0.0%) | 0 (0.0%) |
| 5 or more Children | 0 (0.0%) | 0 (0.0%) |
| Total | 3 (18.8%) | 7 (46.7%) |
Income Below Poverty Among Married-Couple vs Single-Parent Households in Preston
The poverty data for Preston shows that 7 of the married-couple family households (14.9%) and 10 of the single-parent households (32.3%) are living below the poverty level. Within the married-couple family households, those with 1 or 2 children have the highest poverty rate, with 7 households (25.0%) falling below the poverty line. Among the single-parent households, those with 1 or 2 children have the highest poverty rate, with 7 household (36.8%) living below poverty.
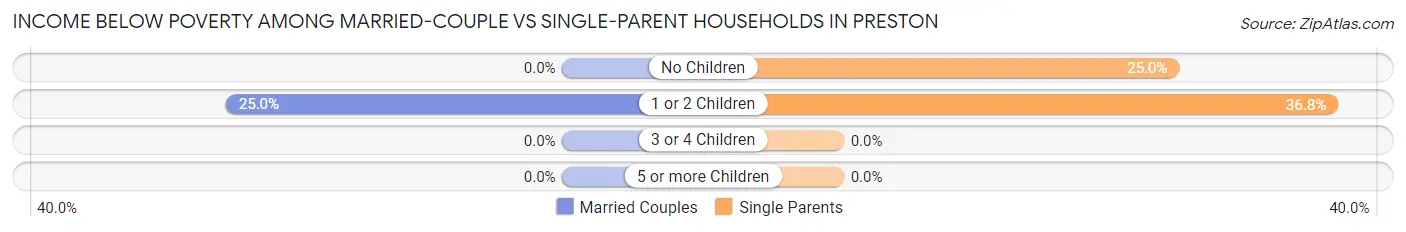
| Children | Married-Couple Families | Single-Parent Households |
| No Children | 0 (0.0%) | 3 (25.0%) |
| 1 or 2 Children | 7 (25.0%) | 7 (36.8%) |
| 3 or 4 Children | 0 (0.0%) | 0 (0.0%) |
| 5 or more Children | 0 (0.0%) | 0 (0.0%) |
| Total | 7 (14.9%) | 10 (32.3%) |
Race in Preston
The most populous races in Preston are White / Caucasian (285 | 82.9%), Two or more Races (31 | 9.0%), and Hispanic or Latino (28 | 8.1%).
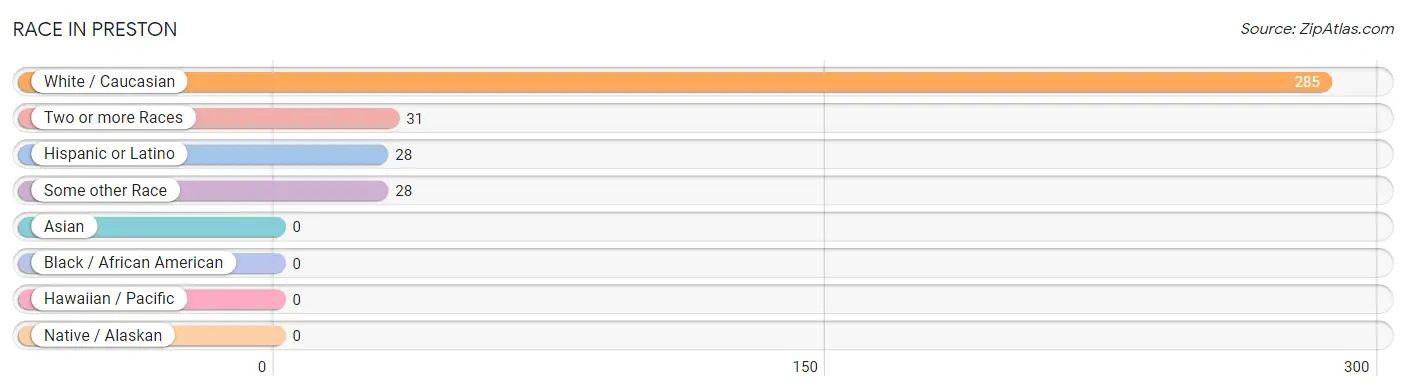
| Race | # Population | % Population |
| Asian | 0 | 0.0% |
| Black / African American | 0 | 0.0% |
| Hawaiian / Pacific | 0 | 0.0% |
| Hispanic or Latino | 28 | 8.1% |
| Native / Alaskan | 0 | 0.0% |
| White / Caucasian | 285 | 82.9% |
| Two or more Races | 31 | 9.0% |
| Some other Race | 28 | 8.1% |
| Total | 344 | 100.0% |
Ancestry in Preston
The most populous ancestries reported in Preston are German (98 | 28.5%), European (52 | 15.1%), Irish (33 | 9.6%), Mexican (28 | 8.1%), and English (24 | 7.0%), together accounting for 68.3% of all Preston residents.
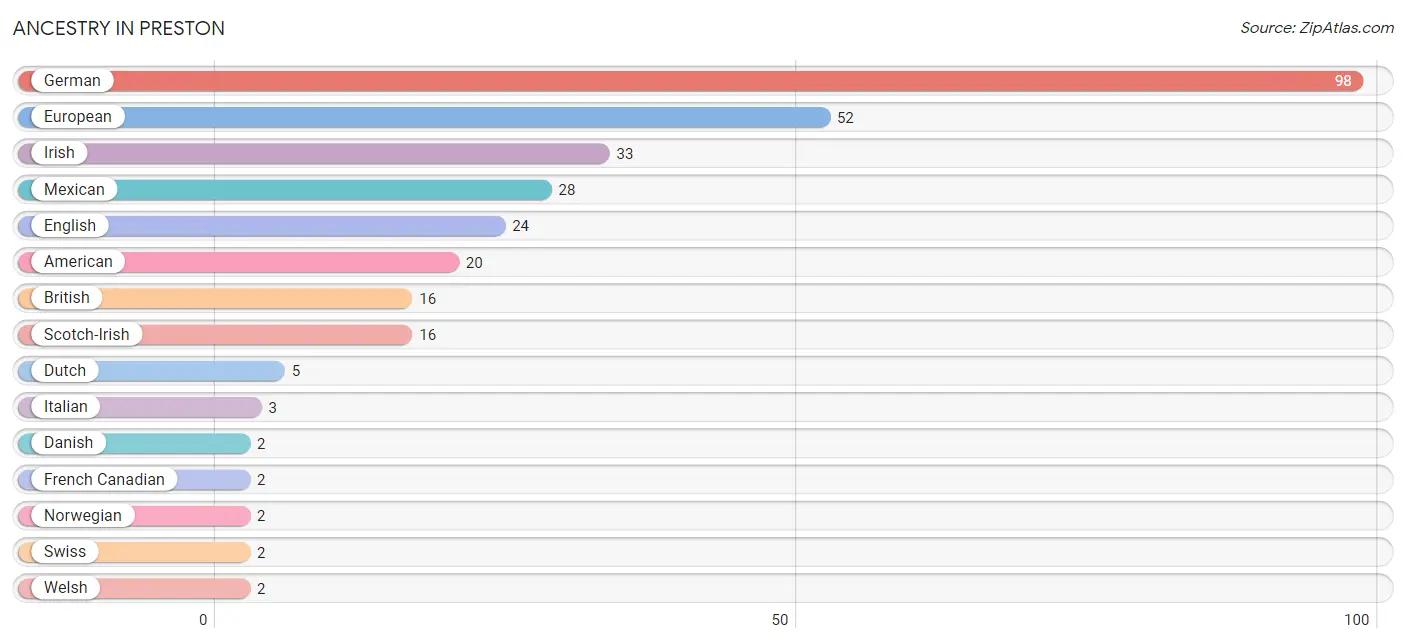
| Ancestry | # Population | % Population |
| American | 20 | 5.8% |
| Belgian | 1 | 0.3% |
| British | 16 | 4.6% |
| Danish | 2 | 0.6% |
| Dutch | 5 | 1.5% |
| English | 24 | 7.0% |
| European | 52 | 15.1% |
| French Canadian | 2 | 0.6% |
| German | 98 | 28.5% |
| Irish | 33 | 9.6% |
| Italian | 3 | 0.9% |
| Mexican | 28 | 8.1% |
| Norwegian | 2 | 0.6% |
| Scotch-Irish | 16 | 4.6% |
| Swiss | 2 | 0.6% |
| Welsh | 2 | 0.6% | View All 16 Rows |
Immigrants in Preston

| Immigration Origin | # Population | % Population | View All 0 Rows |
Sex and Age in Preston
Sex and Age in Preston
The most populous age groups in Preston are 20 to 24 Years (32 | 19.2%) for men and 15 to 19 Years (33 | 18.6%) for women.
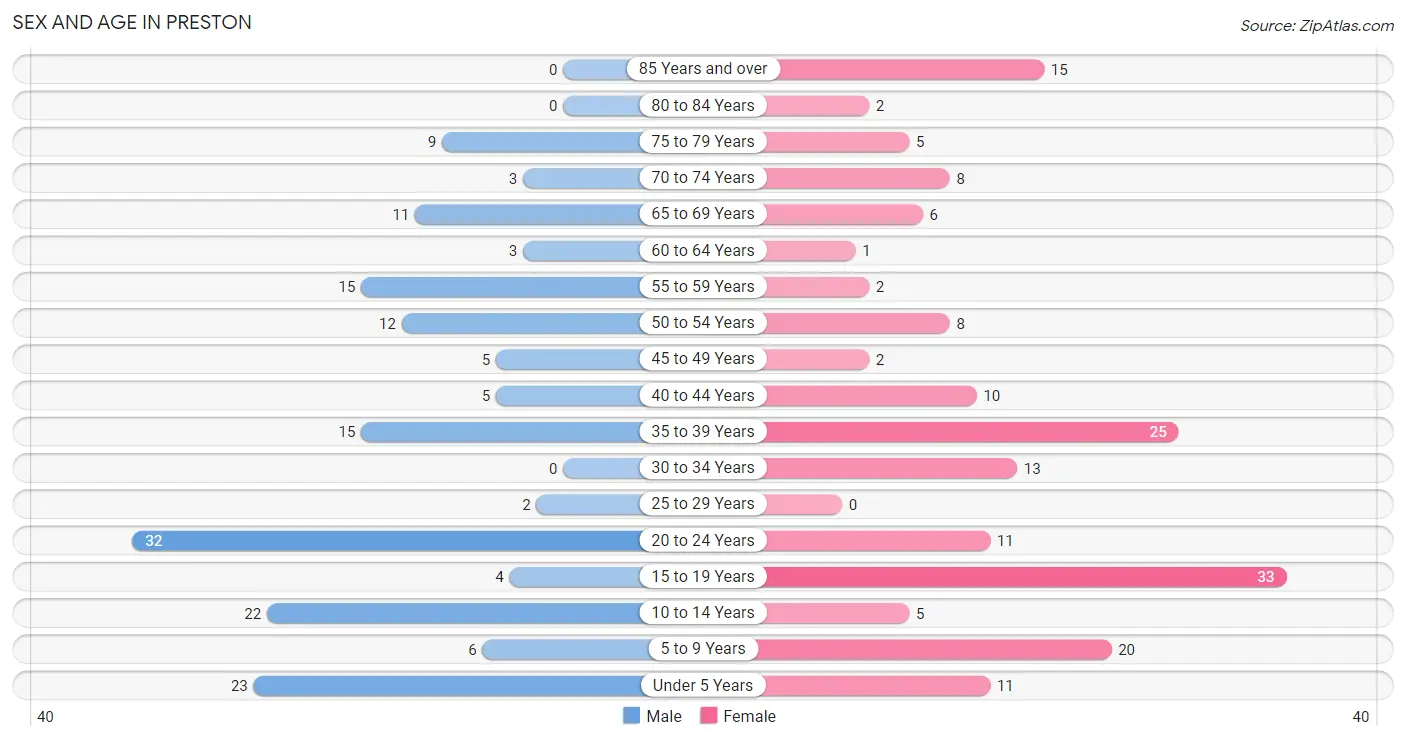
| Age Bracket | Male | Female |
| Under 5 Years | 23 (13.8%) | 11 (6.2%) |
| 5 to 9 Years | 6 (3.6%) | 20 (11.3%) |
| 10 to 14 Years | 22 (13.2%) | 5 (2.8%) |
| 15 to 19 Years | 4 (2.4%) | 33 (18.6%) |
| 20 to 24 Years | 32 (19.2%) | 11 (6.2%) |
| 25 to 29 Years | 2 (1.2%) | 0 (0.0%) |
| 30 to 34 Years | 0 (0.0%) | 13 (7.3%) |
| 35 to 39 Years | 15 (9.0%) | 25 (14.1%) |
| 40 to 44 Years | 5 (3.0%) | 10 (5.7%) |
| 45 to 49 Years | 5 (3.0%) | 2 (1.1%) |
| 50 to 54 Years | 12 (7.2%) | 8 (4.5%) |
| 55 to 59 Years | 15 (9.0%) | 2 (1.1%) |
| 60 to 64 Years | 3 (1.8%) | 1 (0.6%) |
| 65 to 69 Years | 11 (6.6%) | 6 (3.4%) |
| 70 to 74 Years | 3 (1.8%) | 8 (4.5%) |
| 75 to 79 Years | 9 (5.4%) | 5 (2.8%) |
| 80 to 84 Years | 0 (0.0%) | 2 (1.1%) |
| 85 Years and over | 0 (0.0%) | 15 (8.5%) |
| Total | 167 (100.0%) | 177 (100.0%) |
Families and Households in Preston
Median Family Size in Preston
The median family size in Preston is 3.63 persons per family, with single male/father families (16 | 20.5%) accounting for the largest median family size of 4.69 persons per family. On the other hand, married-couple families (47 | 60.3%) represent the smallest median family size with 3.11 persons per family.
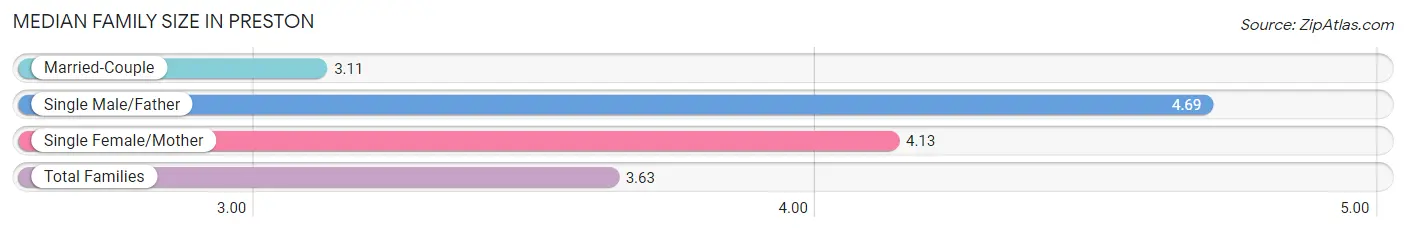
| Family Type | # Families | Family Size |
| Married-Couple | 47 (60.3%) | 3.11 |
| Single Male/Father | 16 (20.5%) | 4.69 |
| Single Female/Mother | 15 (19.2%) | 4.13 |
| Total Families | 78 (100.0%) | 3.63 |
Median Household Size in Preston
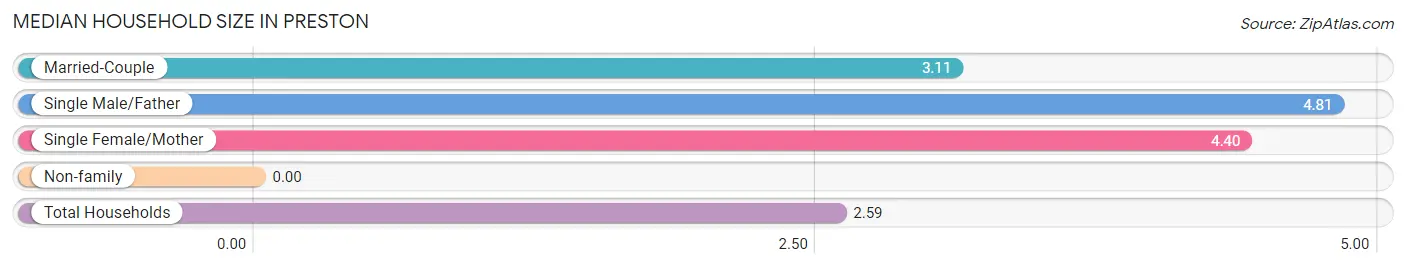
| Household Type | # Households | Household Size |
| Married-Couple | 47 (35.3%) | 3.11 |
| Single Male/Father | 16 (12.0%) | 4.81 |
| Single Female/Mother | 15 (11.3%) | 4.40 |
| Non-family | 55 (41.3%) | - |
| Total Households | 133 (100.0%) | 2.59 |
Household Size by Marriage Status in Preston
Out of a total of 133 households in Preston, 78 (58.7%) are family households, while 55 (41.3%) are nonfamily households. The most numerous type of family households are 2-person households, comprising 29, and the most common type of nonfamily households are 1-person households, comprising 55.
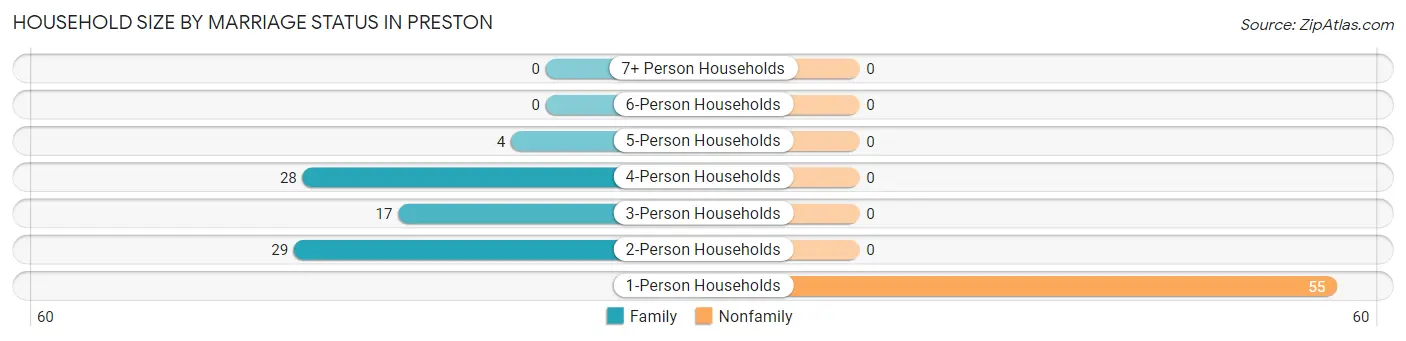
| Household Size | Family Households | Nonfamily Households |
| 1-Person Households | - | 55 (41.3%) |
| 2-Person Households | 29 (21.8%) | 0 (0.0%) |
| 3-Person Households | 17 (12.8%) | 0 (0.0%) |
| 4-Person Households | 28 (21.0%) | 0 (0.0%) |
| 5-Person Households | 4 (3.0%) | 0 (0.0%) |
| 6-Person Households | 0 (0.0%) | 0 (0.0%) |
| 7+ Person Households | 0 (0.0%) | 0 (0.0%) |
| Total | 78 (58.7%) | 55 (41.3%) |
Female Fertility in Preston
Fertility by Age in Preston
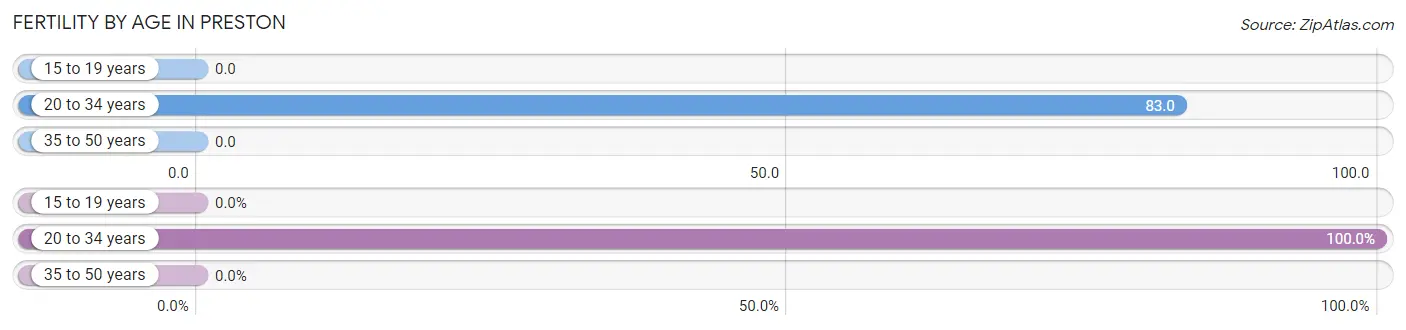
Average fertility rate in Preston is 21.0 births per 1,000 women. Women in the age bracket of 20 to 34 years have the highest fertility rate with 83.0 births per 1,000 women. Women in the age bracket of 20 to 34 years acount for 100.0% of all women with births.
| Age Bracket | Women with Births | Births / 1,000 Women |
| 15 to 19 years | 0 (0.0%) | 0.0 |
| 20 to 34 years | 2 (100.0%) | 83.0 |
| 35 to 50 years | 0 (0.0%) | 0.0 |
| Total | 2 (100.0%) | 21.0 |
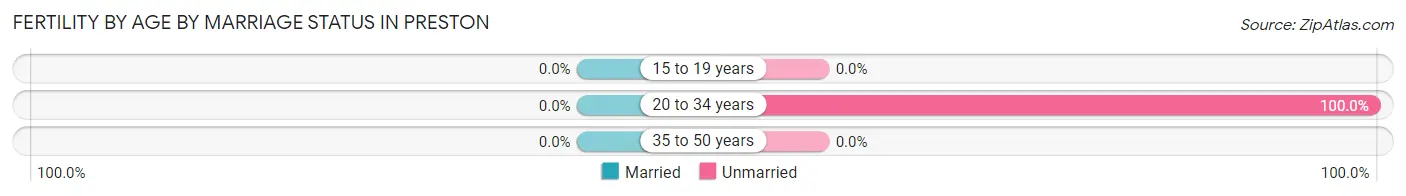
Fertility by Age by Marriage Status in Preston
| Age Bracket | Married | Unmarried |
| 15 to 19 years | 0 (0.0%) | 0 (0.0%) |
| 20 to 34 years | 0 (0.0%) | 2 (100.0%) |
| 35 to 50 years | 0 (0.0%) | 0 (0.0%) |
| Total | 0 (0.0%) | 2 (100.0%) |
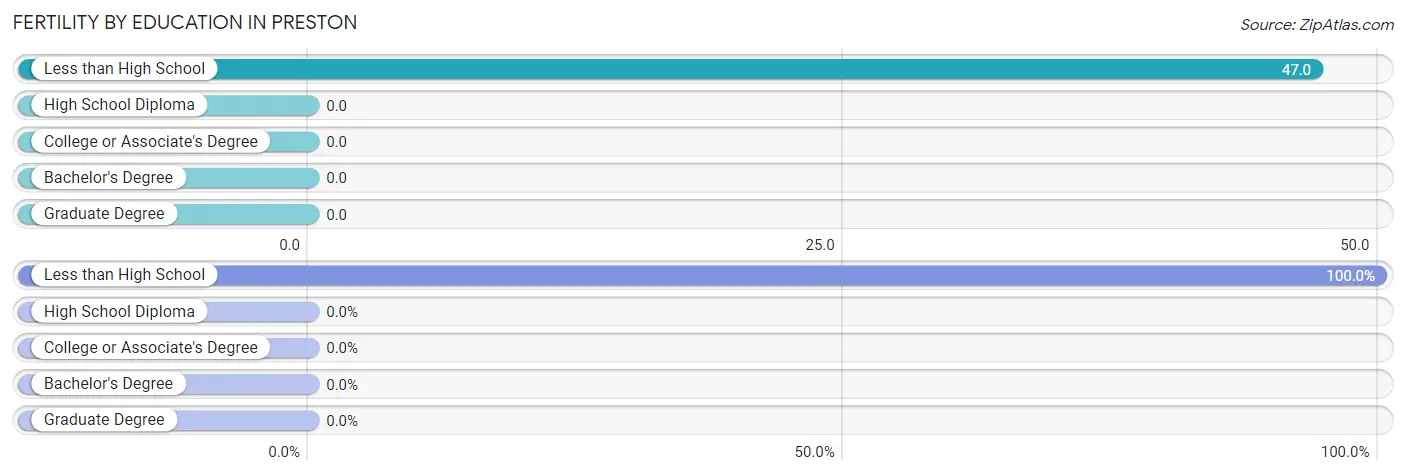
Fertility by Education in Preston
| Educational Attainment | Women with Births | Births / 1,000 Women |
| Less than High School | 2 (100.0%) | 47.0 |
| High School Diploma | 0 (0.0%) | 0.0 |
| College or Associate's Degree | 0 (0.0%) | 0.0 |
| Bachelor's Degree | 0 (0.0%) | 0.0 |
| Graduate Degree | 0 (0.0%) | 0.0 |
| Total | 2 (100.0%) | 21.0 |
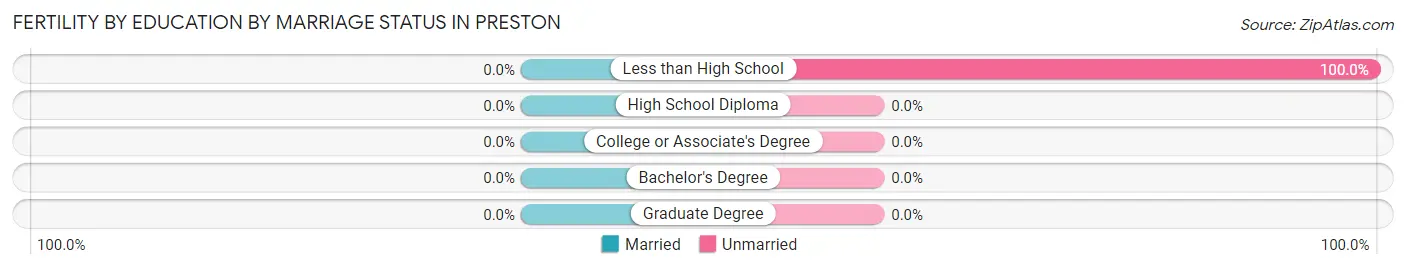
Fertility by Education by Marriage Status in Preston
| Educational Attainment | Married | Unmarried |
| Less than High School | 0 (0.0%) | 2 (100.0%) |
| High School Diploma | 0 (0.0%) | 0 (0.0%) |
| College or Associate's Degree | 0 (0.0%) | 0 (0.0%) |
| Bachelor's Degree | 0 (0.0%) | 0 (0.0%) |
| Graduate Degree | 0 (0.0%) | 0 (0.0%) |
| Total | 0 (0.0%) | 2 (100.0%) |
Employment Characteristics in Preston
Employment by Class of Employer in Preston
Among the 143 employed individuals in Preston, private company employees (88 | 61.5%), not-for-profit organizations (27 | 18.9%), and self-employed (incorporated) (16 | 11.2%) make up the most common classes of employment.
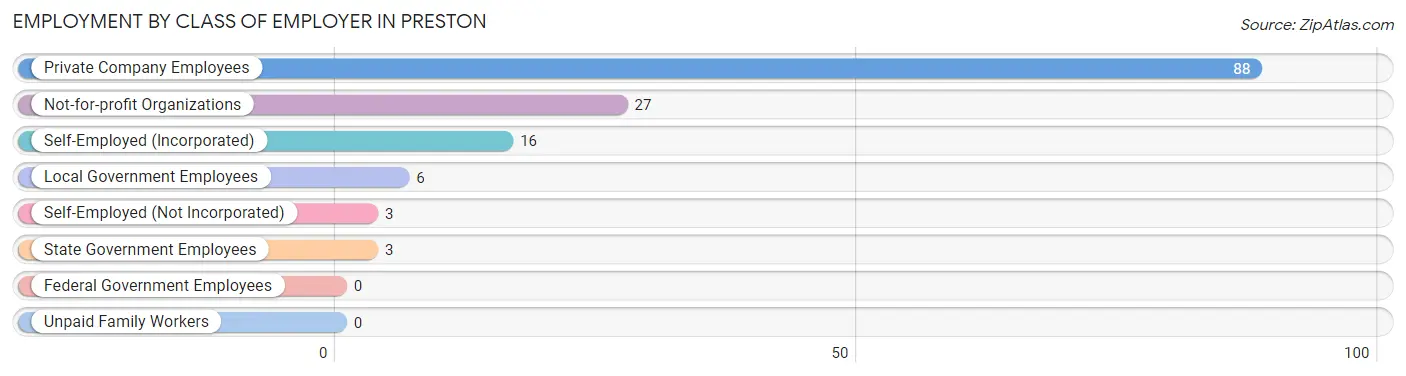
| Employer Class | # Employees | % Employees |
| Private Company Employees | 88 | 61.5% |
| Self-Employed (Incorporated) | 16 | 11.2% |
| Self-Employed (Not Incorporated) | 3 | 2.1% |
| Not-for-profit Organizations | 27 | 18.9% |
| Local Government Employees | 6 | 4.2% |
| State Government Employees | 3 | 2.1% |
| Federal Government Employees | 0 | 0.0% |
| Unpaid Family Workers | 0 | 0.0% |
| Total | 143 | 100.0% |
Employment Status by Age in Preston
According to the labor force statistics for Preston, out of the total population over 16 years of age (243), 63.8% or 155 individuals are in the labor force, with 7.7% or 12 of them unemployed. The age group with the highest labor force participation rate is 16 to 19 years, with 100.0% or 23 individuals in the labor force. Within the labor force, the 45 to 54 years age range has the highest percentage of unemployed individuals, with 27.8% or 5 of them being unemployed.
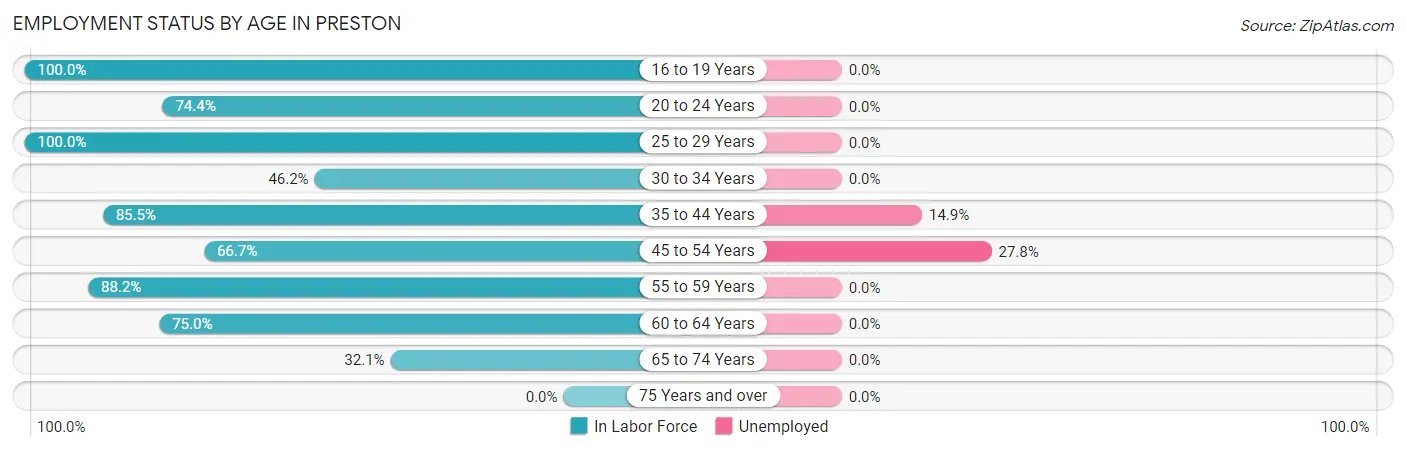
| Age Bracket | In Labor Force | Unemployed |
| 16 to 19 Years | 23 (100.0%) | 0 (0.0%) |
| 20 to 24 Years | 32 (74.4%) | 0 (0.0%) |
| 25 to 29 Years | 2 (100.0%) | 0 (0.0%) |
| 30 to 34 Years | 6 (46.2%) | 0 (0.0%) |
| 35 to 44 Years | 47 (85.5%) | 7 (14.9%) |
| 45 to 54 Years | 18 (66.7%) | 5 (27.8%) |
| 55 to 59 Years | 15 (88.2%) | 0 (0.0%) |
| 60 to 64 Years | 3 (75.0%) | 0 (0.0%) |
| 65 to 74 Years | 9 (32.1%) | 0 (0.0%) |
| 75 Years and over | 0 (0.0%) | 0 (0.0%) |
| Total | 155 (63.8%) | 12 (7.7%) |
Employment Status by Educational Attainment in Preston
According to labor force statistics for Preston, 77.1% of individuals (91) out of the total population between 25 and 64 years of age (118) are in the labor force, with 13.2% or 12 of them being unemployed. The group with the highest labor force participation rate are those with the educational attainment of less than high school, with 100.0% or 14 individuals in the labor force. Within the labor force, individuals with college / associate degree education have the highest percentage of unemployment, with 22.6% or 7 of them being unemployed.
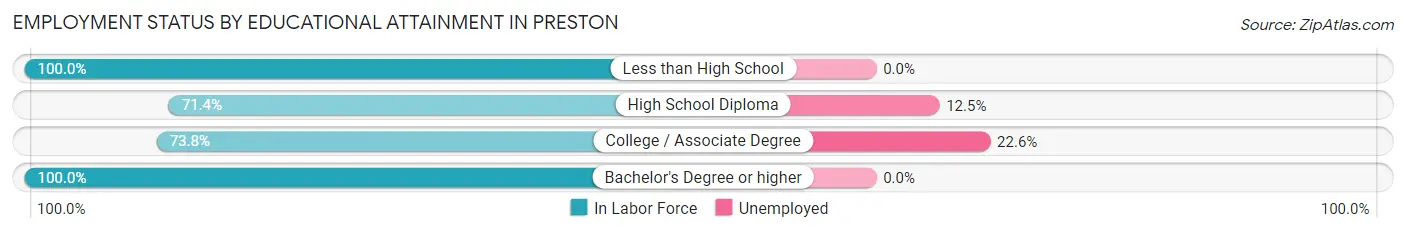
| Educational Attainment | In Labor Force | Unemployed |
| Less than High School | 14 (100.0%) | 0 (0.0%) |
| High School Diploma | 40 (71.4%) | 7 (12.5%) |
| College / Associate Degree | 31 (73.8%) | 9 (22.6%) |
| Bachelor's Degree or higher | 6 (100.0%) | 0 (0.0%) |
| Total | 91 (77.1%) | 16 (13.2%) |
Employment Occupations by Sex in Preston
Management, Business, Science and Arts Occupations
The most common Management, Business, Science and Arts occupations in Preston are Health Diagnosing & Treating (19 | 13.3%), Management (15 | 10.5%), Community & Social Service (10 | 7.0%), Business & Financial (6 | 4.2%), and Education Instruction & Library (6 | 4.2%).
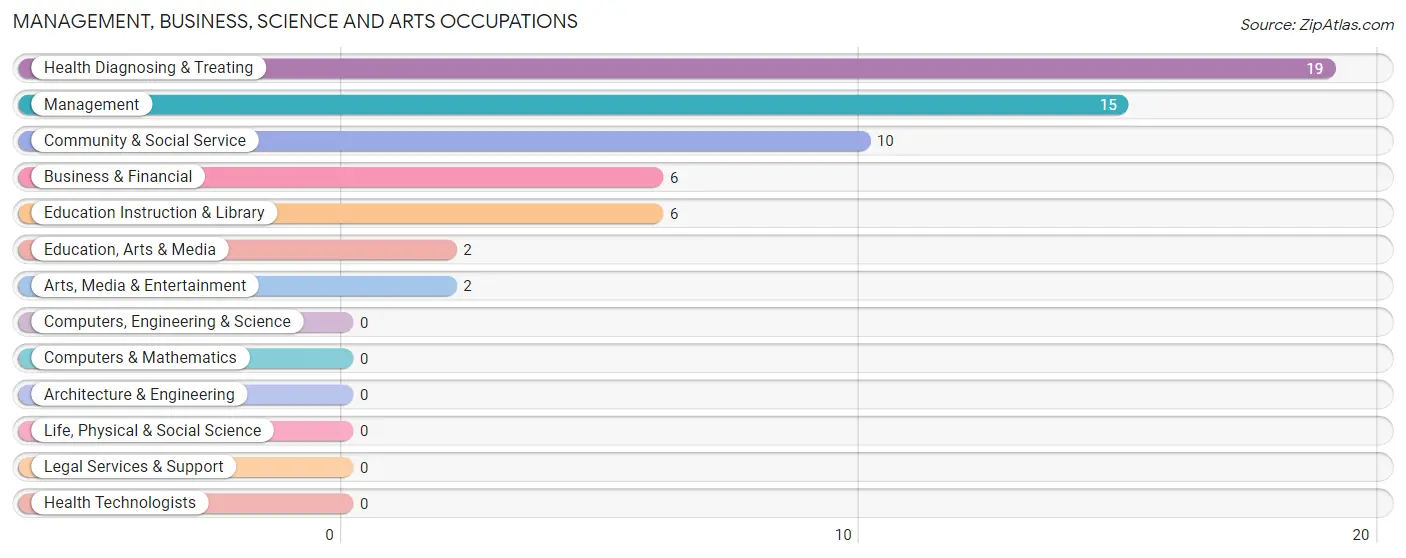
Management, Business, Science and Arts Occupations by Sex
Within the Management, Business, Science and Arts occupations in Preston, the most male-oriented occupations are Health Diagnosing & Treating (100.0%), Business & Financial (66.7%), and Management (33.3%), while the most female-oriented occupations are Community & Social Service (100.0%), Education, Arts & Media (100.0%), and Education Instruction & Library (100.0%).
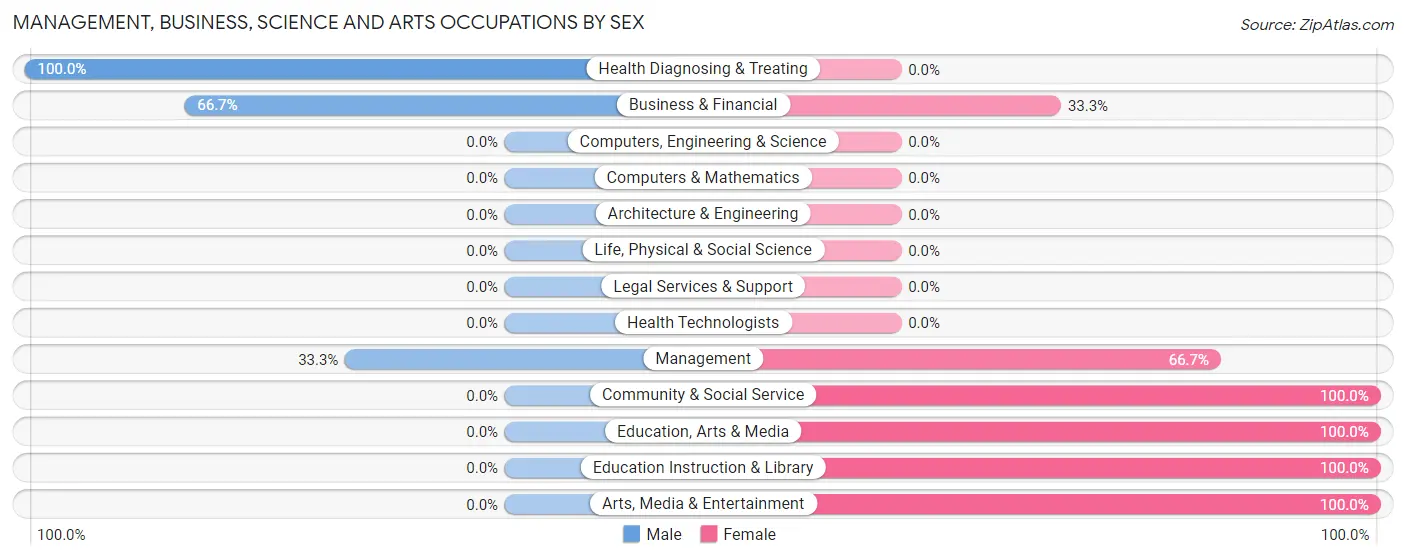
| Occupation | Male | Female |
| Management | 5 (33.3%) | 10 (66.7%) |
| Business & Financial | 4 (66.7%) | 2 (33.3%) |
| Computers, Engineering & Science | 0 (0.0%) | 0 (0.0%) |
| Computers & Mathematics | 0 (0.0%) | 0 (0.0%) |
| Architecture & Engineering | 0 (0.0%) | 0 (0.0%) |
| Life, Physical & Social Science | 0 (0.0%) | 0 (0.0%) |
| Community & Social Service | 0 (0.0%) | 10 (100.0%) |
| Education, Arts & Media | 0 (0.0%) | 2 (100.0%) |
| Legal Services & Support | 0 (0.0%) | 0 (0.0%) |
| Education Instruction & Library | 0 (0.0%) | 6 (100.0%) |
| Arts, Media & Entertainment | 0 (0.0%) | 2 (100.0%) |
| Health Diagnosing & Treating | 19 (100.0%) | 0 (0.0%) |
| Health Technologists | 0 (0.0%) | 0 (0.0%) |
| Total (Category) | 28 (56.0%) | 22 (44.0%) |
| Total (Overall) | 73 (51.0%) | 70 (48.9%) |
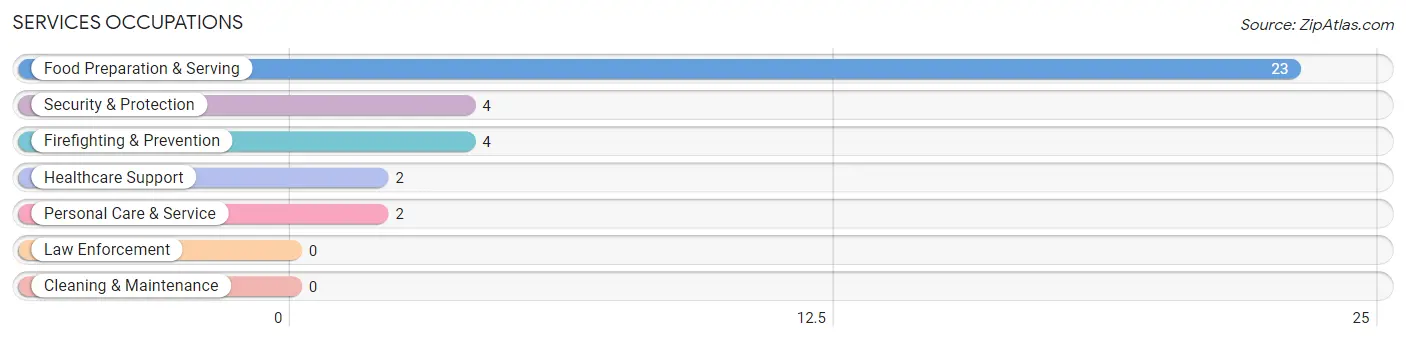
Services Occupations
The most common Services occupations in Preston are Food Preparation & Serving (23 | 16.1%), Security & Protection (4 | 2.8%), Firefighting & Prevention (4 | 2.8%), Healthcare Support (2 | 1.4%), and Personal Care & Service (2 | 1.4%).
Services Occupations by Sex
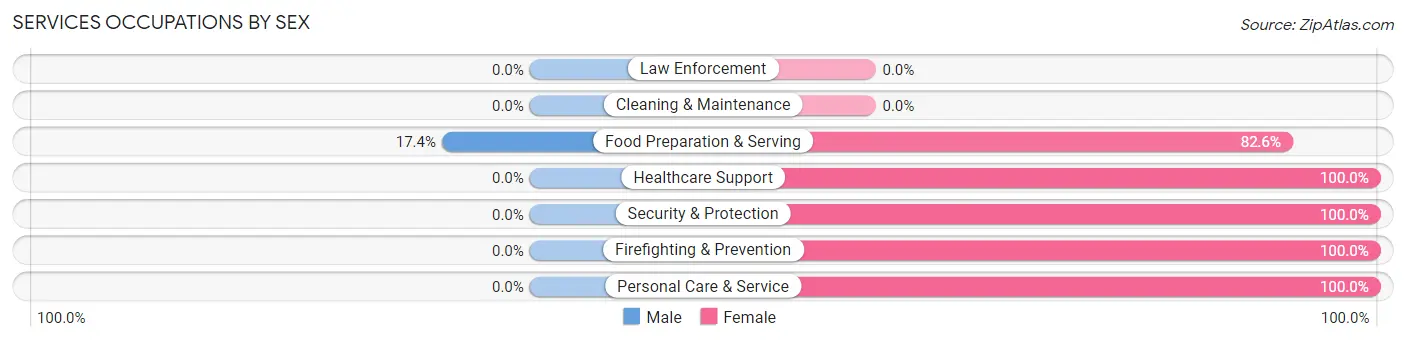
| Occupation | Male | Female |
| Healthcare Support | 0 (0.0%) | 2 (100.0%) |
| Security & Protection | 0 (0.0%) | 4 (100.0%) |
| Firefighting & Prevention | 0 (0.0%) | 4 (100.0%) |
| Law Enforcement | 0 (0.0%) | 0 (0.0%) |
| Food Preparation & Serving | 4 (17.4%) | 19 (82.6%) |
| Cleaning & Maintenance | 0 (0.0%) | 0 (0.0%) |
| Personal Care & Service | 0 (0.0%) | 2 (100.0%) |
| Total (Category) | 4 (12.9%) | 27 (87.1%) |
| Total (Overall) | 73 (51.0%) | 70 (48.9%) |
Sales and Office Occupations
The most common Sales and Office occupations in Preston are Sales & Related (19 | 13.3%), and Office & Administration (6 | 4.2%).
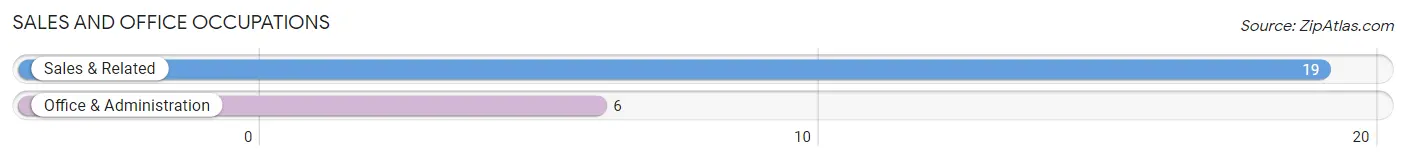
Sales and Office Occupations by Sex
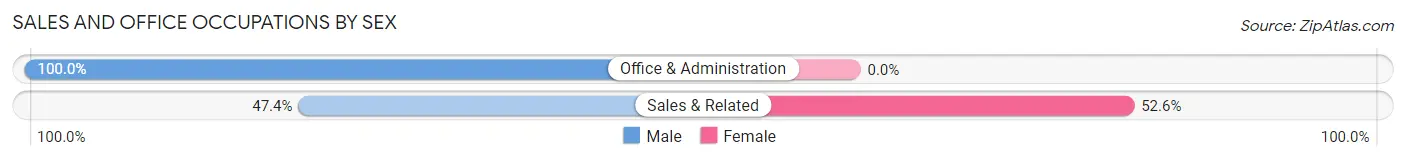
| Occupation | Male | Female |
| Sales & Related | 9 (47.4%) | 10 (52.6%) |
| Office & Administration | 6 (100.0%) | 0 (0.0%) |
| Total (Category) | 15 (60.0%) | 10 (40.0%) |
| Total (Overall) | 73 (51.0%) | 70 (48.9%) |
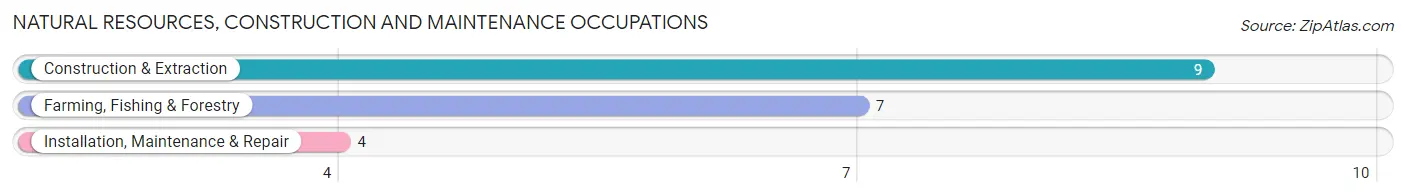
Natural Resources, Construction and Maintenance Occupations
The most common Natural Resources, Construction and Maintenance occupations in Preston are Construction & Extraction (9 | 6.3%), Farming, Fishing & Forestry (7 | 4.9%), and Installation, Maintenance & Repair (4 | 2.8%).
Natural Resources, Construction and Maintenance Occupations by Sex
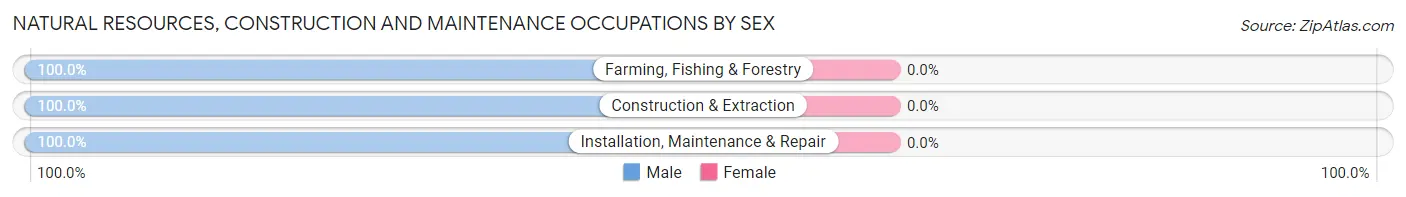
| Occupation | Male | Female |
| Farming, Fishing & Forestry | 7 (100.0%) | 0 (0.0%) |
| Construction & Extraction | 9 (100.0%) | 0 (0.0%) |
| Installation, Maintenance & Repair | 4 (100.0%) | 0 (0.0%) |
| Total (Category) | 20 (100.0%) | 0 (0.0%) |
| Total (Overall) | 73 (51.0%) | 70 (48.9%) |
Production, Transportation and Moving Occupations
The most common Production, Transportation and Moving occupations in Preston are Production (13 | 9.1%), and Transportation (4 | 2.8%).
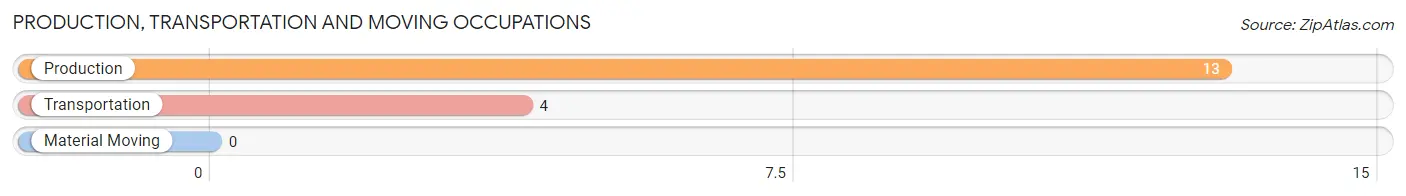
Production, Transportation and Moving Occupations by Sex
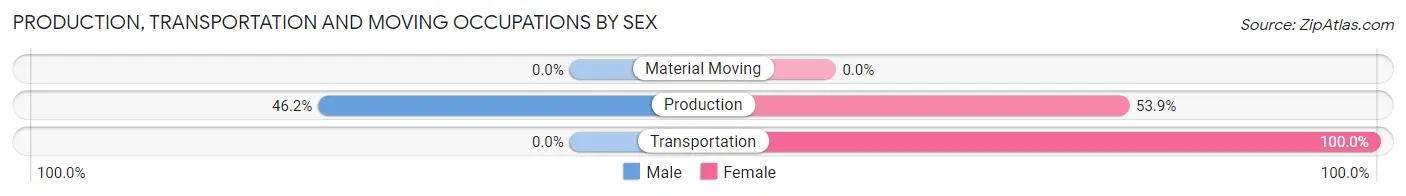
| Occupation | Male | Female |
| Production | 6 (46.2%) | 7 (53.8%) |
| Transportation | 0 (0.0%) | 4 (100.0%) |
| Material Moving | 0 (0.0%) | 0 (0.0%) |
| Total (Category) | 6 (35.3%) | 11 (64.7%) |
| Total (Overall) | 73 (51.0%) | 70 (48.9%) |
Employment Industries by Sex in Preston
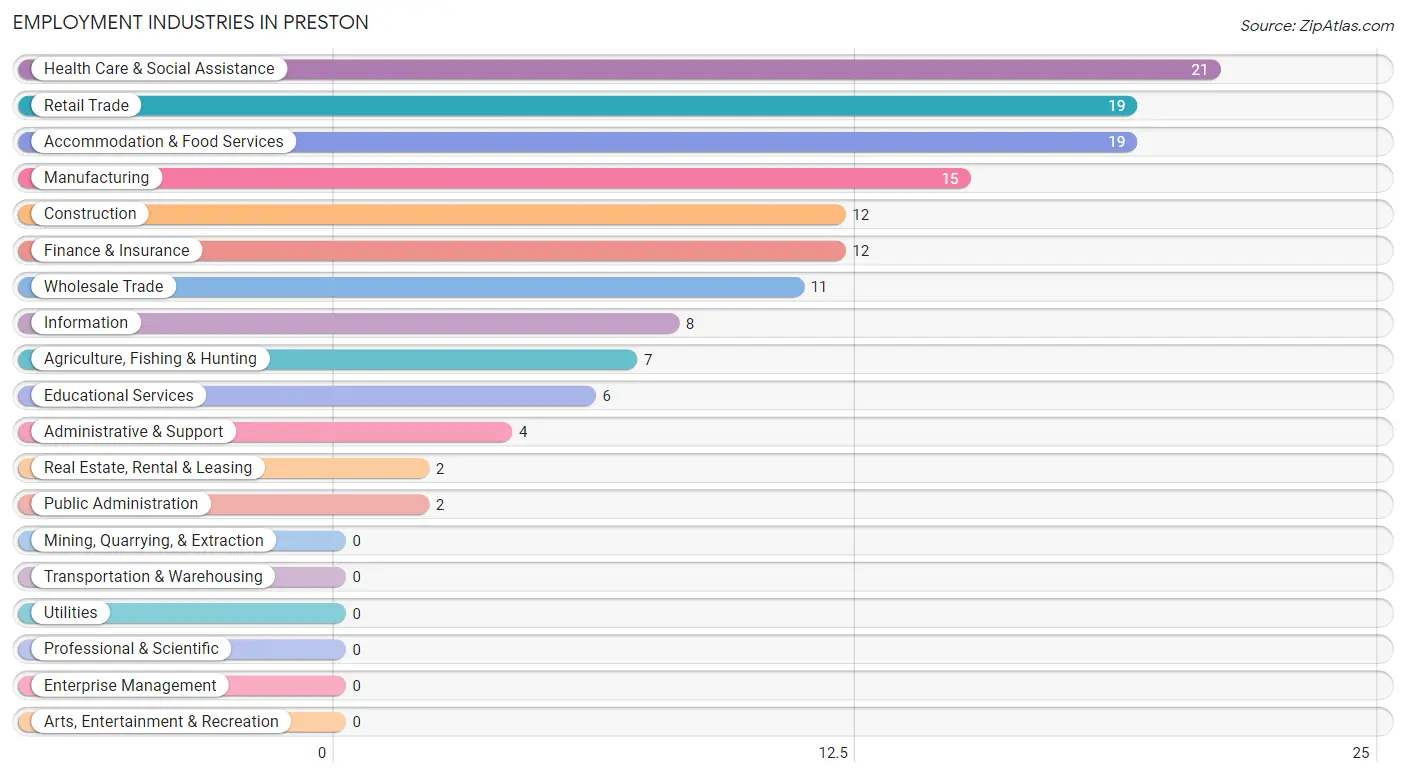
Employment Industries in Preston
The major employment industries in Preston include Health Care & Social Assistance (21 | 14.7%), Retail Trade (19 | 13.3%), Accommodation & Food Services (19 | 13.3%), Manufacturing (15 | 10.5%), and Construction (12 | 8.4%).
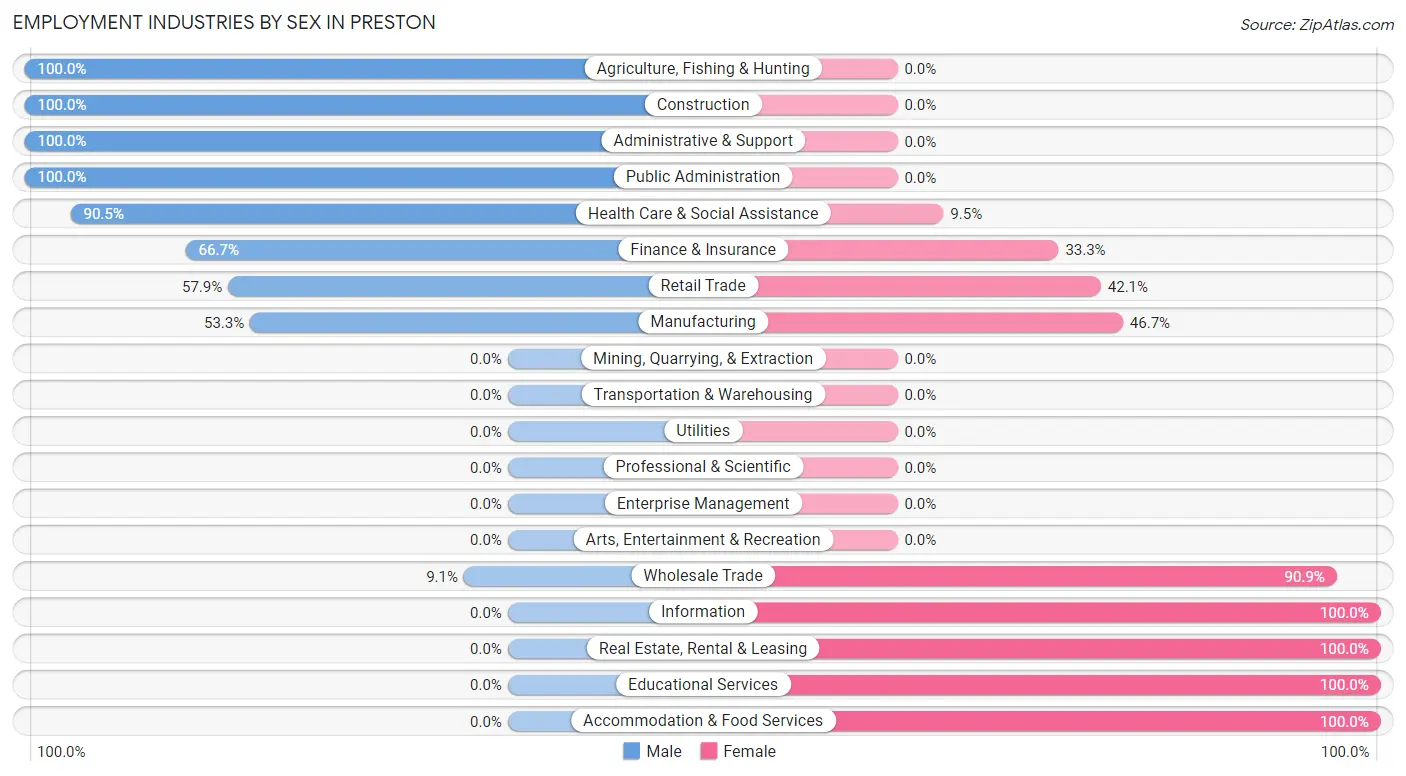
Employment Industries by Sex in Preston
The Preston industries that see more men than women are Agriculture, Fishing & Hunting (100.0%), Construction (100.0%), and Administrative & Support (100.0%), whereas the industries that tend to have a higher number of women are Information (100.0%), Real Estate, Rental & Leasing (100.0%), and Educational Services (100.0%).
| Industry | Male | Female |
| Agriculture, Fishing & Hunting | 7 (100.0%) | 0 (0.0%) |
| Mining, Quarrying, & Extraction | 0 (0.0%) | 0 (0.0%) |
| Construction | 12 (100.0%) | 0 (0.0%) |
| Manufacturing | 8 (53.3%) | 7 (46.7%) |
| Wholesale Trade | 1 (9.1%) | 10 (90.9%) |
| Retail Trade | 11 (57.9%) | 8 (42.1%) |
| Transportation & Warehousing | 0 (0.0%) | 0 (0.0%) |
| Utilities | 0 (0.0%) | 0 (0.0%) |
| Information | 0 (0.0%) | 8 (100.0%) |
| Finance & Insurance | 8 (66.7%) | 4 (33.3%) |
| Real Estate, Rental & Leasing | 0 (0.0%) | 2 (100.0%) |
| Professional & Scientific | 0 (0.0%) | 0 (0.0%) |
| Enterprise Management | 0 (0.0%) | 0 (0.0%) |
| Administrative & Support | 4 (100.0%) | 0 (0.0%) |
| Educational Services | 0 (0.0%) | 6 (100.0%) |
| Health Care & Social Assistance | 19 (90.5%) | 2 (9.5%) |
| Arts, Entertainment & Recreation | 0 (0.0%) | 0 (0.0%) |
| Accommodation & Food Services | 0 (0.0%) | 19 (100.0%) |
| Public Administration | 2 (100.0%) | 0 (0.0%) |
| Total | 73 (51.0%) | 70 (48.9%) |
Education in Preston
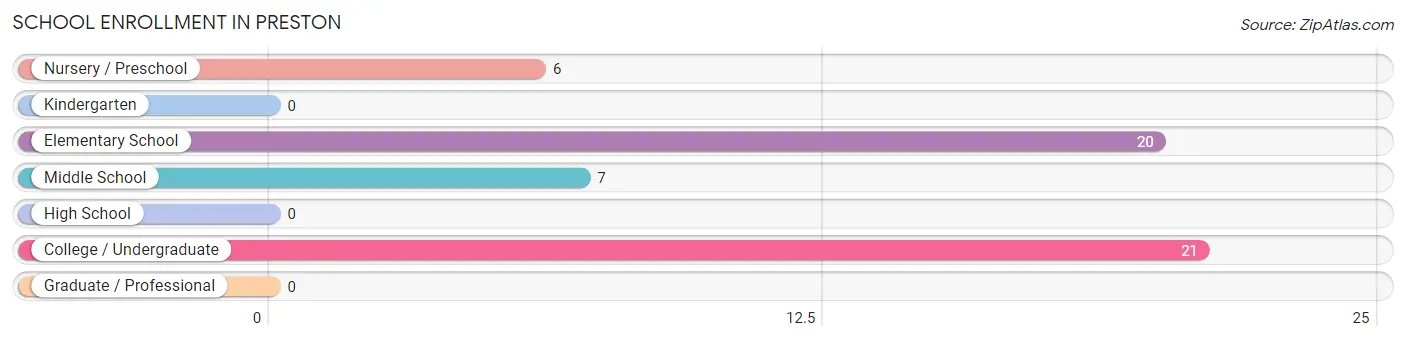
School Enrollment in Preston
The most common levels of schooling among the 54 students in Preston are college / undergraduate (21 | 38.9%), elementary school (20 | 37.0%), and middle school (7 | 13.0%).
| School Level | # Students | % Students |
| Nursery / Preschool | 6 | 11.1% |
| Kindergarten | 0 | 0.0% |
| Elementary School | 20 | 37.0% |
| Middle School | 7 | 13.0% |
| High School | 0 | 0.0% |
| College / Undergraduate | 21 | 38.9% |
| Graduate / Professional | 0 | 0.0% |
| Total | 54 | 100.0% |
School Enrollment by Age by Funding Source in Preston
Out of a total of 54 students who are enrolled in schools in Preston, 2 (3.7%) attend a private institution, while the remaining 52 (96.3%) are enrolled in public schools. The age group of 35 years and over has the highest likelihood of being enrolled in private schools, with 2 (100.0% in the age bracket) enrolled. Conversely, the age group of 5 to 9 year old has the lowest likelihood of being enrolled in a private school, with 23 (100.0% in the age bracket) attending a public institution.
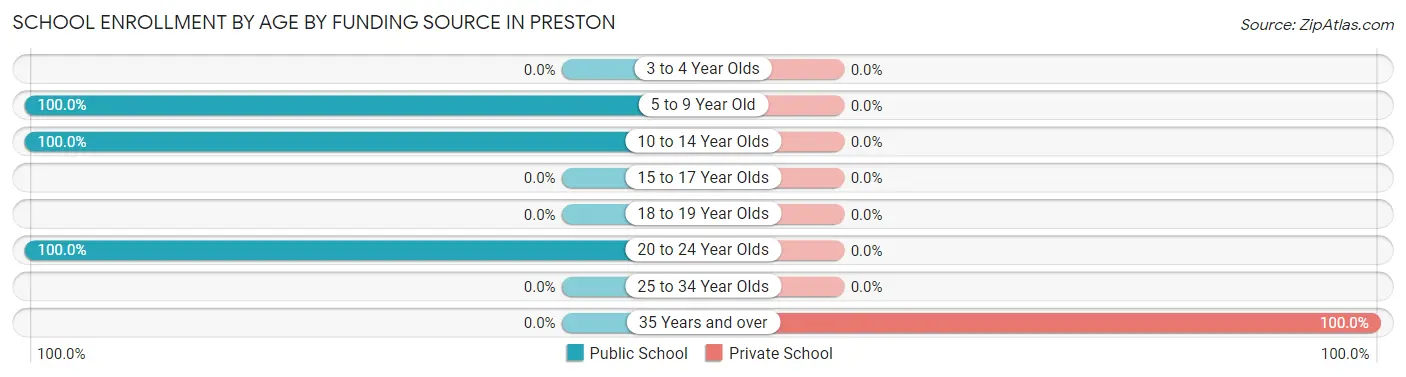
| Age Bracket | Public School | Private School |
| 3 to 4 Year Olds | 0 (0.0%) | 0 (0.0%) |
| 5 to 9 Year Old | 23 (100.0%) | 0 (0.0%) |
| 10 to 14 Year Olds | 10 (100.0%) | 0 (0.0%) |
| 15 to 17 Year Olds | 0 (0.0%) | 0 (0.0%) |
| 18 to 19 Year Olds | 0 (0.0%) | 0 (0.0%) |
| 20 to 24 Year Olds | 19 (100.0%) | 0 (0.0%) |
| 25 to 34 Year Olds | 0 (0.0%) | 0 (0.0%) |
| 35 Years and over | 0 (0.0%) | 2 (100.0%) |
| Total | 52 (96.3%) | 2 (3.7%) |
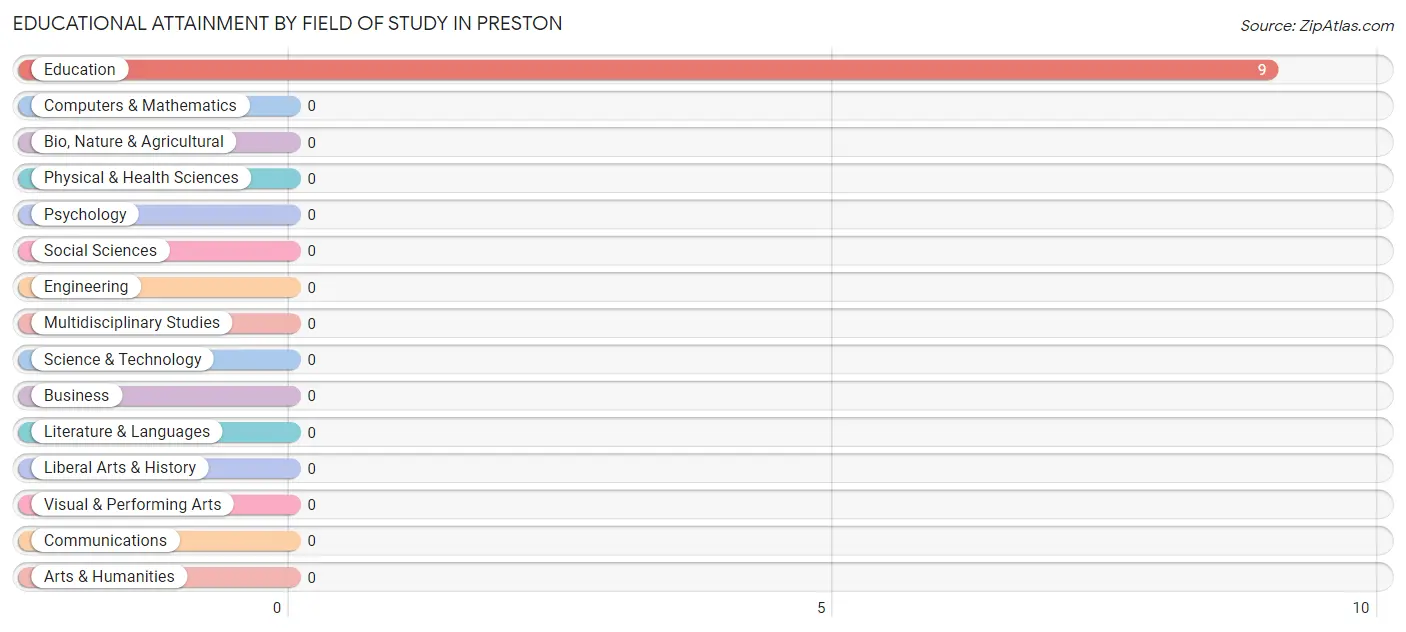
Educational Attainment by Field of Study in Preston
, and education (9 | 100.0%) are the most common fields of study among 9 individuals in Preston who have obtained a bachelor's degree or higher.
| Field of Study | # Graduates | % Graduates |
| Computers & Mathematics | 0 | 0.0% |
| Bio, Nature & Agricultural | 0 | 0.0% |
| Physical & Health Sciences | 0 | 0.0% |
| Psychology | 0 | 0.0% |
| Social Sciences | 0 | 0.0% |
| Engineering | 0 | 0.0% |
| Multidisciplinary Studies | 0 | 0.0% |
| Science & Technology | 0 | 0.0% |
| Business | 0 | 0.0% |
| Education | 9 | 100.0% |
| Literature & Languages | 0 | 0.0% |
| Liberal Arts & History | 0 | 0.0% |
| Visual & Performing Arts | 0 | 0.0% |
| Communications | 0 | 0.0% |
| Arts & Humanities | 0 | 0.0% |
| Total | 9 | 100.0% |
Transportation & Commute in Preston
Vehicle Availability by Sex in Preston
The most prevalent vehicle ownership categories in Preston are males with 2 vehicles (32, accounting for 43.8%) and females with 2 vehicles (16, making up 45.7%).
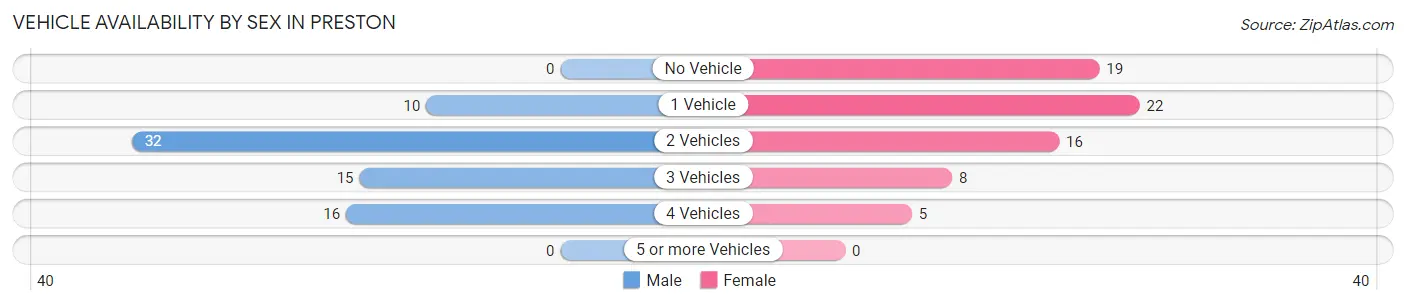
| Vehicles Available | Male | Female |
| No Vehicle | 0 (0.0%) | 19 (27.1%) |
| 1 Vehicle | 10 (13.7%) | 22 (31.4%) |
| 2 Vehicles | 32 (43.8%) | 16 (22.9%) |
| 3 Vehicles | 15 (20.5%) | 8 (11.4%) |
| 4 Vehicles | 16 (21.9%) | 5 (7.1%) |
| 5 or more Vehicles | 0 (0.0%) | 0 (0.0%) |
| Total | 73 (100.0%) | 70 (100.0%) |
Commute Time in Preston
The most frequently occuring commute durations in Preston are 45 to 59 minutes (21 commuters, 15.8%), 5 to 9 minutes (20 commuters, 15.0%), and 25 to 29 minutes (20 commuters, 15.0%).
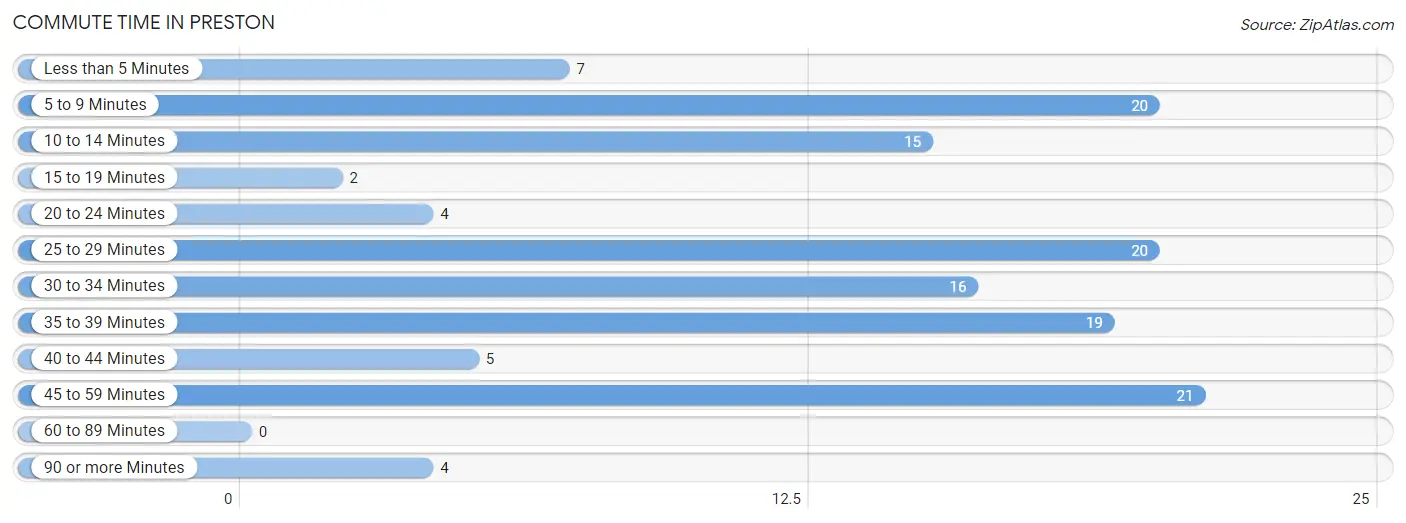
| Commute Time | # Commuters | % Commuters |
| Less than 5 Minutes | 7 | 5.3% |
| 5 to 9 Minutes | 20 | 15.0% |
| 10 to 14 Minutes | 15 | 11.3% |
| 15 to 19 Minutes | 2 | 1.5% |
| 20 to 24 Minutes | 4 | 3.0% |
| 25 to 29 Minutes | 20 | 15.0% |
| 30 to 34 Minutes | 16 | 12.0% |
| 35 to 39 Minutes | 19 | 14.3% |
| 40 to 44 Minutes | 5 | 3.8% |
| 45 to 59 Minutes | 21 | 15.8% |
| 60 to 89 Minutes | 0 | 0.0% |
| 90 or more Minutes | 4 | 3.0% |
Commute Time by Sex in Preston
The most common commute times in Preston are 35 to 39 minutes (19 commuters, 27.5%) for males and 25 to 29 minutes (20 commuters, 31.2%) for females.
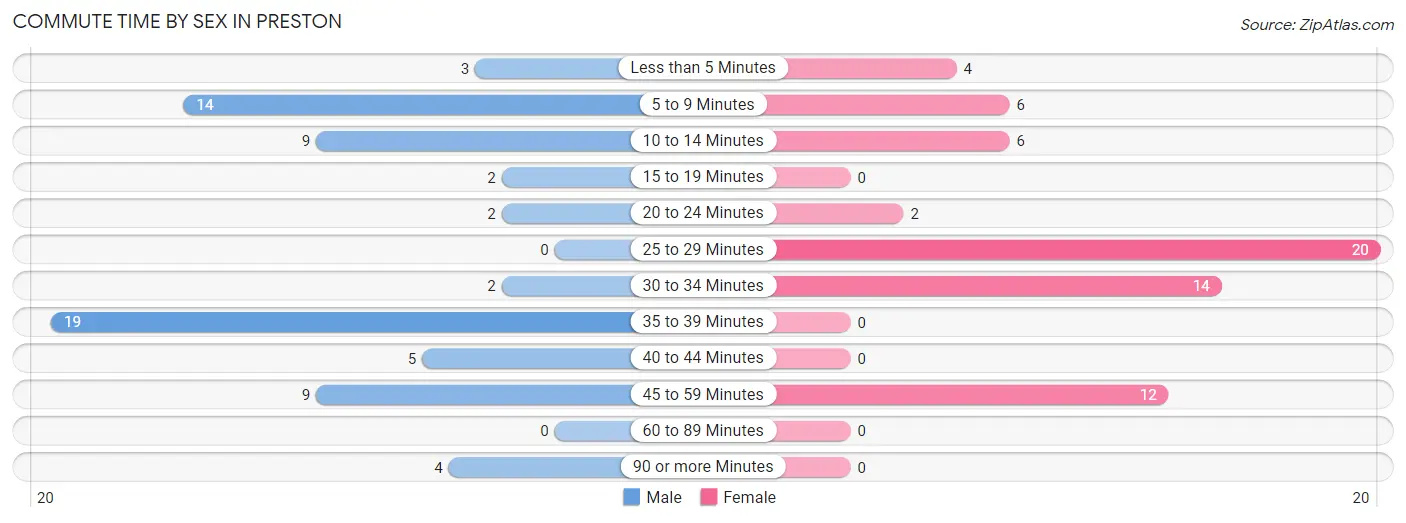
| Commute Time | Male | Female |
| Less than 5 Minutes | 3 (4.3%) | 4 (6.2%) |
| 5 to 9 Minutes | 14 (20.3%) | 6 (9.4%) |
| 10 to 14 Minutes | 9 (13.0%) | 6 (9.4%) |
| 15 to 19 Minutes | 2 (2.9%) | 0 (0.0%) |
| 20 to 24 Minutes | 2 (2.9%) | 2 (3.1%) |
| 25 to 29 Minutes | 0 (0.0%) | 20 (31.2%) |
| 30 to 34 Minutes | 2 (2.9%) | 14 (21.9%) |
| 35 to 39 Minutes | 19 (27.5%) | 0 (0.0%) |
| 40 to 44 Minutes | 5 (7.2%) | 0 (0.0%) |
| 45 to 59 Minutes | 9 (13.0%) | 12 (18.8%) |
| 60 to 89 Minutes | 0 (0.0%) | 0 (0.0%) |
| 90 or more Minutes | 4 (5.8%) | 0 (0.0%) |
Time of Departure to Work by Sex in Preston
The most frequent times of departure to work in Preston are 6:00 AM to 6:29 AM (31, 44.9%) for males and 12:00 PM to 3:59 PM (25, 39.1%) for females.
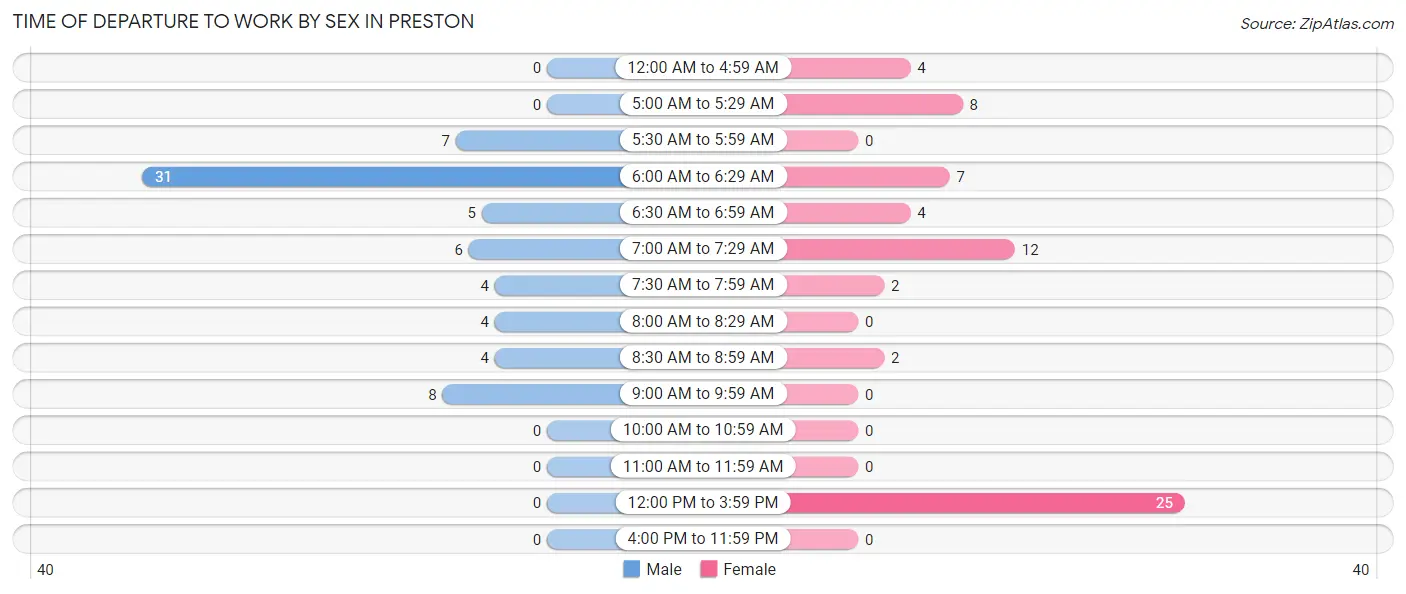
| Time of Departure | Male | Female |
| 12:00 AM to 4:59 AM | 0 (0.0%) | 4 (6.2%) |
| 5:00 AM to 5:29 AM | 0 (0.0%) | 8 (12.5%) |
| 5:30 AM to 5:59 AM | 7 (10.1%) | 0 (0.0%) |
| 6:00 AM to 6:29 AM | 31 (44.9%) | 7 (10.9%) |
| 6:30 AM to 6:59 AM | 5 (7.2%) | 4 (6.2%) |
| 7:00 AM to 7:29 AM | 6 (8.7%) | 12 (18.8%) |
| 7:30 AM to 7:59 AM | 4 (5.8%) | 2 (3.1%) |
| 8:00 AM to 8:29 AM | 4 (5.8%) | 0 (0.0%) |
| 8:30 AM to 8:59 AM | 4 (5.8%) | 2 (3.1%) |
| 9:00 AM to 9:59 AM | 8 (11.6%) | 0 (0.0%) |
| 10:00 AM to 10:59 AM | 0 (0.0%) | 0 (0.0%) |
| 11:00 AM to 11:59 AM | 0 (0.0%) | 0 (0.0%) |
| 12:00 PM to 3:59 PM | 0 (0.0%) | 25 (39.1%) |
| 4:00 PM to 11:59 PM | 0 (0.0%) | 0 (0.0%) |
| Total | 69 (100.0%) | 64 (100.0%) |
Housing Occupancy in Preston
Occupancy by Ownership in Preston
Of the total 133 dwellings in Preston, owner-occupied units account for 94 (70.7%), while renter-occupied units make up 39 (29.3%).
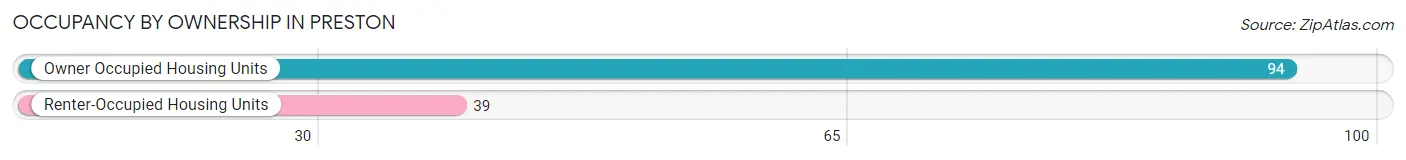
| Occupancy | # Housing Units | % Housing Units |
| Owner Occupied Housing Units | 94 | 70.7% |
| Renter-Occupied Housing Units | 39 | 29.3% |
| Total Occupied Housing Units | 133 | 100.0% |
Occupancy by Household Size in Preston
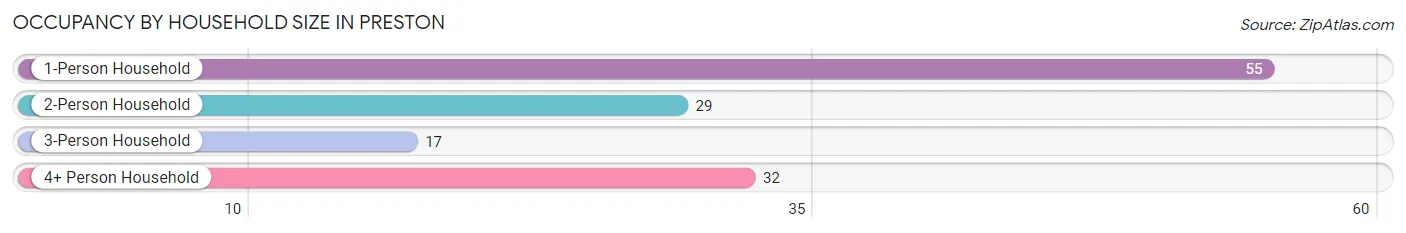
| Household Size | # Housing Units | % Housing Units |
| 1-Person Household | 55 | 41.3% |
| 2-Person Household | 29 | 21.8% |
| 3-Person Household | 17 | 12.8% |
| 4+ Person Household | 32 | 24.1% |
| Total Housing Units | 133 | 100.0% |
Occupancy by Ownership by Household Size in Preston
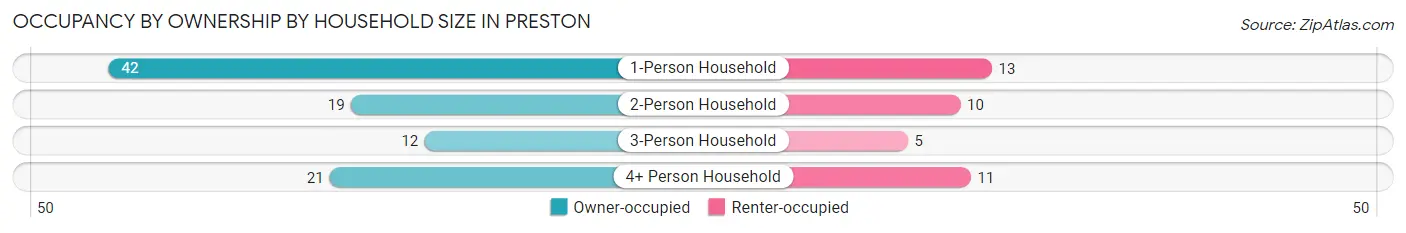
| Household Size | Owner-occupied | Renter-occupied |
| 1-Person Household | 42 (76.4%) | 13 (23.6%) |
| 2-Person Household | 19 (65.5%) | 10 (34.5%) |
| 3-Person Household | 12 (70.6%) | 5 (29.4%) |
| 4+ Person Household | 21 (65.6%) | 11 (34.4%) |
| Total Housing Units | 94 (70.7%) | 39 (29.3%) |
Occupancy by Educational Attainment in Preston
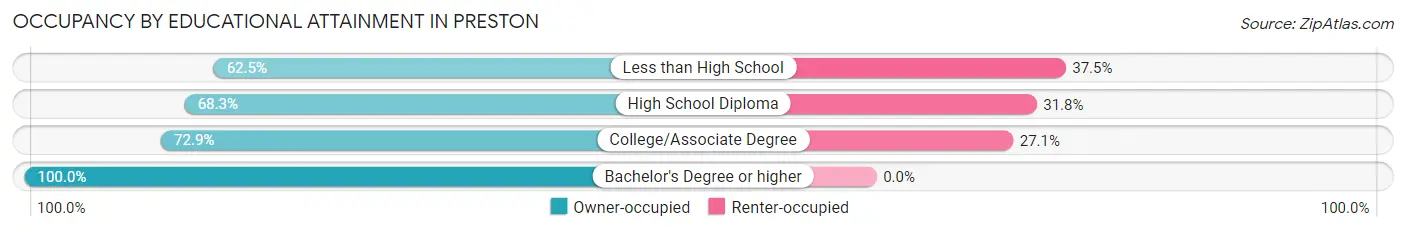
| Household Size | Owner-occupied | Renter-occupied |
| Less than High School | 10 (62.5%) | 6 (37.5%) |
| High School Diploma | 43 (68.2%) | 20 (31.8%) |
| College/Associate Degree | 35 (72.9%) | 13 (27.1%) |
| Bachelor's Degree or higher | 6 (100.0%) | 0 (0.0%) |
Occupancy by Age of Householder in Preston
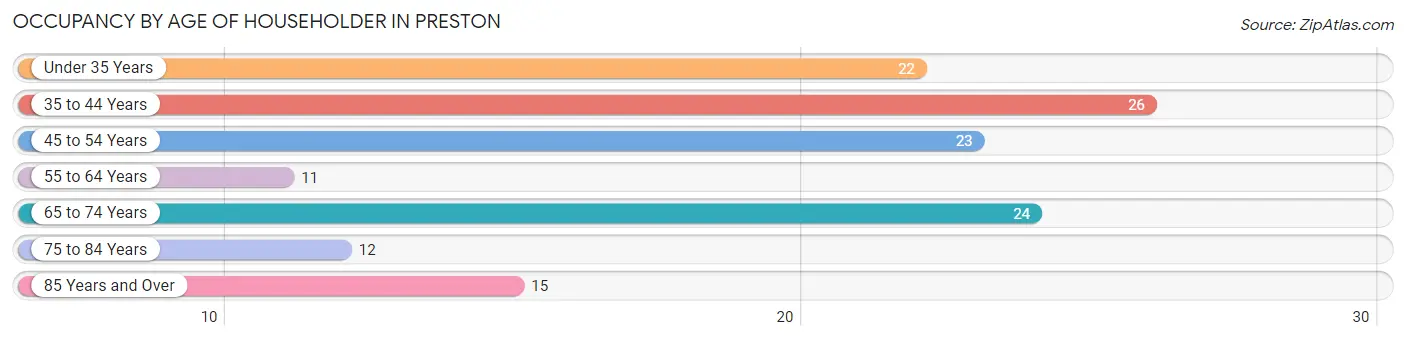
| Age Bracket | # Households | % Households |
| Under 35 Years | 22 | 16.5% |
| 35 to 44 Years | 26 | 19.6% |
| 45 to 54 Years | 23 | 17.3% |
| 55 to 64 Years | 11 | 8.3% |
| 65 to 74 Years | 24 | 18.0% |
| 75 to 84 Years | 12 | 9.0% |
| 85 Years and Over | 15 | 11.3% |
| Total | 133 | 100.0% |
Housing Finances in Preston
Median Income by Occupancy in Preston
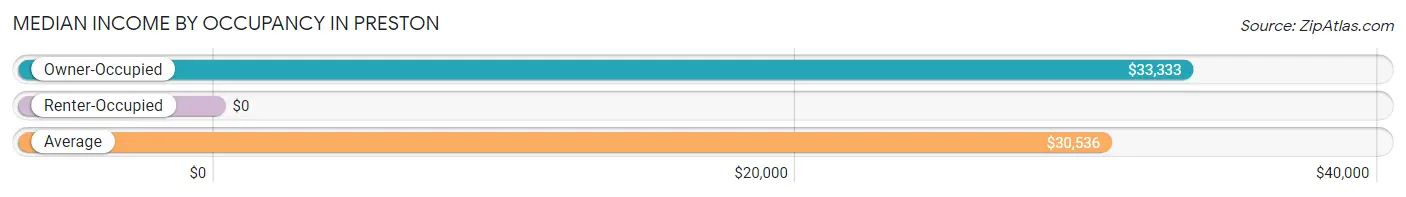
| Occupancy Type | # Households | Median Income |
| Owner-Occupied | 94 (70.7%) | $33,333 |
| Renter-Occupied | 39 (29.3%) | $0 |
| Average | 133 (100.0%) | $30,536 |
Occupancy by Householder Income Bracket in Preston
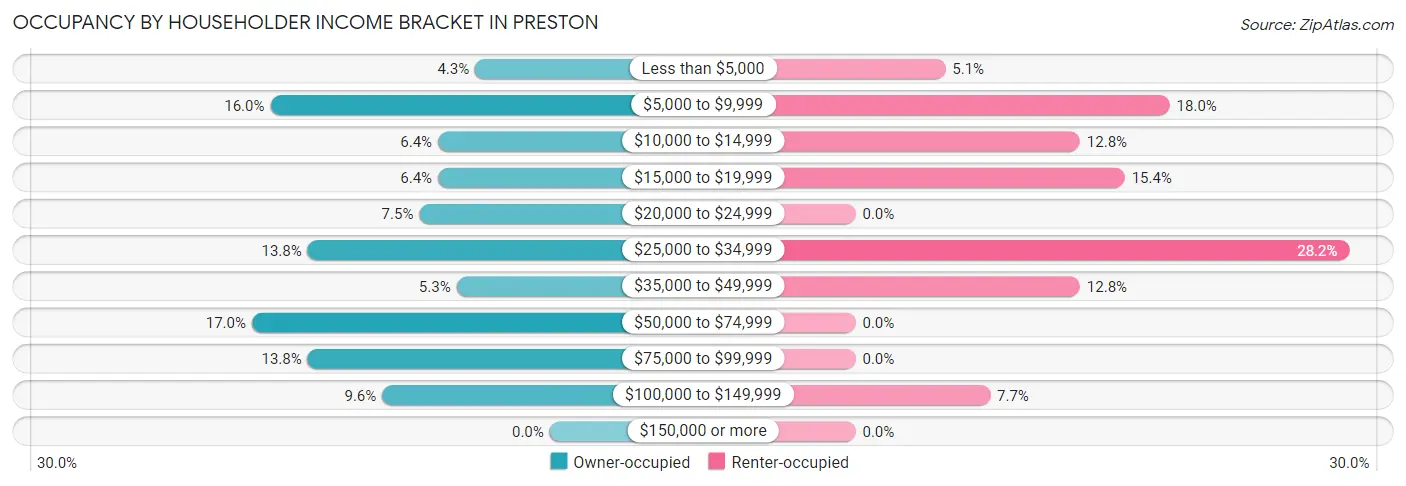
| Income Bracket | Owner-occupied | Renter-occupied |
| Less than $5,000 | 4 (4.3%) | 2 (5.1%) |
| $5,000 to $9,999 | 15 (16.0%) | 7 (17.9%) |
| $10,000 to $14,999 | 6 (6.4%) | 5 (12.8%) |
| $15,000 to $19,999 | 6 (6.4%) | 6 (15.4%) |
| $20,000 to $24,999 | 7 (7.4%) | 0 (0.0%) |
| $25,000 to $34,999 | 13 (13.8%) | 11 (28.2%) |
| $35,000 to $49,999 | 5 (5.3%) | 5 (12.8%) |
| $50,000 to $74,999 | 16 (17.0%) | 0 (0.0%) |
| $75,000 to $99,999 | 13 (13.8%) | 0 (0.0%) |
| $100,000 to $149,999 | 9 (9.6%) | 3 (7.7%) |
| $150,000 or more | 0 (0.0%) | 0 (0.0%) |
| Total | 94 (100.0%) | 39 (100.0%) |
Monthly Housing Cost Tiers in Preston
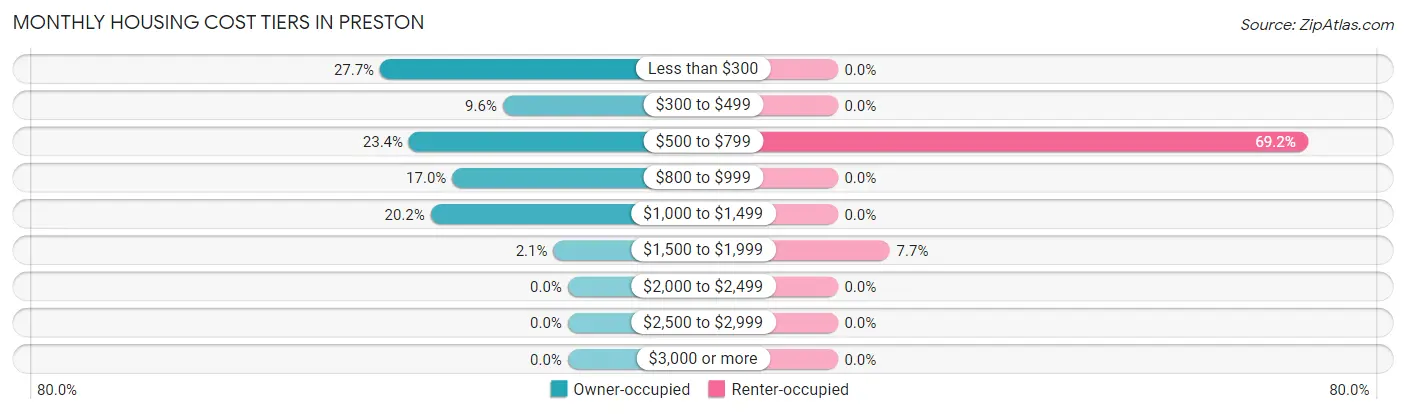
| Monthly Cost | Owner-occupied | Renter-occupied |
| Less than $300 | 26 (27.7%) | 0 (0.0%) |
| $300 to $499 | 9 (9.6%) | 0 (0.0%) |
| $500 to $799 | 22 (23.4%) | 27 (69.2%) |
| $800 to $999 | 16 (17.0%) | 0 (0.0%) |
| $1,000 to $1,499 | 19 (20.2%) | 0 (0.0%) |
| $1,500 to $1,999 | 2 (2.1%) | 3 (7.7%) |
| $2,000 to $2,499 | 0 (0.0%) | 0 (0.0%) |
| $2,500 to $2,999 | 0 (0.0%) | 0 (0.0%) |
| $3,000 or more | 0 (0.0%) | 0 (0.0%) |
| Total | 94 (100.0%) | 39 (100.0%) |
Physical Housing Characteristics in Preston
Housing Structures in Preston
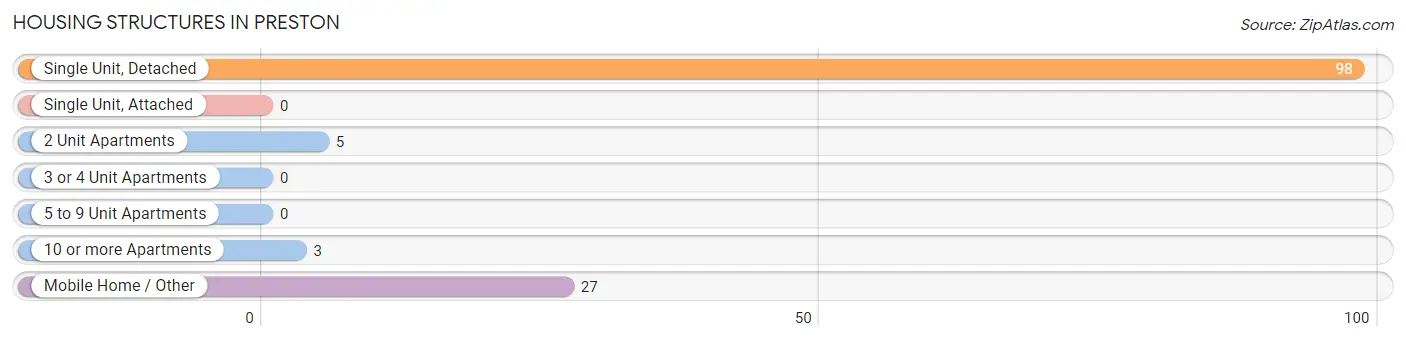
| Structure Type | # Housing Units | % Housing Units |
| Single Unit, Detached | 98 | 73.7% |
| Single Unit, Attached | 0 | 0.0% |
| 2 Unit Apartments | 5 | 3.8% |
| 3 or 4 Unit Apartments | 0 | 0.0% |
| 5 to 9 Unit Apartments | 0 | 0.0% |
| 10 or more Apartments | 3 | 2.3% |
| Mobile Home / Other | 27 | 20.3% |
| Total | 133 | 100.0% |
Housing Structures by Occupancy in Preston
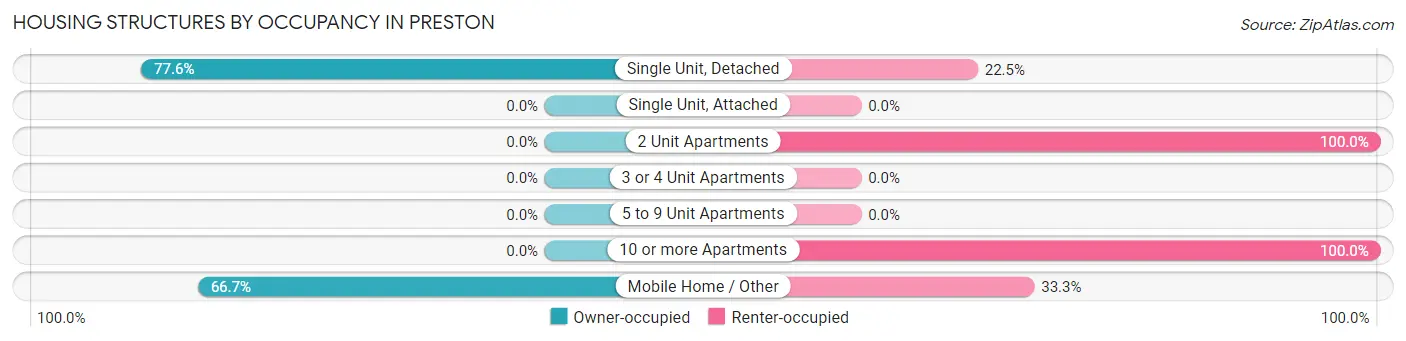
| Structure Type | Owner-occupied | Renter-occupied |
| Single Unit, Detached | 76 (77.5%) | 22 (22.5%) |
| Single Unit, Attached | 0 (0.0%) | 0 (0.0%) |
| 2 Unit Apartments | 0 (0.0%) | 5 (100.0%) |
| 3 or 4 Unit Apartments | 0 (0.0%) | 0 (0.0%) |
| 5 to 9 Unit Apartments | 0 (0.0%) | 0 (0.0%) |
| 10 or more Apartments | 0 (0.0%) | 3 (100.0%) |
| Mobile Home / Other | 18 (66.7%) | 9 (33.3%) |
| Total | 94 (70.7%) | 39 (29.3%) |
Housing Structures by Number of Rooms in Preston
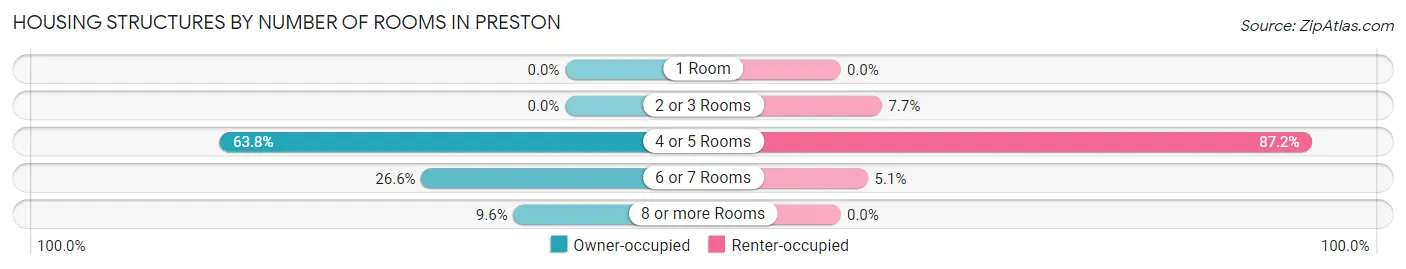
| Number of Rooms | Owner-occupied | Renter-occupied |
| 1 Room | 0 (0.0%) | 0 (0.0%) |
| 2 or 3 Rooms | 0 (0.0%) | 3 (7.7%) |
| 4 or 5 Rooms | 60 (63.8%) | 34 (87.2%) |
| 6 or 7 Rooms | 25 (26.6%) | 2 (5.1%) |
| 8 or more Rooms | 9 (9.6%) | 0 (0.0%) |
| Total | 94 (100.0%) | 39 (100.0%) |
Housing Structure by Heating Type in Preston
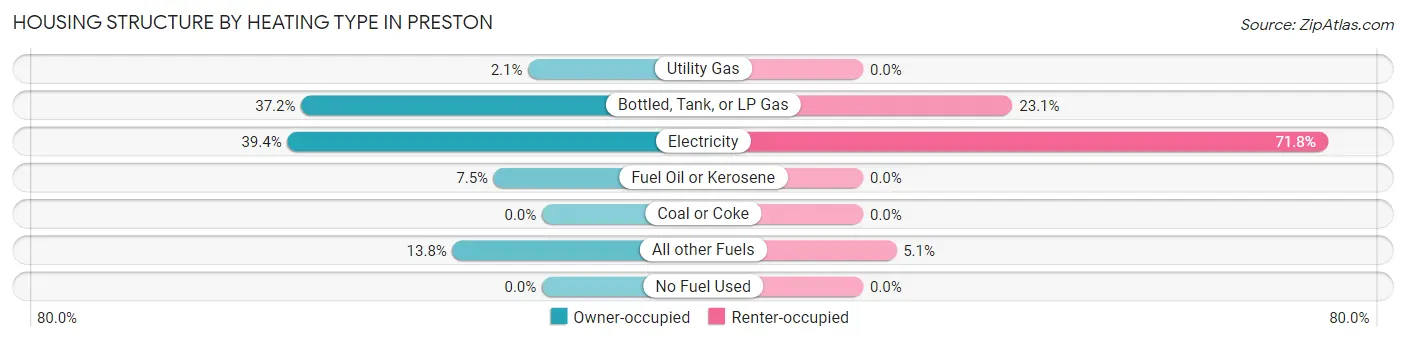
| Heating Type | Owner-occupied | Renter-occupied |
| Utility Gas | 2 (2.1%) | 0 (0.0%) |
| Bottled, Tank, or LP Gas | 35 (37.2%) | 9 (23.1%) |
| Electricity | 37 (39.4%) | 28 (71.8%) |
| Fuel Oil or Kerosene | 7 (7.4%) | 0 (0.0%) |
| Coal or Coke | 0 (0.0%) | 0 (0.0%) |
| All other Fuels | 13 (13.8%) | 2 (5.1%) |
| No Fuel Used | 0 (0.0%) | 0 (0.0%) |
| Total | 94 (100.0%) | 39 (100.0%) |
Household Vehicle Usage in Preston
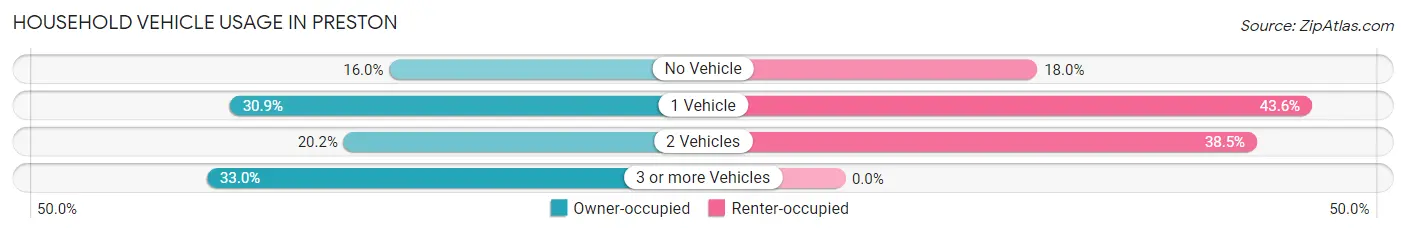
| Vehicles per Household | Owner-occupied | Renter-occupied |
| No Vehicle | 15 (16.0%) | 7 (17.9%) |
| 1 Vehicle | 29 (30.8%) | 17 (43.6%) |
| 2 Vehicles | 19 (20.2%) | 15 (38.5%) |
| 3 or more Vehicles | 31 (33.0%) | 0 (0.0%) |
| Total | 94 (100.0%) | 39 (100.0%) |
Real Estate & Mortgages in Preston
Real Estate and Mortgage Overview in Preston
| Characteristic | Without Mortgage | With Mortgage |
| Housing Units | 52 | 42 |
| Median Property Value | $118,800 | $125,000 |
| Median Household Income | - | - |
| Monthly Housing Costs | $325 | $0 |
| Real Estate Taxes | $533 | $0 |
Property Value by Mortgage Status in Preston
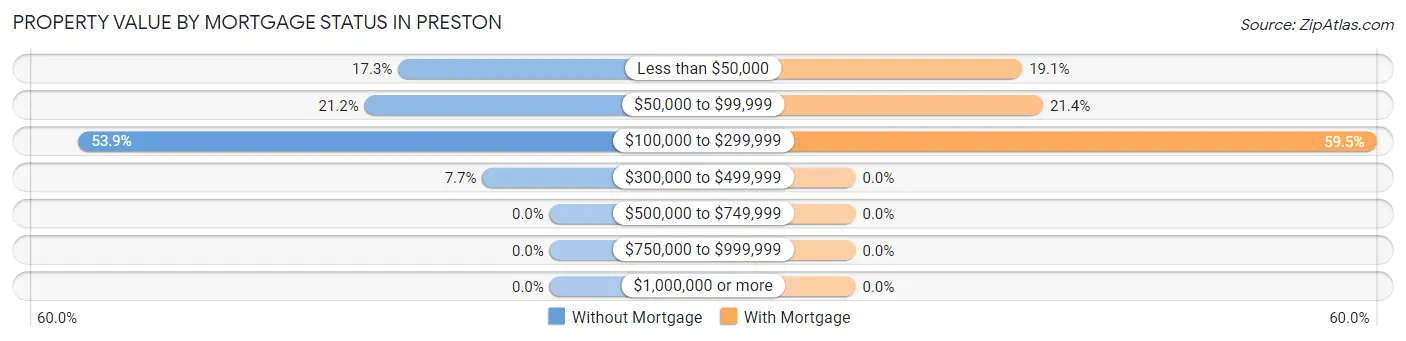
| Property Value | Without Mortgage | With Mortgage |
| Less than $50,000 | 9 (17.3%) | 8 (19.1%) |
| $50,000 to $99,999 | 11 (21.1%) | 9 (21.4%) |
| $100,000 to $299,999 | 28 (53.8%) | 25 (59.5%) |
| $300,000 to $499,999 | 4 (7.7%) | 0 (0.0%) |
| $500,000 to $749,999 | 0 (0.0%) | 0 (0.0%) |
| $750,000 to $999,999 | 0 (0.0%) | 0 (0.0%) |
| $1,000,000 or more | 0 (0.0%) | 0 (0.0%) |
| Total | 52 (100.0%) | 42 (100.0%) |
Household Income by Mortgage Status in Preston
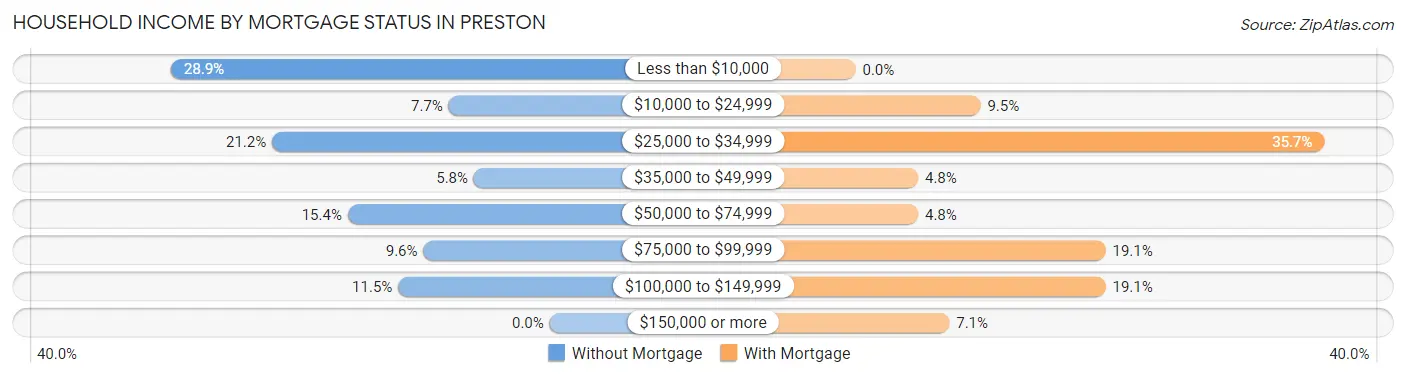
| Household Income | Without Mortgage | With Mortgage |
| Less than $10,000 | 15 (28.8%) | 0 (0.0%) |
| $10,000 to $24,999 | 4 (7.7%) | 4 (9.5%) |
| $25,000 to $34,999 | 11 (21.1%) | 15 (35.7%) |
| $35,000 to $49,999 | 3 (5.8%) | 2 (4.8%) |
| $50,000 to $74,999 | 8 (15.4%) | 2 (4.8%) |
| $75,000 to $99,999 | 5 (9.6%) | 8 (19.1%) |
| $100,000 to $149,999 | 6 (11.5%) | 8 (19.1%) |
| $150,000 or more | 0 (0.0%) | 3 (7.1%) |
| Total | 52 (100.0%) | 42 (100.0%) |
Property Value to Household Income Ratio in Preston
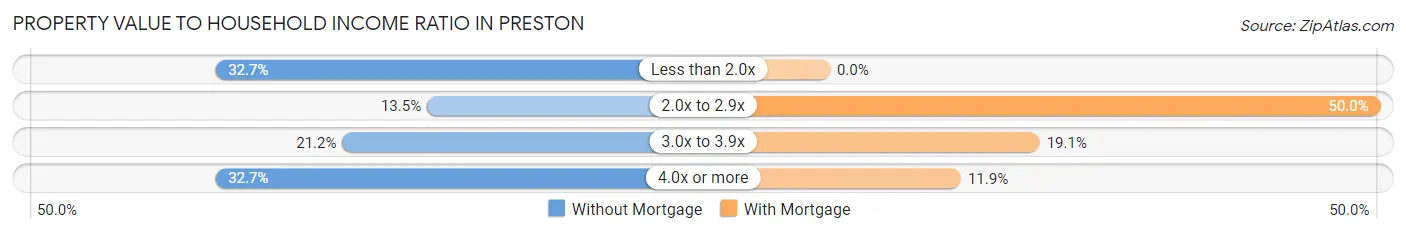
| Value-to-Income Ratio | Without Mortgage | With Mortgage |
| Less than 2.0x | 17 (32.7%) | 0 (0.0%) |
| 2.0x to 2.9x | 7 (13.5%) | 21 (50.0%) |
| 3.0x to 3.9x | 11 (21.1%) | 8 (19.1%) |
| 4.0x or more | 17 (32.7%) | 5 (11.9%) |
| Total | 52 (100.0%) | 42 (100.0%) |
Real Estate Taxes by Mortgage Status in Preston
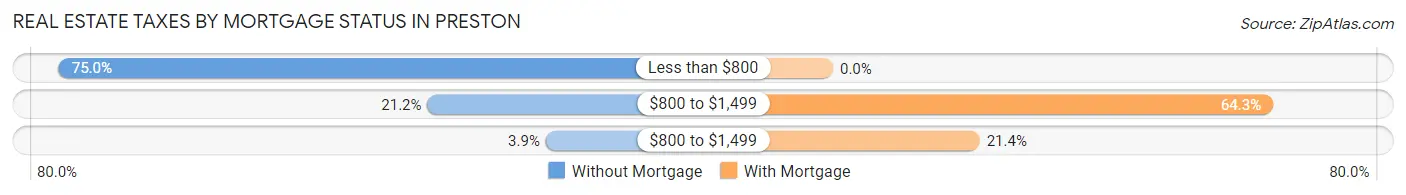
| Property Taxes | Without Mortgage | With Mortgage |
| Less than $800 | 39 (75.0%) | 0 (0.0%) |
| $800 to $1,499 | 11 (21.1%) | 27 (64.3%) |
| $800 to $1,499 | 2 (3.8%) | 9 (21.4%) |
| Total | 52 (100.0%) | 42 (100.0%) |
Health & Disability in Preston
Health Insurance Coverage by Age in Preston
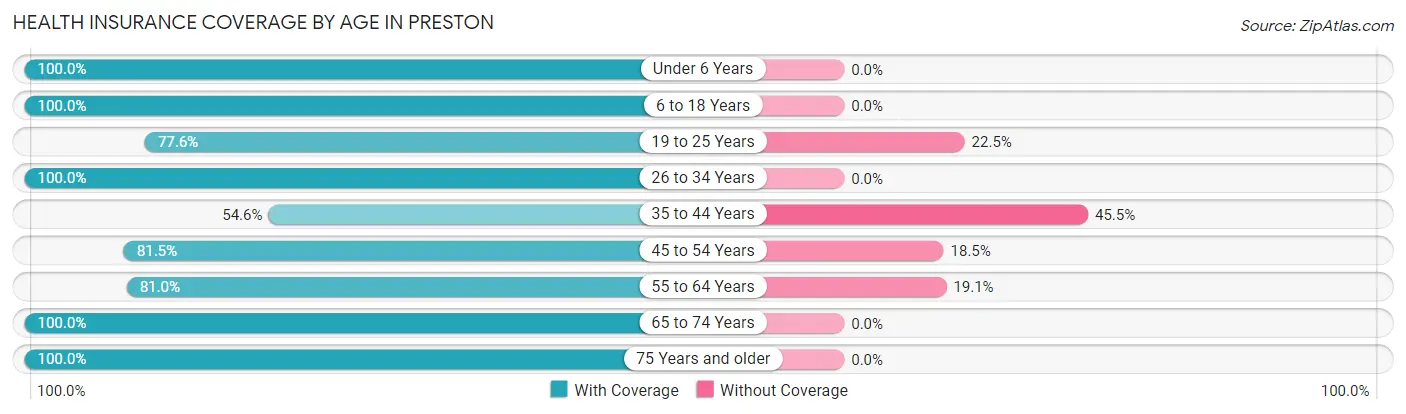
| Age Bracket | With Coverage | Without Coverage |
| Under 6 Years | 43 (100.0%) | 0 (0.0%) |
| 6 to 18 Years | 77 (100.0%) | 0 (0.0%) |
| 19 to 25 Years | 38 (77.5%) | 11 (22.5%) |
| 26 to 34 Years | 13 (100.0%) | 0 (0.0%) |
| 35 to 44 Years | 30 (54.5%) | 25 (45.5%) |
| 45 to 54 Years | 22 (81.5%) | 5 (18.5%) |
| 55 to 64 Years | 17 (80.9%) | 4 (19.1%) |
| 65 to 74 Years | 28 (100.0%) | 0 (0.0%) |
| 75 Years and older | 31 (100.0%) | 0 (0.0%) |
| Total | 299 (86.9%) | 45 (13.1%) |
Health Insurance Coverage by Citizenship Status in Preston
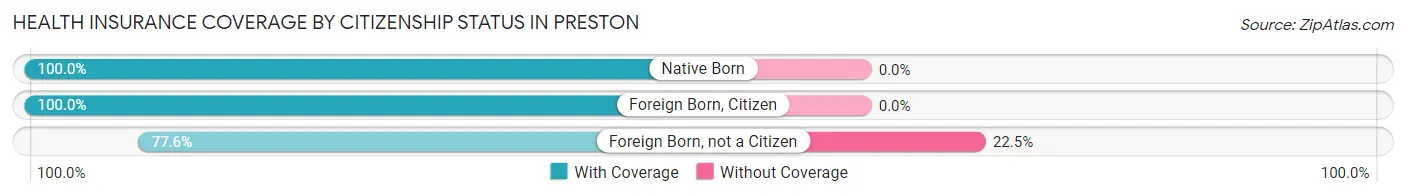
| Citizenship Status | With Coverage | Without Coverage |
| Native Born | 43 (100.0%) | 0 (0.0%) |
| Foreign Born, Citizen | 77 (100.0%) | 0 (0.0%) |
| Foreign Born, not a Citizen | 38 (77.5%) | 11 (22.5%) |
Health Insurance Coverage by Household Income in Preston
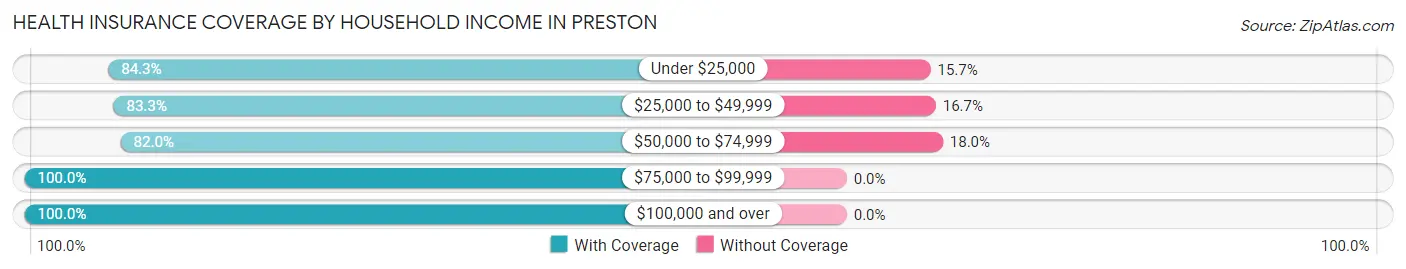
| Household Income | With Coverage | Without Coverage |
| Under $25,000 | 86 (84.3%) | 16 (15.7%) |
| $25,000 to $49,999 | 100 (83.3%) | 20 (16.7%) |
| $50,000 to $74,999 | 41 (82.0%) | 9 (18.0%) |
| $75,000 to $99,999 | 28 (100.0%) | 0 (0.0%) |
| $100,000 and over | 44 (100.0%) | 0 (0.0%) |
Public vs Private Health Insurance Coverage by Age in Preston
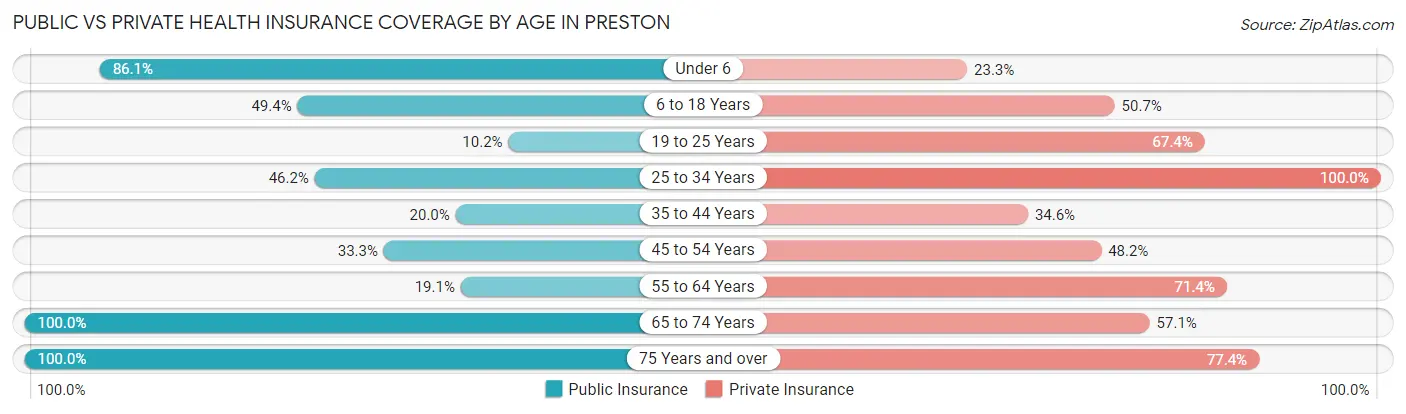
| Age Bracket | Public Insurance | Private Insurance |
| Under 6 | 37 (86.1%) | 10 (23.3%) |
| 6 to 18 Years | 38 (49.3%) | 39 (50.6%) |
| 19 to 25 Years | 5 (10.2%) | 33 (67.3%) |
| 25 to 34 Years | 6 (46.2%) | 13 (100.0%) |
| 35 to 44 Years | 11 (20.0%) | 19 (34.5%) |
| 45 to 54 Years | 9 (33.3%) | 13 (48.1%) |
| 55 to 64 Years | 4 (19.1%) | 15 (71.4%) |
| 65 to 74 Years | 28 (100.0%) | 16 (57.1%) |
| 75 Years and over | 31 (100.0%) | 24 (77.4%) |
| Total | 169 (49.1%) | 182 (52.9%) |
Disability Status by Sex by Age in Preston
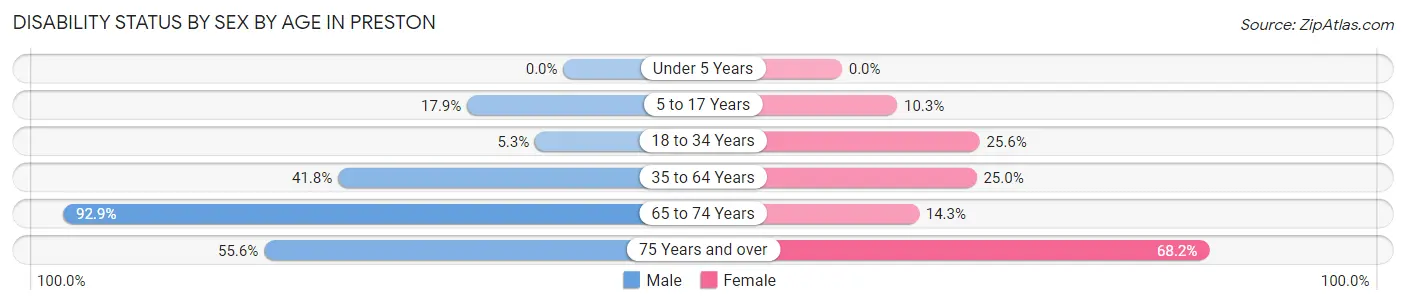
| Age Bracket | Male | Female |
| Under 5 Years | 0 (0.0%) | 0 (0.0%) |
| 5 to 17 Years | 5 (17.9%) | 4 (10.3%) |
| 18 to 34 Years | 2 (5.3%) | 11 (25.6%) |
| 35 to 64 Years | 23 (41.8%) | 12 (25.0%) |
| 65 to 74 Years | 13 (92.9%) | 2 (14.3%) |
| 75 Years and over | 5 (55.6%) | 15 (68.2%) |
Disability Class by Sex by Age in Preston
Disability Class: Hearing Difficulty
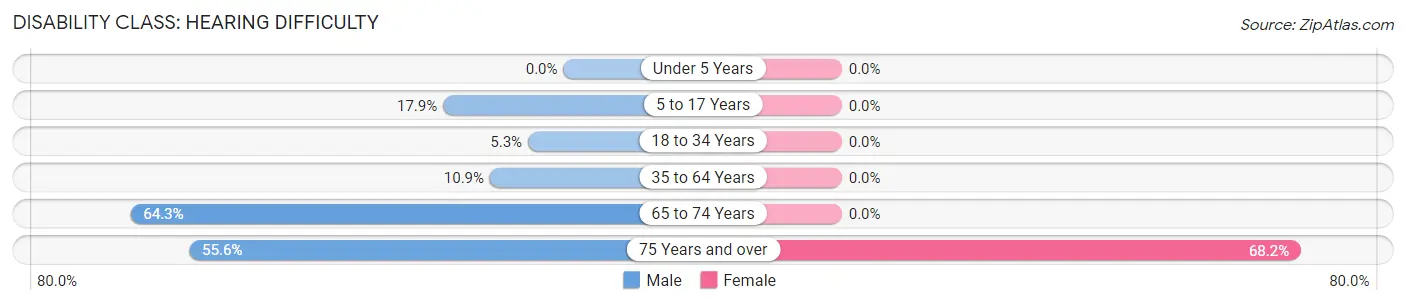
| Age Bracket | Male | Female |
| Under 5 Years | 0 (0.0%) | 0 (0.0%) |
| 5 to 17 Years | 5 (17.9%) | 0 (0.0%) |
| 18 to 34 Years | 2 (5.3%) | 0 (0.0%) |
| 35 to 64 Years | 6 (10.9%) | 0 (0.0%) |
| 65 to 74 Years | 9 (64.3%) | 0 (0.0%) |
| 75 Years and over | 5 (55.6%) | 15 (68.2%) |
Disability Class: Vision Difficulty
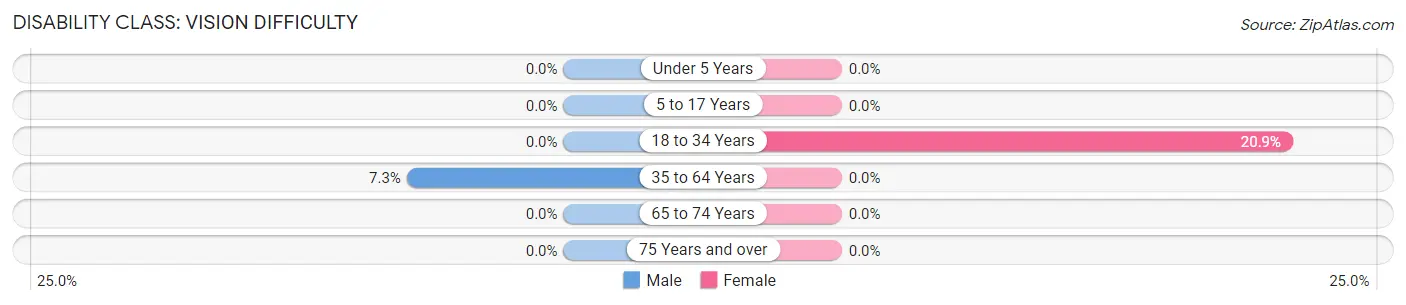
| Age Bracket | Male | Female |
| Under 5 Years | 0 (0.0%) | 0 (0.0%) |
| 5 to 17 Years | 0 (0.0%) | 0 (0.0%) |
| 18 to 34 Years | 0 (0.0%) | 9 (20.9%) |
| 35 to 64 Years | 4 (7.3%) | 0 (0.0%) |
| 65 to 74 Years | 0 (0.0%) | 0 (0.0%) |
| 75 Years and over | 0 (0.0%) | 0 (0.0%) |
Disability Class: Cognitive Difficulty
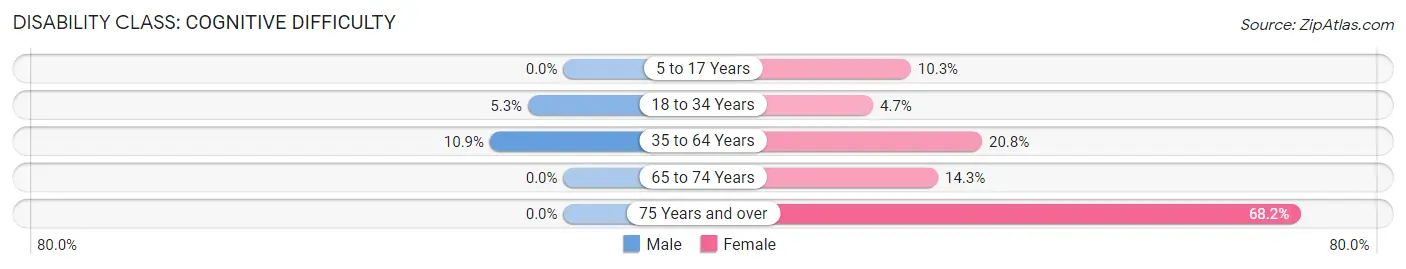
| Age Bracket | Male | Female |
| 5 to 17 Years | 0 (0.0%) | 4 (10.3%) |
| 18 to 34 Years | 2 (5.3%) | 2 (4.6%) |
| 35 to 64 Years | 6 (10.9%) | 10 (20.8%) |
| 65 to 74 Years | 0 (0.0%) | 2 (14.3%) |
| 75 Years and over | 0 (0.0%) | 15 (68.2%) |
Disability Class: Ambulatory Difficulty
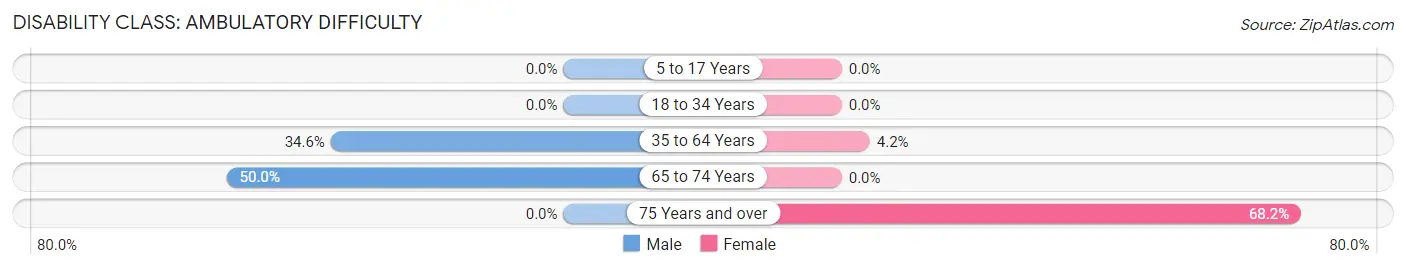
| Age Bracket | Male | Female |
| 5 to 17 Years | 0 (0.0%) | 0 (0.0%) |
| 18 to 34 Years | 0 (0.0%) | 0 (0.0%) |
| 35 to 64 Years | 19 (34.5%) | 2 (4.2%) |
| 65 to 74 Years | 7 (50.0%) | 0 (0.0%) |
| 75 Years and over | 0 (0.0%) | 15 (68.2%) |
Disability Class: Self-Care Difficulty
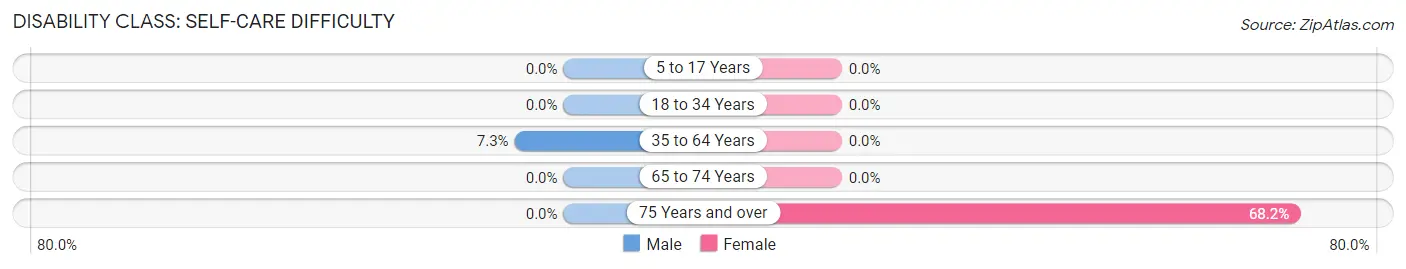
| Age Bracket | Male | Female |
| 5 to 17 Years | 0 (0.0%) | 0 (0.0%) |
| 18 to 34 Years | 0 (0.0%) | 0 (0.0%) |
| 35 to 64 Years | 4 (7.3%) | 0 (0.0%) |
| 65 to 74 Years | 0 (0.0%) | 0 (0.0%) |
| 75 Years and over | 0 (0.0%) | 15 (68.2%) |
Technology Access in Preston
Computing Device Access in Preston
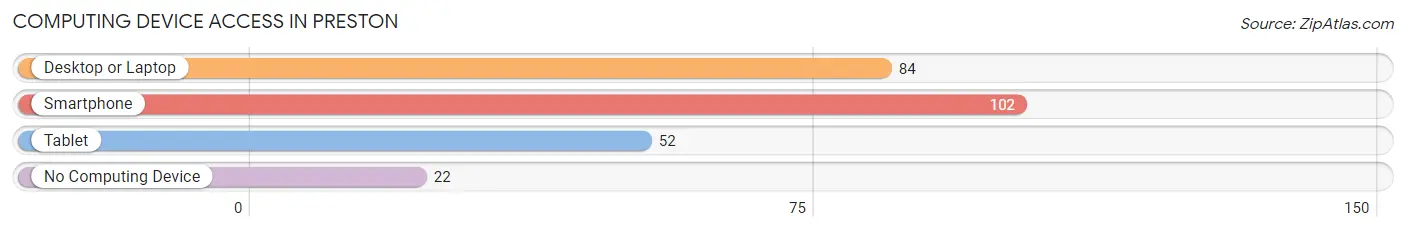
| Device Type | # Households | % Households |
| Desktop or Laptop | 84 | 63.2% |
| Smartphone | 102 | 76.7% |
| Tablet | 52 | 39.1% |
| No Computing Device | 22 | 16.5% |
| Total | 133 | 100.0% |
Internet Access in Preston
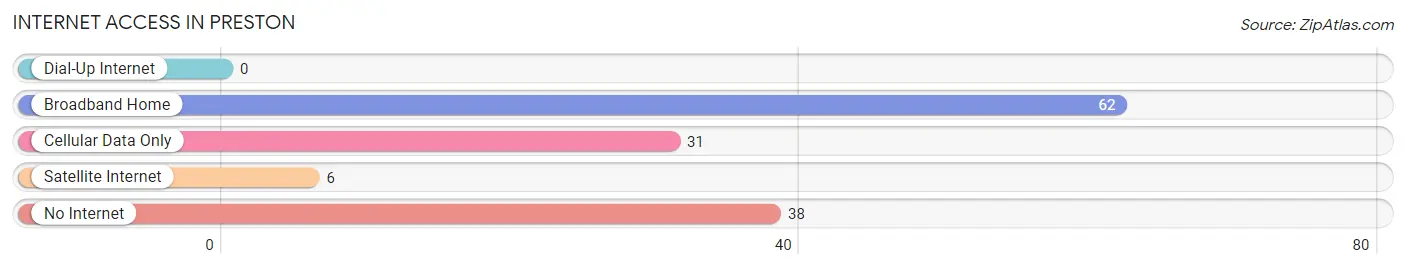
| Internet Type | # Households | % Households |
| Dial-Up Internet | 0 | 0.0% |
| Broadband Home | 62 | 46.6% |
| Cellular Data Only | 31 | 23.3% |
| Satellite Internet | 6 | 4.5% |
| No Internet | 38 | 28.6% |
| Total | 133 | 100.0% |
Preston Summary
Preston, Missouri is a small town located in the northwest corner of the state, in Worth County. It is situated on the banks of the Grand River, and is surrounded by rolling hills and farmland. The town was founded in 1871, and has a population of just over 500 people.
History
Preston was founded in 1871 by a group of settlers from the nearby town of Worth. The town was named after the first settler, William Preston, who had come to the area in search of a new home. The town was originally a farming community, and the settlers quickly established a post office, a general store, and a school.
In the late 1800s, Preston began to grow and prosper. The town was home to several businesses, including a blacksmith, a livery stable, and a hotel. The town also had a newspaper, the Preston Herald, which was published from 1891 to 1895.
In the early 1900s, Preston experienced a period of growth and development. The town was home to several churches, a bank, and a movie theater. The town also had a thriving agricultural industry, with several farms and orchards in the area.
Geography
Preston is located in the northwest corner of Missouri, in Worth County. The town is situated on the banks of the Grand River, and is surrounded by rolling hills and farmland. The town is located about 25 miles from the state capital of Jefferson City.
The climate in Preston is typical of the Midwest, with hot summers and cold winters. The average temperature in the summer is around 80 degrees Fahrenheit, and the average temperature in the winter is around 30 degrees Fahrenheit.
Economy
The economy of Preston is largely based on agriculture. The town is home to several farms and orchards, and the surrounding area is known for its production of corn, soybeans, and wheat. The town also has a small manufacturing sector, with several small businesses located in the area.
The town is also home to several small businesses, including restaurants, shops, and a grocery store. The town also has a post office, a bank, and a library.
Demographics
As of the 2010 census, Preston had a population of 514 people. The racial makeup of the town was 97.3% White, 0.6% African American, 0.2% Native American, 0.2% Asian, 0.2% from other races, and 1.6% from two or more races. Hispanic or Latino of any race were 0.8% of the population.
The median income for a household in Preston was $37,500, and the median income for a family was $41,250. The per capita income for the town was $17,845. About 11.2% of families and 13.2% of the population were below the poverty line, including 16.7% of those under age 18 and 8.3% of those age 65 or over.
Common Questions
What is Per Capita Income in Preston?
Per Capita income in Preston is $15,453.
What is the Median Family Income in Preston?
Median Family Income in Preston is $47,500.
What is the Median Household income in Preston?
Median Household Income in Preston is $30,536.
What is Inequality or Gini Index in Preston?
Inequality or Gini Index in Preston is 0.46.
What is the Total Population of Preston?
Total Population of Preston is 344.
What is the Total Male Population of Preston?
Total Male Population of Preston is 167.
What is the Total Female Population of Preston?
Total Female Population of Preston is 177.
What is the Ratio of Males per 100 Females in Preston?
There are 94.35 Males per 100 Females in Preston.
What is the Ratio of Females per 100 Males in Preston?
There are 105.99 Females per 100 Males in Preston.
What is the Median Population Age in Preston?
Median Population Age in Preston is 32.2 Years.
What is the Average Family Size in Preston
Average Family Size in Preston is 3.6 People.
What is the Average Household Size in Preston
Average Household Size in Preston is 2.6 People.
How Large is the Labor Force in Preston?
There are 155 People in the Labor Forcein in Preston.
What is the Percentage of People in the Labor Force in Preston?
63.8% of People are in the Labor Force in Preston.
What is the Unemployment Rate in Preston?
Unemployment Rate in Preston is 7.7%.