Silex, MO Map & Demographics
Silex Map
Silex Overview
$17,159
PER CAPITA INCOME
0.35
INEQUALITY / GINI INDEX
314
TOTAL POPULATION
165
MALE POPULATION
149
FEMALE POPULATION
110.74
MALES / 100 FEMALES
90.30
FEMALES / 100 MALES
54.3
MEDIAN AGE
3.2
AVG FAMILY SIZE
2.5
AVG HOUSEHOLD SIZE
81
LABOR FORCE [ PEOPLE ]
30.8%
PERCENT IN LABOR FORCE
Silex Zip Codes
Silex Area Codes
Income in Silex
Income Overview in Silex
| Characteristic | Number | Measure |
| Per Capita Income | 314 | $17,159 |
| Median Family Income | 60 | $0 |
| Mean Family Income | 60 | $65,450 |
| Median Household Income | 87 | $0 |
| Mean Household Income | 87 | $55,251 |
| Income Deficit | 60 | $0 |
| Wage / Income Gap (%) | 314 | 0.00% |
| Wage / Income Gap ($) | 314 | 100.00¢ per $1 |
| Gini / Inequality Index | 314 | 0.35 |
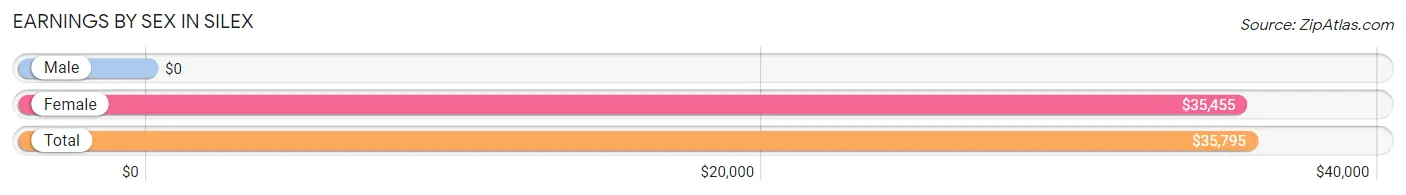
Earnings by Sex in Silex
| Sex | Number | Average Earnings |
| Male | 53 (62.4%) | $0 |
| Female | 32 (37.7%) | $35,455 |
| Total | 85 (100.0%) | $35,795 |
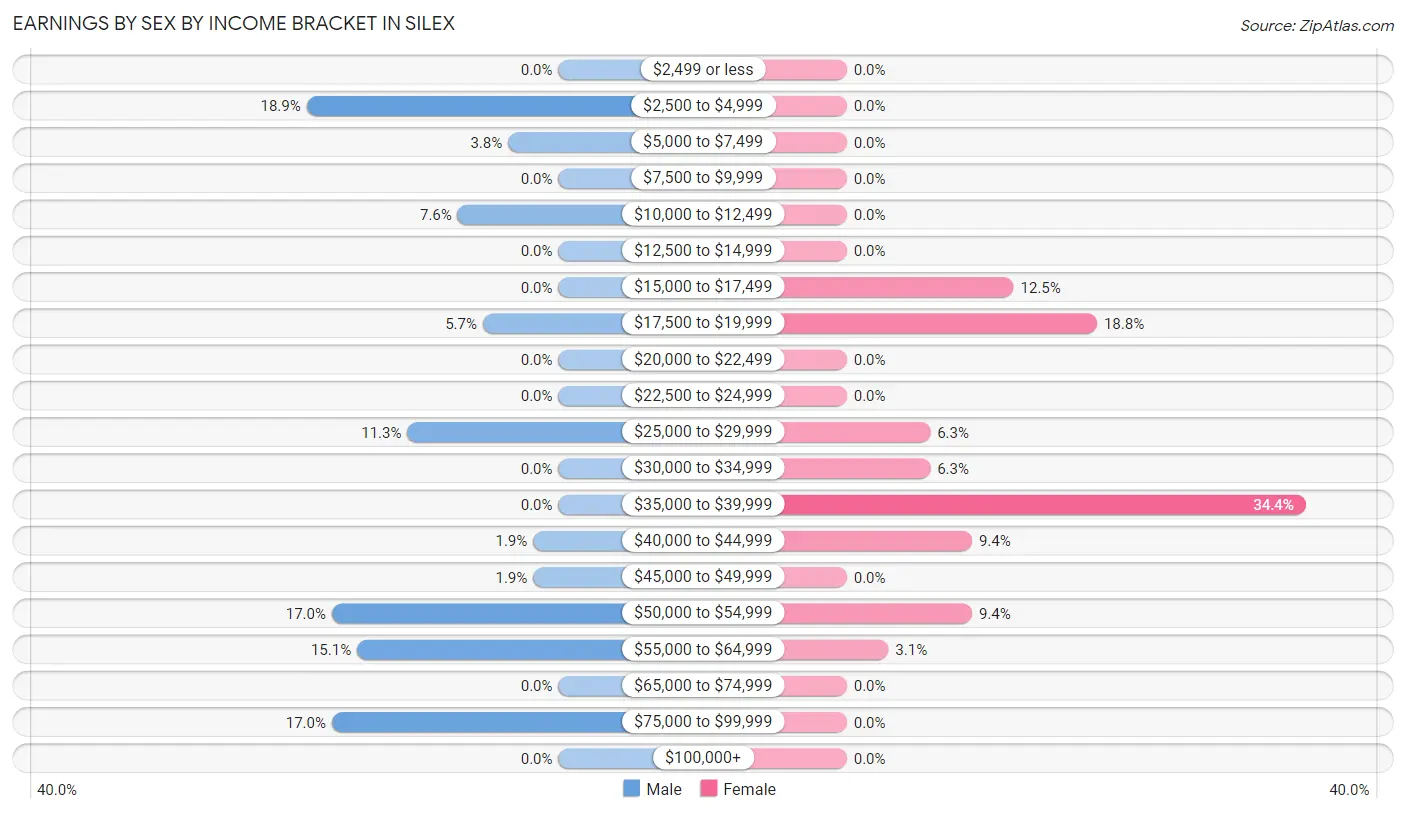
Earnings by Sex by Income Bracket in Silex
The most common earnings brackets in Silex are $2,500 to $4,999 for men (10 | 18.9%) and $35,000 to $39,999 for women (11 | 34.4%).
| Income | Male | Female |
| $2,499 or less | 0 (0.0%) | 0 (0.0%) |
| $2,500 to $4,999 | 10 (18.9%) | 0 (0.0%) |
| $5,000 to $7,499 | 2 (3.8%) | 0 (0.0%) |
| $7,500 to $9,999 | 0 (0.0%) | 0 (0.0%) |
| $10,000 to $12,499 | 4 (7.5%) | 0 (0.0%) |
| $12,500 to $14,999 | 0 (0.0%) | 0 (0.0%) |
| $15,000 to $17,499 | 0 (0.0%) | 4 (12.5%) |
| $17,500 to $19,999 | 3 (5.7%) | 6 (18.8%) |
| $20,000 to $22,499 | 0 (0.0%) | 0 (0.0%) |
| $22,500 to $24,999 | 0 (0.0%) | 0 (0.0%) |
| $25,000 to $29,999 | 6 (11.3%) | 2 (6.2%) |
| $30,000 to $34,999 | 0 (0.0%) | 2 (6.2%) |
| $35,000 to $39,999 | 0 (0.0%) | 11 (34.4%) |
| $40,000 to $44,999 | 1 (1.9%) | 3 (9.4%) |
| $45,000 to $49,999 | 1 (1.9%) | 0 (0.0%) |
| $50,000 to $54,999 | 9 (17.0%) | 3 (9.4%) |
| $55,000 to $64,999 | 8 (15.1%) | 1 (3.1%) |
| $65,000 to $74,999 | 0 (0.0%) | 0 (0.0%) |
| $75,000 to $99,999 | 9 (17.0%) | 0 (0.0%) |
| $100,000+ | 0 (0.0%) | 0 (0.0%) |
| Total | 53 (100.0%) | 32 (100.0%) |
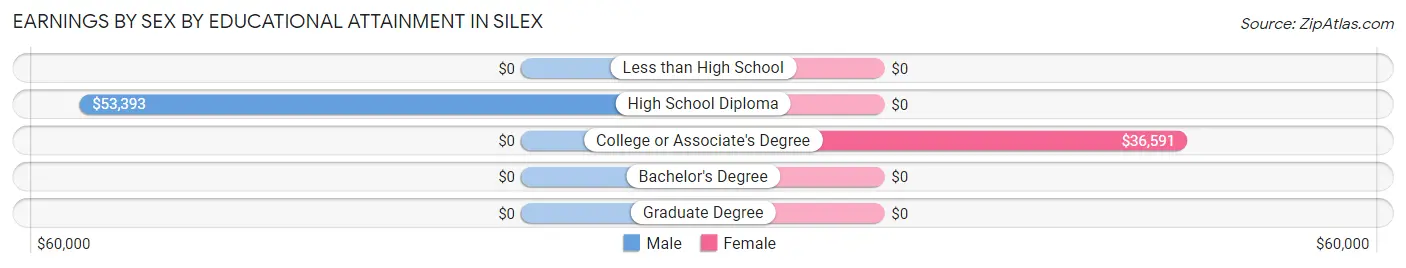
Earnings by Sex by Educational Attainment in Silex
Average earnings in Silex are $53,571 for men and $35,455 for women, a difference of 33.8%. Men with an educational attainment of high school diploma enjoy the highest average annual earnings of $53,393, while those with high school diploma education earn the least with $53,393. Women with an educational attainment of college or associate's degree earn the most with the average annual earnings of $36,591, while those with college or associate's degree education have the smallest earnings of $36,591.
| Educational Attainment | Male Income | Female Income |
| Less than High School | - | - |
| High School Diploma | $53,393 | $0 |
| College or Associate's Degree | - | - |
| Bachelor's Degree | - | - |
| Graduate Degree | - | - |
| Total | $53,571 | $35,455 |
Family Income in Silex
Family Income Brackets in Silex
According to the Silex family income data, there are 16 families falling into the $100,000 to $149,999 income range, which is the most common income bracket and makes up 26.7% of all families.
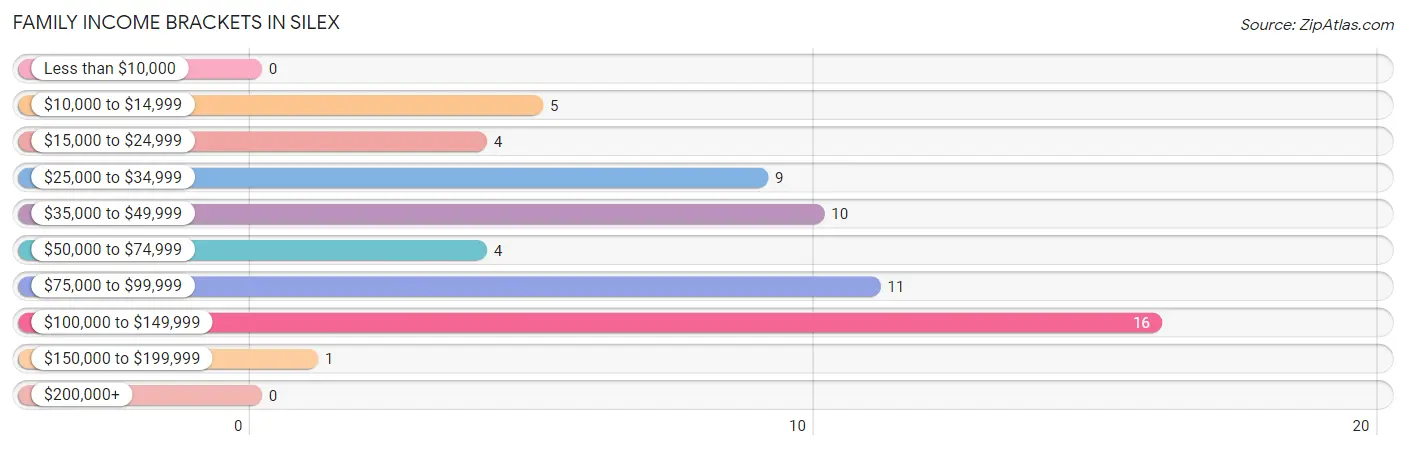
| Income Bracket | # Families | % Families |
| Less than $10,000 | 0 | 0.0% |
| $10,000 to $14,999 | 5 | 8.3% |
| $15,000 to $24,999 | 4 | 6.7% |
| $25,000 to $34,999 | 9 | 15.0% |
| $35,000 to $49,999 | 10 | 16.7% |
| $50,000 to $74,999 | 4 | 6.7% |
| $75,000 to $99,999 | 11 | 18.3% |
| $100,000 to $149,999 | 16 | 26.7% |
| $150,000 to $199,999 | 1 | 1.7% |
| $200,000+ | 0 | 0.0% |
Family Income by Famaliy Size in Silex
2-person families (32 | 53.3%) account for the highest median family income in Silex with $29,444 per family, while 2-person families (32 | 53.3%) have the highest median income of $14,722 per family member.
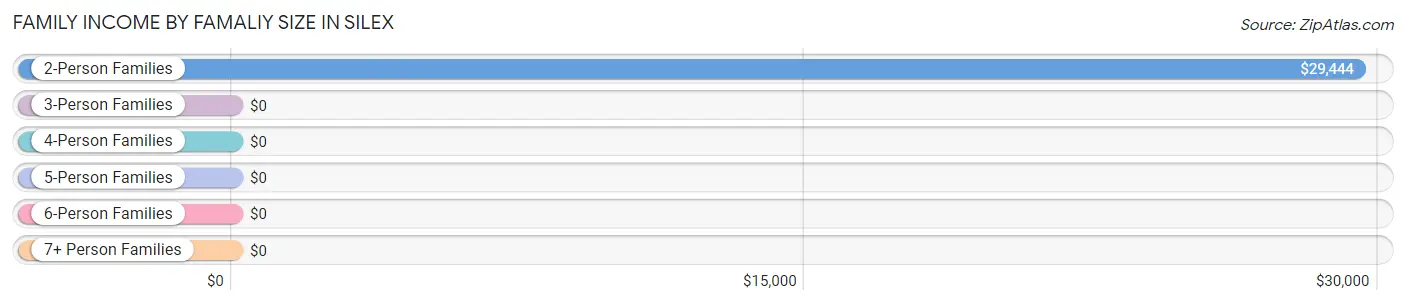
| Income Bracket | # Families | Median Income |
| 2-Person Families | 32 (53.3%) | $29,444 |
| 3-Person Families | 11 (18.3%) | $0 |
| 4-Person Families | 9 (15.0%) | $0 |
| 5-Person Families | 3 (5.0%) | $0 |
| 6-Person Families | 0 (0.0%) | $0 |
| 7+ Person Families | 5 (8.3%) | $0 |
| Total | 60 (100.0%) | $0 |
Family Income by Number of Earners in Silex
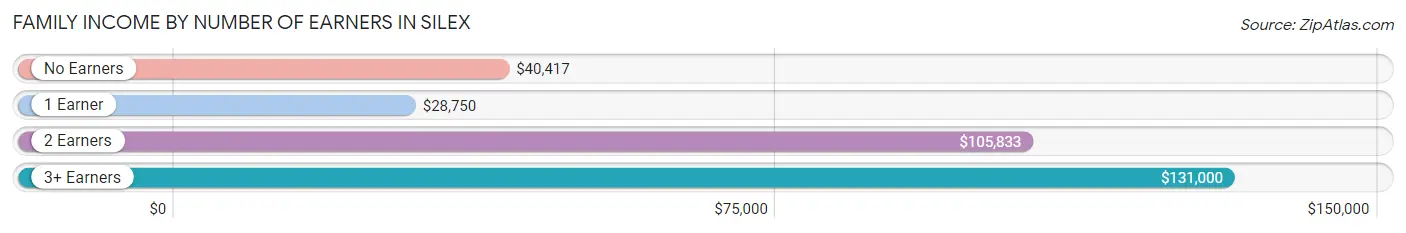
| Number of Earners | # Families | Median Income |
| No Earners | 15 (25.0%) | $40,417 |
| 1 Earner | 17 (28.3%) | $28,750 |
| 2 Earners | 20 (33.3%) | $105,833 |
| 3+ Earners | 8 (13.3%) | $131,000 |
| Total | 60 (100.0%) | $0 |
Household Income in Silex
Household Income Brackets in Silex
With 34 households falling in the category, the $25,000 to $34,999 income range is the most frequent in Silex, accounting for 39.1% of all households.
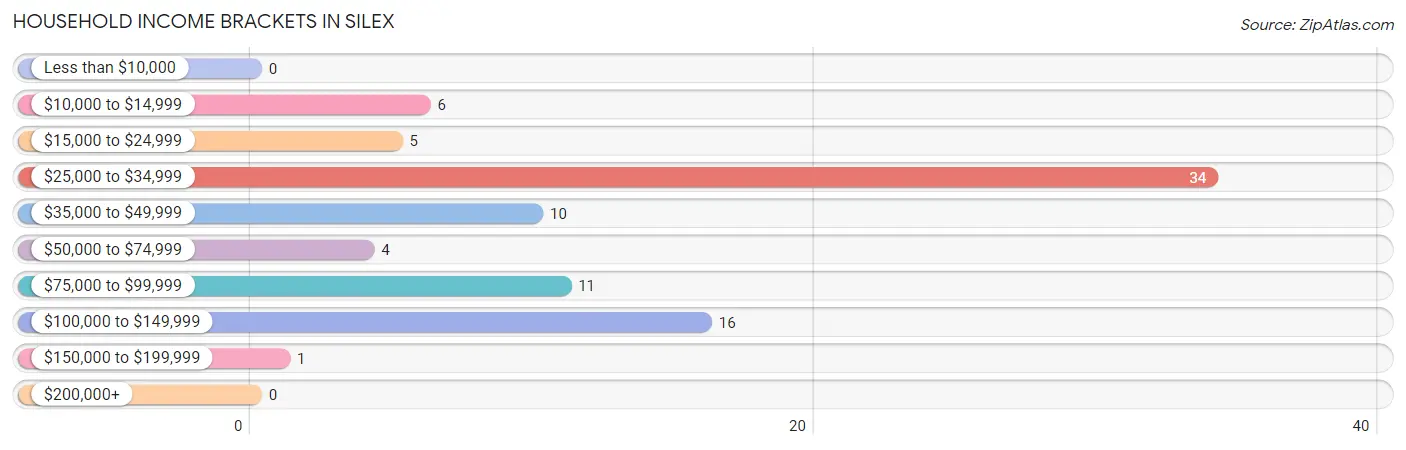
| Income Bracket | # Households | % Households |
| Less than $10,000 | 0 | 0.0% |
| $10,000 to $14,999 | 6 | 6.9% |
| $15,000 to $24,999 | 5 | 5.7% |
| $25,000 to $34,999 | 34 | 39.1% |
| $35,000 to $49,999 | 10 | 11.5% |
| $50,000 to $74,999 | 4 | 4.6% |
| $75,000 to $99,999 | 11 | 12.6% |
| $100,000 to $149,999 | 16 | 18.4% |
| $150,000 to $199,999 | 1 | 1.1% |
| $200,000+ | 0 | 0.0% |
Household Income by Householder Age in Silex
The median household income in Silex is $0, with the highest median household income of $108,750 found in the 45 to 64 years age bracket for the primary householder. A total of 18 households (20.7%) fall into this category. Meanwhile, the 15 to 24 years age bracket for the primary householder has the lowest median household income of $0, with 9 households (10.3%) in this group.
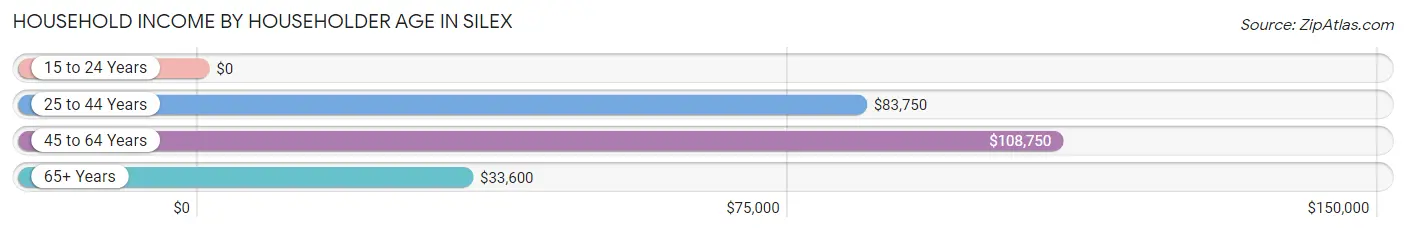
| Income Bracket | # Households | Median Income |
| 15 to 24 Years | 9 (10.3%) | $0 |
| 25 to 44 Years | 8 (9.2%) | $83,750 |
| 45 to 64 Years | 18 (20.7%) | $108,750 |
| 65+ Years | 52 (59.8%) | $33,600 |
| Total | 87 (100.0%) | $0 |
Poverty in Silex
Income Below Poverty by Sex and Age in Silex
With 19.4% poverty level for males and 21.6% for females among the residents of Silex, 75 year old and over males and 45 to 54 year old females are the most vulnerable to poverty, with 3 males (100.0%) and 12 females (92.3%) in their respective age groups living below the poverty level.
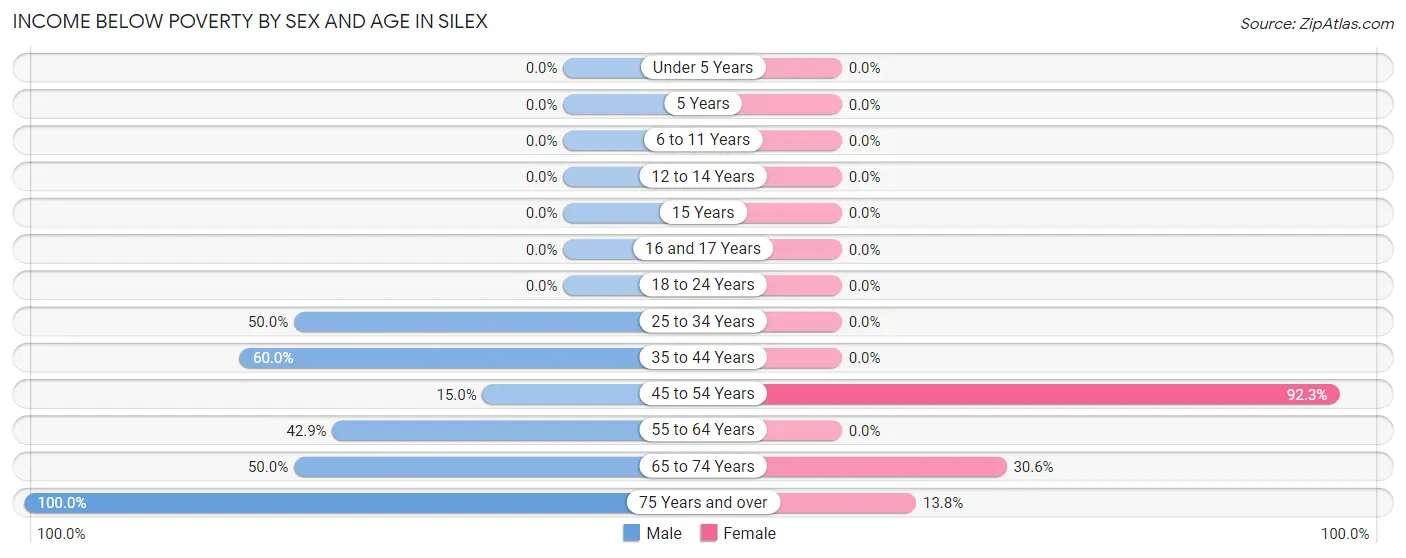
| Age Bracket | Male | Female |
| Under 5 Years | 0 (0.0%) | 0 (0.0%) |
| 5 Years | 0 (0.0%) | 0 (0.0%) |
| 6 to 11 Years | 0 (0.0%) | 0 (0.0%) |
| 12 to 14 Years | 0 (0.0%) | 0 (0.0%) |
| 15 Years | 0 (0.0%) | 0 (0.0%) |
| 16 and 17 Years | 0 (0.0%) | 0 (0.0%) |
| 18 to 24 Years | 0 (0.0%) | 0 (0.0%) |
| 25 to 34 Years | 4 (50.0%) | 0 (0.0%) |
| 35 to 44 Years | 3 (60.0%) | 0 (0.0%) |
| 45 to 54 Years | 3 (15.0%) | 12 (92.3%) |
| 55 to 64 Years | 12 (42.9%) | 0 (0.0%) |
| 65 to 74 Years | 1 (50.0%) | 11 (30.6%) |
| 75 Years and over | 3 (100.0%) | 4 (13.8%) |
| Total | 26 (19.4%) | 27 (21.6%) |
Income Above Poverty by Sex and Age in Silex
According to the poverty statistics in Silex, males aged under 5 years and females aged 5 years are the age groups that are most secure financially, with 100.0% of males and 100.0% of females in these age groups living above the poverty line.
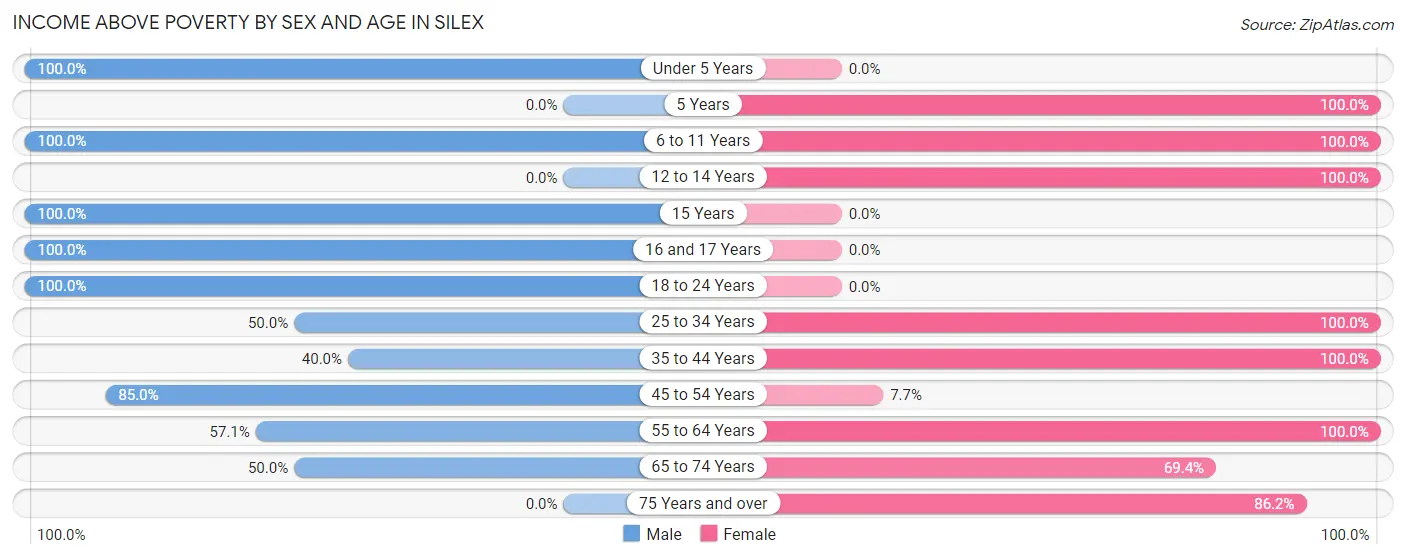
| Age Bracket | Male | Female |
| Under 5 Years | 2 (100.0%) | 0 (0.0%) |
| 5 Years | 0 (0.0%) | 6 (100.0%) |
| 6 to 11 Years | 22 (100.0%) | 12 (100.0%) |
| 12 to 14 Years | 0 (0.0%) | 2 (100.0%) |
| 15 Years | 7 (100.0%) | 0 (0.0%) |
| 16 and 17 Years | 2 (100.0%) | 0 (0.0%) |
| 18 to 24 Years | 35 (100.0%) | 0 (0.0%) |
| 25 to 34 Years | 4 (50.0%) | 13 (100.0%) |
| 35 to 44 Years | 2 (40.0%) | 8 (100.0%) |
| 45 to 54 Years | 17 (85.0%) | 1 (7.7%) |
| 55 to 64 Years | 16 (57.1%) | 6 (100.0%) |
| 65 to 74 Years | 1 (50.0%) | 25 (69.4%) |
| 75 Years and over | 0 (0.0%) | 25 (86.2%) |
| Total | 108 (80.6%) | 98 (78.4%) |
Income Below Poverty Among Married-Couple Families in Silex
The poverty statistics for married-couple families in Silex show that 20.0% or 5 of the total 25 families live below the poverty line. Families with no children have the highest poverty rate of 55.6%, comprising of 5 families. On the other hand, families with 1 or 2 children have the lowest poverty rate of 0.0%, which includes 0 families.
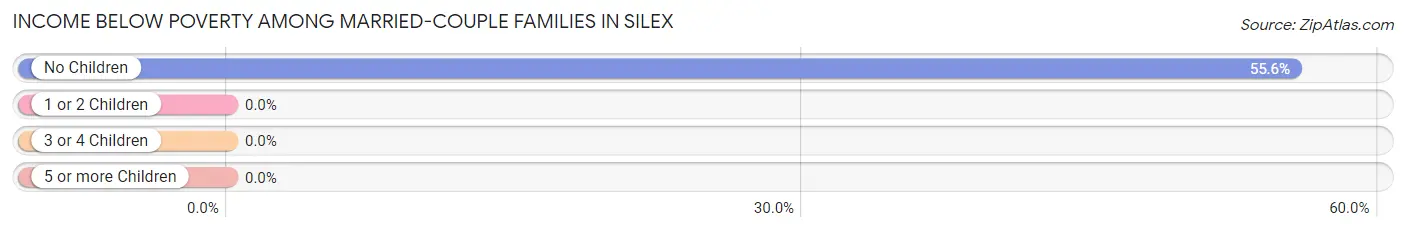
| Children | Above Poverty | Below Poverty |
| No Children | 4 (44.4%) | 5 (55.6%) |
| 1 or 2 Children | 9 (100.0%) | 0 (0.0%) |
| 3 or 4 Children | 2 (100.0%) | 0 (0.0%) |
| 5 or more Children | 5 (100.0%) | 0 (0.0%) |
| Total | 20 (80.0%) | 5 (20.0%) |
Income Below Poverty Among Single-Parent Households in Silex
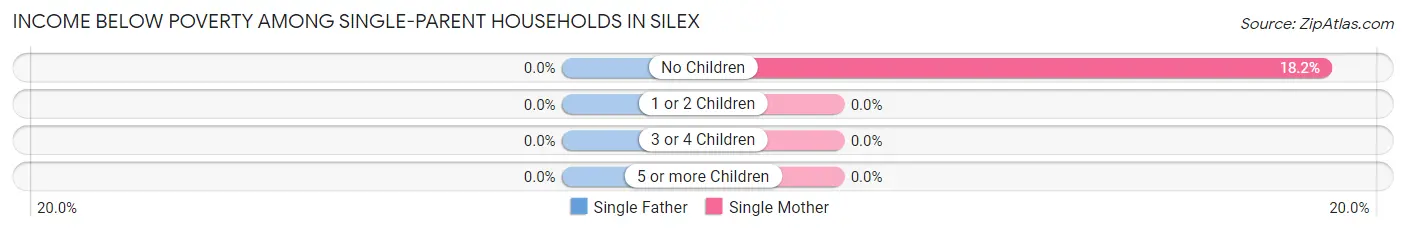
| Children | Single Father | Single Mother |
| No Children | 0 (0.0%) | 4 (18.2%) |
| 1 or 2 Children | 0 (0.0%) | 0 (0.0%) |
| 3 or 4 Children | 0 (0.0%) | 0 (0.0%) |
| 5 or more Children | 0 (0.0%) | 0 (0.0%) |
| Total | 0 (0.0%) | 4 (15.4%) |
Income Below Poverty Among Married-Couple vs Single-Parent Households in Silex
The poverty data for Silex shows that 5 of the married-couple family households (20.0%) and 4 of the single-parent households (11.4%) are living below the poverty level. Within the married-couple family households, those with no children have the highest poverty rate, with 5 households (55.6%) falling below the poverty line. Among the single-parent households, those with no children have the highest poverty rate, with 4 household (12.9%) living below poverty.
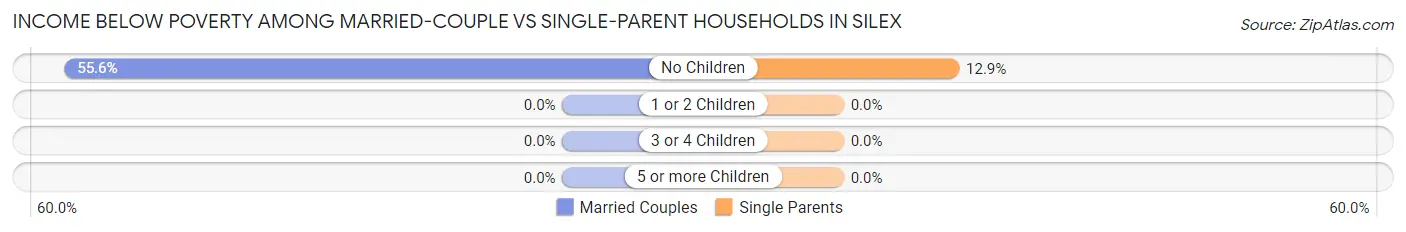
| Children | Married-Couple Families | Single-Parent Households |
| No Children | 5 (55.6%) | 4 (12.9%) |
| 1 or 2 Children | 0 (0.0%) | 0 (0.0%) |
| 3 or 4 Children | 0 (0.0%) | 0 (0.0%) |
| 5 or more Children | 0 (0.0%) | 0 (0.0%) |
| Total | 5 (20.0%) | 4 (11.4%) |
Race in Silex
The most populous races in Silex are White / Caucasian (300 | 95.5%), Two or more Races (10 | 3.2%), and Black / African American (4 | 1.3%).
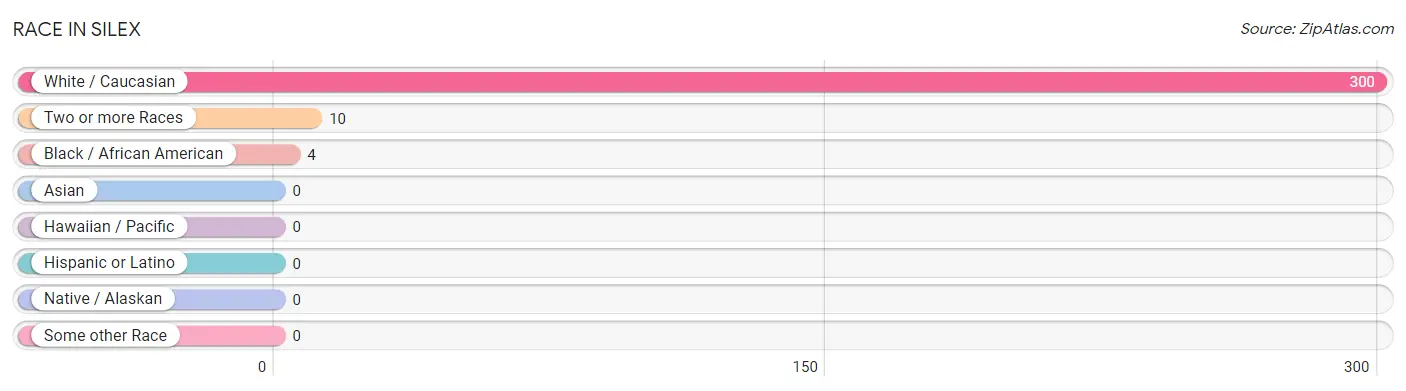
| Race | # Population | % Population |
| Asian | 0 | 0.0% |
| Black / African American | 4 | 1.3% |
| Hawaiian / Pacific | 0 | 0.0% |
| Hispanic or Latino | 0 | 0.0% |
| Native / Alaskan | 0 | 0.0% |
| White / Caucasian | 300 | 95.5% |
| Two or more Races | 10 | 3.2% |
| Some other Race | 0 | 0.0% |
| Total | 314 | 100.0% |
Ancestry in Silex
The most populous ancestries reported in Silex are Irish (50 | 15.9%), German (38 | 12.1%), English (10 | 3.2%), French (9 | 2.9%), and Norwegian (5 | 1.6%), together accounting for 35.7% of all Silex residents.
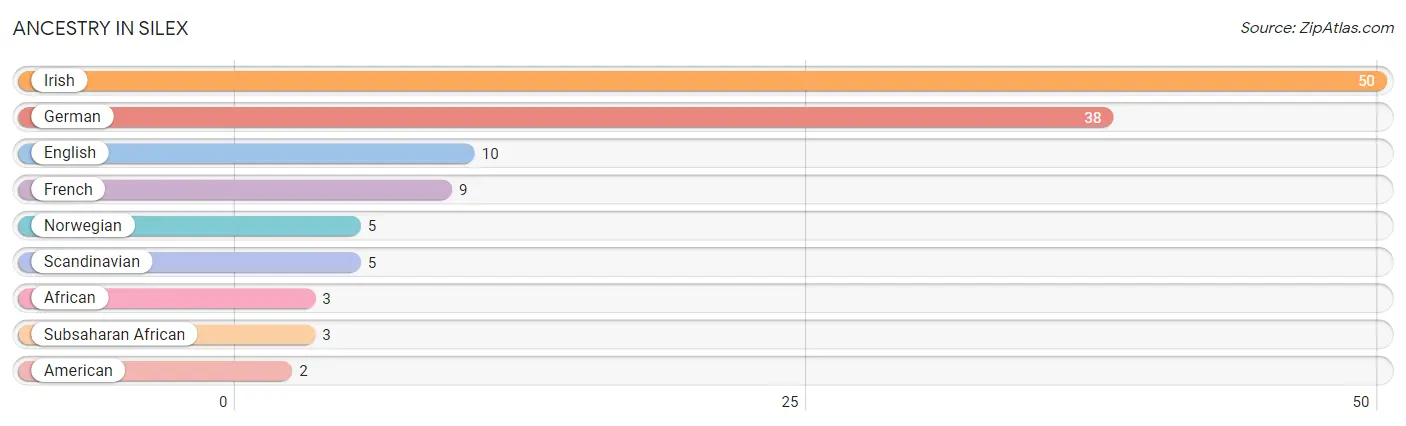
| Ancestry | # Population | % Population |
| African | 3 | 1.0% |
| American | 2 | 0.6% |
| English | 10 | 3.2% |
| French | 9 | 2.9% |
| German | 38 | 12.1% |
| Irish | 50 | 15.9% |
| Norwegian | 5 | 1.6% |
| Scandinavian | 5 | 1.6% |
| Subsaharan African | 3 | 1.0% | View All 9 Rows |
Immigrants in Silex

| Immigration Origin | # Population | % Population | View All 0 Rows |
Sex and Age in Silex
Sex and Age in Silex
The most populous age groups in Silex are 20 to 24 Years (29 | 17.6%) for men and 75 to 79 Years (25 | 16.8%) for women.
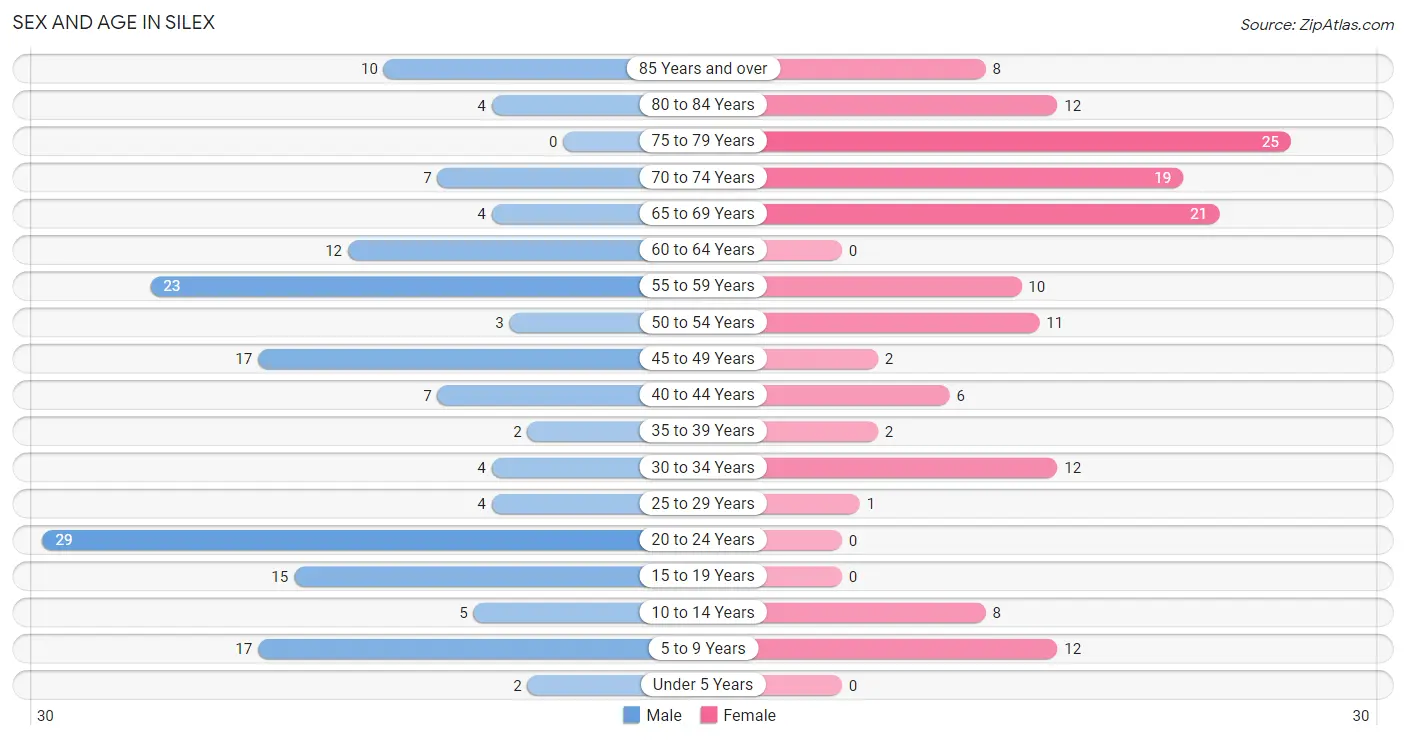
| Age Bracket | Male | Female |
| Under 5 Years | 2 (1.2%) | 0 (0.0%) |
| 5 to 9 Years | 17 (10.3%) | 12 (8.1%) |
| 10 to 14 Years | 5 (3.0%) | 8 (5.4%) |
| 15 to 19 Years | 15 (9.1%) | 0 (0.0%) |
| 20 to 24 Years | 29 (17.6%) | 0 (0.0%) |
| 25 to 29 Years | 4 (2.4%) | 1 (0.7%) |
| 30 to 34 Years | 4 (2.4%) | 12 (8.1%) |
| 35 to 39 Years | 2 (1.2%) | 2 (1.3%) |
| 40 to 44 Years | 7 (4.2%) | 6 (4.0%) |
| 45 to 49 Years | 17 (10.3%) | 2 (1.3%) |
| 50 to 54 Years | 3 (1.8%) | 11 (7.4%) |
| 55 to 59 Years | 23 (13.9%) | 10 (6.7%) |
| 60 to 64 Years | 12 (7.3%) | 0 (0.0%) |
| 65 to 69 Years | 4 (2.4%) | 21 (14.1%) |
| 70 to 74 Years | 7 (4.2%) | 19 (12.8%) |
| 75 to 79 Years | 0 (0.0%) | 25 (16.8%) |
| 80 to 84 Years | 4 (2.4%) | 12 (8.1%) |
| 85 Years and over | 10 (6.1%) | 8 (5.4%) |
| Total | 165 (100.0%) | 149 (100.0%) |
Families and Households in Silex
Median Family Size in Silex
The median family size in Silex is 3.23 persons per family, with married-couple families (25 | 41.7%) accounting for the largest median family size of 4.4 persons per family. On the other hand, single female/mother families (26 | 43.3%) represent the smallest median family size with 2.38 persons per family.
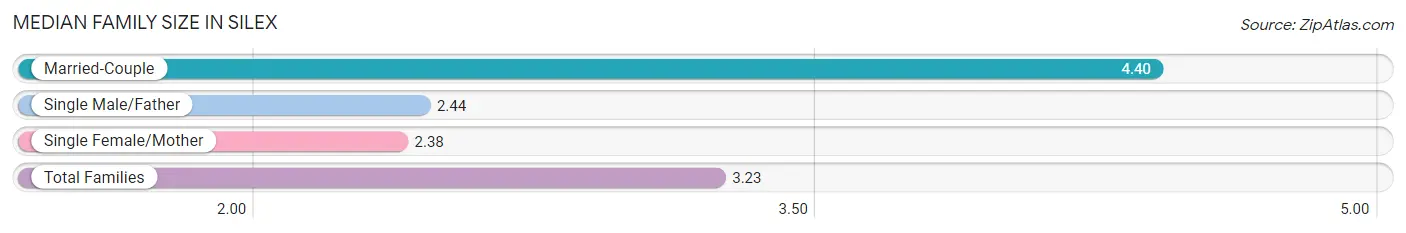
| Family Type | # Families | Family Size |
| Married-Couple | 25 (41.7%) | 4.40 |
| Single Male/Father | 9 (15.0%) | 2.44 |
| Single Female/Mother | 26 (43.3%) | 2.38 |
| Total Families | 60 (100.0%) | 3.23 |
Median Household Size in Silex
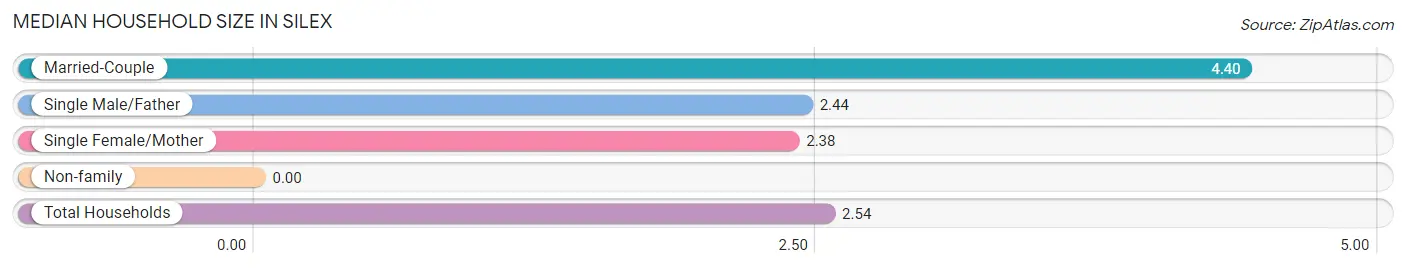
| Household Type | # Households | Household Size |
| Married-Couple | 25 (28.7%) | 4.40 |
| Single Male/Father | 9 (10.3%) | 2.44 |
| Single Female/Mother | 26 (29.9%) | 2.38 |
| Non-family | 27 (31.0%) | - |
| Total Households | 87 (100.0%) | 2.54 |
Household Size by Marriage Status in Silex
Out of a total of 87 households in Silex, 60 (69.0%) are family households, while 27 (31.0%) are nonfamily households. The most numerous type of family households are 2-person households, comprising 32, and the most common type of nonfamily households are 1-person households, comprising 27.
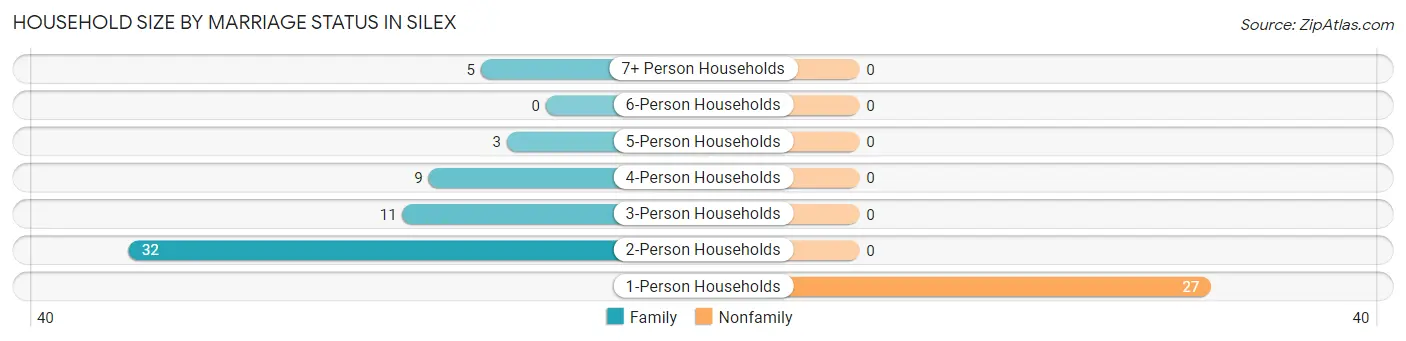
| Household Size | Family Households | Nonfamily Households |
| 1-Person Households | - | 27 (31.0%) |
| 2-Person Households | 32 (36.8%) | 0 (0.0%) |
| 3-Person Households | 11 (12.6%) | 0 (0.0%) |
| 4-Person Households | 9 (10.3%) | 0 (0.0%) |
| 5-Person Households | 3 (3.5%) | 0 (0.0%) |
| 6-Person Households | 0 (0.0%) | 0 (0.0%) |
| 7+ Person Households | 5 (5.8%) | 0 (0.0%) |
| Total | 60 (69.0%) | 27 (31.0%) |
Female Fertility in Silex
Fertility by Age in Silex
Average fertility rate in Silex is 43.0 births per 1,000 women. Women in the age bracket of 20 to 34 years have the highest fertility rate with 77.0 births per 1,000 women. Women in the age bracket of 20 to 34 years acount for 100.0% of all women with births.
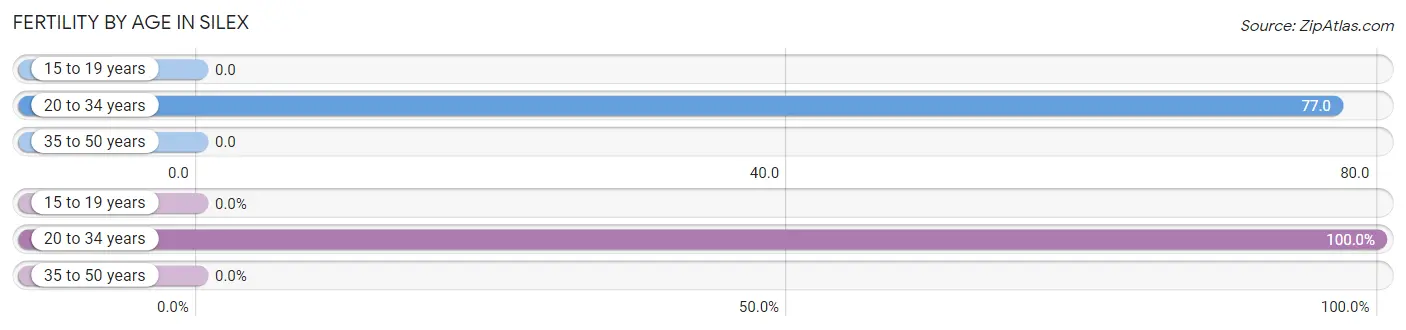
| Age Bracket | Women with Births | Births / 1,000 Women |
| 15 to 19 years | 0 (0.0%) | 0.0 |
| 20 to 34 years | 1 (100.0%) | 77.0 |
| 35 to 50 years | 0 (0.0%) | 0.0 |
| Total | 1 (100.0%) | 43.0 |
Fertility by Age by Marriage Status in Silex
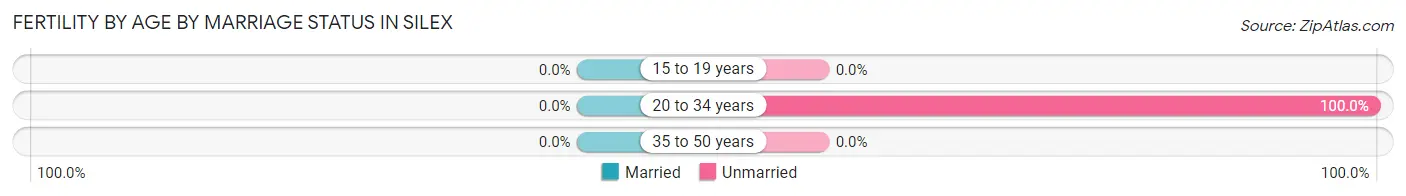
| Age Bracket | Married | Unmarried |
| 15 to 19 years | 0 (0.0%) | 0 (0.0%) |
| 20 to 34 years | 0 (0.0%) | 1 (100.0%) |
| 35 to 50 years | 0 (0.0%) | 0 (0.0%) |
| Total | 0 (0.0%) | 1 (100.0%) |
Fertility by Education in Silex
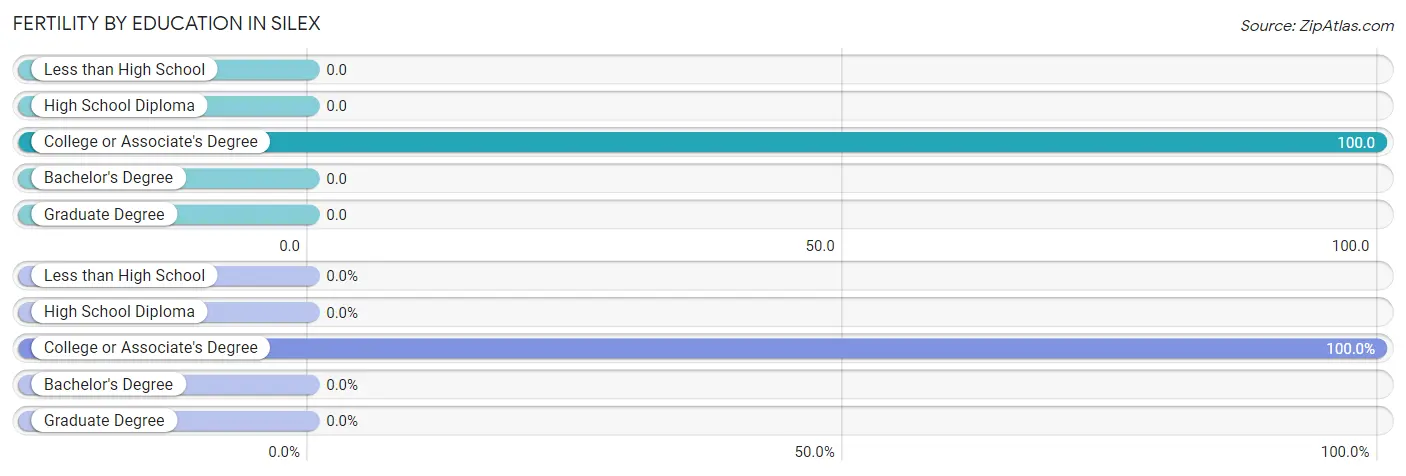
| Educational Attainment | Women with Births | Births / 1,000 Women |
| Less than High School | 0 (0.0%) | 0.0 |
| High School Diploma | 0 (0.0%) | 0.0 |
| College or Associate's Degree | 1 (100.0%) | 100.0 |
| Bachelor's Degree | 0 (0.0%) | 0.0 |
| Graduate Degree | 0 (0.0%) | 0.0 |
| Total | 1 (100.0%) | 43.0 |
Fertility by Education by Marriage Status in Silex
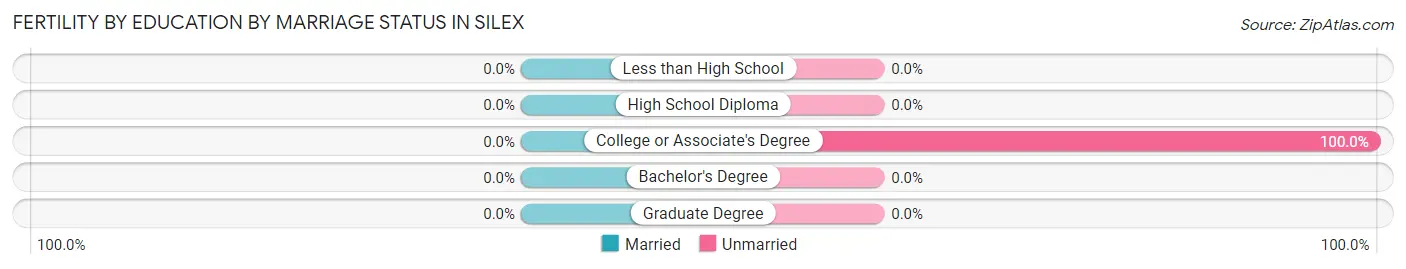
| Educational Attainment | Married | Unmarried |
| Less than High School | 0 (0.0%) | 0 (0.0%) |
| High School Diploma | 0 (0.0%) | 0 (0.0%) |
| College or Associate's Degree | 0 (0.0%) | 1 (100.0%) |
| Bachelor's Degree | 0 (0.0%) | 0 (0.0%) |
| Graduate Degree | 0 (0.0%) | 0 (0.0%) |
| Total | 0 (0.0%) | 1 (100.0%) |
Employment Characteristics in Silex
Employment by Class of Employer in Silex
Among the 81 employed individuals in Silex, private company employees (68 | 84.0%), self-employed (not incorporated) (6 | 7.4%), and not-for-profit organizations (4 | 4.9%) make up the most common classes of employment.
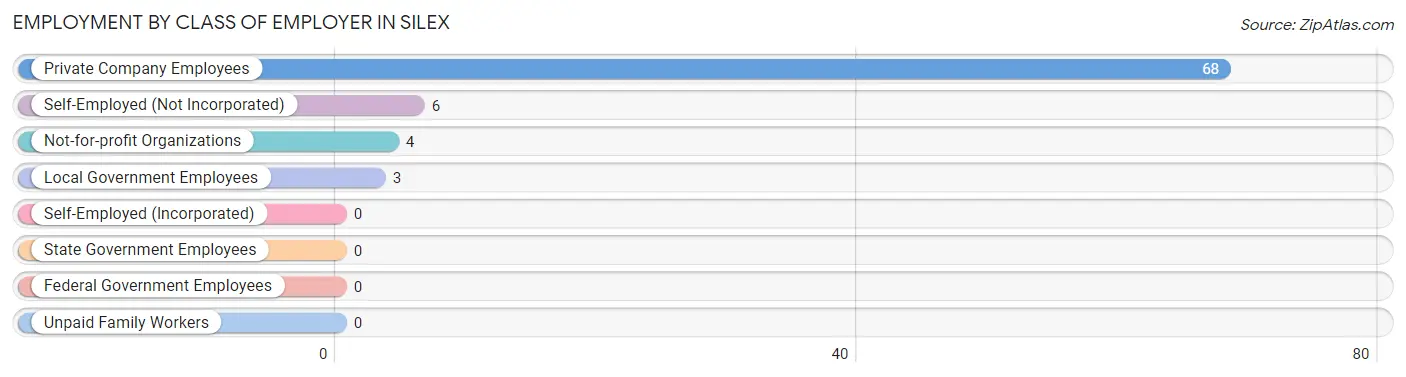
| Employer Class | # Employees | % Employees |
| Private Company Employees | 68 | 84.0% |
| Self-Employed (Incorporated) | 0 | 0.0% |
| Self-Employed (Not Incorporated) | 6 | 7.4% |
| Not-for-profit Organizations | 4 | 4.9% |
| Local Government Employees | 3 | 3.7% |
| State Government Employees | 0 | 0.0% |
| Federal Government Employees | 0 | 0.0% |
| Unpaid Family Workers | 0 | 0.0% |
| Total | 81 | 100.0% |
Employment Status by Age in Silex
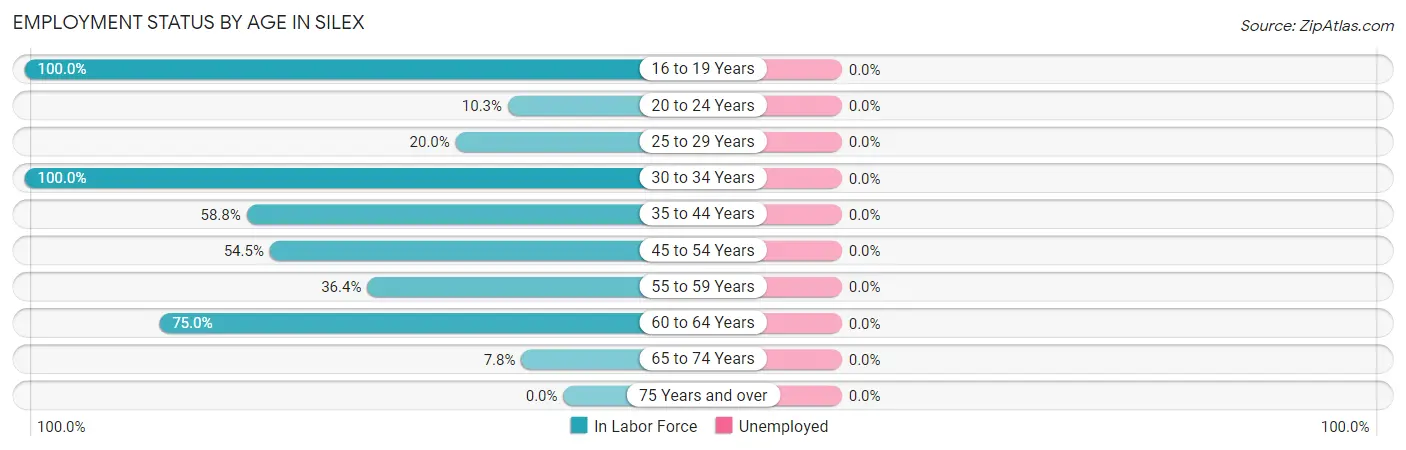
| Age Bracket | In Labor Force | Unemployed |
| 16 to 19 Years | 8 (100.0%) | 0 (0.0%) |
| 20 to 24 Years | 3 (10.3%) | 0 (0.0%) |
| 25 to 29 Years | 1 (20.0%) | 0 (0.0%) |
| 30 to 34 Years | 16 (100.0%) | 0 (0.0%) |
| 35 to 44 Years | 10 (58.8%) | 0 (0.0%) |
| 45 to 54 Years | 18 (54.5%) | 0 (0.0%) |
| 55 to 59 Years | 12 (36.4%) | 0 (0.0%) |
| 60 to 64 Years | 9 (75.0%) | 0 (0.0%) |
| 65 to 74 Years | 4 (7.8%) | 0 (0.0%) |
| 75 Years and over | 0 (0.0%) | 0 (0.0%) |
| Total | 81 (30.8%) | 0 (0.0%) |
Employment Status by Educational Attainment in Silex
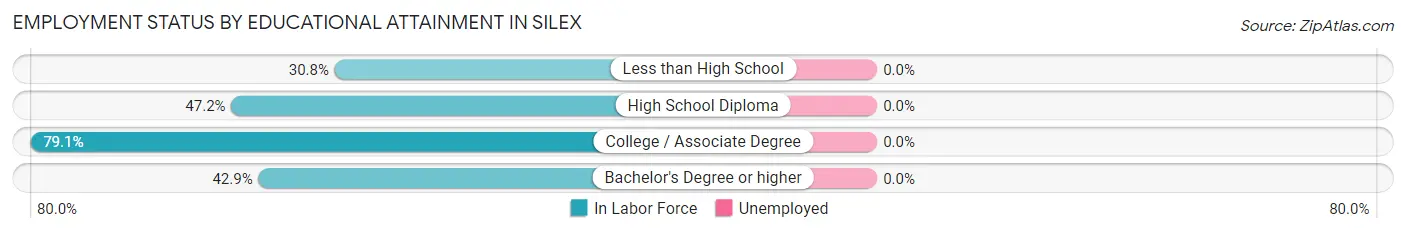
| Educational Attainment | In Labor Force | Unemployed |
| Less than High School | 4 (30.8%) | 0 (0.0%) |
| High School Diploma | 25 (47.2%) | 0 (0.0%) |
| College / Associate Degree | 34 (79.1%) | 0 (0.0%) |
| Bachelor's Degree or higher | 3 (42.9%) | 0 (0.0%) |
| Total | 66 (56.9%) | 0 (0.0%) |
Employment Occupations by Sex in Silex
Management, Business, Science and Arts Occupations
The most common Management, Business, Science and Arts occupations in Silex are Management (16 | 19.8%), Health Diagnosing & Treating (6 | 7.4%), Community & Social Service (3 | 3.7%), and Education Instruction & Library (3 | 3.7%).
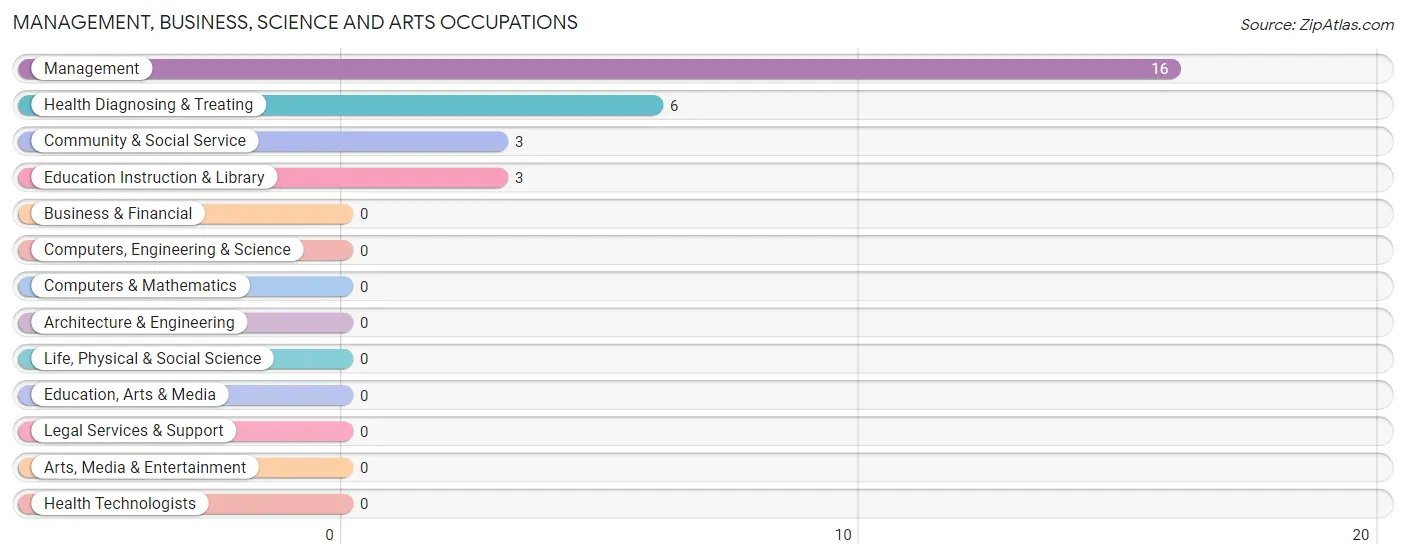
Management, Business, Science and Arts Occupations by Sex
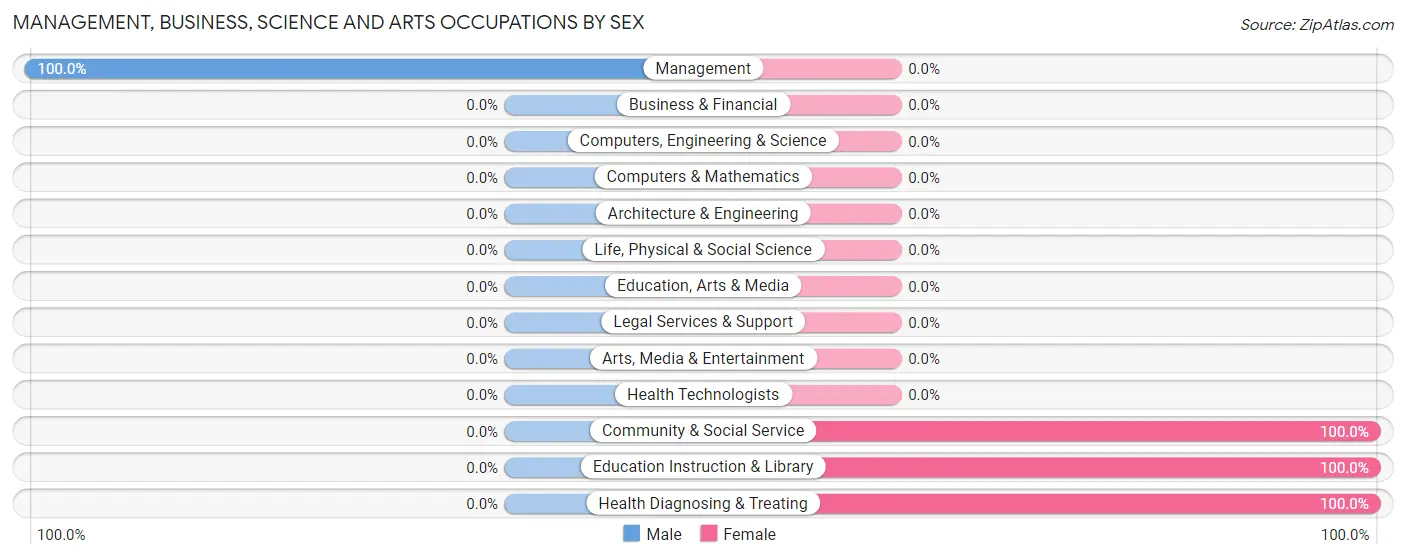
| Occupation | Male | Female |
| Management | 16 (100.0%) | 0 (0.0%) |
| Business & Financial | 0 (0.0%) | 0 (0.0%) |
| Computers, Engineering & Science | 0 (0.0%) | 0 (0.0%) |
| Computers & Mathematics | 0 (0.0%) | 0 (0.0%) |
| Architecture & Engineering | 0 (0.0%) | 0 (0.0%) |
| Life, Physical & Social Science | 0 (0.0%) | 0 (0.0%) |
| Community & Social Service | 0 (0.0%) | 3 (100.0%) |
| Education, Arts & Media | 0 (0.0%) | 0 (0.0%) |
| Legal Services & Support | 0 (0.0%) | 0 (0.0%) |
| Education Instruction & Library | 0 (0.0%) | 3 (100.0%) |
| Arts, Media & Entertainment | 0 (0.0%) | 0 (0.0%) |
| Health Diagnosing & Treating | 0 (0.0%) | 6 (100.0%) |
| Health Technologists | 0 (0.0%) | 0 (0.0%) |
| Total (Category) | 16 (64.0%) | 9 (36.0%) |
| Total (Overall) | 49 (60.5%) | 32 (39.5%) |
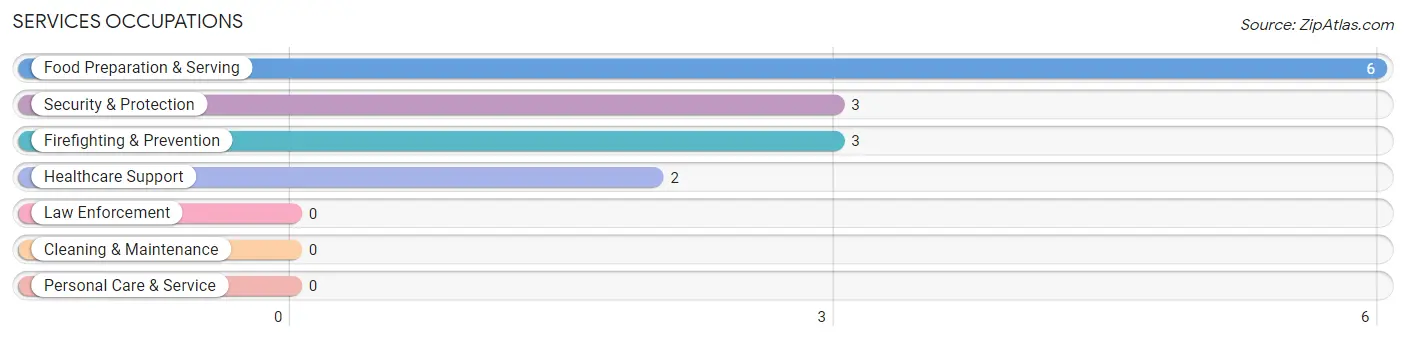
Services Occupations
The most common Services occupations in Silex are Food Preparation & Serving (6 | 7.4%), Security & Protection (3 | 3.7%), Firefighting & Prevention (3 | 3.7%), and Healthcare Support (2 | 2.5%).
Services Occupations by Sex
Within the Services occupations in Silex, the most male-oriented occupations are Security & Protection (100.0%), Firefighting & Prevention (100.0%), and Food Preparation & Serving (33.3%), while the most female-oriented occupations are Healthcare Support (100.0%), and Food Preparation & Serving (66.7%).
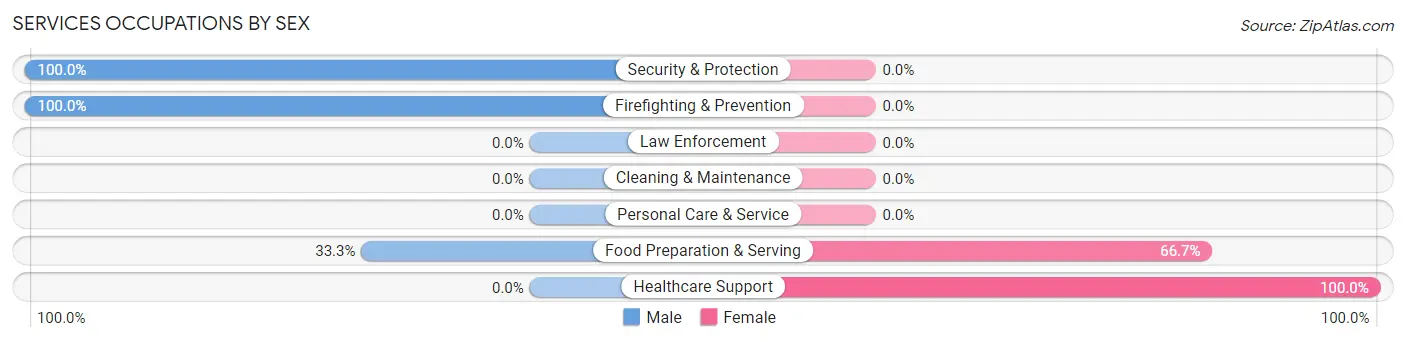
| Occupation | Male | Female |
| Healthcare Support | 0 (0.0%) | 2 (100.0%) |
| Security & Protection | 3 (100.0%) | 0 (0.0%) |
| Firefighting & Prevention | 3 (100.0%) | 0 (0.0%) |
| Law Enforcement | 0 (0.0%) | 0 (0.0%) |
| Food Preparation & Serving | 2 (33.3%) | 4 (66.7%) |
| Cleaning & Maintenance | 0 (0.0%) | 0 (0.0%) |
| Personal Care & Service | 0 (0.0%) | 0 (0.0%) |
| Total (Category) | 5 (45.5%) | 6 (54.5%) |
| Total (Overall) | 49 (60.5%) | 32 (39.5%) |
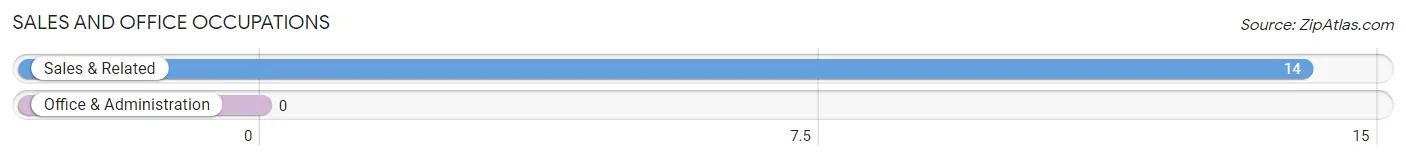
Sales and Office Occupations
The most common Sales and Office occupations in Silex are , and Sales & Related (14 | 17.3%).
Sales and Office Occupations by Sex
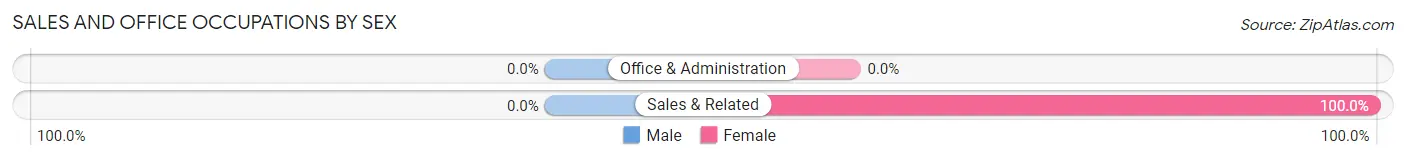
| Occupation | Male | Female |
| Sales & Related | 0 (0.0%) | 14 (100.0%) |
| Office & Administration | 0 (0.0%) | 0 (0.0%) |
| Total (Category) | 0 (0.0%) | 14 (100.0%) |
| Total (Overall) | 49 (60.5%) | 32 (39.5%) |
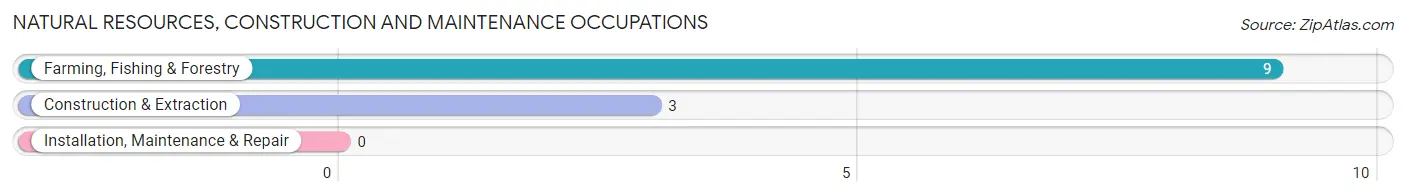
Natural Resources, Construction and Maintenance Occupations
The most common Natural Resources, Construction and Maintenance occupations in Silex are Farming, Fishing & Forestry (9 | 11.1%), and Construction & Extraction (3 | 3.7%).
Natural Resources, Construction and Maintenance Occupations by Sex
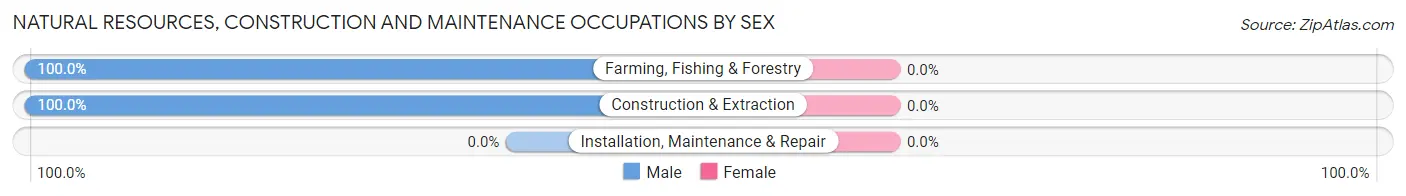
| Occupation | Male | Female |
| Farming, Fishing & Forestry | 9 (100.0%) | 0 (0.0%) |
| Construction & Extraction | 3 (100.0%) | 0 (0.0%) |
| Installation, Maintenance & Repair | 0 (0.0%) | 0 (0.0%) |
| Total (Category) | 12 (100.0%) | 0 (0.0%) |
| Total (Overall) | 49 (60.5%) | 32 (39.5%) |
Production, Transportation and Moving Occupations
The most common Production, Transportation and Moving occupations in Silex are Production (8 | 9.9%), Material Moving (7 | 8.6%), and Transportation (4 | 4.9%).
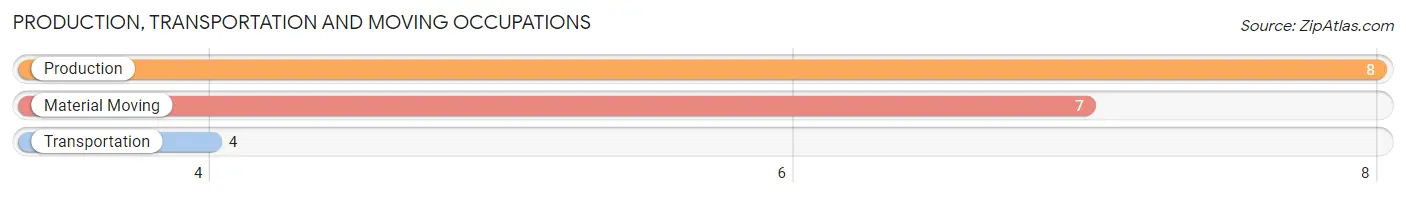
Production, Transportation and Moving Occupations by Sex
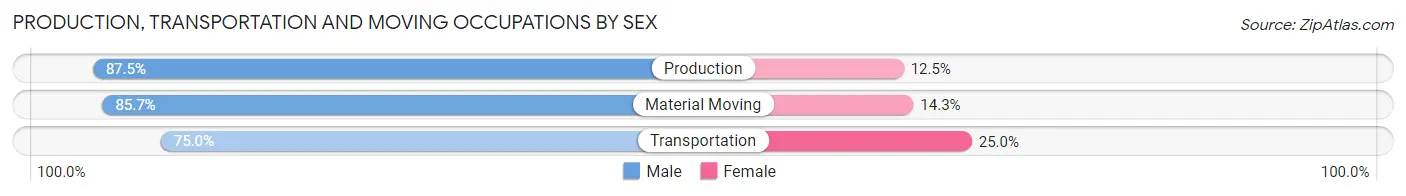
| Occupation | Male | Female |
| Production | 7 (87.5%) | 1 (12.5%) |
| Transportation | 3 (75.0%) | 1 (25.0%) |
| Material Moving | 6 (85.7%) | 1 (14.3%) |
| Total (Category) | 16 (84.2%) | 3 (15.8%) |
| Total (Overall) | 49 (60.5%) | 32 (39.5%) |
Employment Industries by Sex in Silex
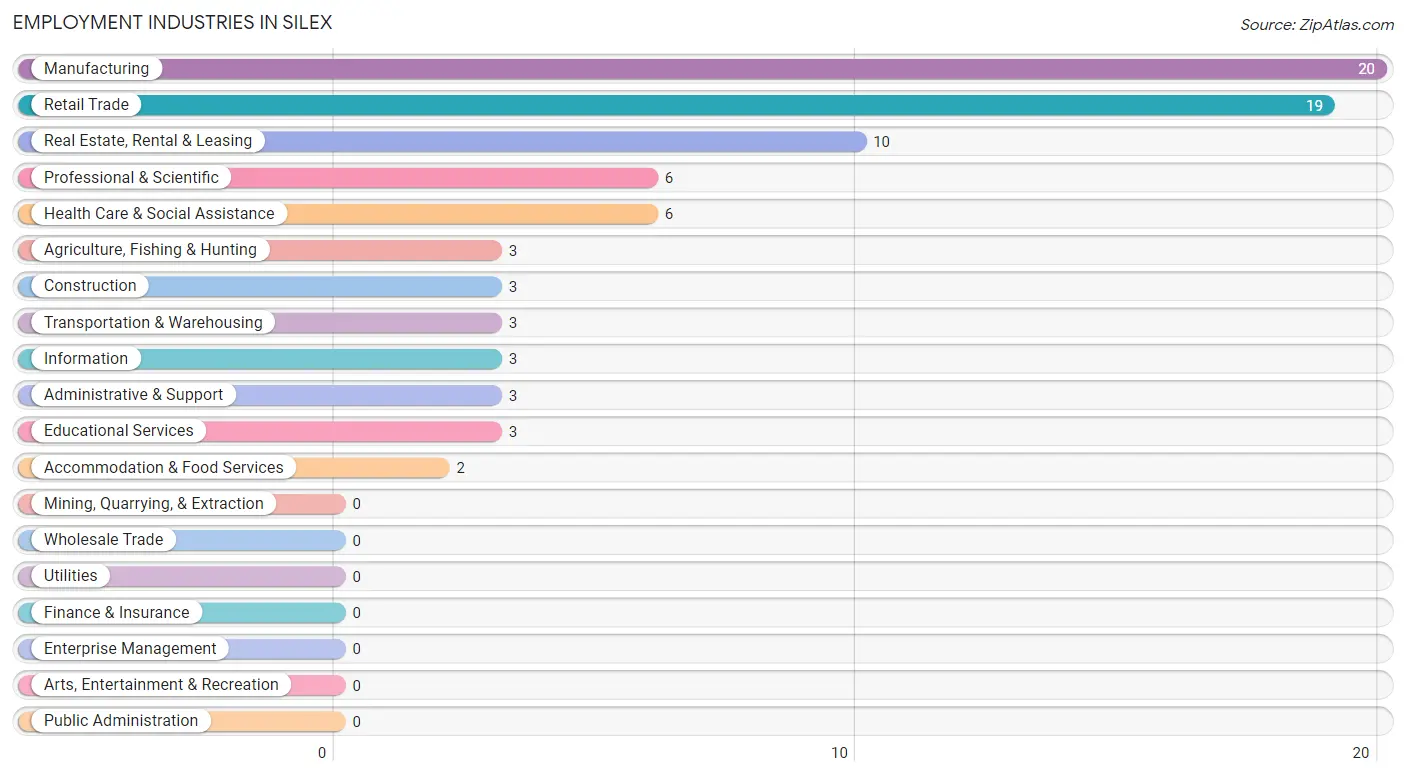
Employment Industries in Silex
The major employment industries in Silex include Manufacturing (20 | 24.7%), Retail Trade (19 | 23.5%), Real Estate, Rental & Leasing (10 | 12.3%), Professional & Scientific (6 | 7.4%), and Health Care & Social Assistance (6 | 7.4%).
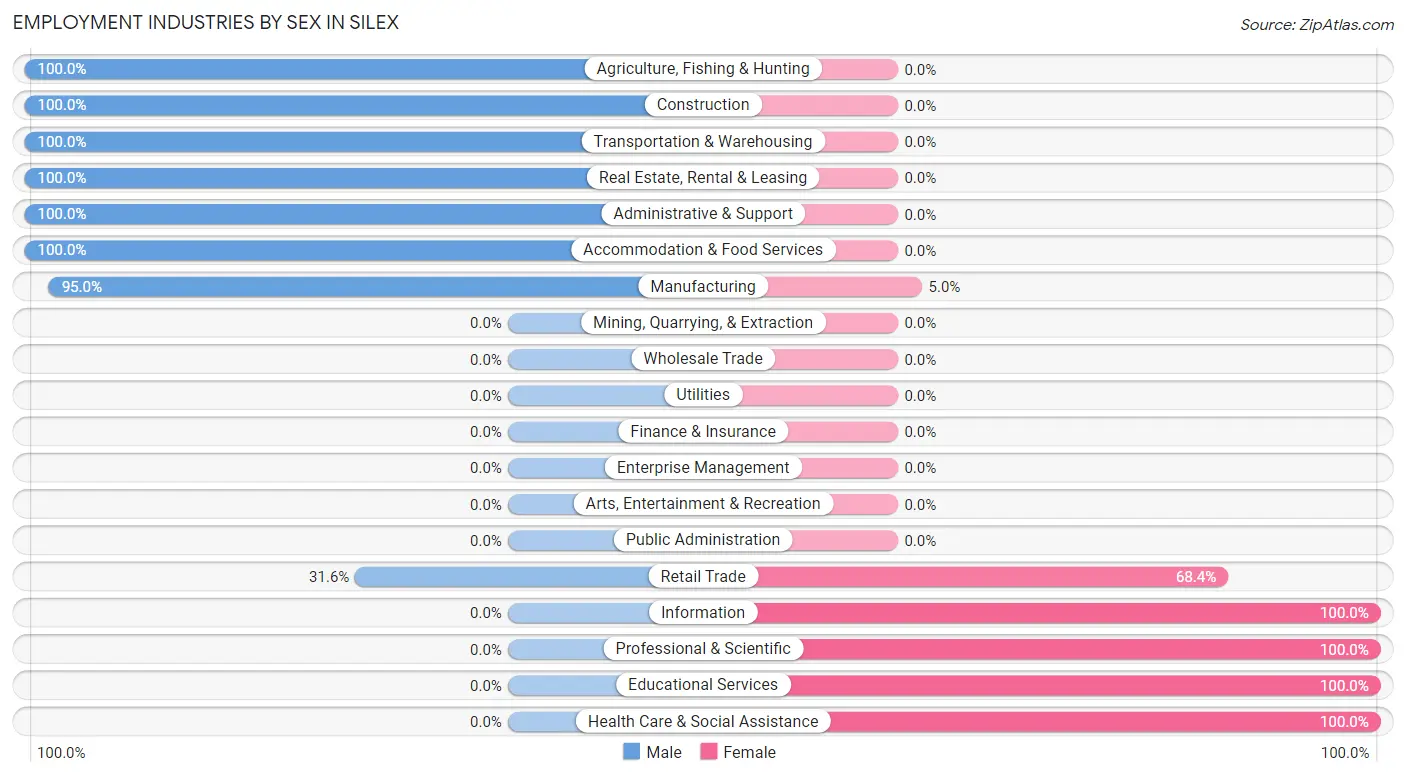
Employment Industries by Sex in Silex
The Silex industries that see more men than women are Agriculture, Fishing & Hunting (100.0%), Construction (100.0%), and Transportation & Warehousing (100.0%), whereas the industries that tend to have a higher number of women are Information (100.0%), Professional & Scientific (100.0%), and Educational Services (100.0%).
| Industry | Male | Female |
| Agriculture, Fishing & Hunting | 3 (100.0%) | 0 (0.0%) |
| Mining, Quarrying, & Extraction | 0 (0.0%) | 0 (0.0%) |
| Construction | 3 (100.0%) | 0 (0.0%) |
| Manufacturing | 19 (95.0%) | 1 (5.0%) |
| Wholesale Trade | 0 (0.0%) | 0 (0.0%) |
| Retail Trade | 6 (31.6%) | 13 (68.4%) |
| Transportation & Warehousing | 3 (100.0%) | 0 (0.0%) |
| Utilities | 0 (0.0%) | 0 (0.0%) |
| Information | 0 (0.0%) | 3 (100.0%) |
| Finance & Insurance | 0 (0.0%) | 0 (0.0%) |
| Real Estate, Rental & Leasing | 10 (100.0%) | 0 (0.0%) |
| Professional & Scientific | 0 (0.0%) | 6 (100.0%) |
| Enterprise Management | 0 (0.0%) | 0 (0.0%) |
| Administrative & Support | 3 (100.0%) | 0 (0.0%) |
| Educational Services | 0 (0.0%) | 3 (100.0%) |
| Health Care & Social Assistance | 0 (0.0%) | 6 (100.0%) |
| Arts, Entertainment & Recreation | 0 (0.0%) | 0 (0.0%) |
| Accommodation & Food Services | 2 (100.0%) | 0 (0.0%) |
| Public Administration | 0 (0.0%) | 0 (0.0%) |
| Total | 49 (60.5%) | 32 (39.5%) |
Education in Silex
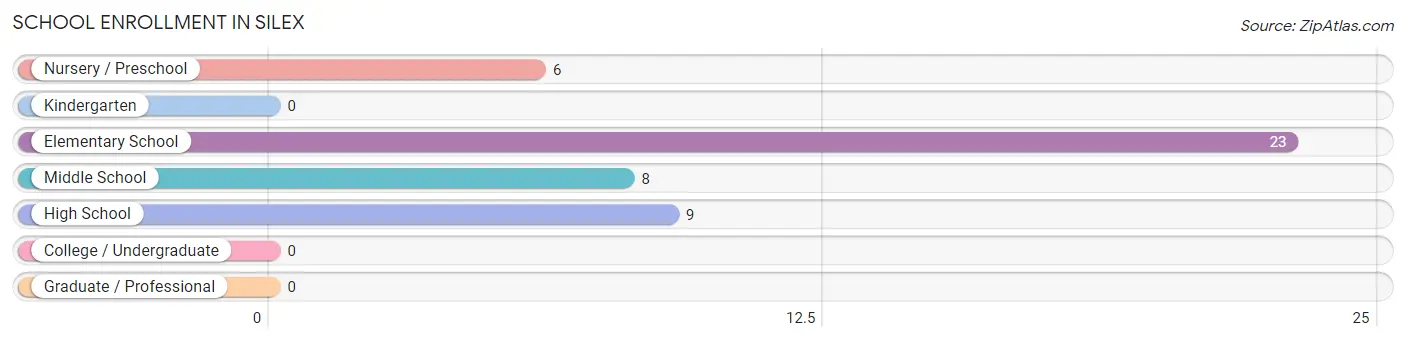
School Enrollment in Silex
The most common levels of schooling among the 46 students in Silex are elementary school (23 | 50.0%), high school (9 | 19.6%), and middle school (8 | 17.4%).
| School Level | # Students | % Students |
| Nursery / Preschool | 6 | 13.0% |
| Kindergarten | 0 | 0.0% |
| Elementary School | 23 | 50.0% |
| Middle School | 8 | 17.4% |
| High School | 9 | 19.6% |
| College / Undergraduate | 0 | 0.0% |
| Graduate / Professional | 0 | 0.0% |
| Total | 46 | 100.0% |
School Enrollment by Age by Funding Source in Silex
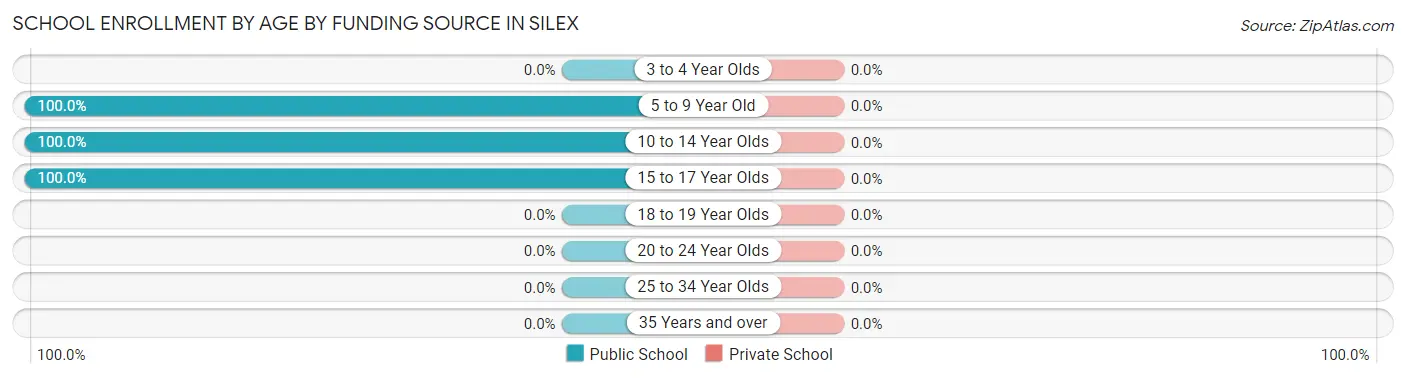
| Age Bracket | Public School | Private School |
| 3 to 4 Year Olds | 0 (0.0%) | 0 (0.0%) |
| 5 to 9 Year Old | 24 (100.0%) | 0 (0.0%) |
| 10 to 14 Year Olds | 13 (100.0%) | 0 (0.0%) |
| 15 to 17 Year Olds | 9 (100.0%) | 0 (0.0%) |
| 18 to 19 Year Olds | 0 (0.0%) | 0 (0.0%) |
| 20 to 24 Year Olds | 0 (0.0%) | 0 (0.0%) |
| 25 to 34 Year Olds | 0 (0.0%) | 0 (0.0%) |
| 35 Years and over | 0 (0.0%) | 0 (0.0%) |
| Total | 46 (100.0%) | 0 (0.0%) |
Educational Attainment by Field of Study in Silex
Computers & mathematics (4 | 25.0%), science & technology (4 | 25.0%), arts & humanities (4 | 25.0%), education (3 | 18.8%), and psychology (1 | 6.2%) are the most common fields of study among 16 individuals in Silex who have obtained a bachelor's degree or higher.
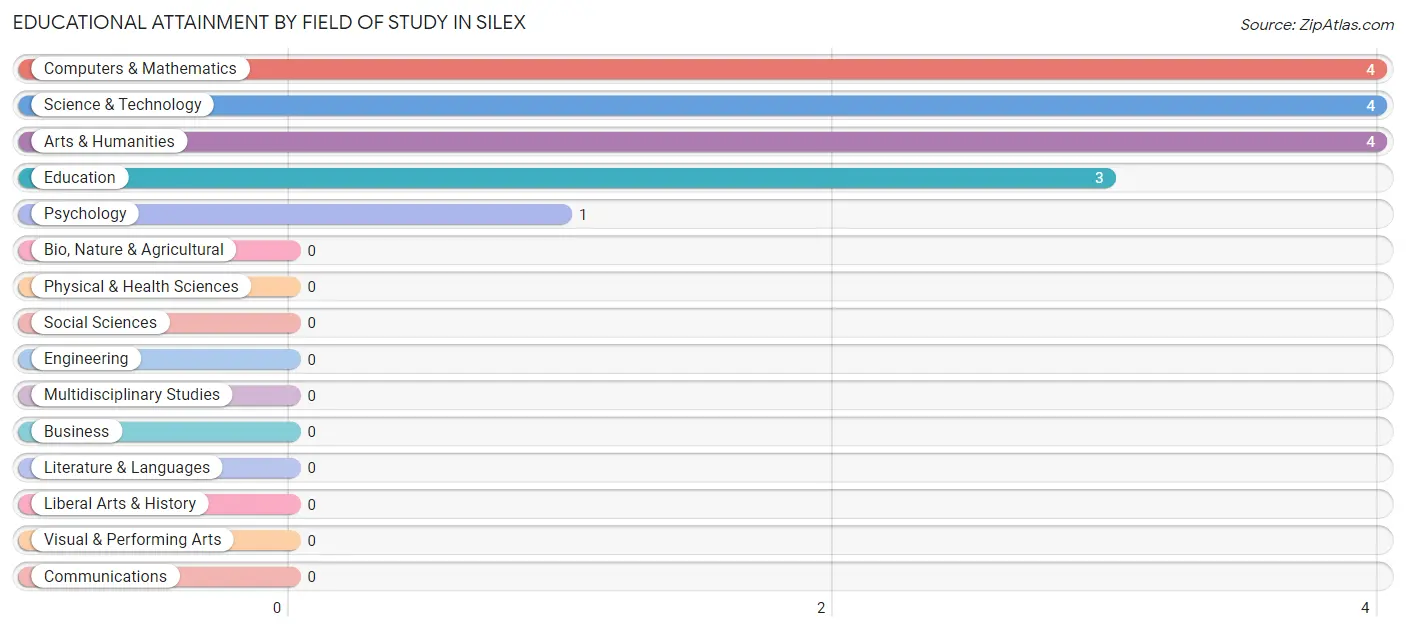
| Field of Study | # Graduates | % Graduates |
| Computers & Mathematics | 4 | 25.0% |
| Bio, Nature & Agricultural | 0 | 0.0% |
| Physical & Health Sciences | 0 | 0.0% |
| Psychology | 1 | 6.2% |
| Social Sciences | 0 | 0.0% |
| Engineering | 0 | 0.0% |
| Multidisciplinary Studies | 0 | 0.0% |
| Science & Technology | 4 | 25.0% |
| Business | 0 | 0.0% |
| Education | 3 | 18.8% |
| Literature & Languages | 0 | 0.0% |
| Liberal Arts & History | 0 | 0.0% |
| Visual & Performing Arts | 0 | 0.0% |
| Communications | 0 | 0.0% |
| Arts & Humanities | 4 | 25.0% |
| Total | 16 | 100.0% |
Transportation & Commute in Silex
Vehicle Availability by Sex in Silex
The most prevalent vehicle ownership categories in Silex are males with 3 vehicles (25, accounting for 51.0%) and females with 3 vehicles (5, making up 78.1%).
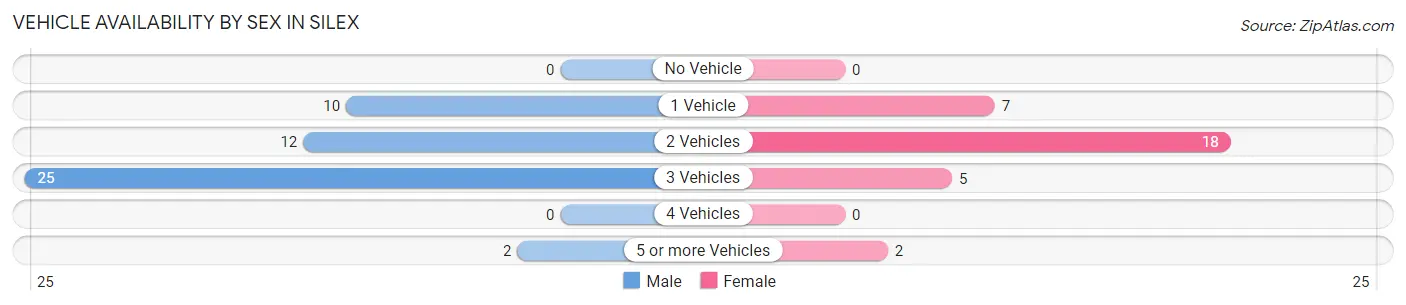
| Vehicles Available | Male | Female |
| No Vehicle | 0 (0.0%) | 0 (0.0%) |
| 1 Vehicle | 10 (20.4%) | 7 (21.9%) |
| 2 Vehicles | 12 (24.5%) | 18 (56.2%) |
| 3 Vehicles | 25 (51.0%) | 5 (15.6%) |
| 4 Vehicles | 0 (0.0%) | 0 (0.0%) |
| 5 or more Vehicles | 2 (4.1%) | 2 (6.2%) |
| Total | 49 (100.0%) | 32 (100.0%) |
Commute Time in Silex
The most frequently occuring commute durations in Silex are 20 to 24 minutes (25 commuters, 30.9%), 15 to 19 minutes (13 commuters, 16.1%), and 45 to 59 minutes (11 commuters, 13.6%).
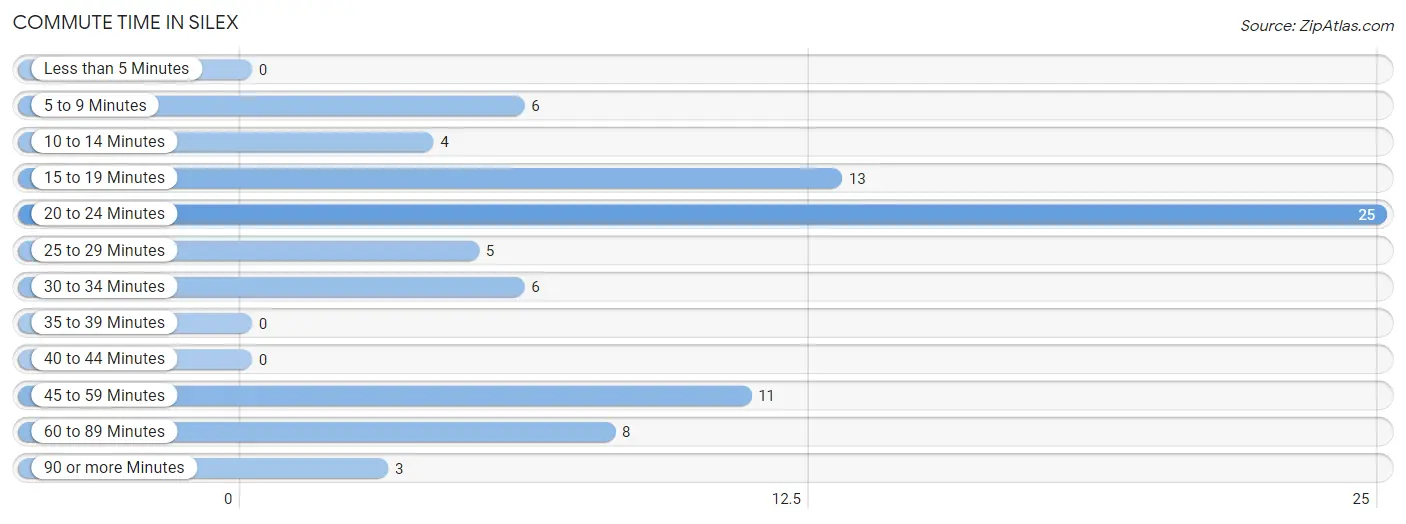
| Commute Time | # Commuters | % Commuters |
| Less than 5 Minutes | 0 | 0.0% |
| 5 to 9 Minutes | 6 | 7.4% |
| 10 to 14 Minutes | 4 | 4.9% |
| 15 to 19 Minutes | 13 | 16.1% |
| 20 to 24 Minutes | 25 | 30.9% |
| 25 to 29 Minutes | 5 | 6.2% |
| 30 to 34 Minutes | 6 | 7.4% |
| 35 to 39 Minutes | 0 | 0.0% |
| 40 to 44 Minutes | 0 | 0.0% |
| 45 to 59 Minutes | 11 | 13.6% |
| 60 to 89 Minutes | 8 | 9.9% |
| 90 or more Minutes | 3 | 3.7% |
Commute Time by Sex in Silex
The most common commute times in Silex are 20 to 24 minutes (13 commuters, 26.5%) for males and 20 to 24 minutes (12 commuters, 37.5%) for females.
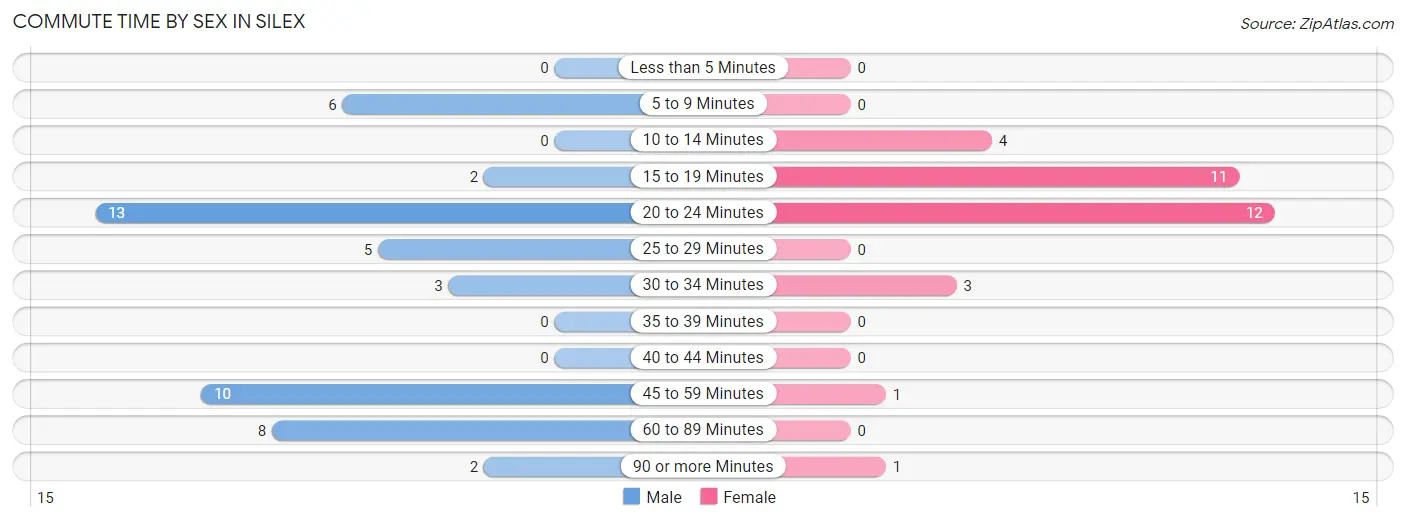
| Commute Time | Male | Female |
| Less than 5 Minutes | 0 (0.0%) | 0 (0.0%) |
| 5 to 9 Minutes | 6 (12.2%) | 0 (0.0%) |
| 10 to 14 Minutes | 0 (0.0%) | 4 (12.5%) |
| 15 to 19 Minutes | 2 (4.1%) | 11 (34.4%) |
| 20 to 24 Minutes | 13 (26.5%) | 12 (37.5%) |
| 25 to 29 Minutes | 5 (10.2%) | 0 (0.0%) |
| 30 to 34 Minutes | 3 (6.1%) | 3 (9.4%) |
| 35 to 39 Minutes | 0 (0.0%) | 0 (0.0%) |
| 40 to 44 Minutes | 0 (0.0%) | 0 (0.0%) |
| 45 to 59 Minutes | 10 (20.4%) | 1 (3.1%) |
| 60 to 89 Minutes | 8 (16.3%) | 0 (0.0%) |
| 90 or more Minutes | 2 (4.1%) | 1 (3.1%) |
Time of Departure to Work by Sex in Silex
The most frequent times of departure to work in Silex are 7:30 AM to 7:59 AM (19, 38.8%) for males and 7:30 AM to 7:59 AM (19, 59.4%) for females.
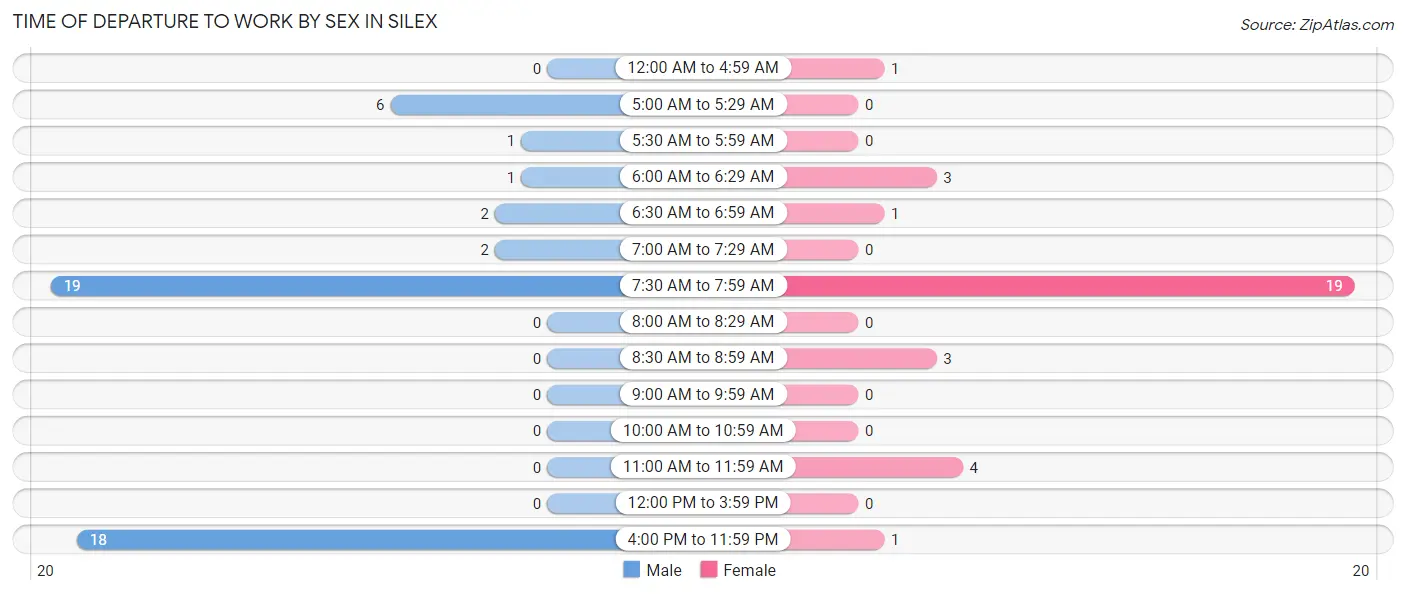
| Time of Departure | Male | Female |
| 12:00 AM to 4:59 AM | 0 (0.0%) | 1 (3.1%) |
| 5:00 AM to 5:29 AM | 6 (12.2%) | 0 (0.0%) |
| 5:30 AM to 5:59 AM | 1 (2.0%) | 0 (0.0%) |
| 6:00 AM to 6:29 AM | 1 (2.0%) | 3 (9.4%) |
| 6:30 AM to 6:59 AM | 2 (4.1%) | 1 (3.1%) |
| 7:00 AM to 7:29 AM | 2 (4.1%) | 0 (0.0%) |
| 7:30 AM to 7:59 AM | 19 (38.8%) | 19 (59.4%) |
| 8:00 AM to 8:29 AM | 0 (0.0%) | 0 (0.0%) |
| 8:30 AM to 8:59 AM | 0 (0.0%) | 3 (9.4%) |
| 9:00 AM to 9:59 AM | 0 (0.0%) | 0 (0.0%) |
| 10:00 AM to 10:59 AM | 0 (0.0%) | 0 (0.0%) |
| 11:00 AM to 11:59 AM | 0 (0.0%) | 4 (12.5%) |
| 12:00 PM to 3:59 PM | 0 (0.0%) | 0 (0.0%) |
| 4:00 PM to 11:59 PM | 18 (36.7%) | 1 (3.1%) |
| Total | 49 (100.0%) | 32 (100.0%) |
Housing Occupancy in Silex
Occupancy by Ownership in Silex
Of the total 87 dwellings in Silex, owner-occupied units account for 66 (75.9%), while renter-occupied units make up 21 (24.1%).
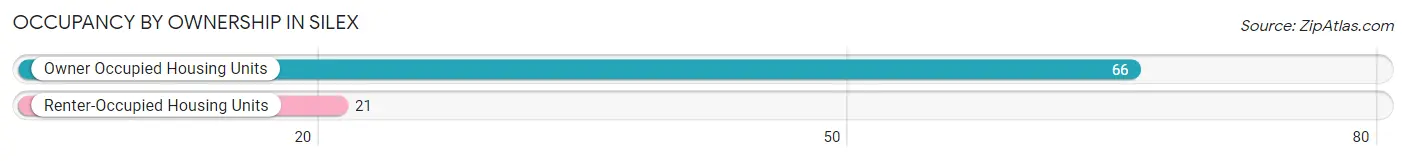
| Occupancy | # Housing Units | % Housing Units |
| Owner Occupied Housing Units | 66 | 75.9% |
| Renter-Occupied Housing Units | 21 | 24.1% |
| Total Occupied Housing Units | 87 | 100.0% |
Occupancy by Household Size in Silex
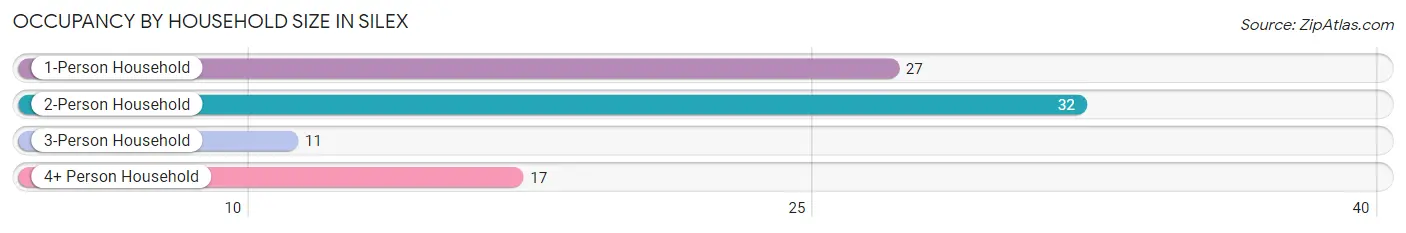
| Household Size | # Housing Units | % Housing Units |
| 1-Person Household | 27 | 31.0% |
| 2-Person Household | 32 | 36.8% |
| 3-Person Household | 11 | 12.6% |
| 4+ Person Household | 17 | 19.5% |
| Total Housing Units | 87 | 100.0% |
Occupancy by Ownership by Household Size in Silex
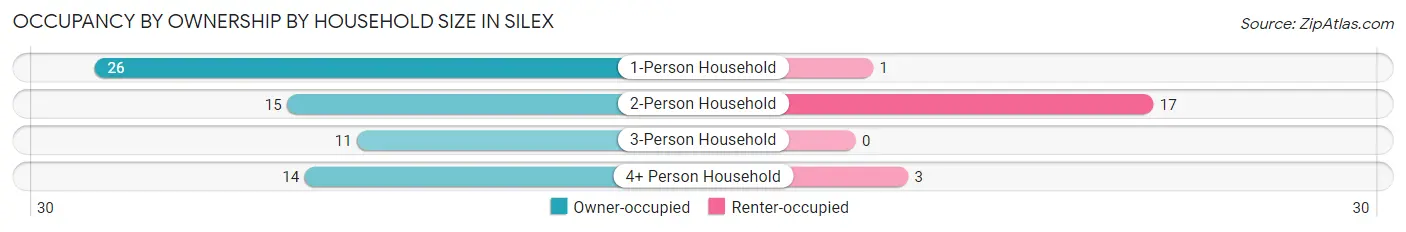
| Household Size | Owner-occupied | Renter-occupied |
| 1-Person Household | 26 (96.3%) | 1 (3.7%) |
| 2-Person Household | 15 (46.9%) | 17 (53.1%) |
| 3-Person Household | 11 (100.0%) | 0 (0.0%) |
| 4+ Person Household | 14 (82.4%) | 3 (17.6%) |
| Total Housing Units | 66 (75.9%) | 21 (24.1%) |
Occupancy by Educational Attainment in Silex
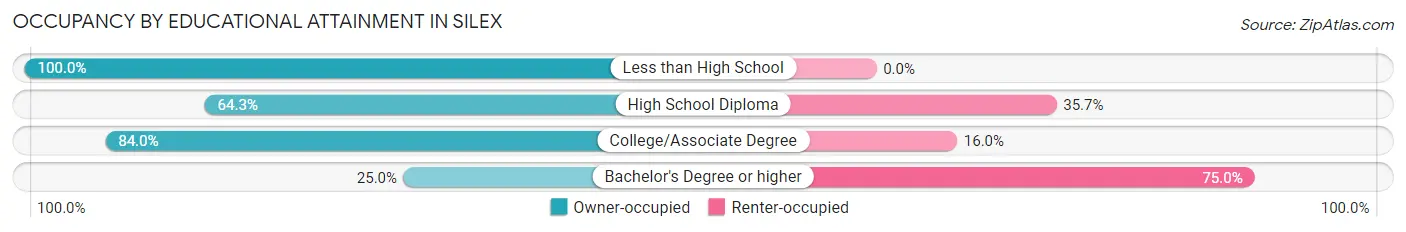
| Household Size | Owner-occupied | Renter-occupied |
| Less than High School | 5 (100.0%) | 0 (0.0%) |
| High School Diploma | 18 (64.3%) | 10 (35.7%) |
| College/Associate Degree | 42 (84.0%) | 8 (16.0%) |
| Bachelor's Degree or higher | 1 (25.0%) | 3 (75.0%) |
Occupancy by Age of Householder in Silex
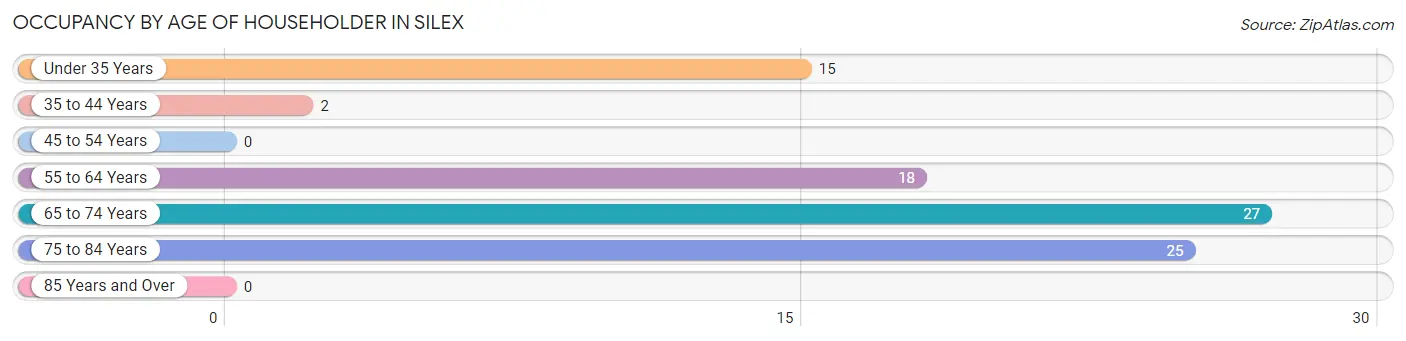
| Age Bracket | # Households | % Households |
| Under 35 Years | 15 | 17.2% |
| 35 to 44 Years | 2 | 2.3% |
| 45 to 54 Years | 0 | 0.0% |
| 55 to 64 Years | 18 | 20.7% |
| 65 to 74 Years | 27 | 31.0% |
| 75 to 84 Years | 25 | 28.7% |
| 85 Years and Over | 0 | 0.0% |
| Total | 87 | 100.0% |
Housing Finances in Silex
Median Income by Occupancy in Silex
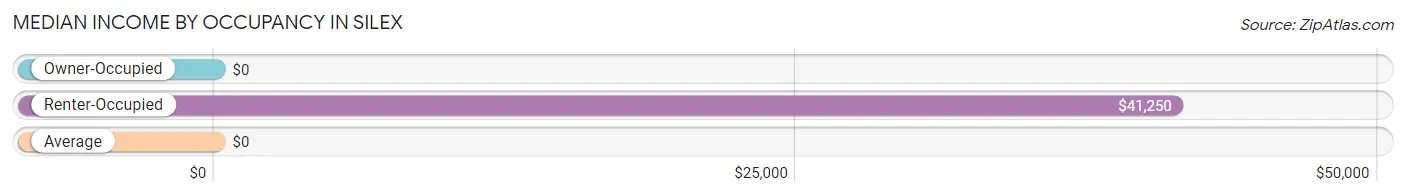
| Occupancy Type | # Households | Median Income |
| Owner-Occupied | 66 (75.9%) | $0 |
| Renter-Occupied | 21 (24.1%) | $41,250 |
| Average | 87 (100.0%) | $0 |
Occupancy by Householder Income Bracket in Silex
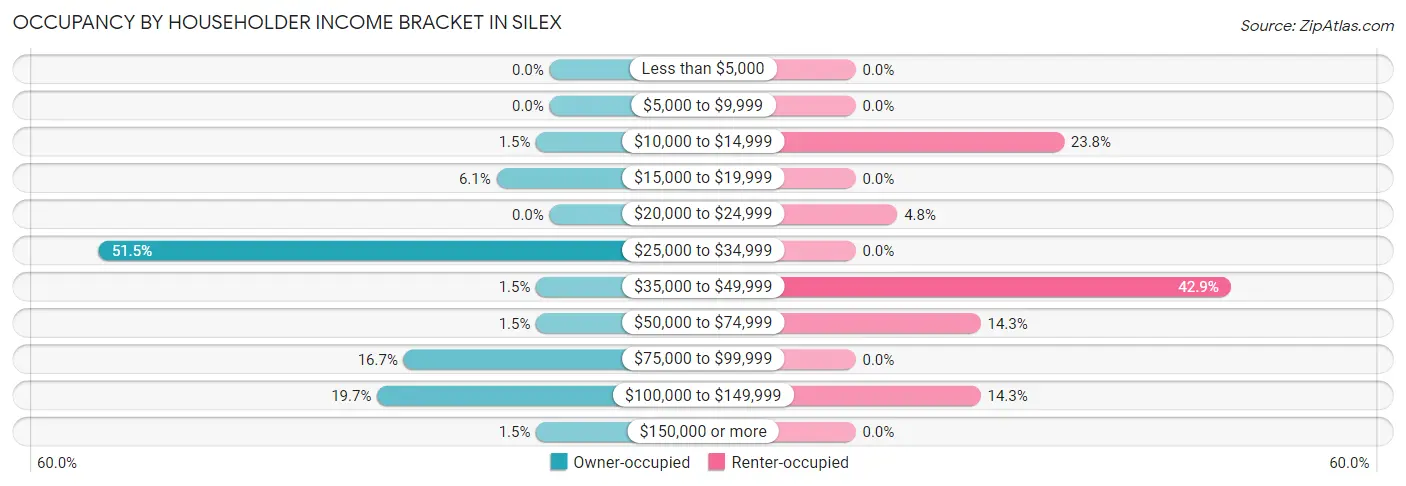
| Income Bracket | Owner-occupied | Renter-occupied |
| Less than $5,000 | 0 (0.0%) | 0 (0.0%) |
| $5,000 to $9,999 | 0 (0.0%) | 0 (0.0%) |
| $10,000 to $14,999 | 1 (1.5%) | 5 (23.8%) |
| $15,000 to $19,999 | 4 (6.1%) | 0 (0.0%) |
| $20,000 to $24,999 | 0 (0.0%) | 1 (4.8%) |
| $25,000 to $34,999 | 34 (51.5%) | 0 (0.0%) |
| $35,000 to $49,999 | 1 (1.5%) | 9 (42.9%) |
| $50,000 to $74,999 | 1 (1.5%) | 3 (14.3%) |
| $75,000 to $99,999 | 11 (16.7%) | 0 (0.0%) |
| $100,000 to $149,999 | 13 (19.7%) | 3 (14.3%) |
| $150,000 or more | 1 (1.5%) | 0 (0.0%) |
| Total | 66 (100.0%) | 21 (100.0%) |
Monthly Housing Cost Tiers in Silex
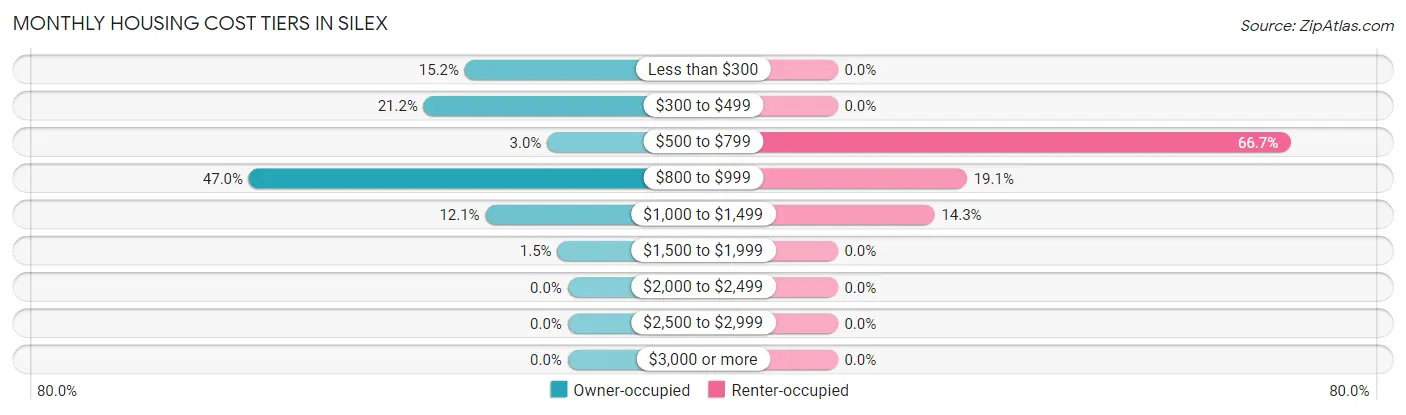
| Monthly Cost | Owner-occupied | Renter-occupied |
| Less than $300 | 10 (15.1%) | 0 (0.0%) |
| $300 to $499 | 14 (21.2%) | 0 (0.0%) |
| $500 to $799 | 2 (3.0%) | 14 (66.7%) |
| $800 to $999 | 31 (47.0%) | 4 (19.1%) |
| $1,000 to $1,499 | 8 (12.1%) | 3 (14.3%) |
| $1,500 to $1,999 | 1 (1.5%) | 0 (0.0%) |
| $2,000 to $2,499 | 0 (0.0%) | 0 (0.0%) |
| $2,500 to $2,999 | 0 (0.0%) | 0 (0.0%) |
| $3,000 or more | 0 (0.0%) | 0 (0.0%) |
| Total | 66 (100.0%) | 21 (100.0%) |
Physical Housing Characteristics in Silex
Housing Structures in Silex
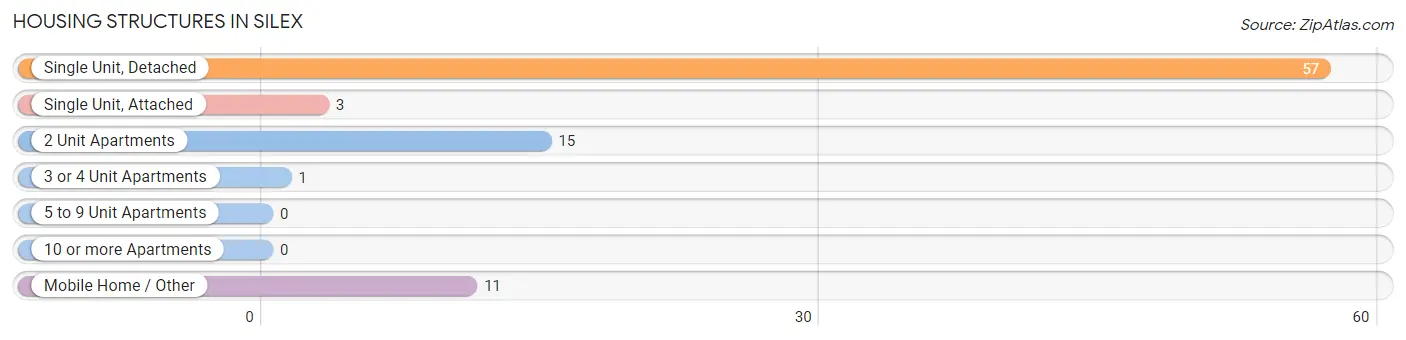
| Structure Type | # Housing Units | % Housing Units |
| Single Unit, Detached | 57 | 65.5% |
| Single Unit, Attached | 3 | 3.5% |
| 2 Unit Apartments | 15 | 17.2% |
| 3 or 4 Unit Apartments | 1 | 1.1% |
| 5 to 9 Unit Apartments | 0 | 0.0% |
| 10 or more Apartments | 0 | 0.0% |
| Mobile Home / Other | 11 | 12.6% |
| Total | 87 | 100.0% |
Housing Structures by Occupancy in Silex
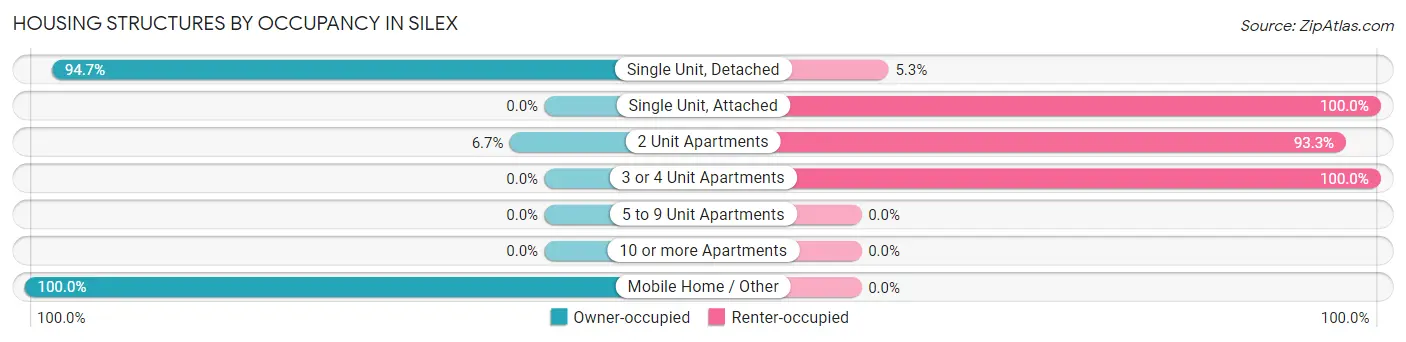
| Structure Type | Owner-occupied | Renter-occupied |
| Single Unit, Detached | 54 (94.7%) | 3 (5.3%) |
| Single Unit, Attached | 0 (0.0%) | 3 (100.0%) |
| 2 Unit Apartments | 1 (6.7%) | 14 (93.3%) |
| 3 or 4 Unit Apartments | 0 (0.0%) | 1 (100.0%) |
| 5 to 9 Unit Apartments | 0 (0.0%) | 0 (0.0%) |
| 10 or more Apartments | 0 (0.0%) | 0 (0.0%) |
| Mobile Home / Other | 11 (100.0%) | 0 (0.0%) |
| Total | 66 (75.9%) | 21 (24.1%) |
Housing Structures by Number of Rooms in Silex
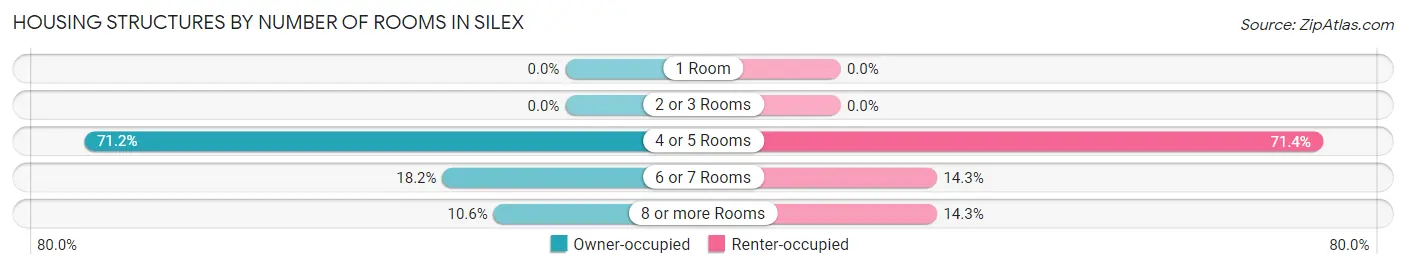
| Number of Rooms | Owner-occupied | Renter-occupied |
| 1 Room | 0 (0.0%) | 0 (0.0%) |
| 2 or 3 Rooms | 0 (0.0%) | 0 (0.0%) |
| 4 or 5 Rooms | 47 (71.2%) | 15 (71.4%) |
| 6 or 7 Rooms | 12 (18.2%) | 3 (14.3%) |
| 8 or more Rooms | 7 (10.6%) | 3 (14.3%) |
| Total | 66 (100.0%) | 21 (100.0%) |
Housing Structure by Heating Type in Silex
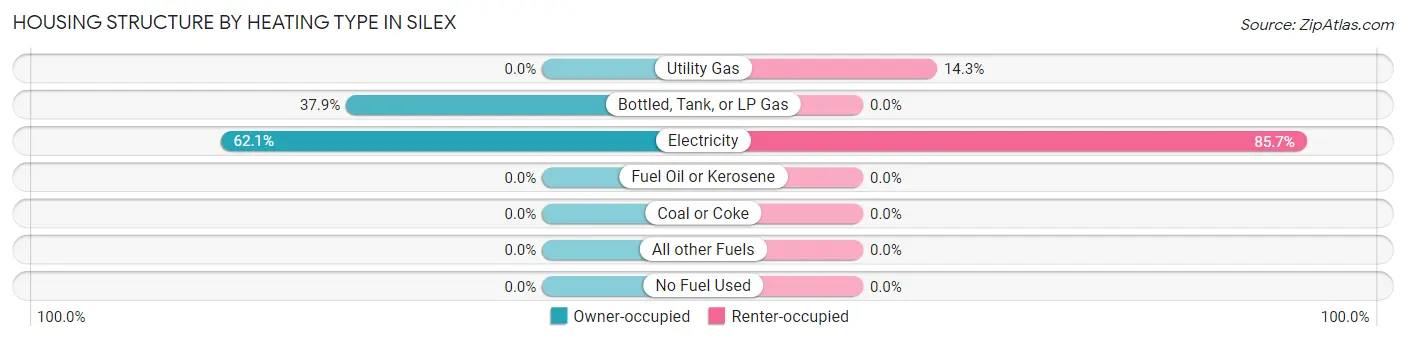
| Heating Type | Owner-occupied | Renter-occupied |
| Utility Gas | 0 (0.0%) | 3 (14.3%) |
| Bottled, Tank, or LP Gas | 25 (37.9%) | 0 (0.0%) |
| Electricity | 41 (62.1%) | 18 (85.7%) |
| Fuel Oil or Kerosene | 0 (0.0%) | 0 (0.0%) |
| Coal or Coke | 0 (0.0%) | 0 (0.0%) |
| All other Fuels | 0 (0.0%) | 0 (0.0%) |
| No Fuel Used | 0 (0.0%) | 0 (0.0%) |
| Total | 66 (100.0%) | 21 (100.0%) |
Household Vehicle Usage in Silex
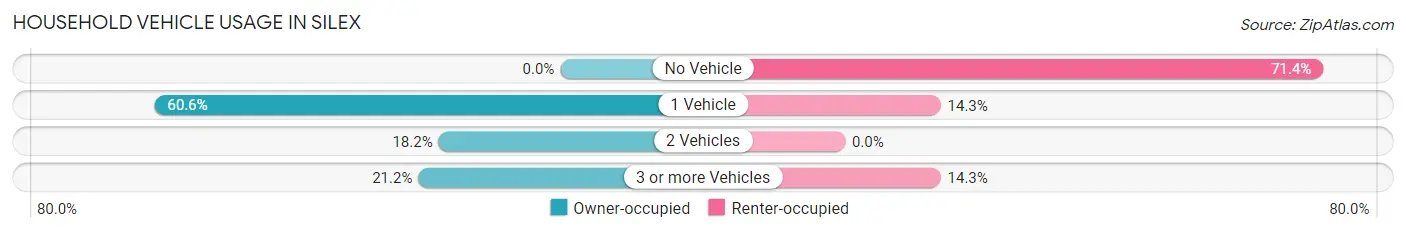
| Vehicles per Household | Owner-occupied | Renter-occupied |
| No Vehicle | 0 (0.0%) | 15 (71.4%) |
| 1 Vehicle | 40 (60.6%) | 3 (14.3%) |
| 2 Vehicles | 12 (18.2%) | 0 (0.0%) |
| 3 or more Vehicles | 14 (21.2%) | 3 (14.3%) |
| Total | 66 (100.0%) | 21 (100.0%) |
Real Estate & Mortgages in Silex
Real Estate and Mortgage Overview in Silex
| Characteristic | Without Mortgage | With Mortgage |
| Housing Units | 24 | 42 |
| Median Property Value | $88,600 | $160,900 |
| Median Household Income | - | - |
| Monthly Housing Costs | $320 | $0 |
| Real Estate Taxes | $771 | $1 |
Property Value by Mortgage Status in Silex
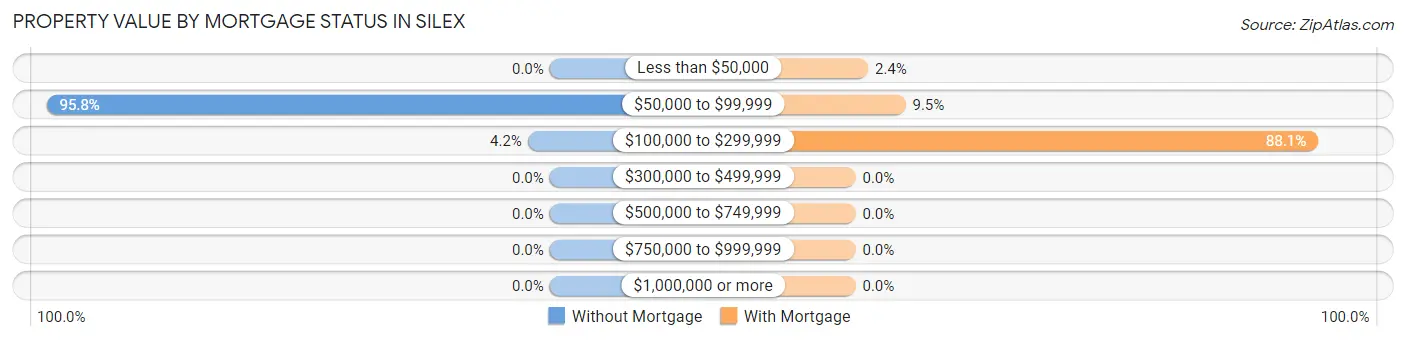
| Property Value | Without Mortgage | With Mortgage |
| Less than $50,000 | 0 (0.0%) | 1 (2.4%) |
| $50,000 to $99,999 | 23 (95.8%) | 4 (9.5%) |
| $100,000 to $299,999 | 1 (4.2%) | 37 (88.1%) |
| $300,000 to $499,999 | 0 (0.0%) | 0 (0.0%) |
| $500,000 to $749,999 | 0 (0.0%) | 0 (0.0%) |
| $750,000 to $999,999 | 0 (0.0%) | 0 (0.0%) |
| $1,000,000 or more | 0 (0.0%) | 0 (0.0%) |
| Total | 24 (100.0%) | 42 (100.0%) |
Household Income by Mortgage Status in Silex
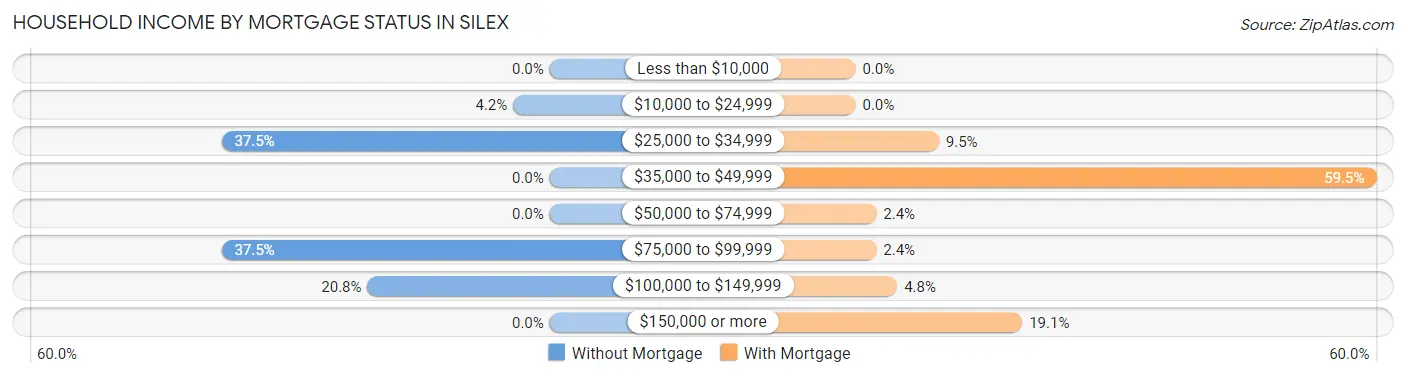
| Household Income | Without Mortgage | With Mortgage |
| Less than $10,000 | 0 (0.0%) | 0 (0.0%) |
| $10,000 to $24,999 | 1 (4.2%) | 0 (0.0%) |
| $25,000 to $34,999 | 9 (37.5%) | 4 (9.5%) |
| $35,000 to $49,999 | 0 (0.0%) | 25 (59.5%) |
| $50,000 to $74,999 | 0 (0.0%) | 1 (2.4%) |
| $75,000 to $99,999 | 9 (37.5%) | 1 (2.4%) |
| $100,000 to $149,999 | 5 (20.8%) | 2 (4.8%) |
| $150,000 or more | 0 (0.0%) | 8 (19.1%) |
| Total | 24 (100.0%) | 42 (100.0%) |
Property Value to Household Income Ratio in Silex
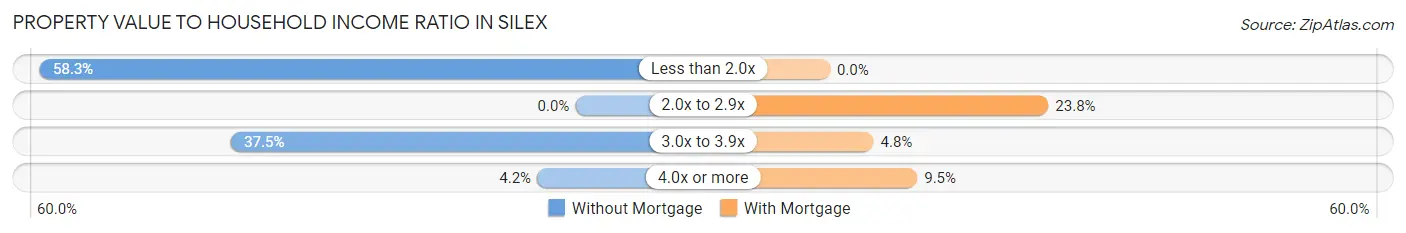
| Value-to-Income Ratio | Without Mortgage | With Mortgage |
| Less than 2.0x | 14 (58.3%) | 0 (0.0%) |
| 2.0x to 2.9x | 0 (0.0%) | 10 (23.8%) |
| 3.0x to 3.9x | 9 (37.5%) | 2 (4.8%) |
| 4.0x or more | 1 (4.2%) | 4 (9.5%) |
| Total | 24 (100.0%) | 42 (100.0%) |
Real Estate Taxes by Mortgage Status in Silex
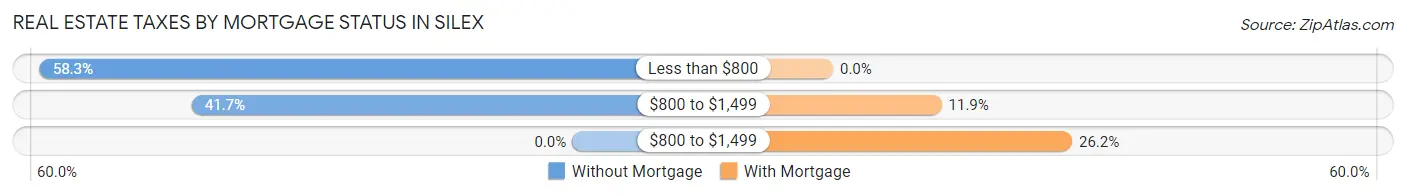
| Property Taxes | Without Mortgage | With Mortgage |
| Less than $800 | 14 (58.3%) | 0 (0.0%) |
| $800 to $1,499 | 10 (41.7%) | 5 (11.9%) |
| $800 to $1,499 | 0 (0.0%) | 11 (26.2%) |
| Total | 24 (100.0%) | 42 (100.0%) |
Health & Disability in Silex
Health Insurance Coverage by Age in Silex
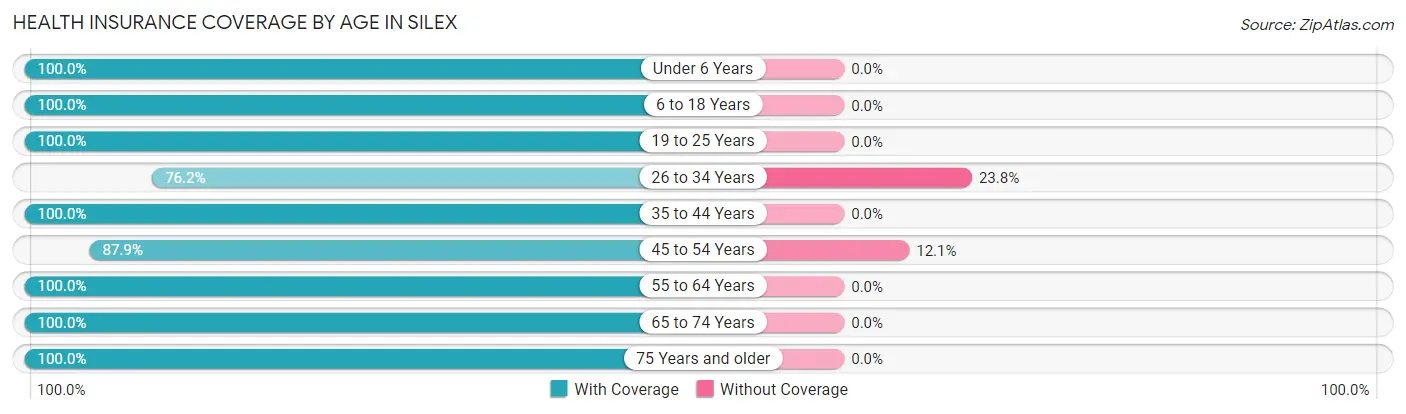
| Age Bracket | With Coverage | Without Coverage |
| Under 6 Years | 8 (100.0%) | 0 (0.0%) |
| 6 to 18 Years | 45 (100.0%) | 0 (0.0%) |
| 19 to 25 Years | 35 (100.0%) | 0 (0.0%) |
| 26 to 34 Years | 16 (76.2%) | 5 (23.8%) |
| 35 to 44 Years | 13 (100.0%) | 0 (0.0%) |
| 45 to 54 Years | 29 (87.9%) | 4 (12.1%) |
| 55 to 64 Years | 34 (100.0%) | 0 (0.0%) |
| 65 to 74 Years | 38 (100.0%) | 0 (0.0%) |
| 75 Years and older | 32 (100.0%) | 0 (0.0%) |
| Total | 250 (96.5%) | 9 (3.5%) |
Health Insurance Coverage by Citizenship Status in Silex
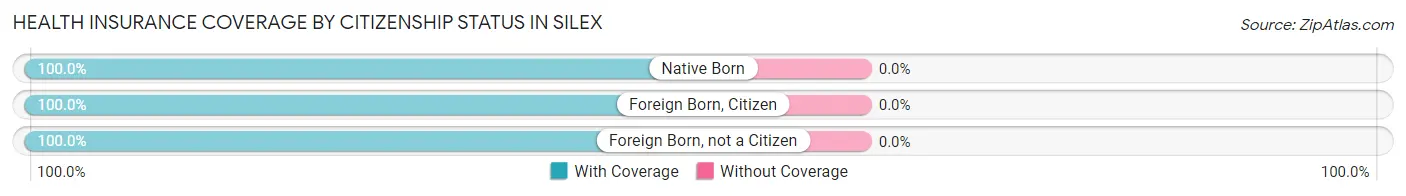
| Citizenship Status | With Coverage | Without Coverage |
| Native Born | 8 (100.0%) | 0 (0.0%) |
| Foreign Born, Citizen | 45 (100.0%) | 0 (0.0%) |
| Foreign Born, not a Citizen | 35 (100.0%) | 0 (0.0%) |
Health Insurance Coverage by Household Income in Silex
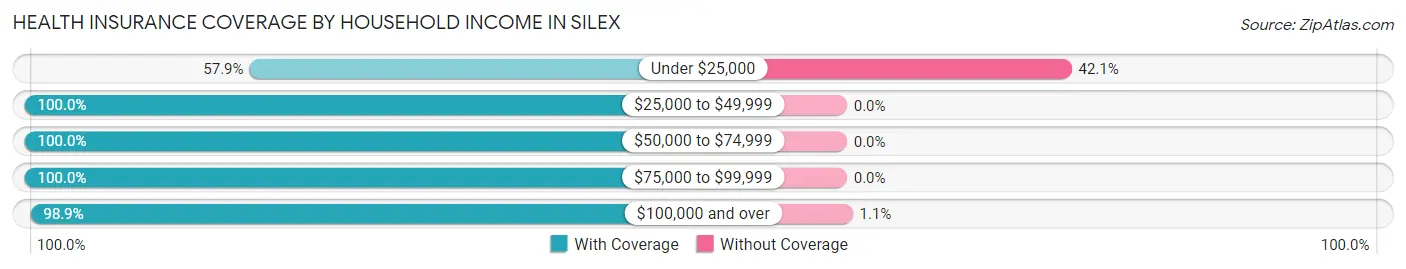
| Household Income | With Coverage | Without Coverage |
| Under $25,000 | 11 (57.9%) | 8 (42.1%) |
| $25,000 to $49,999 | 72 (100.0%) | 0 (0.0%) |
| $50,000 to $74,999 | 6 (100.0%) | 0 (0.0%) |
| $75,000 to $99,999 | 32 (100.0%) | 0 (0.0%) |
| $100,000 and over | 91 (98.9%) | 1 (1.1%) |
Public vs Private Health Insurance Coverage by Age in Silex
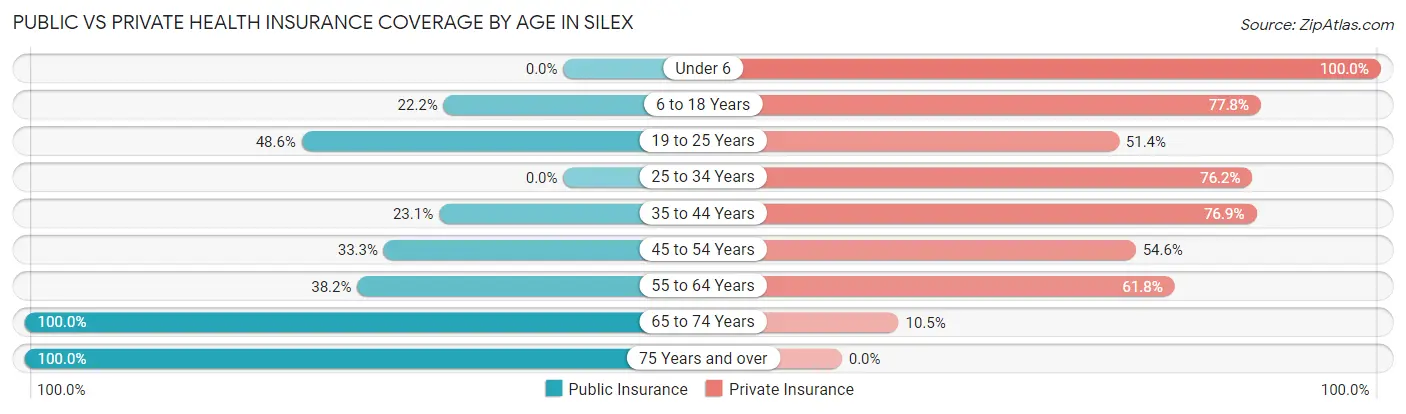
| Age Bracket | Public Insurance | Private Insurance |
| Under 6 | 0 (0.0%) | 8 (100.0%) |
| 6 to 18 Years | 10 (22.2%) | 35 (77.8%) |
| 19 to 25 Years | 17 (48.6%) | 18 (51.4%) |
| 25 to 34 Years | 0 (0.0%) | 16 (76.2%) |
| 35 to 44 Years | 3 (23.1%) | 10 (76.9%) |
| 45 to 54 Years | 11 (33.3%) | 18 (54.5%) |
| 55 to 64 Years | 13 (38.2%) | 21 (61.8%) |
| 65 to 74 Years | 38 (100.0%) | 4 (10.5%) |
| 75 Years and over | 32 (100.0%) | 0 (0.0%) |
| Total | 124 (47.9%) | 130 (50.2%) |
Disability Status by Sex by Age in Silex
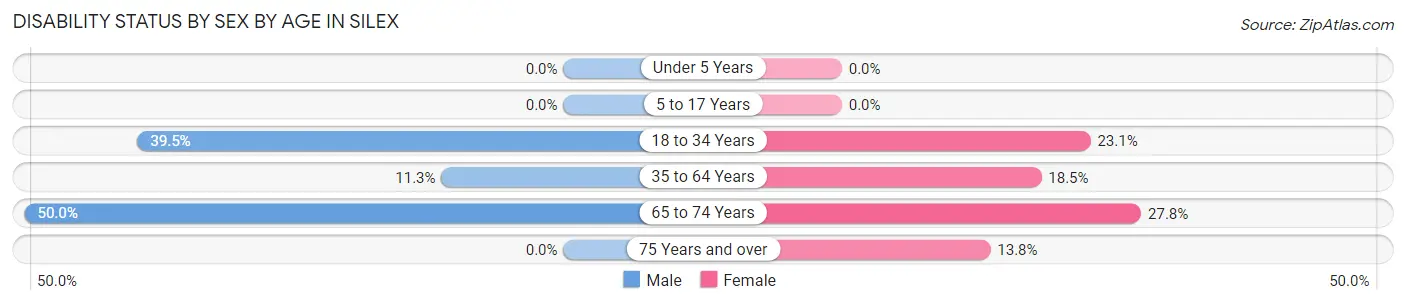
| Age Bracket | Male | Female |
| Under 5 Years | 0 (0.0%) | 0 (0.0%) |
| 5 to 17 Years | 0 (0.0%) | 0 (0.0%) |
| 18 to 34 Years | 17 (39.5%) | 3 (23.1%) |
| 35 to 64 Years | 6 (11.3%) | 5 (18.5%) |
| 65 to 74 Years | 1 (50.0%) | 10 (27.8%) |
| 75 Years and over | 0 (0.0%) | 4 (13.8%) |
Disability Class by Sex by Age in Silex
Disability Class: Hearing Difficulty
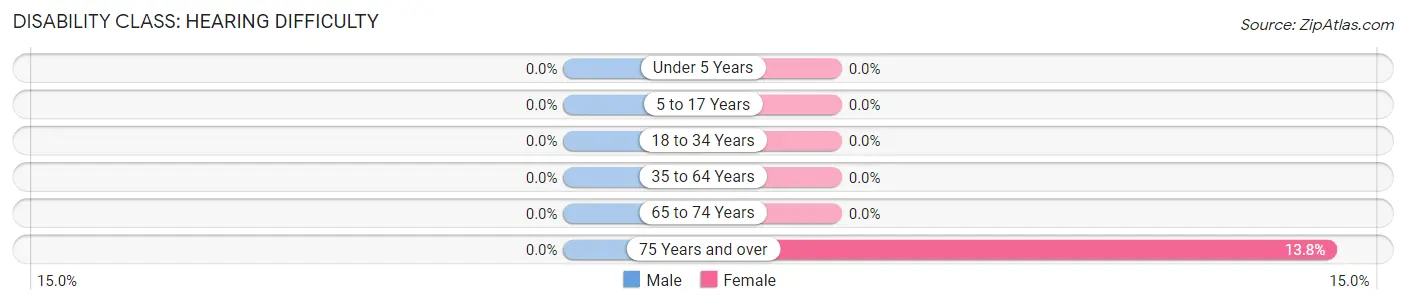
| Age Bracket | Male | Female |
| Under 5 Years | 0 (0.0%) | 0 (0.0%) |
| 5 to 17 Years | 0 (0.0%) | 0 (0.0%) |
| 18 to 34 Years | 0 (0.0%) | 0 (0.0%) |
| 35 to 64 Years | 0 (0.0%) | 0 (0.0%) |
| 65 to 74 Years | 0 (0.0%) | 0 (0.0%) |
| 75 Years and over | 0 (0.0%) | 4 (13.8%) |
Disability Class: Vision Difficulty
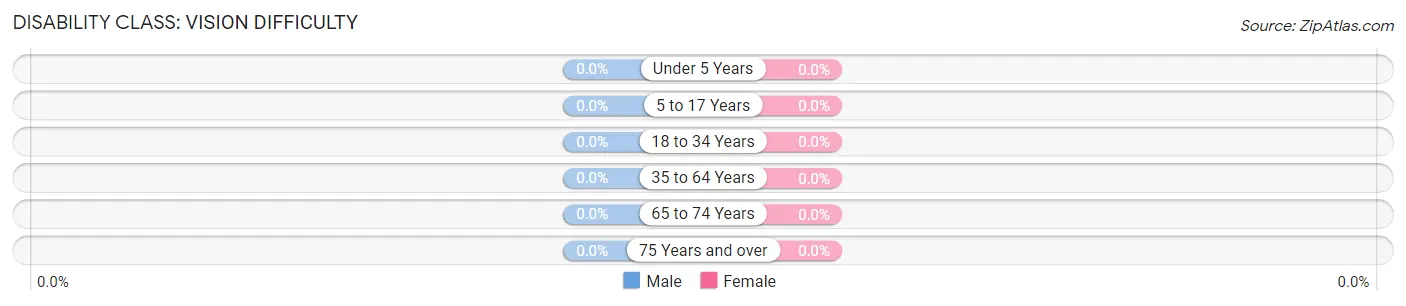
| Age Bracket | Male | Female |
| Under 5 Years | 0 (0.0%) | 0 (0.0%) |
| 5 to 17 Years | 0 (0.0%) | 0 (0.0%) |
| 18 to 34 Years | 0 (0.0%) | 0 (0.0%) |
| 35 to 64 Years | 0 (0.0%) | 0 (0.0%) |
| 65 to 74 Years | 0 (0.0%) | 0 (0.0%) |
| 75 Years and over | 0 (0.0%) | 0 (0.0%) |
Disability Class: Cognitive Difficulty
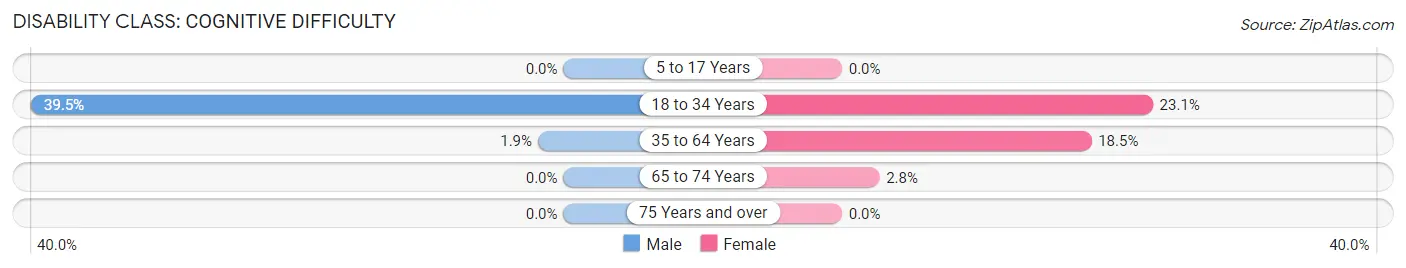
| Age Bracket | Male | Female |
| 5 to 17 Years | 0 (0.0%) | 0 (0.0%) |
| 18 to 34 Years | 17 (39.5%) | 3 (23.1%) |
| 35 to 64 Years | 1 (1.9%) | 5 (18.5%) |
| 65 to 74 Years | 0 (0.0%) | 1 (2.8%) |
| 75 Years and over | 0 (0.0%) | 0 (0.0%) |
Disability Class: Ambulatory Difficulty
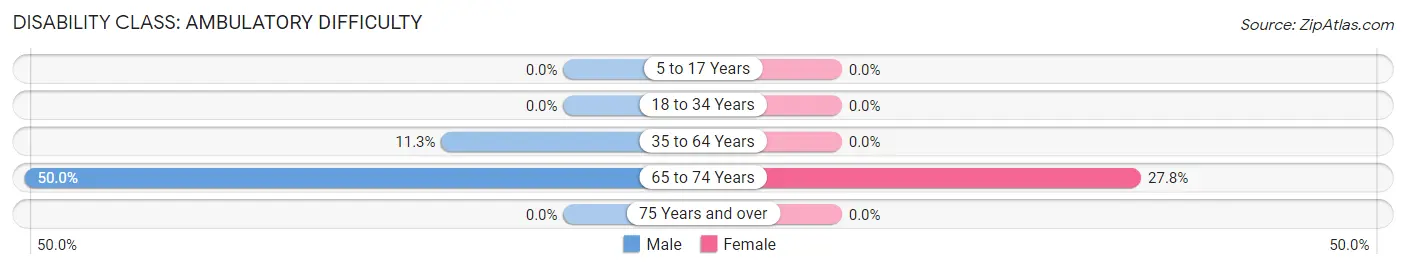
| Age Bracket | Male | Female |
| 5 to 17 Years | 0 (0.0%) | 0 (0.0%) |
| 18 to 34 Years | 0 (0.0%) | 0 (0.0%) |
| 35 to 64 Years | 6 (11.3%) | 0 (0.0%) |
| 65 to 74 Years | 1 (50.0%) | 10 (27.8%) |
| 75 Years and over | 0 (0.0%) | 0 (0.0%) |
Disability Class: Self-Care Difficulty
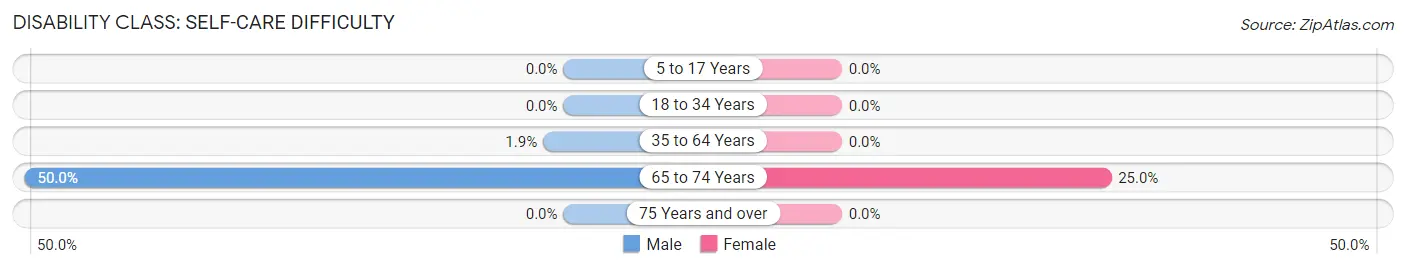
| Age Bracket | Male | Female |
| 5 to 17 Years | 0 (0.0%) | 0 (0.0%) |
| 18 to 34 Years | 0 (0.0%) | 0 (0.0%) |
| 35 to 64 Years | 1 (1.9%) | 0 (0.0%) |
| 65 to 74 Years | 1 (50.0%) | 9 (25.0%) |
| 75 Years and over | 0 (0.0%) | 0 (0.0%) |
Technology Access in Silex
Computing Device Access in Silex
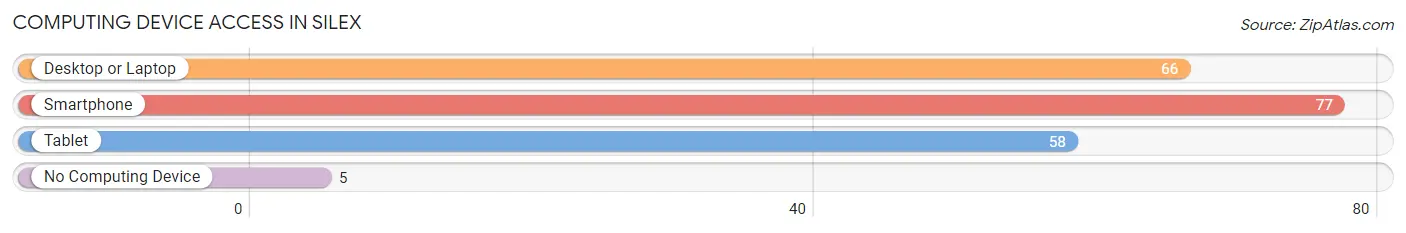
| Device Type | # Households | % Households |
| Desktop or Laptop | 66 | 75.9% |
| Smartphone | 77 | 88.5% |
| Tablet | 58 | 66.7% |
| No Computing Device | 5 | 5.8% |
| Total | 87 | 100.0% |
Internet Access in Silex
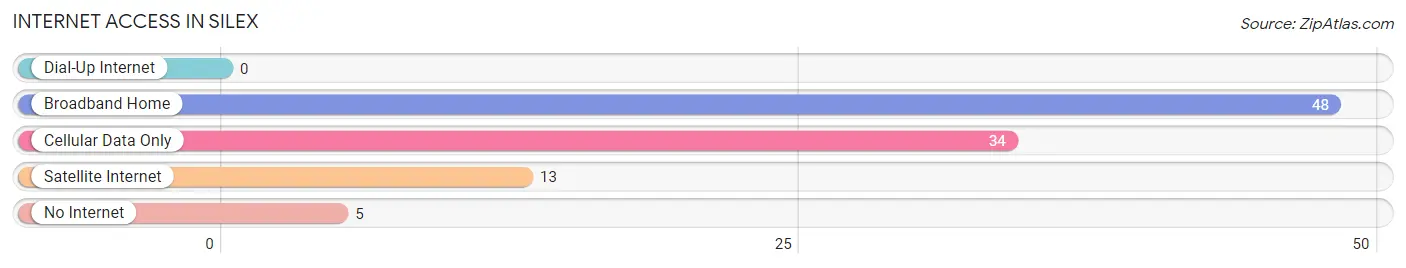
| Internet Type | # Households | % Households |
| Dial-Up Internet | 0 | 0.0% |
| Broadband Home | 48 | 55.2% |
| Cellular Data Only | 34 | 39.1% |
| Satellite Internet | 13 | 14.9% |
| No Internet | 5 | 5.8% |
| Total | 87 | 100.0% |
Silex Summary
Silex is a small town located in Lincoln County, Missouri, United States. The population was estimated to be around 545 in the year 2000. The town is situated on the banks of the Cuivre River, and is located about 25 miles northwest of St. Louis.
History
Silex was founded in 1819 by a group of settlers from Kentucky. The town was named after the nearby Silex Creek, which was named after the Latin word for flint. The town was originally a trading post for the local Native American tribes, and was also a stop on the Underground Railroad.
In the late 1800s, Silex was a thriving agricultural community. The town was home to several mills, a blacksmith shop, a general store, and a post office. The town also had a school, a church, and a hotel.
In the early 1900s, Silex began to decline as the railroad bypassed the town. The population decreased, and many of the businesses closed. In the 1950s, the town was revitalized when the Cuivre River was dammed to create a lake. The lake became a popular recreational area, and the town began to grow again.
Geography
Silex is located in the Ozark Plateau region of Missouri. The town is situated on the banks of the Cuivre River, and is surrounded by rolling hills and forests. The climate is humid and subtropical, with hot summers and mild winters.
The town is located about 25 miles northwest of St. Louis, and is accessible by Highway 61. The nearest major airport is Lambert-St. Louis International Airport, which is about 40 miles away.
Economy
The economy of Silex is largely based on agriculture and tourism. The town is home to several farms, which produce corn, soybeans, wheat, and hay. The town is also home to several wineries, which produce a variety of wines.
Tourism is an important part of the local economy. The town is home to several parks, including Cuivre River State Park, which offers camping, fishing, and boating. The town is also home to several historic sites, including the Silex Historic District.
Demographics
As of the 2000 census, the population of Silex was 545. The racial makeup of the town was 97.3% White, 0.2% African American, 0.2% Native American, 0.2% Asian, 0.4% from other races, and 1.7% from two or more races. Hispanic or Latino of any race were 1.3% of the population.
The median income for a household in the town was $37,500, and the median income for a family was $41,250. The per capita income for the town was $17,845. About 8.3% of families and 10.2% of the population were below the poverty line, including 13.2% of those under age 18 and 8.3% of those age 65 or over.
Common Questions
What is Per Capita Income in Silex?
Per Capita income in Silex is $17,159.
What is Inequality or Gini Index in Silex?
Inequality or Gini Index in Silex is 0.35.
What is the Total Population of Silex?
Total Population of Silex is 314.
What is the Total Male Population of Silex?
Total Male Population of Silex is 165.
What is the Total Female Population of Silex?
Total Female Population of Silex is 149.
What is the Ratio of Males per 100 Females in Silex?
There are 110.74 Males per 100 Females in Silex.
What is the Ratio of Females per 100 Males in Silex?
There are 90.30 Females per 100 Males in Silex.
What is the Median Population Age in Silex?
Median Population Age in Silex is 54.3 Years.
What is the Average Family Size in Silex
Average Family Size in Silex is 3.2 People.
What is the Average Household Size in Silex
Average Household Size in Silex is 2.5 People.
How Large is the Labor Force in Silex?
There are 81 People in the Labor Forcein in Silex.
What is the Percentage of People in the Labor Force in Silex?
30.8% of People are in the Labor Force in Silex.