Flordell Hills, MO Map & Demographics
Flordell Hills Map
Flordell Hills Overview
$14,109
PER CAPITA INCOME
$29,279
AVG FAMILY INCOME
$32,906
AVG HOUSEHOLD INCOME
40.7%
WAGE / INCOME GAP [ % ]
59.3¢/ $1
WAGE / INCOME GAP [ $ ]
0.40
INEQUALITY / GINI INDEX
1,448
TOTAL POPULATION
524
MALE POPULATION
924
FEMALE POPULATION
56.71
MALES / 100 FEMALES
176.34
FEMALES / 100 MALES
25.6
MEDIAN AGE
3.4
AVG FAMILY SIZE
2.8
AVG HOUSEHOLD SIZE
647
LABOR FORCE [ PEOPLE ]
67.3%
PERCENT IN LABOR FORCE
31.7%
UNEMPLOYMENT RATE
Income in Flordell Hills
Income Overview in Flordell Hills
Per Capita Income in Flordell Hills is $14,109, while median incomes of families and households are $29,279 and $32,906 respectively.
| Characteristic | Number | Measure |
| Per Capita Income | 1,448 | $14,109 |
| Median Family Income | 375 | $29,279 |
| Mean Family Income | 375 | $37,859 |
| Median Household Income | 519 | $32,906 |
| Mean Household Income | 519 | $39,482 |
| Income Deficit | 375 | $0 |
| Wage / Income Gap (%) | 1,448 | 40.68% |
| Wage / Income Gap ($) | 1,448 | 59.32¢ per $1 |
| Gini / Inequality Index | 1,448 | 0.40 |
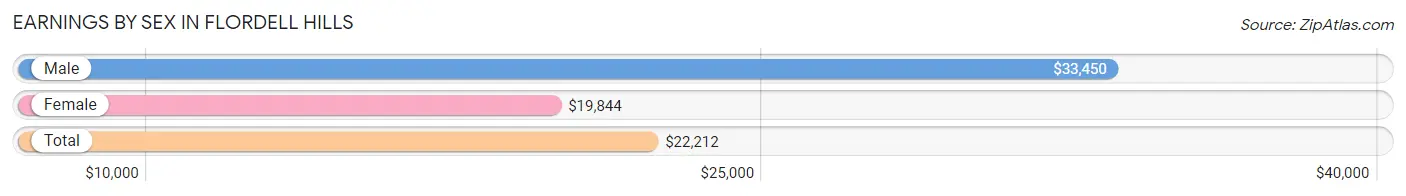
Earnings by Sex in Flordell Hills
Average Earnings in Flordell Hills are $22,212, $33,450 for men and $19,844 for women, a difference of 40.7%.
| Sex | Number | Average Earnings |
| Male | 145 (25.4%) | $33,450 |
| Female | 425 (74.6%) | $19,844 |
| Total | 570 (100.0%) | $22,212 |
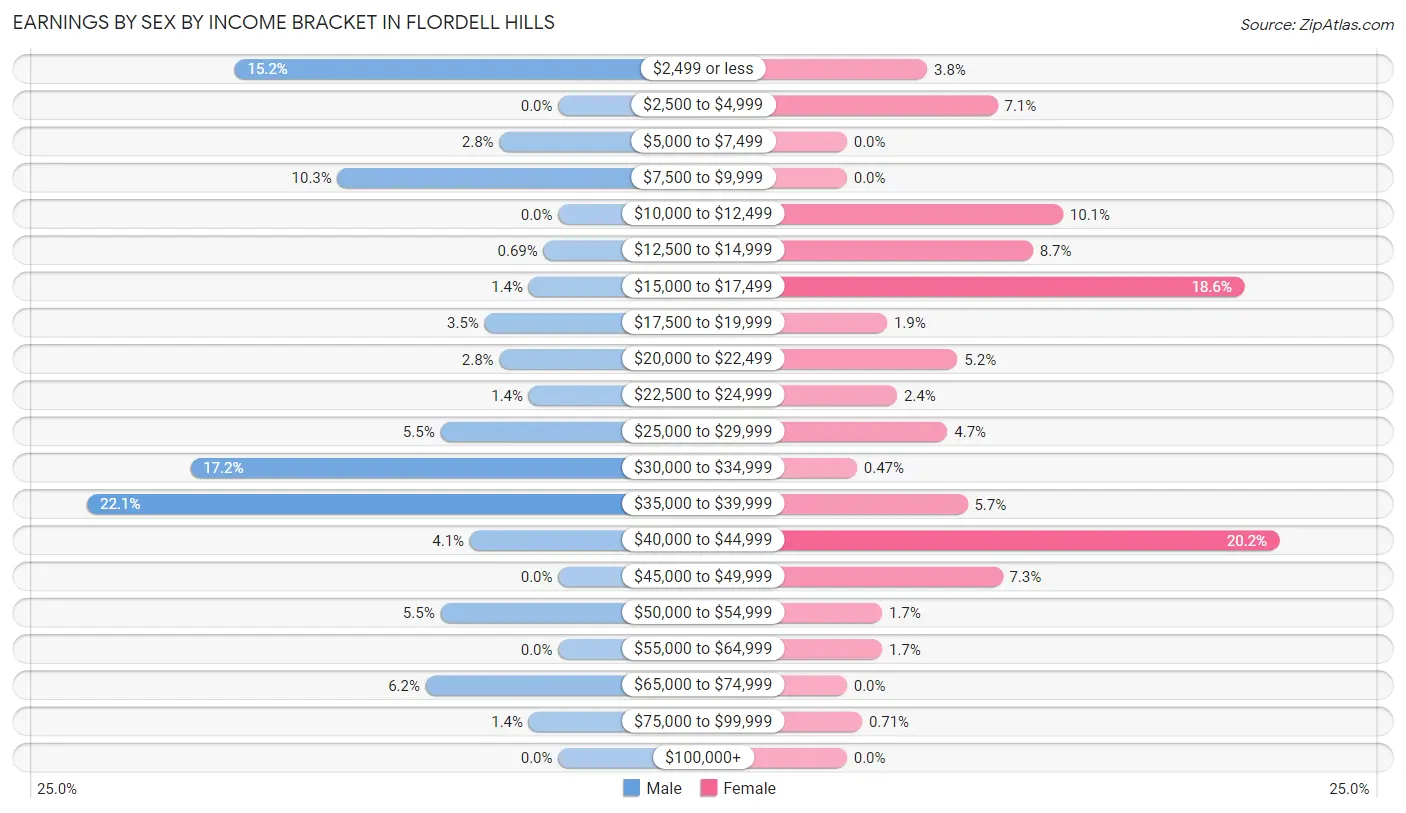
Earnings by Sex by Income Bracket in Flordell Hills
The most common earnings brackets in Flordell Hills are $35,000 to $39,999 for men (32 | 22.1%) and $40,000 to $44,999 for women (86 | 20.2%).
| Income | Male | Female |
| $2,499 or less | 22 (15.2%) | 16 (3.8%) |
| $2,500 to $4,999 | 0 (0.0%) | 30 (7.1%) |
| $5,000 to $7,499 | 4 (2.8%) | 0 (0.0%) |
| $7,500 to $9,999 | 15 (10.3%) | 0 (0.0%) |
| $10,000 to $12,499 | 0 (0.0%) | 43 (10.1%) |
| $12,500 to $14,999 | 1 (0.7%) | 37 (8.7%) |
| $15,000 to $17,499 | 2 (1.4%) | 79 (18.6%) |
| $17,500 to $19,999 | 5 (3.5%) | 8 (1.9%) |
| $20,000 to $22,499 | 4 (2.8%) | 22 (5.2%) |
| $22,500 to $24,999 | 2 (1.4%) | 10 (2.4%) |
| $25,000 to $29,999 | 8 (5.5%) | 20 (4.7%) |
| $30,000 to $34,999 | 25 (17.2%) | 2 (0.5%) |
| $35,000 to $39,999 | 32 (22.1%) | 24 (5.7%) |
| $40,000 to $44,999 | 6 (4.1%) | 86 (20.2%) |
| $45,000 to $49,999 | 0 (0.0%) | 31 (7.3%) |
| $50,000 to $54,999 | 8 (5.5%) | 7 (1.7%) |
| $55,000 to $64,999 | 0 (0.0%) | 7 (1.7%) |
| $65,000 to $74,999 | 9 (6.2%) | 0 (0.0%) |
| $75,000 to $99,999 | 2 (1.4%) | 3 (0.7%) |
| $100,000+ | 0 (0.0%) | 0 (0.0%) |
| Total | 145 (100.0%) | 425 (100.0%) |
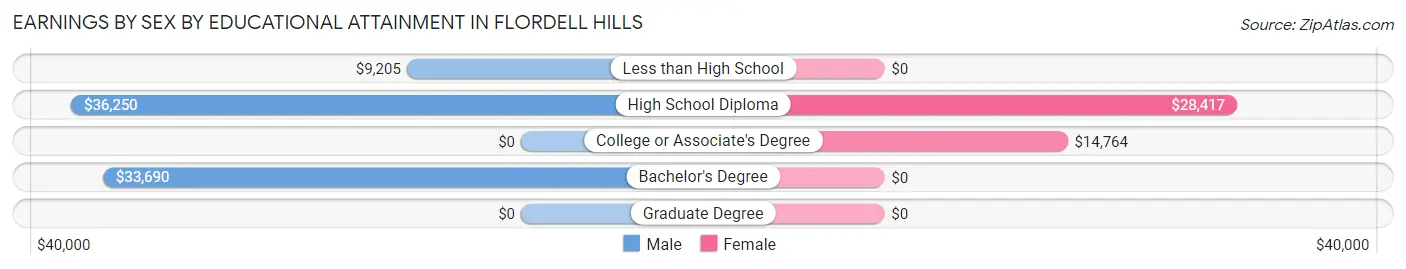
Earnings by Sex by Educational Attainment in Flordell Hills
Average earnings in Flordell Hills are $34,300 for men and $20,341 for women, a difference of 40.7%. Men with an educational attainment of high school diploma enjoy the highest average annual earnings of $36,250, while those with less than high school education earn the least with $9,205. Women with an educational attainment of high school diploma earn the most with the average annual earnings of $28,417, while those with college or associate's degree education have the smallest earnings of $14,764.
| Educational Attainment | Male Income | Female Income |
| Less than High School | $9,205 | $0 |
| High School Diploma | $36,250 | $28,417 |
| College or Associate's Degree | - | - |
| Bachelor's Degree | $33,690 | $0 |
| Graduate Degree | - | - |
| Total | $34,300 | $20,341 |
Family Income in Flordell Hills
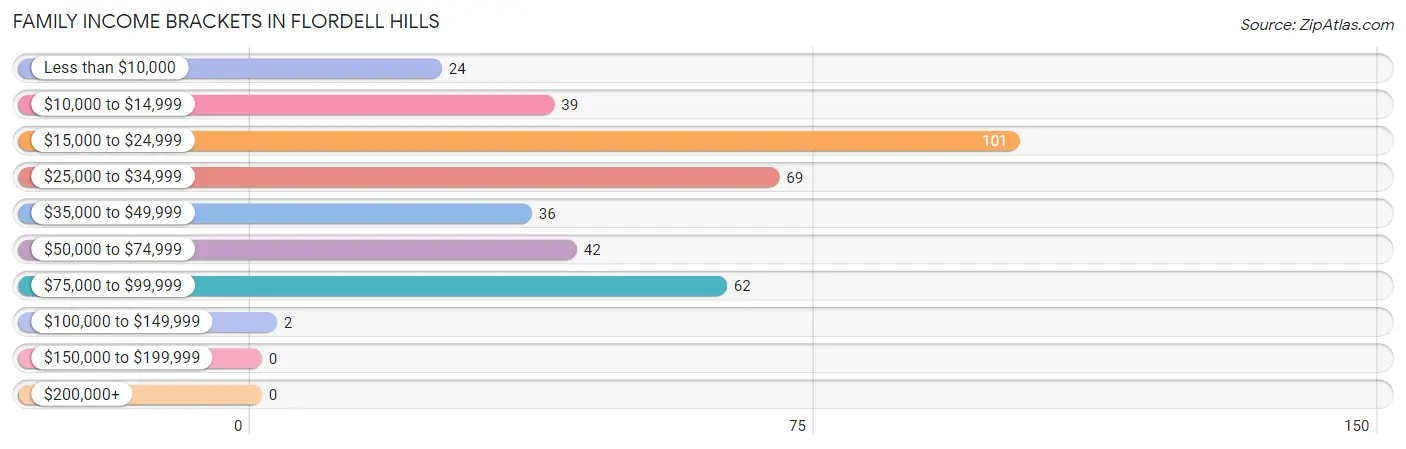
Family Income Brackets in Flordell Hills
According to the Flordell Hills family income data, there are 101 families falling into the $15,000 to $24,999 income range, which is the most common income bracket and makes up 26.9% of all families.
| Income Bracket | # Families | % Families |
| Less than $10,000 | 24 | 6.4% |
| $10,000 to $14,999 | 39 | 10.4% |
| $15,000 to $24,999 | 101 | 26.9% |
| $25,000 to $34,999 | 69 | 18.4% |
| $35,000 to $49,999 | 36 | 9.6% |
| $50,000 to $74,999 | 42 | 11.2% |
| $75,000 to $99,999 | 62 | 16.5% |
| $100,000 to $149,999 | 2 | 0.5% |
| $150,000 to $199,999 | 0 | 0.0% |
| $200,000+ | 0 | 0.0% |
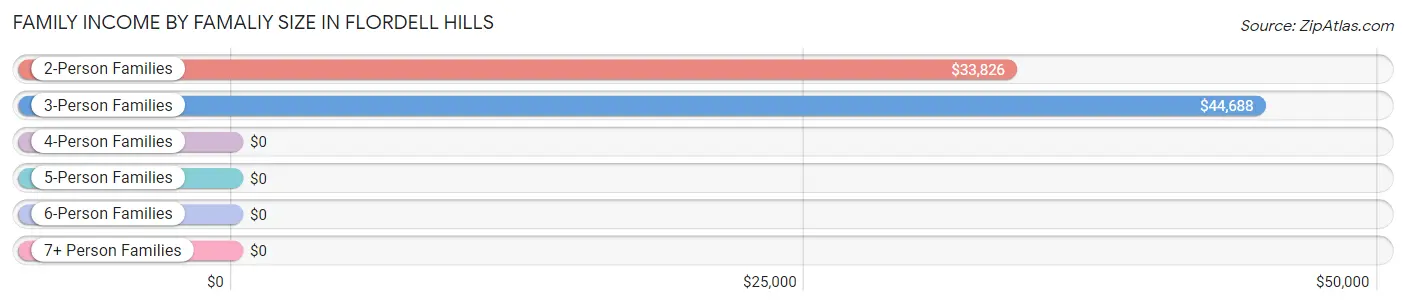
Family Income by Famaliy Size in Flordell Hills
3-person families (57 | 15.2%) account for the highest median family income in Flordell Hills with $44,688 per family, while 2-person families (151 | 40.3%) have the highest median income of $16,913 per family member.
| Income Bracket | # Families | Median Income |
| 2-Person Families | 151 (40.3%) | $33,826 |
| 3-Person Families | 57 (15.2%) | $44,688 |
| 4-Person Families | 118 (31.5%) | $0 |
| 5-Person Families | 49 (13.1%) | $0 |
| 6-Person Families | 0 (0.0%) | $0 |
| 7+ Person Families | 0 (0.0%) | $0 |
| Total | 375 (100.0%) | $29,279 |
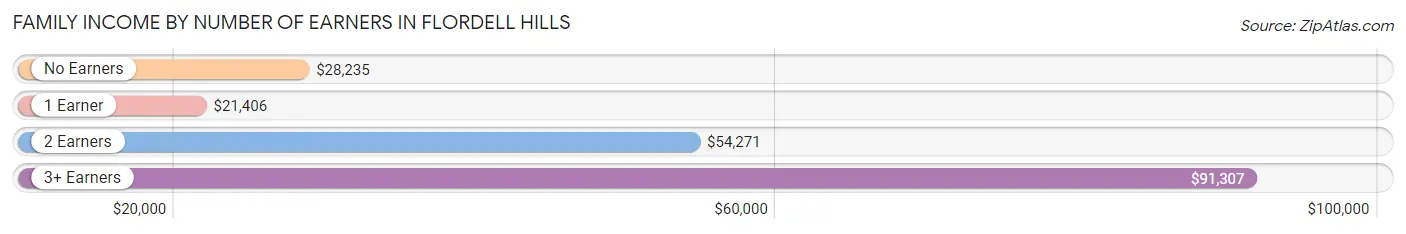
Family Income by Number of Earners in Flordell Hills
The median family income in Flordell Hills is $29,279, with families comprising 3+ earners (25) having the highest median family income of $91,307, while families with 1 earner (213) have the lowest median family income of $21,406, accounting for 6.7% and 56.8% of families, respectively.
| Number of Earners | # Families | Median Income |
| No Earners | 52 (13.9%) | $28,235 |
| 1 Earner | 213 (56.8%) | $21,406 |
| 2 Earners | 85 (22.7%) | $54,271 |
| 3+ Earners | 25 (6.7%) | $91,307 |
| Total | 375 (100.0%) | $29,279 |
Household Income in Flordell Hills
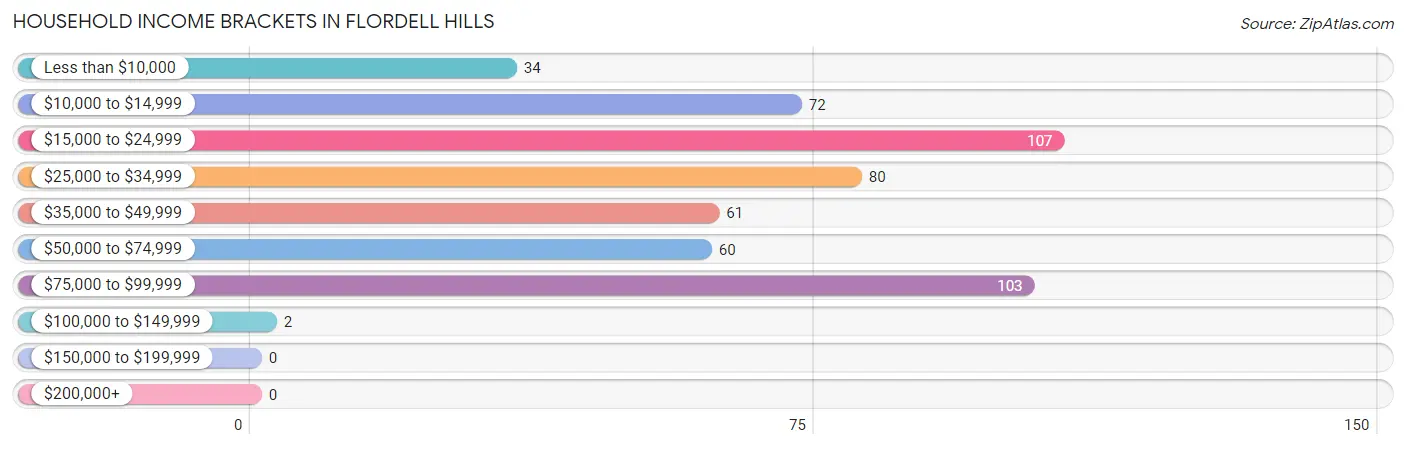
Household Income Brackets in Flordell Hills
With 107 households falling in the category, the $15,000 to $24,999 income range is the most frequent in Flordell Hills, accounting for 20.6% of all households.
| Income Bracket | # Households | % Households |
| Less than $10,000 | 34 | 6.6% |
| $10,000 to $14,999 | 72 | 13.9% |
| $15,000 to $24,999 | 107 | 20.6% |
| $25,000 to $34,999 | 80 | 15.4% |
| $35,000 to $49,999 | 61 | 11.8% |
| $50,000 to $74,999 | 60 | 11.6% |
| $75,000 to $99,999 | 103 | 19.8% |
| $100,000 to $149,999 | 2 | 0.4% |
| $150,000 to $199,999 | 0 | 0.0% |
| $200,000+ | 0 | 0.0% |
Household Income by Householder Age in Flordell Hills
The median household income in Flordell Hills is $32,906, with the highest median household income of $38,929 found in the 65+ years age bracket for the primary householder. A total of 110 households (21.2%) fall into this category. Meanwhile, the 15 to 24 years age bracket for the primary householder has the lowest median household income of $0, with 22 households (4.2%) in this group.
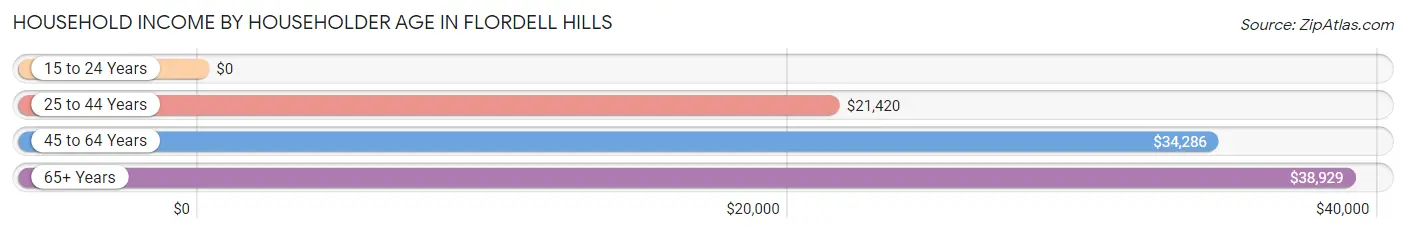
| Income Bracket | # Households | Median Income |
| 15 to 24 Years | 22 (4.2%) | $0 |
| 25 to 44 Years | 229 (44.1%) | $21,420 |
| 45 to 64 Years | 158 (30.4%) | $34,286 |
| 65+ Years | 110 (21.2%) | $38,929 |
| Total | 519 (100.0%) | $32,906 |
Poverty in Flordell Hills
Income Below Poverty by Sex and Age in Flordell Hills
With 42.6% poverty level for males and 54.5% for females among the residents of Flordell Hills, 12 to 14 year old males and 12 to 14 year old females are the most vulnerable to poverty, with 94 males (93.1%) and 95 females (100.0%) in their respective age groups living below the poverty level.
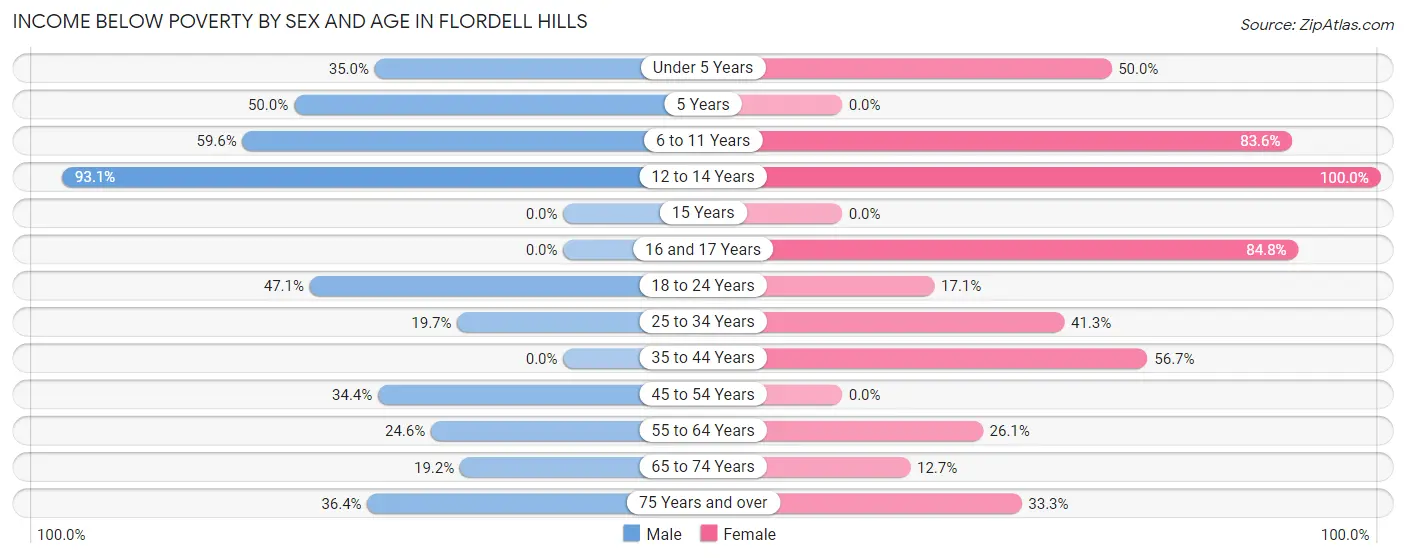
| Age Bracket | Male | Female |
| Under 5 Years | 7 (35.0%) | 22 (50.0%) |
| 5 Years | 6 (50.0%) | 0 (0.0%) |
| 6 to 11 Years | 53 (59.6%) | 102 (83.6%) |
| 12 to 14 Years | 94 (93.1%) | 95 (100.0%) |
| 15 Years | 0 (0.0%) | 0 (0.0%) |
| 16 and 17 Years | 0 (0.0%) | 100 (84.8%) |
| 18 to 24 Years | 8 (47.1%) | 6 (17.1%) |
| 25 to 34 Years | 12 (19.7%) | 66 (41.2%) |
| 35 to 44 Years | 0 (0.0%) | 76 (56.7%) |
| 45 to 54 Years | 11 (34.4%) | 0 (0.0%) |
| 55 to 64 Years | 14 (24.6%) | 23 (26.1%) |
| 65 to 74 Years | 14 (19.2%) | 10 (12.7%) |
| 75 Years and over | 4 (36.4%) | 4 (33.3%) |
| Total | 223 (42.6%) | 504 (54.5%) |
Income Above Poverty by Sex and Age in Flordell Hills
According to the poverty statistics in Flordell Hills, males aged 15 years and females aged 45 to 54 years are the age groups that are most secure financially, with 100.0% of males and 100.0% of females in these age groups living above the poverty line.
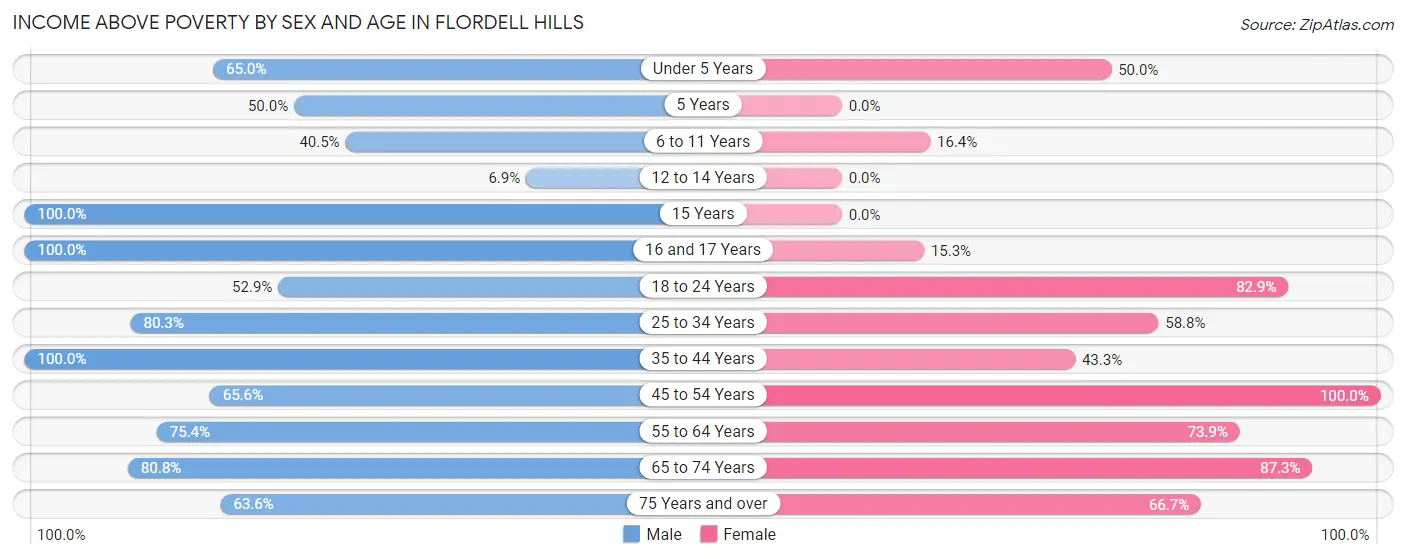
| Age Bracket | Male | Female |
| Under 5 Years | 13 (65.0%) | 22 (50.0%) |
| 5 Years | 6 (50.0%) | 0 (0.0%) |
| 6 to 11 Years | 36 (40.5%) | 20 (16.4%) |
| 12 to 14 Years | 7 (6.9%) | 0 (0.0%) |
| 15 Years | 4 (100.0%) | 0 (0.0%) |
| 16 and 17 Years | 30 (100.0%) | 18 (15.2%) |
| 18 to 24 Years | 9 (52.9%) | 29 (82.9%) |
| 25 to 34 Years | 49 (80.3%) | 94 (58.8%) |
| 35 to 44 Years | 17 (100.0%) | 58 (43.3%) |
| 45 to 54 Years | 21 (65.6%) | 37 (100.0%) |
| 55 to 64 Years | 43 (75.4%) | 65 (73.9%) |
| 65 to 74 Years | 59 (80.8%) | 69 (87.3%) |
| 75 Years and over | 7 (63.6%) | 8 (66.7%) |
| Total | 301 (57.4%) | 420 (45.5%) |
Income Below Poverty Among Married-Couple Families in Flordell Hills
The poverty statistics for married-couple families in Flordell Hills show that 4.6% or 4 of the total 87 families live below the poverty line. Families with no children have the highest poverty rate of 5.0%, comprising of 4 families. On the other hand, families with 1 or 2 children have the lowest poverty rate of 0.0%, which includes 0 families.
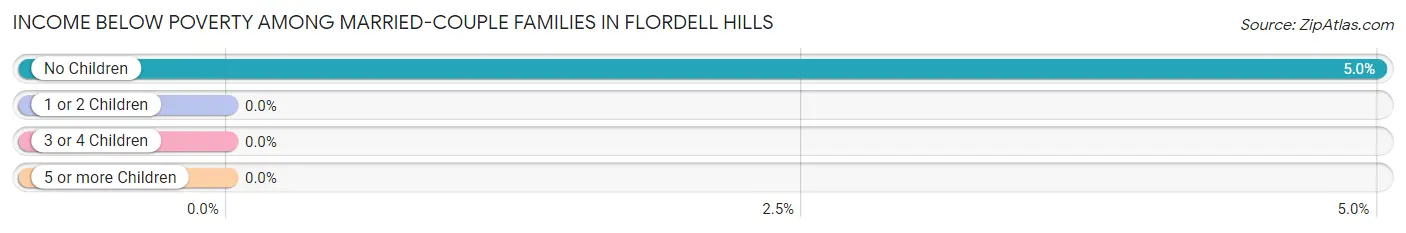
| Children | Above Poverty | Below Poverty |
| No Children | 76 (95.0%) | 4 (5.0%) |
| 1 or 2 Children | 7 (100.0%) | 0 (0.0%) |
| 3 or 4 Children | 0 (0.0%) | 0 (0.0%) |
| 5 or more Children | 0 (0.0%) | 0 (0.0%) |
| Total | 83 (95.4%) | 4 (4.6%) |
Income Below Poverty Among Single-Parent Households in Flordell Hills
According to the poverty data in Flordell Hills, 63.6% or 7 single-father households and 54.5% or 151 single-mother households are living below the poverty line. Among single-father households, those with no children have the highest poverty rate, with 7 households (100.0%) experiencing poverty. Likewise, among single-mother households, those with 3 or 4 children have the highest poverty rate, with 112 households (100.0%) falling below the poverty line.
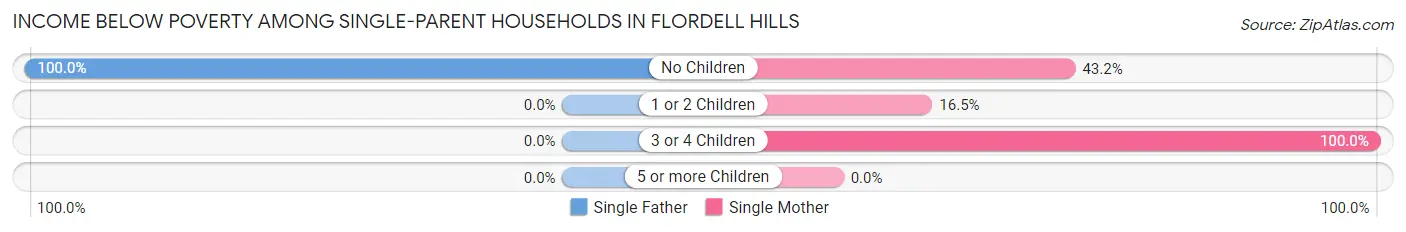
| Children | Single Father | Single Mother |
| No Children | 7 (100.0%) | 19 (43.2%) |
| 1 or 2 Children | 0 (0.0%) | 20 (16.5%) |
| 3 or 4 Children | 0 (0.0%) | 112 (100.0%) |
| 5 or more Children | 0 (0.0%) | 0 (0.0%) |
| Total | 7 (63.6%) | 151 (54.5%) |
Income Below Poverty Among Married-Couple vs Single-Parent Households in Flordell Hills
The poverty data for Flordell Hills shows that 4 of the married-couple family households (4.6%) and 158 of the single-parent households (54.9%) are living below the poverty level. Within the married-couple family households, those with no children have the highest poverty rate, with 4 households (5.0%) falling below the poverty line. Among the single-parent households, those with 3 or 4 children have the highest poverty rate, with 112 household (100.0%) living below poverty.
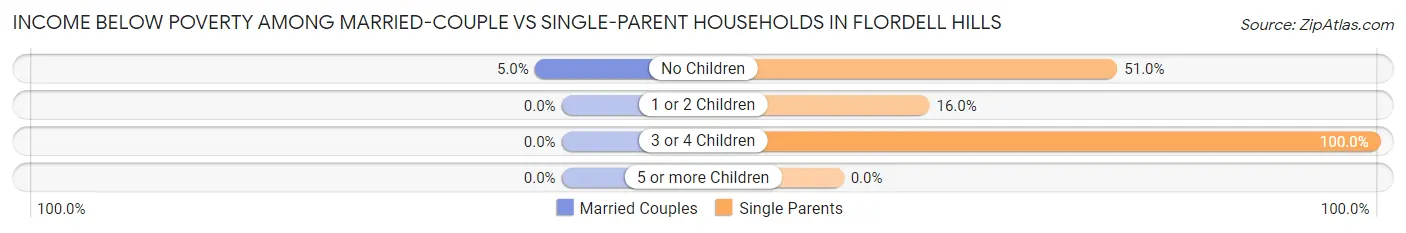
| Children | Married-Couple Families | Single-Parent Households |
| No Children | 4 (5.0%) | 26 (51.0%) |
| 1 or 2 Children | 0 (0.0%) | 20 (16.0%) |
| 3 or 4 Children | 0 (0.0%) | 112 (100.0%) |
| 5 or more Children | 0 (0.0%) | 0 (0.0%) |
| Total | 4 (4.6%) | 158 (54.9%) |
Race in Flordell Hills
The most populous races in Flordell Hills are Black / African American (1,338 | 92.4%), White / Caucasian (47 | 3.3%), and Two or more Races (40 | 2.8%).
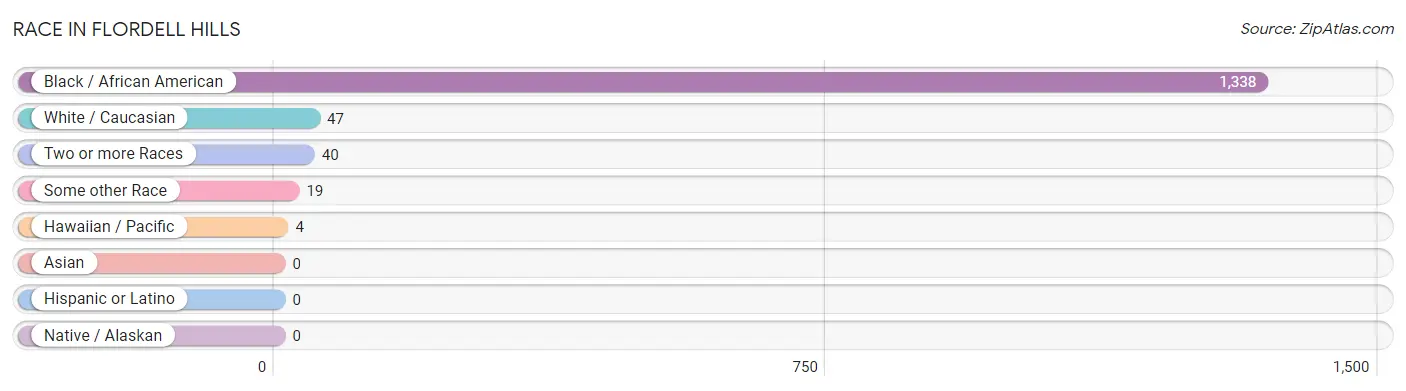
| Race | # Population | % Population |
| Asian | 0 | 0.0% |
| Black / African American | 1,338 | 92.4% |
| Hawaiian / Pacific | 4 | 0.3% |
| Hispanic or Latino | 0 | 0.0% |
| Native / Alaskan | 0 | 0.0% |
| White / Caucasian | 47 | 3.3% |
| Two or more Races | 40 | 2.8% |
| Some other Race | 19 | 1.3% |
| Total | 1,448 | 100.0% |
Ancestry in Flordell Hills
The most populous ancestries reported in Flordell Hills are German (31 | 2.1%), European (19 | 1.3%), Cherokee (12 | 0.8%), Nigerian (12 | 0.8%), and Subsaharan African (12 | 0.8%), together accounting for 5.9% of all Flordell Hills residents.
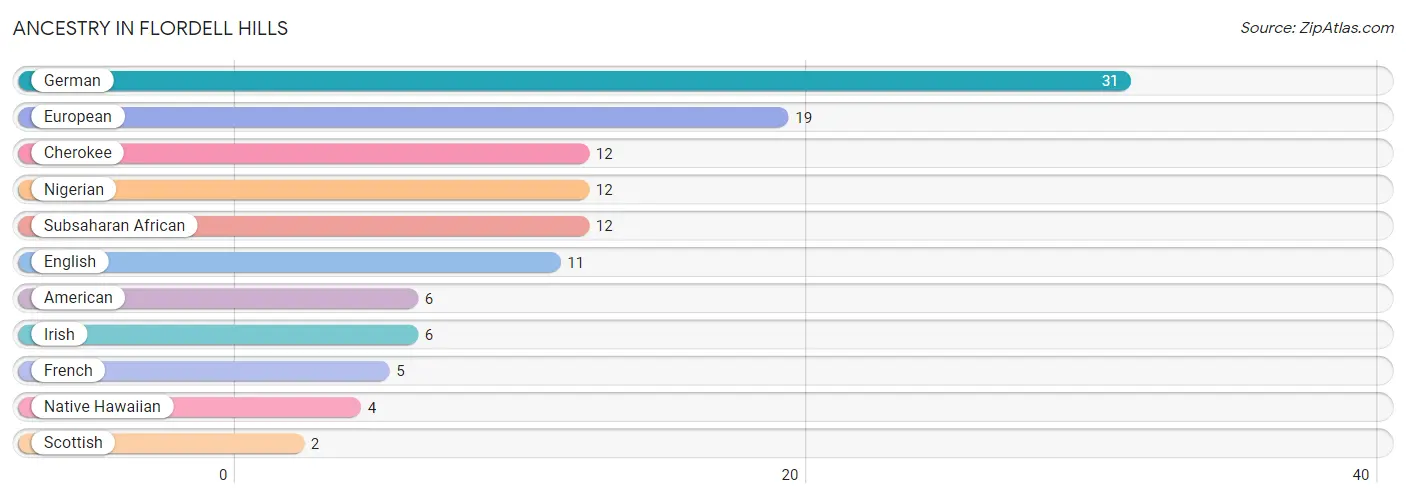
| Ancestry | # Population | % Population |
| American | 6 | 0.4% |
| Cherokee | 12 | 0.8% |
| English | 11 | 0.8% |
| European | 19 | 1.3% |
| French | 5 | 0.4% |
| German | 31 | 2.1% |
| Irish | 6 | 0.4% |
| Native Hawaiian | 4 | 0.3% |
| Nigerian | 12 | 0.8% |
| Scottish | 2 | 0.1% |
| Subsaharan African | 12 | 0.8% | View All 11 Rows |
Immigrants in Flordell Hills

| Immigration Origin | # Population | % Population | View All 0 Rows |
Sex and Age in Flordell Hills
Sex and Age in Flordell Hills
The most populous age groups in Flordell Hills are 10 to 14 Years (141 | 26.9%) for men and 15 to 19 Years (125 | 13.5%) for women.
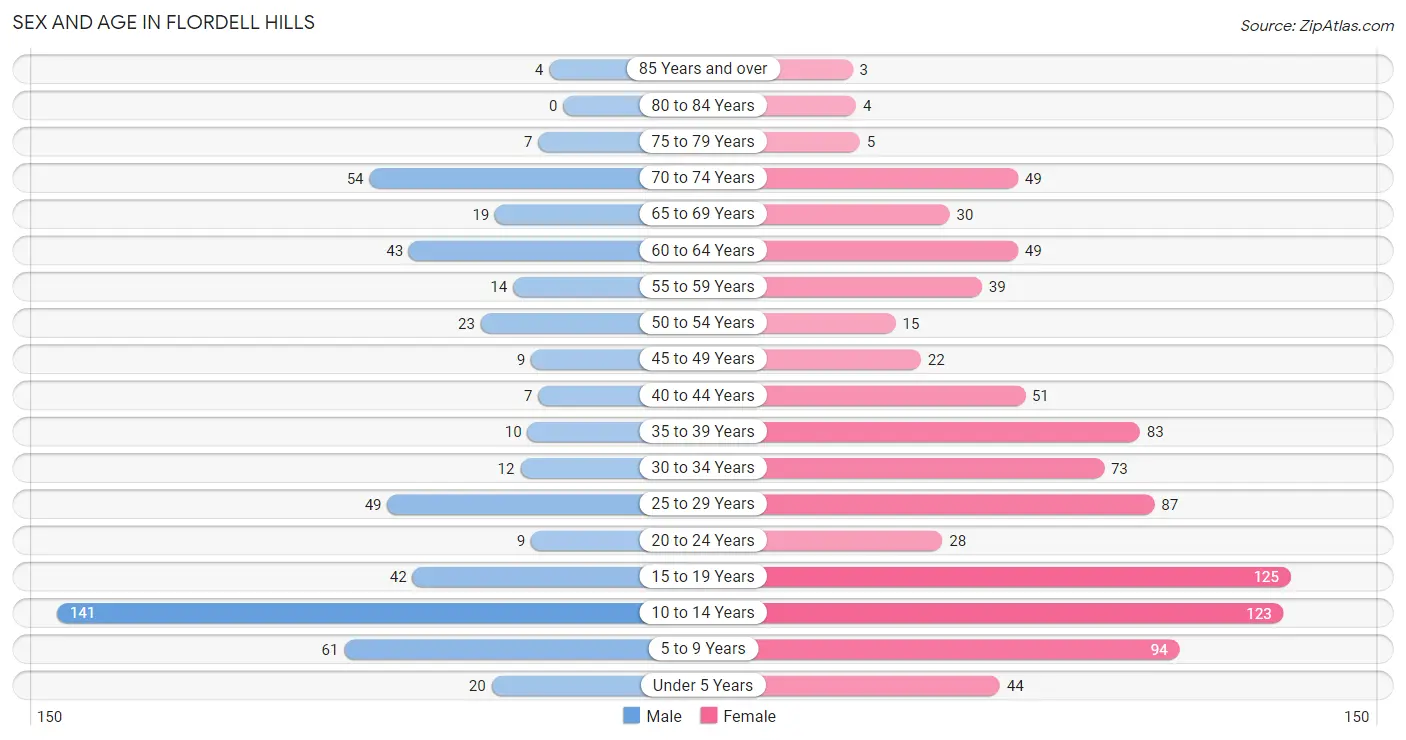
| Age Bracket | Male | Female |
| Under 5 Years | 20 (3.8%) | 44 (4.8%) |
| 5 to 9 Years | 61 (11.6%) | 94 (10.2%) |
| 10 to 14 Years | 141 (26.9%) | 123 (13.3%) |
| 15 to 19 Years | 42 (8.0%) | 125 (13.5%) |
| 20 to 24 Years | 9 (1.7%) | 28 (3.0%) |
| 25 to 29 Years | 49 (9.3%) | 87 (9.4%) |
| 30 to 34 Years | 12 (2.3%) | 73 (7.9%) |
| 35 to 39 Years | 10 (1.9%) | 83 (9.0%) |
| 40 to 44 Years | 7 (1.3%) | 51 (5.5%) |
| 45 to 49 Years | 9 (1.7%) | 22 (2.4%) |
| 50 to 54 Years | 23 (4.4%) | 15 (1.6%) |
| 55 to 59 Years | 14 (2.7%) | 39 (4.2%) |
| 60 to 64 Years | 43 (8.2%) | 49 (5.3%) |
| 65 to 69 Years | 19 (3.6%) | 30 (3.3%) |
| 70 to 74 Years | 54 (10.3%) | 49 (5.3%) |
| 75 to 79 Years | 7 (1.3%) | 5 (0.5%) |
| 80 to 84 Years | 0 (0.0%) | 4 (0.4%) |
| 85 Years and over | 4 (0.8%) | 3 (0.3%) |
| Total | 524 (100.0%) | 924 (100.0%) |
Families and Households in Flordell Hills
Median Family Size in Flordell Hills
The median family size in Flordell Hills is 3.35 persons per family, with single female/mother families (277 | 73.9%) accounting for the largest median family size of 3.69 persons per family. On the other hand, married-couple families (87 | 23.2%) represent the smallest median family size with 2.38 persons per family.
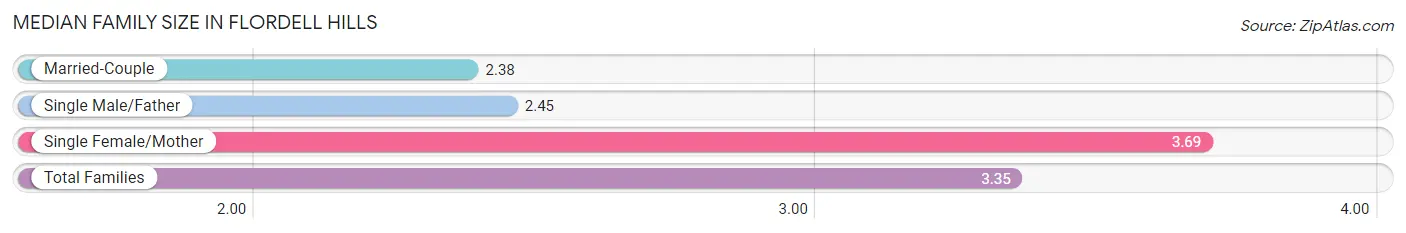
| Family Type | # Families | Family Size |
| Married-Couple | 87 (23.2%) | 2.38 |
| Single Male/Father | 11 (2.9%) | 2.45 |
| Single Female/Mother | 277 (73.9%) | 3.69 |
| Total Families | 375 (100.0%) | 3.35 |
Median Household Size in Flordell Hills
The median household size in Flordell Hills is 2.79 persons per household, with single female/mother households (277 | 53.4%) accounting for the largest median household size of 3.71 persons per household. non-family households (144 | 27.8%) represent the smallest median household size with 1.28 persons per household.
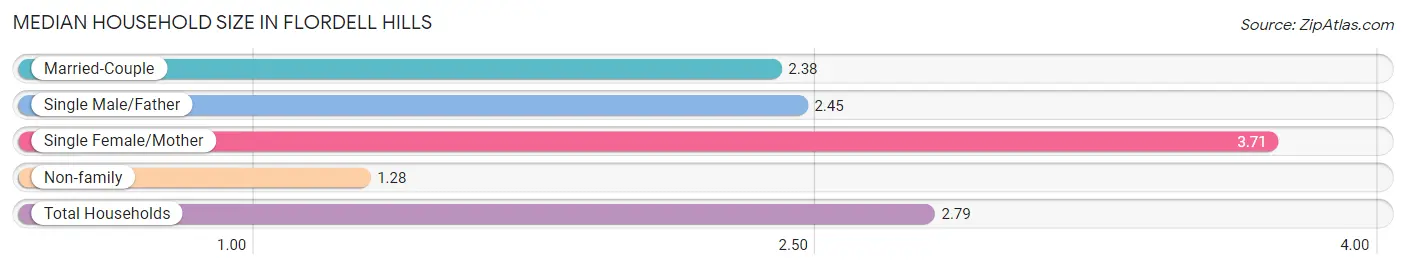
| Household Type | # Households | Household Size |
| Married-Couple | 87 (16.8%) | 2.38 |
| Single Male/Father | 11 (2.1%) | 2.45 |
| Single Female/Mother | 277 (53.4%) | 3.71 |
| Non-family | 144 (27.8%) | 1.28 |
| Total Households | 519 (100.0%) | 2.79 |
Household Size by Marriage Status in Flordell Hills
Out of a total of 519 households in Flordell Hills, 375 (72.3%) are family households, while 144 (27.8%) are nonfamily households. The most numerous type of family households are 2-person households, comprising 144, and the most common type of nonfamily households are 1-person households, comprising 107.
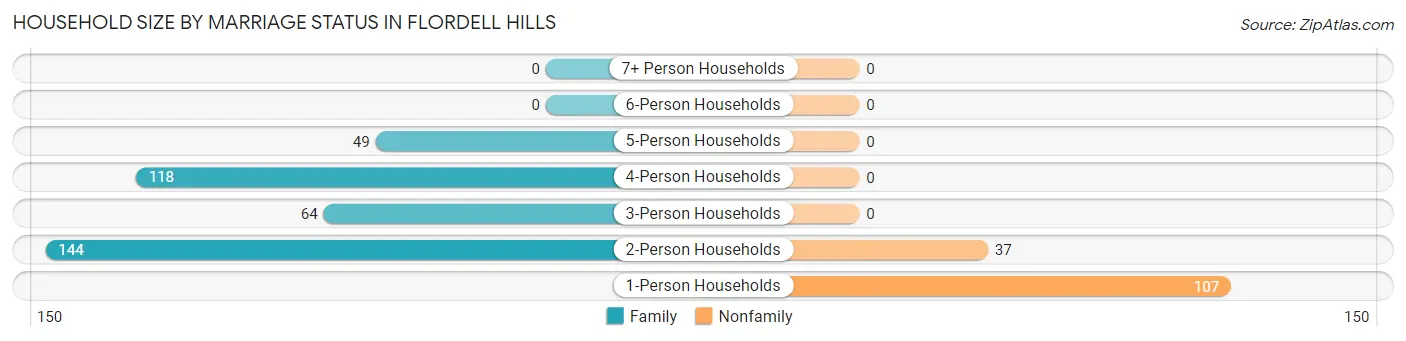
| Household Size | Family Households | Nonfamily Households |
| 1-Person Households | - | 107 (20.6%) |
| 2-Person Households | 144 (27.8%) | 37 (7.1%) |
| 3-Person Households | 64 (12.3%) | 0 (0.0%) |
| 4-Person Households | 118 (22.7%) | 0 (0.0%) |
| 5-Person Households | 49 (9.4%) | 0 (0.0%) |
| 6-Person Households | 0 (0.0%) | 0 (0.0%) |
| 7+ Person Households | 0 (0.0%) | 0 (0.0%) |
| Total | 375 (72.3%) | 144 (27.8%) |
Female Fertility in Flordell Hills
Fertility by Age in Flordell Hills
Average fertility rate in Flordell Hills is 40.0 births per 1,000 women. Women in the age bracket of 20 to 34 years have the highest fertility rate with 101.0 births per 1,000 women. Women in the age bracket of 20 to 34 years acount for 100.0% of all women with births.
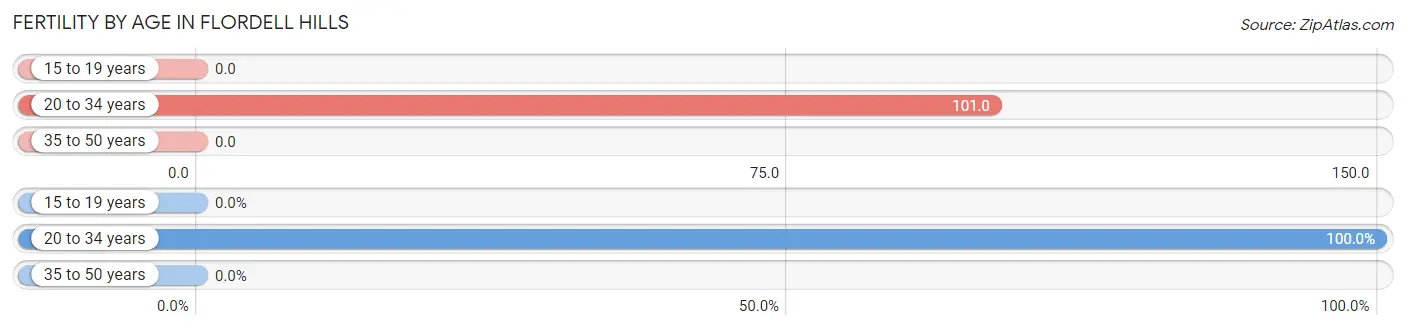
| Age Bracket | Women with Births | Births / 1,000 Women |
| 15 to 19 years | 0 (0.0%) | 0.0 |
| 20 to 34 years | 19 (100.0%) | 101.0 |
| 35 to 50 years | 0 (0.0%) | 0.0 |
| Total | 19 (100.0%) | 40.0 |
Fertility by Age by Marriage Status in Flordell Hills
63.2% of women with births (19) in Flordell Hills are married. The highest percentage of unmarried women with births falls into 20 to 34 years age bracket with 36.8% of them unmarried at the time of birth, while the lowest percentage of unmarried women with births belong to 20 to 34 years age bracket with 36.8% of them unmarried.
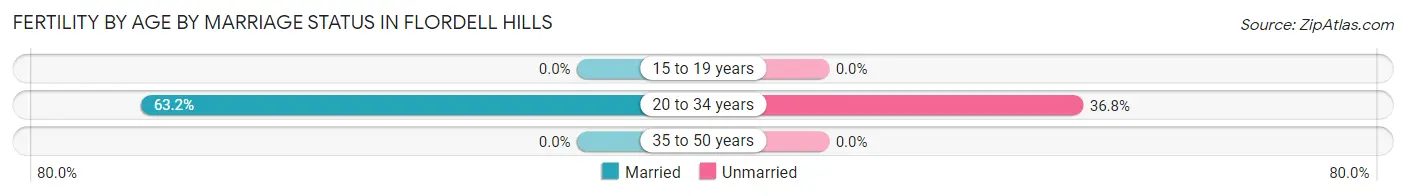
| Age Bracket | Married | Unmarried |
| 15 to 19 years | 0 (0.0%) | 0 (0.0%) |
| 20 to 34 years | 12 (63.2%) | 7 (36.8%) |
| 35 to 50 years | 0 (0.0%) | 0 (0.0%) |
| Total | 12 (63.2%) | 7 (36.8%) |
Fertility by Education in Flordell Hills
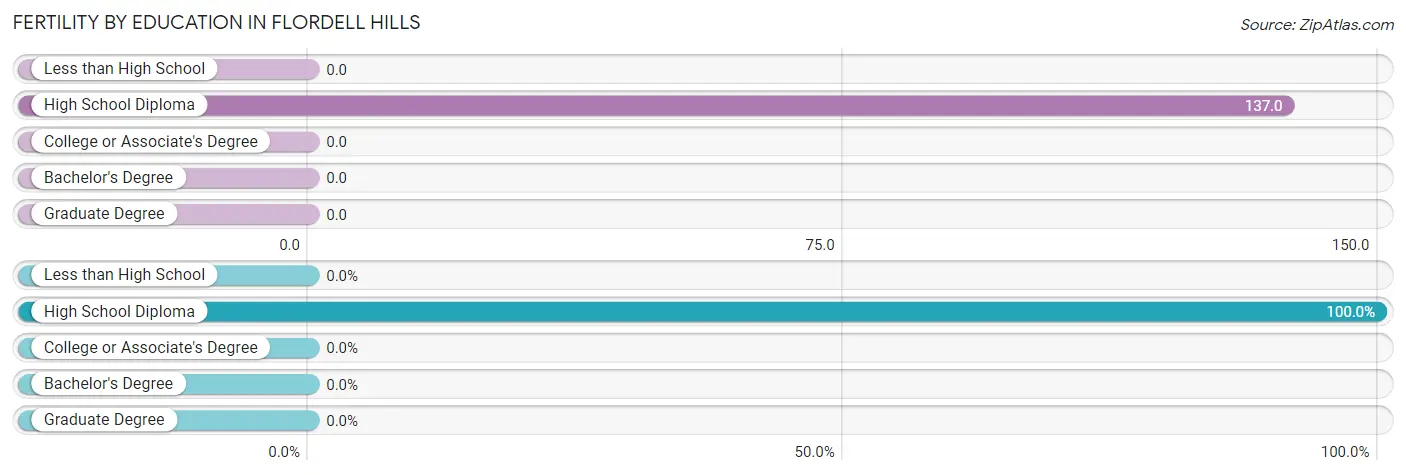
| Educational Attainment | Women with Births | Births / 1,000 Women |
| Less than High School | 0 (0.0%) | 0.0 |
| High School Diploma | 19 (100.0%) | 137.0 |
| College or Associate's Degree | 0 (0.0%) | 0.0 |
| Bachelor's Degree | 0 (0.0%) | 0.0 |
| Graduate Degree | 0 (0.0%) | 0.0 |
| Total | 19 (100.0%) | 40.0 |
Fertility by Education by Marriage Status in Flordell Hills
36.8% of women with births in Flordell Hills are unmarried. Women with the educational attainment of high school diploma are most likely to be married with 63.2% of them married at childbirth, while women with the educational attainment of high school diploma are least likely to be married with 36.8% of them unmarried at childbirth.

| Educational Attainment | Married | Unmarried |
| Less than High School | 0 (0.0%) | 0 (0.0%) |
| High School Diploma | 12 (63.2%) | 7 (36.8%) |
| College or Associate's Degree | 0 (0.0%) | 0 (0.0%) |
| Bachelor's Degree | 0 (0.0%) | 0 (0.0%) |
| Graduate Degree | 0 (0.0%) | 0 (0.0%) |
| Total | 12 (63.2%) | 7 (36.8%) |
Employment Characteristics in Flordell Hills
Employment by Class of Employer in Flordell Hills
Among the 442 employed individuals in Flordell Hills, private company employees (289 | 65.4%), not-for-profit organizations (56 | 12.7%), and self-employed (not incorporated) (33 | 7.5%) make up the most common classes of employment.
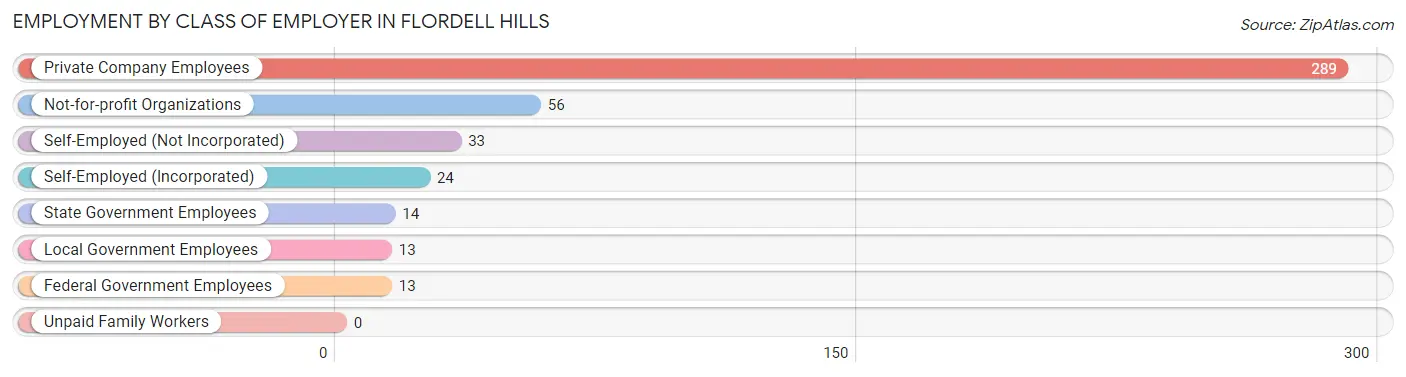
| Employer Class | # Employees | % Employees |
| Private Company Employees | 289 | 65.4% |
| Self-Employed (Incorporated) | 24 | 5.4% |
| Self-Employed (Not Incorporated) | 33 | 7.5% |
| Not-for-profit Organizations | 56 | 12.7% |
| Local Government Employees | 13 | 2.9% |
| State Government Employees | 14 | 3.2% |
| Federal Government Employees | 13 | 2.9% |
| Unpaid Family Workers | 0 | 0.0% |
| Total | 442 | 100.0% |
Employment Status by Age in Flordell Hills
According to the labor force statistics for Flordell Hills, out of the total population over 16 years of age (961), 67.3% or 647 individuals are in the labor force, with 31.7% or 205 of them unemployed. The age group with the highest labor force participation rate is 35 to 44 years, with 95.4% or 144 individuals in the labor force. Within the labor force, the 16 to 19 years age range has the highest percentage of unemployed individuals, with 88.9% or 88 of them being unemployed.
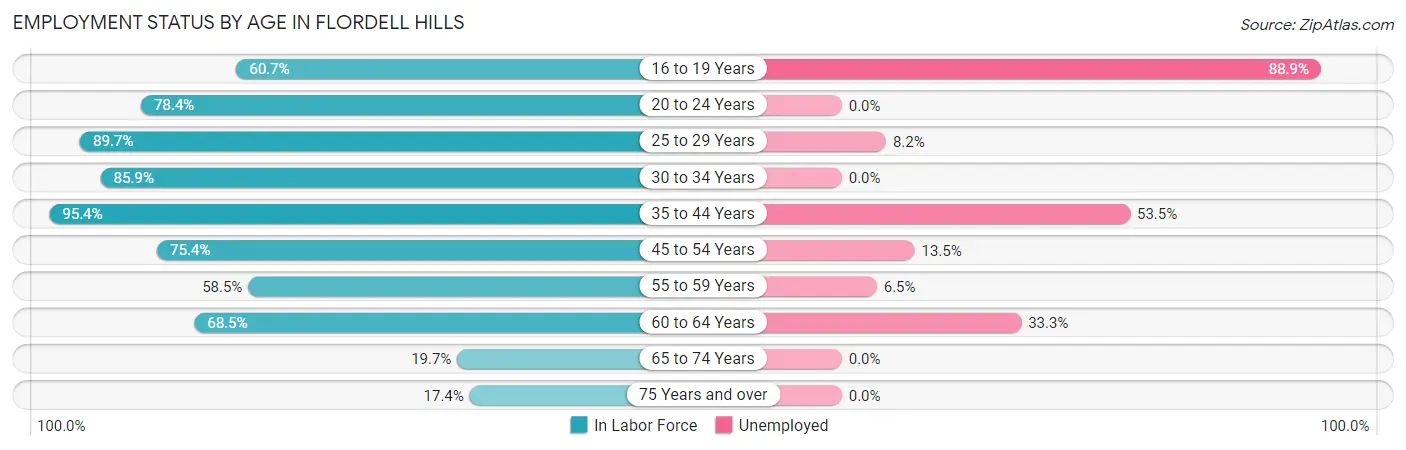
| Age Bracket | In Labor Force | Unemployed |
| 16 to 19 Years | 99 (60.7%) | 88 (88.9%) |
| 20 to 24 Years | 29 (78.4%) | 0 (0.0%) |
| 25 to 29 Years | 122 (89.7%) | 10 (8.2%) |
| 30 to 34 Years | 73 (85.9%) | 0 (0.0%) |
| 35 to 44 Years | 144 (95.4%) | 77 (53.5%) |
| 45 to 54 Years | 52 (75.4%) | 7 (13.5%) |
| 55 to 59 Years | 31 (58.5%) | 2 (6.5%) |
| 60 to 64 Years | 63 (68.5%) | 21 (33.3%) |
| 65 to 74 Years | 30 (19.7%) | 0 (0.0%) |
| 75 Years and over | 4 (17.4%) | 0 (0.0%) |
| Total | 647 (67.3%) | 205 (31.7%) |
Employment Status by Educational Attainment in Flordell Hills
According to labor force statistics for Flordell Hills, 82.8% of individuals (485) out of the total population between 25 and 64 years of age (586) are in the labor force, with 24.1% or 117 of them being unemployed. The group with the highest labor force participation rate are those with the educational attainment of less than high school, with 96.7% or 58 individuals in the labor force. Within the labor force, individuals with less than high school education have the highest percentage of unemployment, with 77.6% or 45 of them being unemployed.
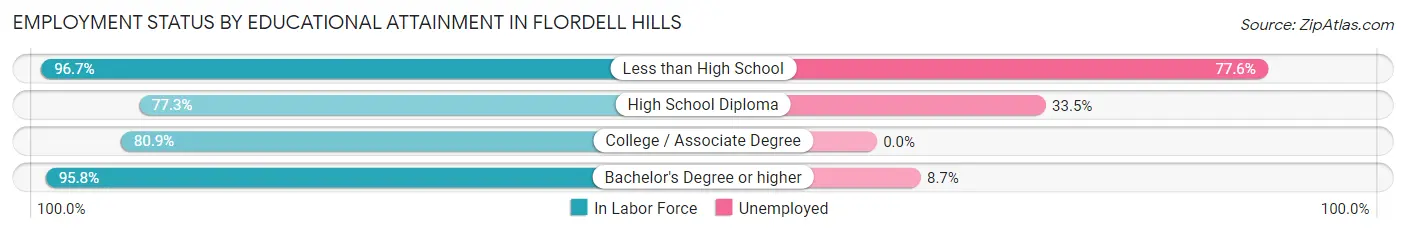
| Educational Attainment | In Labor Force | Unemployed |
| Less than High School | 58 (96.7%) | 47 (77.6%) |
| High School Diploma | 197 (77.3%) | 85 (33.5%) |
| College / Associate Degree | 161 (80.9%) | 0 (0.0%) |
| Bachelor's Degree or higher | 69 (95.8%) | 6 (8.7%) |
| Total | 485 (82.8%) | 141 (24.1%) |
Employment Occupations by Sex in Flordell Hills
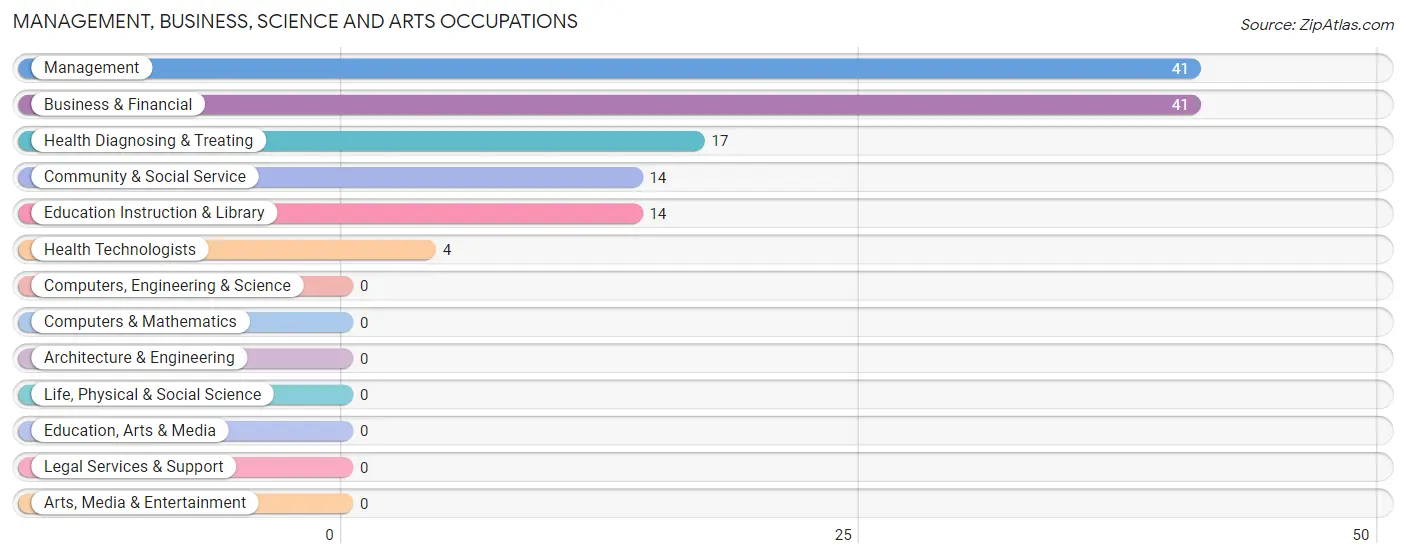
Management, Business, Science and Arts Occupations
The most common Management, Business, Science and Arts occupations in Flordell Hills are Management (41 | 9.3%), Business & Financial (41 | 9.3%), Health Diagnosing & Treating (17 | 3.8%), Community & Social Service (14 | 3.2%), and Education Instruction & Library (14 | 3.2%).
Management, Business, Science and Arts Occupations by Sex
Within the Management, Business, Science and Arts occupations in Flordell Hills, the most male-oriented occupations are Business & Financial (51.2%), Community & Social Service (50.0%), and Education Instruction & Library (50.0%), while the most female-oriented occupations are Health Diagnosing & Treating (100.0%), Health Technologists (100.0%), and Management (90.2%).
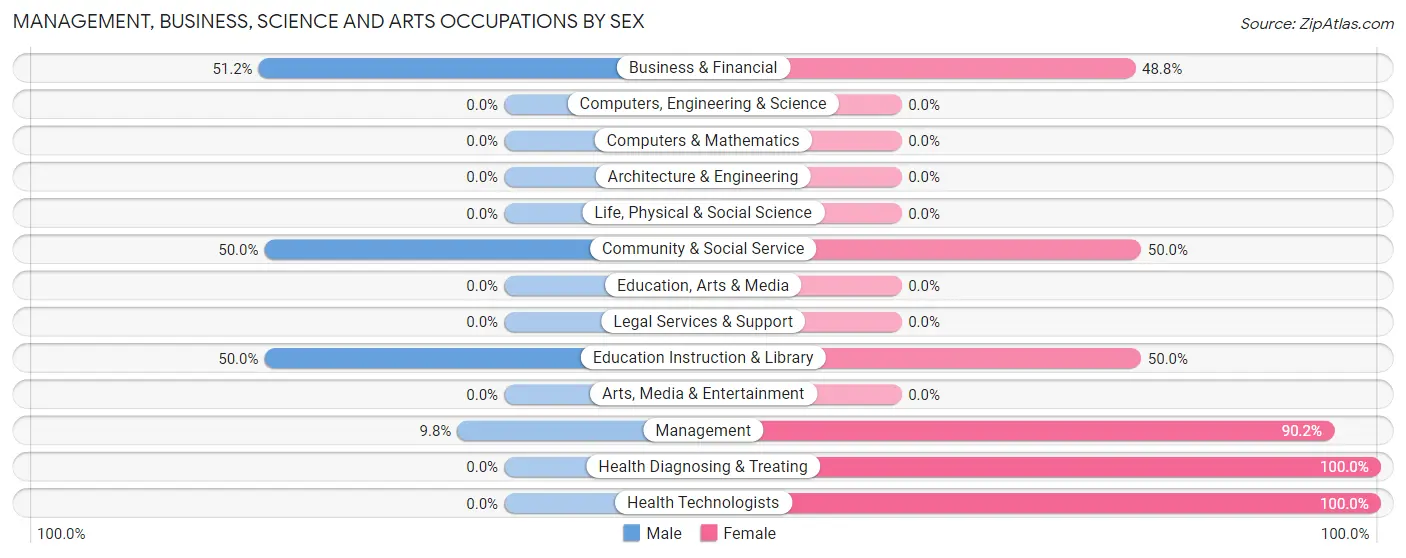
| Occupation | Male | Female |
| Management | 4 (9.8%) | 37 (90.2%) |
| Business & Financial | 21 (51.2%) | 20 (48.8%) |
| Computers, Engineering & Science | 0 (0.0%) | 0 (0.0%) |
| Computers & Mathematics | 0 (0.0%) | 0 (0.0%) |
| Architecture & Engineering | 0 (0.0%) | 0 (0.0%) |
| Life, Physical & Social Science | 0 (0.0%) | 0 (0.0%) |
| Community & Social Service | 7 (50.0%) | 7 (50.0%) |
| Education, Arts & Media | 0 (0.0%) | 0 (0.0%) |
| Legal Services & Support | 0 (0.0%) | 0 (0.0%) |
| Education Instruction & Library | 7 (50.0%) | 7 (50.0%) |
| Arts, Media & Entertainment | 0 (0.0%) | 0 (0.0%) |
| Health Diagnosing & Treating | 0 (0.0%) | 17 (100.0%) |
| Health Technologists | 0 (0.0%) | 4 (100.0%) |
| Total (Category) | 32 (28.3%) | 81 (71.7%) |
| Total (Overall) | 111 (25.1%) | 331 (74.9%) |
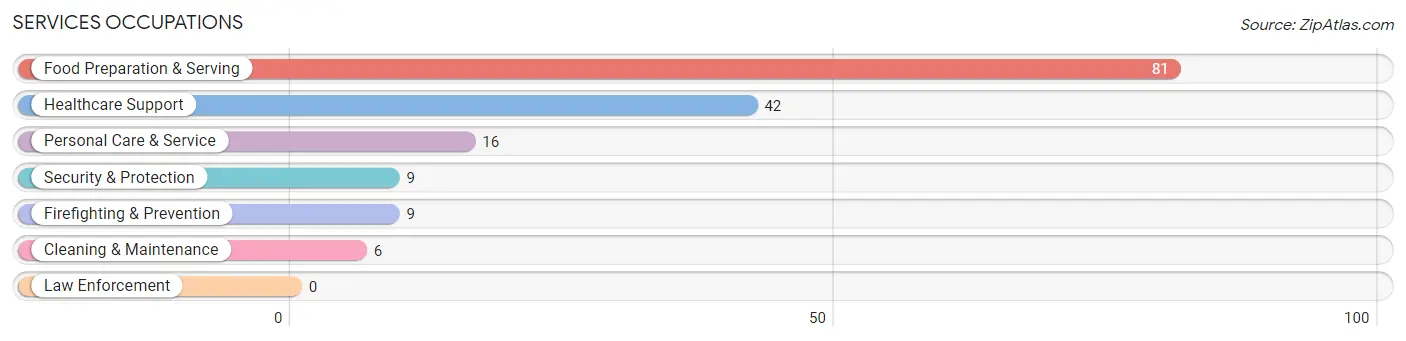
Services Occupations
The most common Services occupations in Flordell Hills are Food Preparation & Serving (81 | 18.3%), Healthcare Support (42 | 9.5%), Personal Care & Service (16 | 3.6%), Security & Protection (9 | 2.0%), and Firefighting & Prevention (9 | 2.0%).
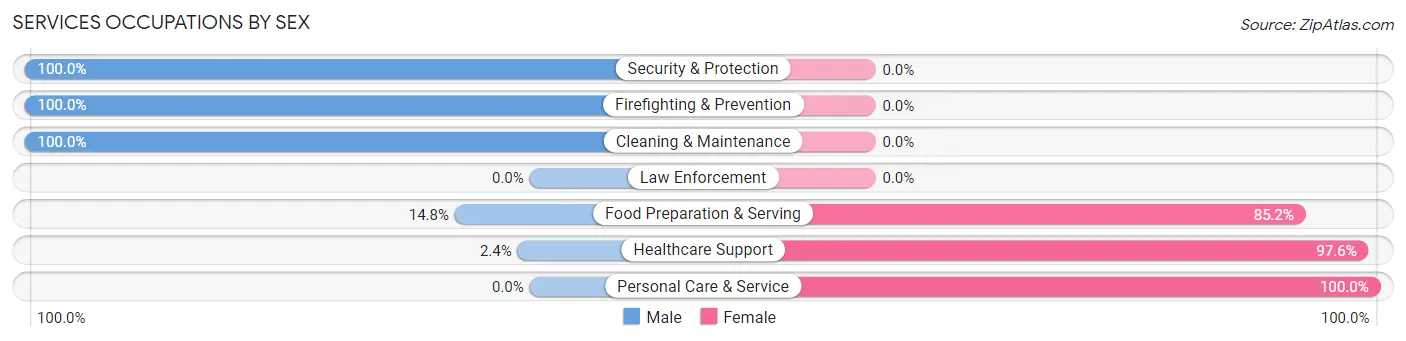
Services Occupations by Sex
Within the Services occupations in Flordell Hills, the most male-oriented occupations are Security & Protection (100.0%), Firefighting & Prevention (100.0%), and Cleaning & Maintenance (100.0%), while the most female-oriented occupations are Personal Care & Service (100.0%), Healthcare Support (97.6%), and Food Preparation & Serving (85.2%).
| Occupation | Male | Female |
| Healthcare Support | 1 (2.4%) | 41 (97.6%) |
| Security & Protection | 9 (100.0%) | 0 (0.0%) |
| Firefighting & Prevention | 9 (100.0%) | 0 (0.0%) |
| Law Enforcement | 0 (0.0%) | 0 (0.0%) |
| Food Preparation & Serving | 12 (14.8%) | 69 (85.2%) |
| Cleaning & Maintenance | 6 (100.0%) | 0 (0.0%) |
| Personal Care & Service | 0 (0.0%) | 16 (100.0%) |
| Total (Category) | 28 (18.2%) | 126 (81.8%) |
| Total (Overall) | 111 (25.1%) | 331 (74.9%) |
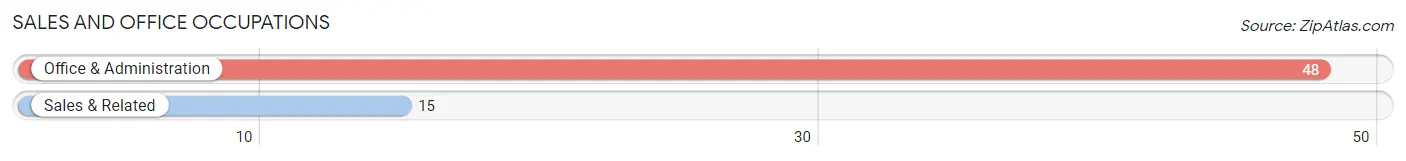
Sales and Office Occupations
The most common Sales and Office occupations in Flordell Hills are Office & Administration (48 | 10.9%), and Sales & Related (15 | 3.4%).
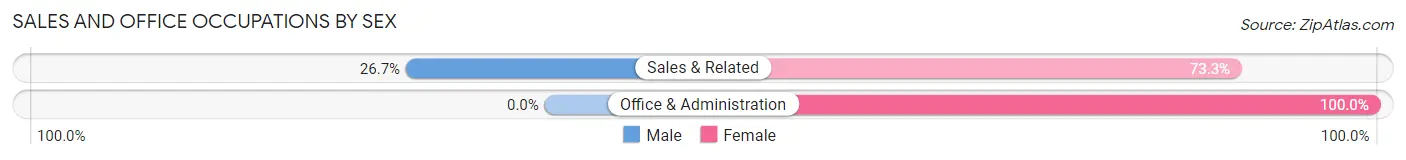
Sales and Office Occupations by Sex
| Occupation | Male | Female |
| Sales & Related | 4 (26.7%) | 11 (73.3%) |
| Office & Administration | 0 (0.0%) | 48 (100.0%) |
| Total (Category) | 4 (6.4%) | 59 (93.6%) |
| Total (Overall) | 111 (25.1%) | 331 (74.9%) |
Natural Resources, Construction and Maintenance Occupations
The most common Natural Resources, Construction and Maintenance occupations in Flordell Hills are Installation, Maintenance & Repair (10 | 2.3%), and Construction & Extraction (8 | 1.8%).
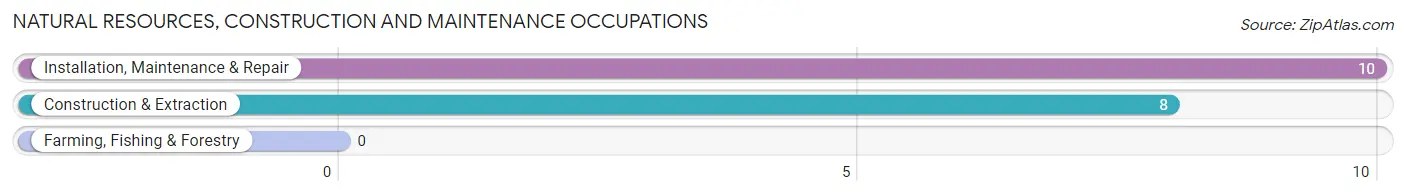
Natural Resources, Construction and Maintenance Occupations by Sex
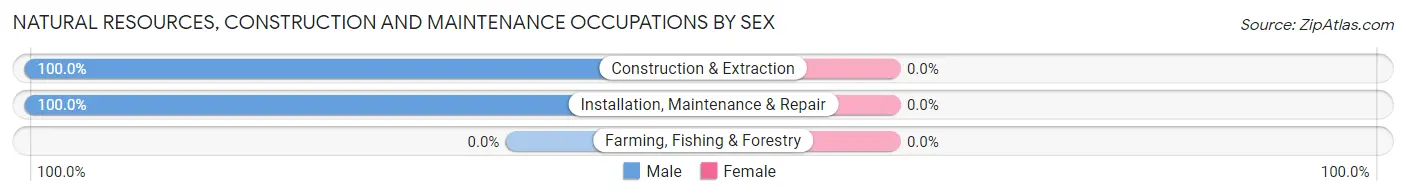
| Occupation | Male | Female |
| Farming, Fishing & Forestry | 0 (0.0%) | 0 (0.0%) |
| Construction & Extraction | 8 (100.0%) | 0 (0.0%) |
| Installation, Maintenance & Repair | 10 (100.0%) | 0 (0.0%) |
| Total (Category) | 18 (100.0%) | 0 (0.0%) |
| Total (Overall) | 111 (25.1%) | 331 (74.9%) |
Production, Transportation and Moving Occupations
The most common Production, Transportation and Moving occupations in Flordell Hills are Production (67 | 15.2%), Material Moving (19 | 4.3%), and Transportation (8 | 1.8%).
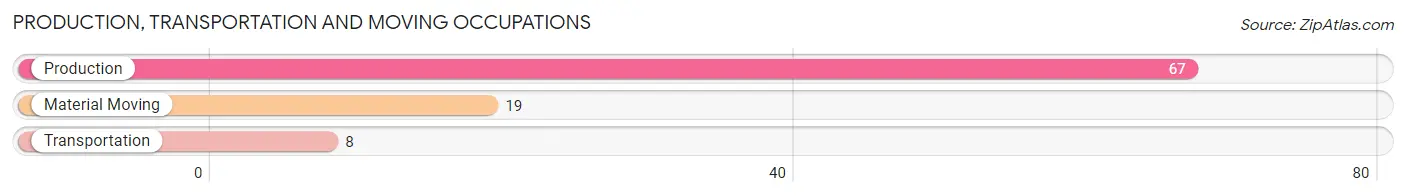
Production, Transportation and Moving Occupations by Sex
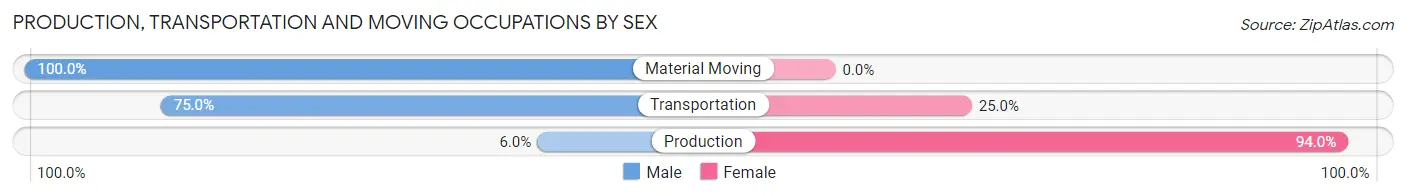
| Occupation | Male | Female |
| Production | 4 (6.0%) | 63 (94.0%) |
| Transportation | 6 (75.0%) | 2 (25.0%) |
| Material Moving | 19 (100.0%) | 0 (0.0%) |
| Total (Category) | 29 (30.8%) | 65 (69.2%) |
| Total (Overall) | 111 (25.1%) | 331 (74.9%) |
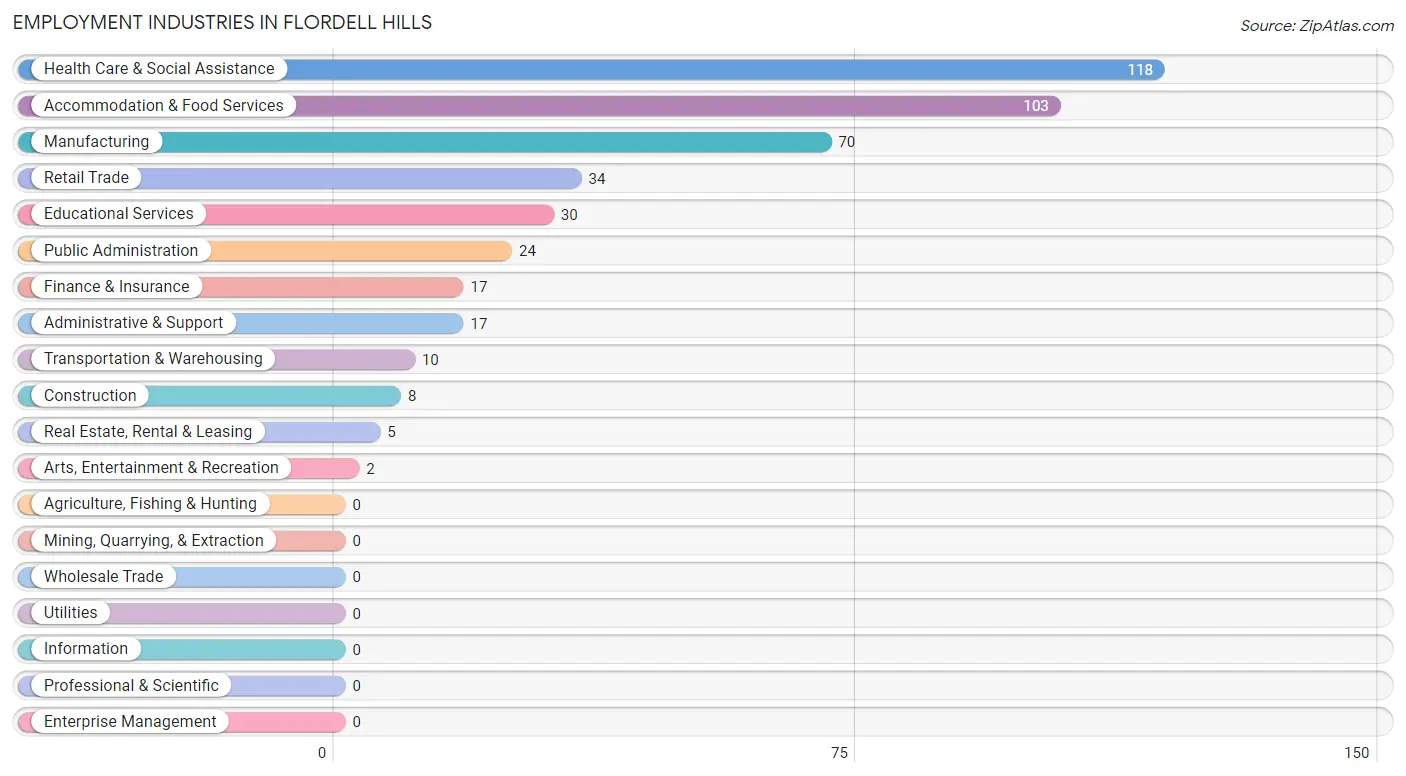
Employment Industries by Sex in Flordell Hills
Employment Industries in Flordell Hills
The major employment industries in Flordell Hills include Health Care & Social Assistance (118 | 26.7%), Accommodation & Food Services (103 | 23.3%), Manufacturing (70 | 15.8%), Retail Trade (34 | 7.7%), and Educational Services (30 | 6.8%).
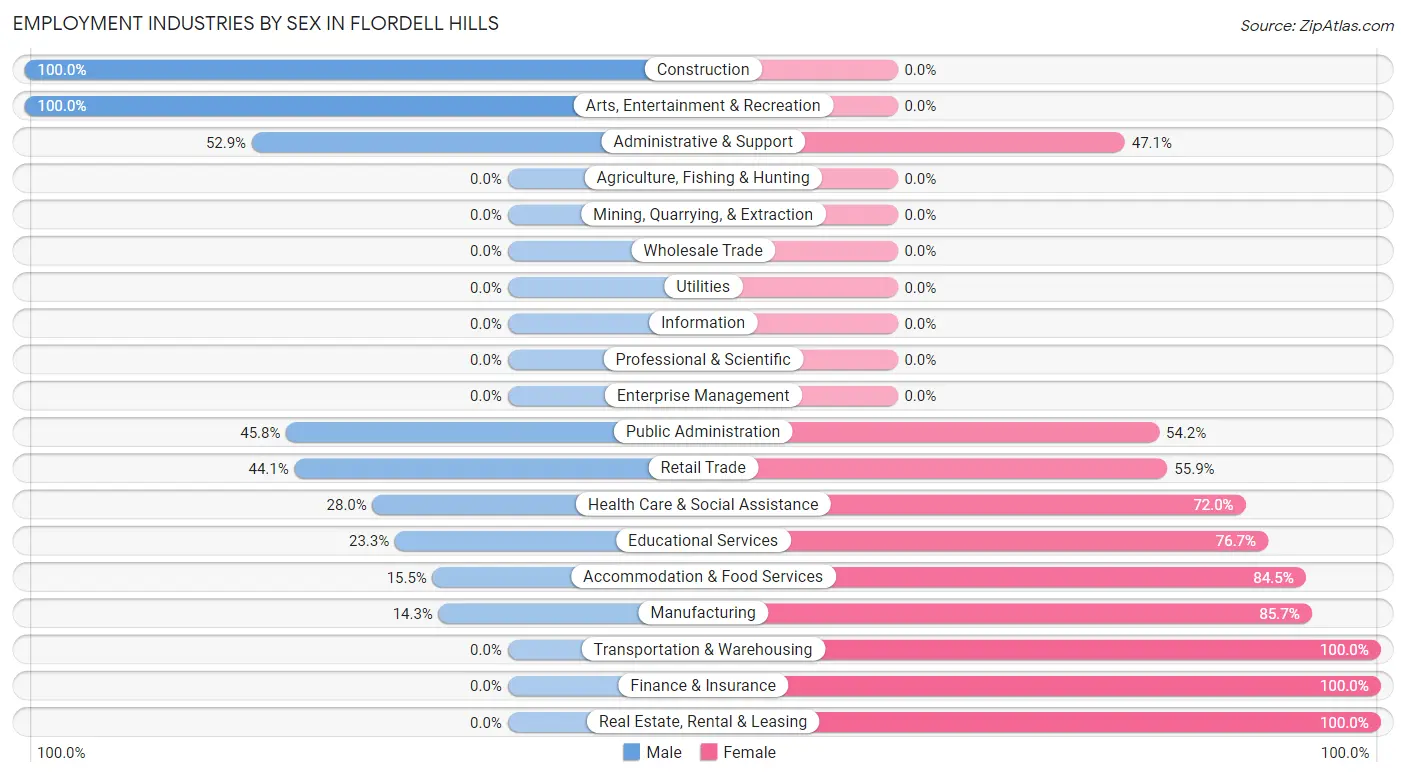
Employment Industries by Sex in Flordell Hills
The Flordell Hills industries that see more men than women are Construction (100.0%), Arts, Entertainment & Recreation (100.0%), and Administrative & Support (52.9%), whereas the industries that tend to have a higher number of women are Transportation & Warehousing (100.0%), Finance & Insurance (100.0%), and Real Estate, Rental & Leasing (100.0%).
| Industry | Male | Female |
| Agriculture, Fishing & Hunting | 0 (0.0%) | 0 (0.0%) |
| Mining, Quarrying, & Extraction | 0 (0.0%) | 0 (0.0%) |
| Construction | 8 (100.0%) | 0 (0.0%) |
| Manufacturing | 10 (14.3%) | 60 (85.7%) |
| Wholesale Trade | 0 (0.0%) | 0 (0.0%) |
| Retail Trade | 15 (44.1%) | 19 (55.9%) |
| Transportation & Warehousing | 0 (0.0%) | 10 (100.0%) |
| Utilities | 0 (0.0%) | 0 (0.0%) |
| Information | 0 (0.0%) | 0 (0.0%) |
| Finance & Insurance | 0 (0.0%) | 17 (100.0%) |
| Real Estate, Rental & Leasing | 0 (0.0%) | 5 (100.0%) |
| Professional & Scientific | 0 (0.0%) | 0 (0.0%) |
| Enterprise Management | 0 (0.0%) | 0 (0.0%) |
| Administrative & Support | 9 (52.9%) | 8 (47.1%) |
| Educational Services | 7 (23.3%) | 23 (76.7%) |
| Health Care & Social Assistance | 33 (28.0%) | 85 (72.0%) |
| Arts, Entertainment & Recreation | 2 (100.0%) | 0 (0.0%) |
| Accommodation & Food Services | 16 (15.5%) | 87 (84.5%) |
| Public Administration | 11 (45.8%) | 13 (54.2%) |
| Total | 111 (25.1%) | 331 (74.9%) |
Education in Flordell Hills
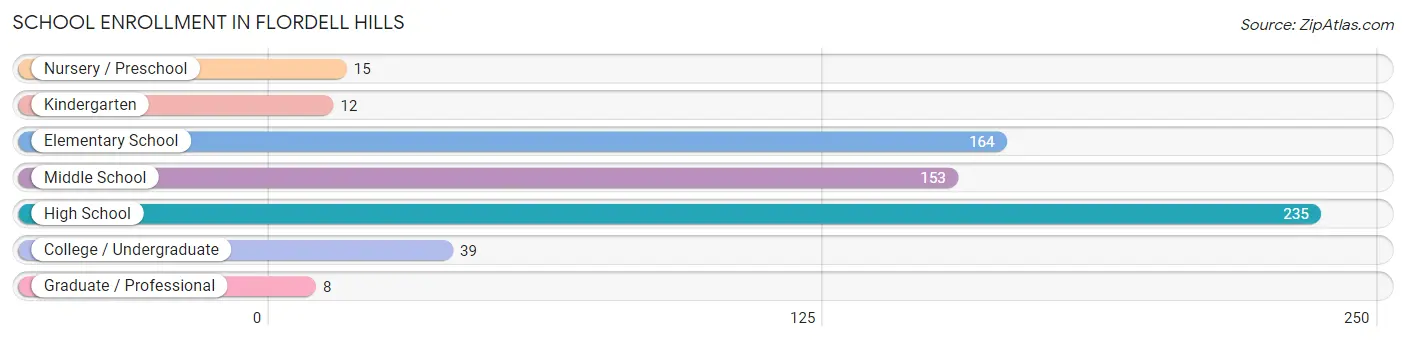
School Enrollment in Flordell Hills
The most common levels of schooling among the 626 students in Flordell Hills are high school (235 | 37.5%), elementary school (164 | 26.2%), and middle school (153 | 24.4%).
| School Level | # Students | % Students |
| Nursery / Preschool | 15 | 2.4% |
| Kindergarten | 12 | 1.9% |
| Elementary School | 164 | 26.2% |
| Middle School | 153 | 24.4% |
| High School | 235 | 37.5% |
| College / Undergraduate | 39 | 6.2% |
| Graduate / Professional | 8 | 1.3% |
| Total | 626 | 100.0% |
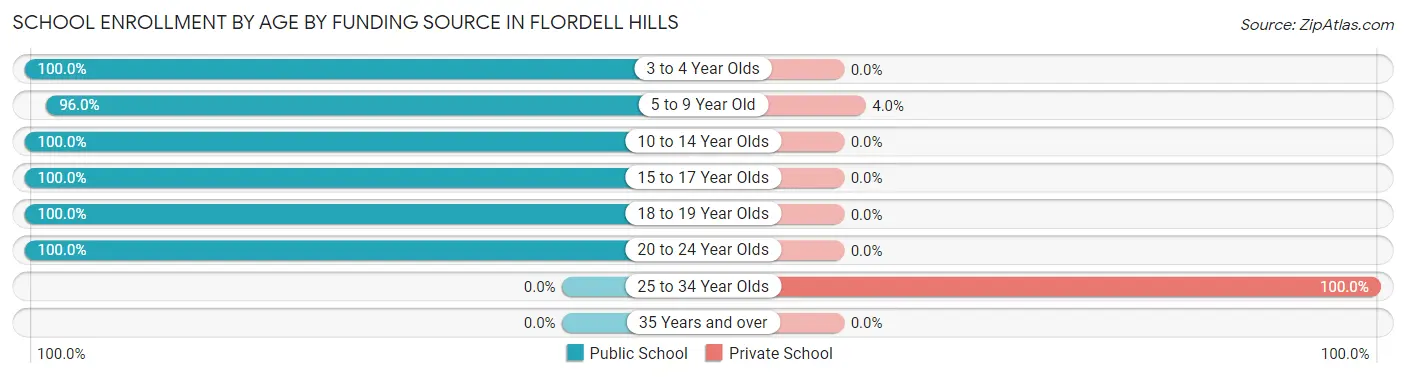
School Enrollment by Age by Funding Source in Flordell Hills
Out of a total of 626 students who are enrolled in schools in Flordell Hills, 30 (4.8%) attend a private institution, while the remaining 596 (95.2%) are enrolled in public schools. The age group of 25 to 34 year olds has the highest likelihood of being enrolled in private schools, with 24 (100.0% in the age bracket) enrolled. Conversely, the age group of 3 to 4 year olds has the lowest likelihood of being enrolled in a private school, with 15 (100.0% in the age bracket) attending a public institution.
| Age Bracket | Public School | Private School |
| 3 to 4 Year Olds | 15 (100.0%) | 0 (0.0%) |
| 5 to 9 Year Old | 143 (96.0%) | 6 (4.0%) |
| 10 to 14 Year Olds | 264 (100.0%) | 0 (0.0%) |
| 15 to 17 Year Olds | 148 (100.0%) | 0 (0.0%) |
| 18 to 19 Year Olds | 15 (100.0%) | 0 (0.0%) |
| 20 to 24 Year Olds | 11 (100.0%) | 0 (0.0%) |
| 25 to 34 Year Olds | 0 (0.0%) | 24 (100.0%) |
| 35 Years and over | 0 (0.0%) | 0 (0.0%) |
| Total | 596 (95.2%) | 30 (4.8%) |
Educational Attainment by Field of Study in Flordell Hills
Bio, nature & agricultural (45 | 56.2%), social sciences (14 | 17.5%), business (12 | 15.0%), arts & humanities (4 | 5.0%), and liberal arts & history (3 | 3.7%) are the most common fields of study among 80 individuals in Flordell Hills who have obtained a bachelor's degree or higher.
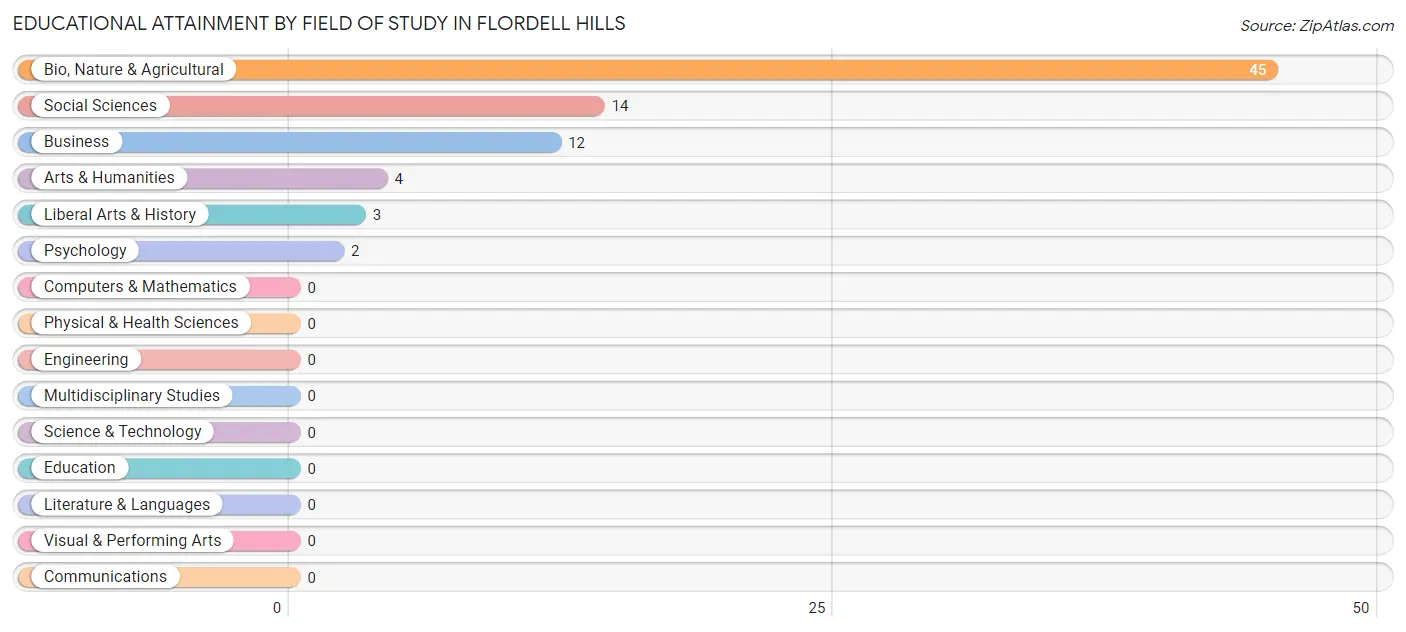
| Field of Study | # Graduates | % Graduates |
| Computers & Mathematics | 0 | 0.0% |
| Bio, Nature & Agricultural | 45 | 56.2% |
| Physical & Health Sciences | 0 | 0.0% |
| Psychology | 2 | 2.5% |
| Social Sciences | 14 | 17.5% |
| Engineering | 0 | 0.0% |
| Multidisciplinary Studies | 0 | 0.0% |
| Science & Technology | 0 | 0.0% |
| Business | 12 | 15.0% |
| Education | 0 | 0.0% |
| Literature & Languages | 0 | 0.0% |
| Liberal Arts & History | 3 | 3.7% |
| Visual & Performing Arts | 0 | 0.0% |
| Communications | 0 | 0.0% |
| Arts & Humanities | 4 | 5.0% |
| Total | 80 | 100.0% |
Transportation & Commute in Flordell Hills
Vehicle Availability by Sex in Flordell Hills
The most prevalent vehicle ownership categories in Flordell Hills are males with 1 vehicle (54, accounting for 48.6%) and females with 1 vehicle (180, making up 16.3%).
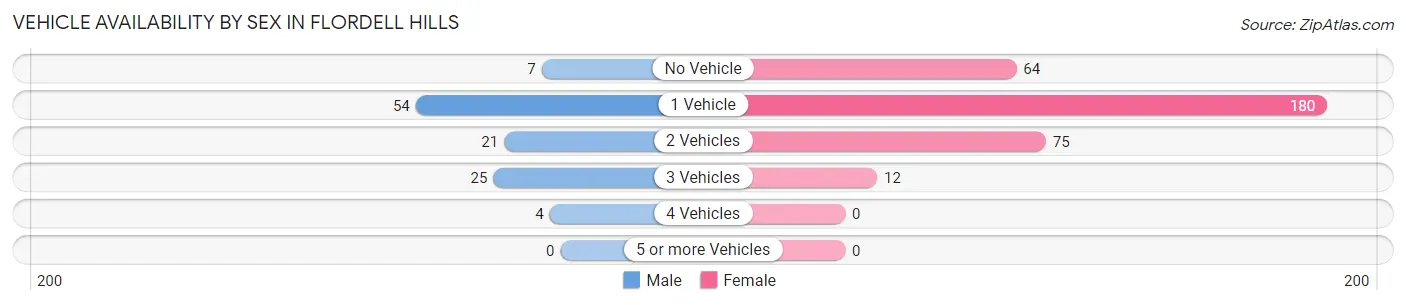
| Vehicles Available | Male | Female |
| No Vehicle | 7 (6.3%) | 64 (19.3%) |
| 1 Vehicle | 54 (48.6%) | 180 (54.4%) |
| 2 Vehicles | 21 (18.9%) | 75 (22.7%) |
| 3 Vehicles | 25 (22.5%) | 12 (3.6%) |
| 4 Vehicles | 4 (3.6%) | 0 (0.0%) |
| 5 or more Vehicles | 0 (0.0%) | 0 (0.0%) |
| Total | 111 (100.0%) | 331 (100.0%) |
Commute Time in Flordell Hills
The most frequently occuring commute durations in Flordell Hills are 20 to 24 minutes (187 commuters, 42.3%), 15 to 19 minutes (77 commuters, 17.4%), and 5 to 9 minutes (53 commuters, 12.0%).
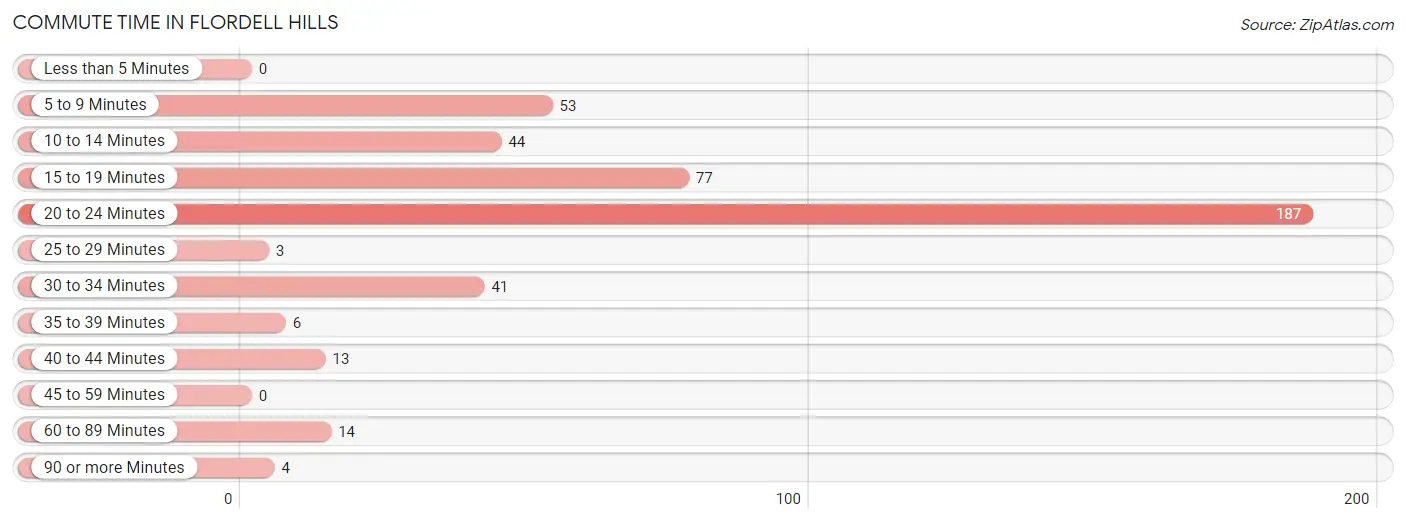
| Commute Time | # Commuters | % Commuters |
| Less than 5 Minutes | 0 | 0.0% |
| 5 to 9 Minutes | 53 | 12.0% |
| 10 to 14 Minutes | 44 | 10.0% |
| 15 to 19 Minutes | 77 | 17.4% |
| 20 to 24 Minutes | 187 | 42.3% |
| 25 to 29 Minutes | 3 | 0.7% |
| 30 to 34 Minutes | 41 | 9.3% |
| 35 to 39 Minutes | 6 | 1.4% |
| 40 to 44 Minutes | 13 | 2.9% |
| 45 to 59 Minutes | 0 | 0.0% |
| 60 to 89 Minutes | 14 | 3.2% |
| 90 or more Minutes | 4 | 0.9% |
Commute Time by Sex in Flordell Hills
The most common commute times in Flordell Hills are 20 to 24 minutes (38 commuters, 34.2%) for males and 20 to 24 minutes (149 commuters, 45.0%) for females.
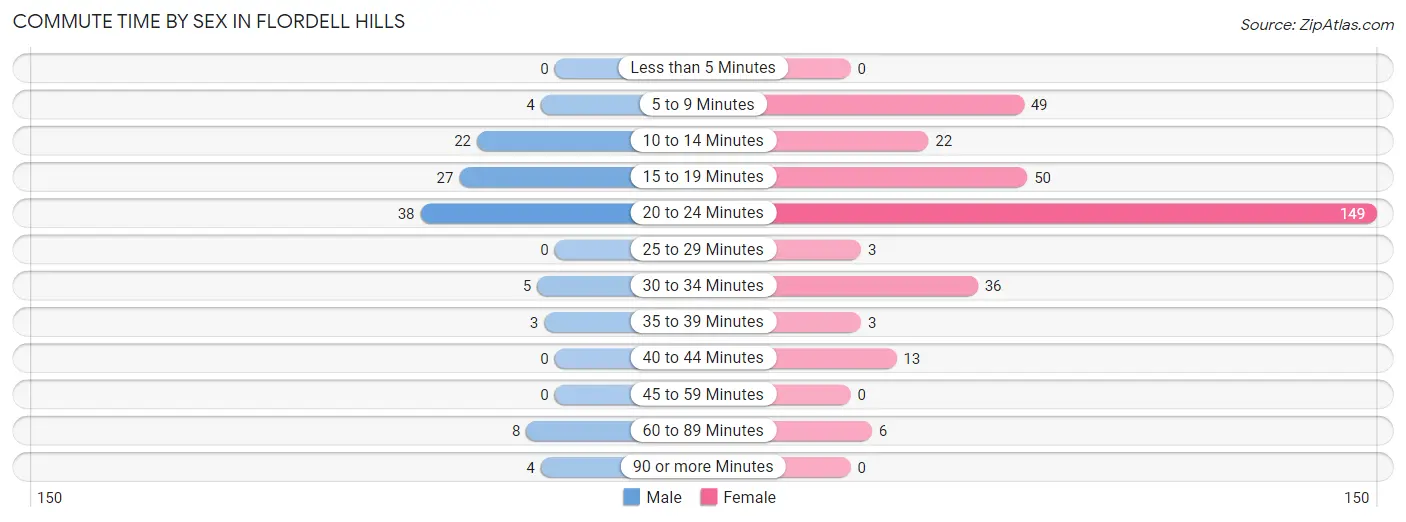
| Commute Time | Male | Female |
| Less than 5 Minutes | 0 (0.0%) | 0 (0.0%) |
| 5 to 9 Minutes | 4 (3.6%) | 49 (14.8%) |
| 10 to 14 Minutes | 22 (19.8%) | 22 (6.7%) |
| 15 to 19 Minutes | 27 (24.3%) | 50 (15.1%) |
| 20 to 24 Minutes | 38 (34.2%) | 149 (45.0%) |
| 25 to 29 Minutes | 0 (0.0%) | 3 (0.9%) |
| 30 to 34 Minutes | 5 (4.5%) | 36 (10.9%) |
| 35 to 39 Minutes | 3 (2.7%) | 3 (0.9%) |
| 40 to 44 Minutes | 0 (0.0%) | 13 (3.9%) |
| 45 to 59 Minutes | 0 (0.0%) | 0 (0.0%) |
| 60 to 89 Minutes | 8 (7.2%) | 6 (1.8%) |
| 90 or more Minutes | 4 (3.6%) | 0 (0.0%) |
Time of Departure to Work by Sex in Flordell Hills
The most frequent times of departure to work in Flordell Hills are 12:00 PM to 3:59 PM (28, 25.2%) for males and 6:00 AM to 6:29 AM (87, 26.3%) for females.
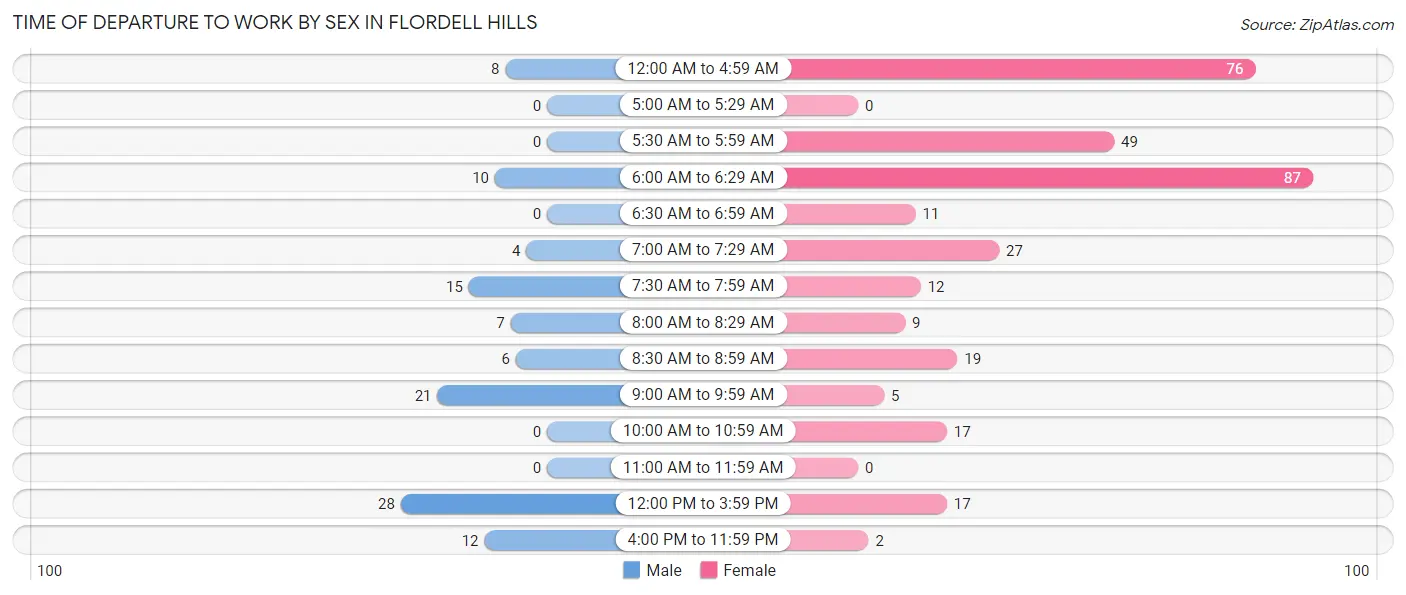
| Time of Departure | Male | Female |
| 12:00 AM to 4:59 AM | 8 (7.2%) | 76 (23.0%) |
| 5:00 AM to 5:29 AM | 0 (0.0%) | 0 (0.0%) |
| 5:30 AM to 5:59 AM | 0 (0.0%) | 49 (14.8%) |
| 6:00 AM to 6:29 AM | 10 (9.0%) | 87 (26.3%) |
| 6:30 AM to 6:59 AM | 0 (0.0%) | 11 (3.3%) |
| 7:00 AM to 7:29 AM | 4 (3.6%) | 27 (8.2%) |
| 7:30 AM to 7:59 AM | 15 (13.5%) | 12 (3.6%) |
| 8:00 AM to 8:29 AM | 7 (6.3%) | 9 (2.7%) |
| 8:30 AM to 8:59 AM | 6 (5.4%) | 19 (5.7%) |
| 9:00 AM to 9:59 AM | 21 (18.9%) | 5 (1.5%) |
| 10:00 AM to 10:59 AM | 0 (0.0%) | 17 (5.1%) |
| 11:00 AM to 11:59 AM | 0 (0.0%) | 0 (0.0%) |
| 12:00 PM to 3:59 PM | 28 (25.2%) | 17 (5.1%) |
| 4:00 PM to 11:59 PM | 12 (10.8%) | 2 (0.6%) |
| Total | 111 (100.0%) | 331 (100.0%) |
Housing Occupancy in Flordell Hills
Occupancy by Ownership in Flordell Hills
Of the total 519 dwellings in Flordell Hills, owner-occupied units account for 155 (29.9%), while renter-occupied units make up 364 (70.1%).
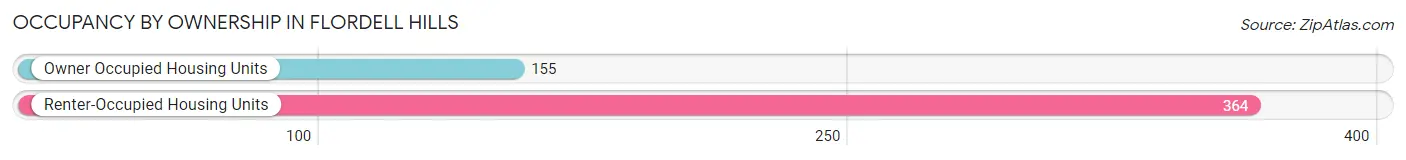
| Occupancy | # Housing Units | % Housing Units |
| Owner Occupied Housing Units | 155 | 29.9% |
| Renter-Occupied Housing Units | 364 | 70.1% |
| Total Occupied Housing Units | 519 | 100.0% |
Occupancy by Household Size in Flordell Hills

| Household Size | # Housing Units | % Housing Units |
| 1-Person Household | 107 | 20.6% |
| 2-Person Household | 181 | 34.9% |
| 3-Person Household | 64 | 12.3% |
| 4+ Person Household | 167 | 32.2% |
| Total Housing Units | 519 | 100.0% |
Occupancy by Ownership by Household Size in Flordell Hills
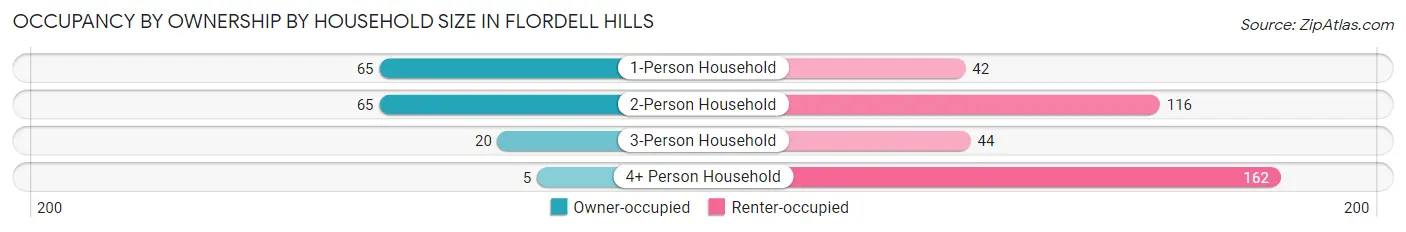
| Household Size | Owner-occupied | Renter-occupied |
| 1-Person Household | 65 (60.8%) | 42 (39.3%) |
| 2-Person Household | 65 (35.9%) | 116 (64.1%) |
| 3-Person Household | 20 (31.2%) | 44 (68.8%) |
| 4+ Person Household | 5 (3.0%) | 162 (97.0%) |
| Total Housing Units | 155 (29.9%) | 364 (70.1%) |
Occupancy by Educational Attainment in Flordell Hills
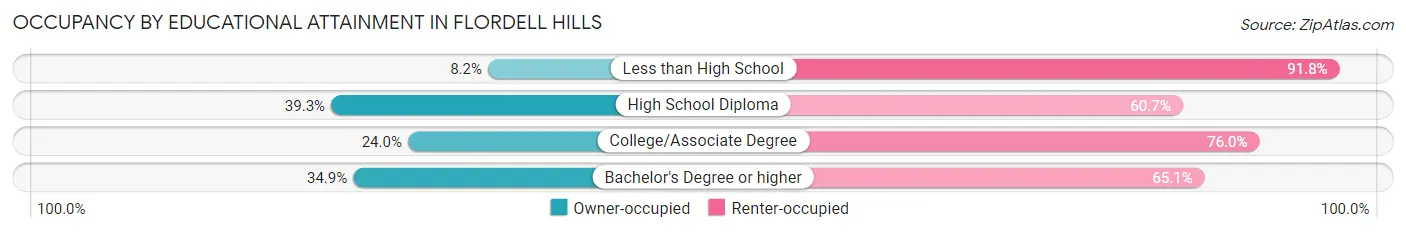
| Household Size | Owner-occupied | Renter-occupied |
| Less than High School | 4 (8.2%) | 45 (91.8%) |
| High School Diploma | 86 (39.3%) | 133 (60.7%) |
| College/Associate Degree | 50 (24.0%) | 158 (76.0%) |
| Bachelor's Degree or higher | 15 (34.9%) | 28 (65.1%) |
Occupancy by Age of Householder in Flordell Hills
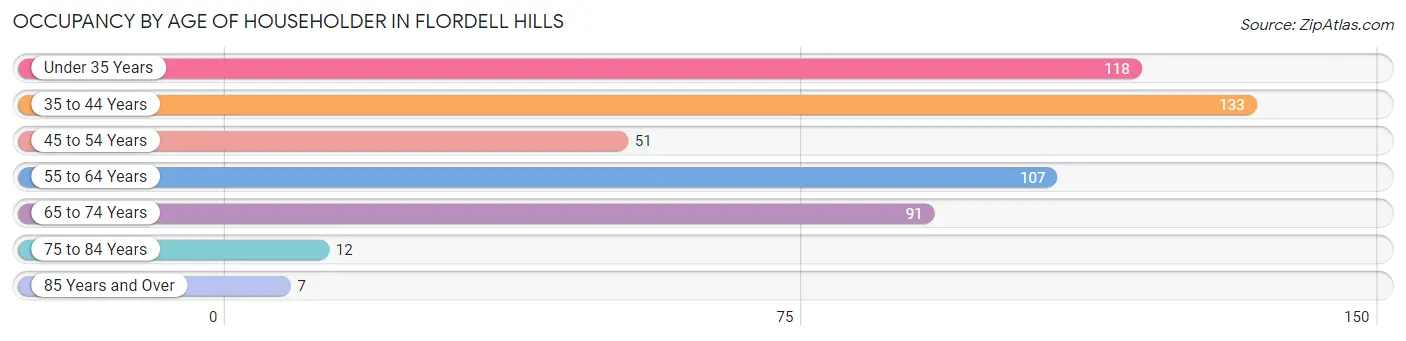
| Age Bracket | # Households | % Households |
| Under 35 Years | 118 | 22.7% |
| 35 to 44 Years | 133 | 25.6% |
| 45 to 54 Years | 51 | 9.8% |
| 55 to 64 Years | 107 | 20.6% |
| 65 to 74 Years | 91 | 17.5% |
| 75 to 84 Years | 12 | 2.3% |
| 85 Years and Over | 7 | 1.3% |
| Total | 519 | 100.0% |
Housing Finances in Flordell Hills
Median Income by Occupancy in Flordell Hills
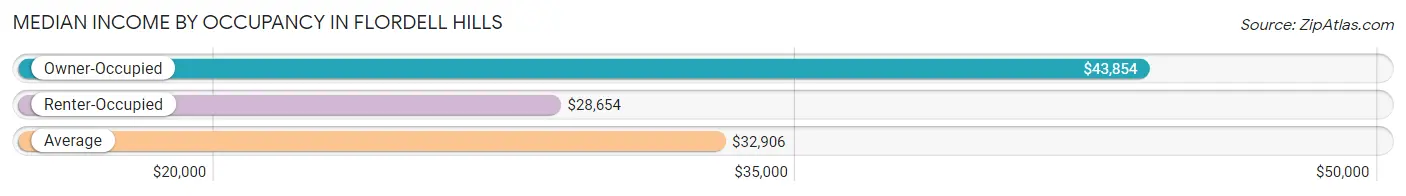
| Occupancy Type | # Households | Median Income |
| Owner-Occupied | 155 (29.9%) | $43,854 |
| Renter-Occupied | 364 (70.1%) | $28,654 |
| Average | 519 (100.0%) | $32,906 |
Occupancy by Householder Income Bracket in Flordell Hills
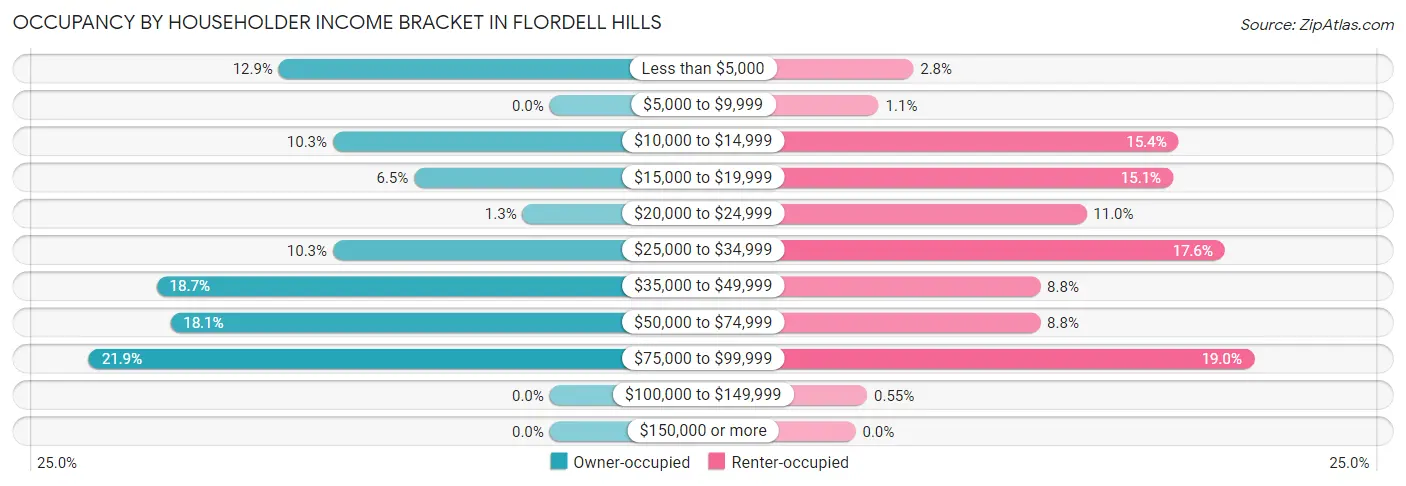
| Income Bracket | Owner-occupied | Renter-occupied |
| Less than $5,000 | 20 (12.9%) | 10 (2.8%) |
| $5,000 to $9,999 | 0 (0.0%) | 4 (1.1%) |
| $10,000 to $14,999 | 16 (10.3%) | 56 (15.4%) |
| $15,000 to $19,999 | 10 (6.5%) | 55 (15.1%) |
| $20,000 to $24,999 | 2 (1.3%) | 40 (11.0%) |
| $25,000 to $34,999 | 16 (10.3%) | 64 (17.6%) |
| $35,000 to $49,999 | 29 (18.7%) | 32 (8.8%) |
| $50,000 to $74,999 | 28 (18.1%) | 32 (8.8%) |
| $75,000 to $99,999 | 34 (21.9%) | 69 (19.0%) |
| $100,000 to $149,999 | 0 (0.0%) | 2 (0.5%) |
| $150,000 or more | 0 (0.0%) | 0 (0.0%) |
| Total | 155 (100.0%) | 364 (100.0%) |
Monthly Housing Cost Tiers in Flordell Hills
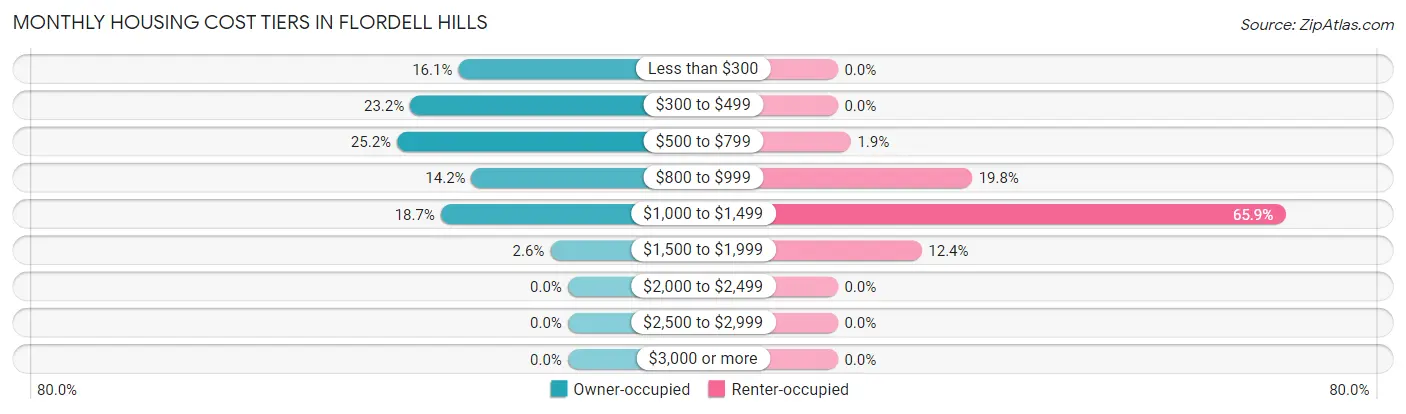
| Monthly Cost | Owner-occupied | Renter-occupied |
| Less than $300 | 25 (16.1%) | 0 (0.0%) |
| $300 to $499 | 36 (23.2%) | 0 (0.0%) |
| $500 to $799 | 39 (25.2%) | 7 (1.9%) |
| $800 to $999 | 22 (14.2%) | 72 (19.8%) |
| $1,000 to $1,499 | 29 (18.7%) | 240 (65.9%) |
| $1,500 to $1,999 | 4 (2.6%) | 45 (12.4%) |
| $2,000 to $2,499 | 0 (0.0%) | 0 (0.0%) |
| $2,500 to $2,999 | 0 (0.0%) | 0 (0.0%) |
| $3,000 or more | 0 (0.0%) | 0 (0.0%) |
| Total | 155 (100.0%) | 364 (100.0%) |
Physical Housing Characteristics in Flordell Hills
Housing Structures in Flordell Hills
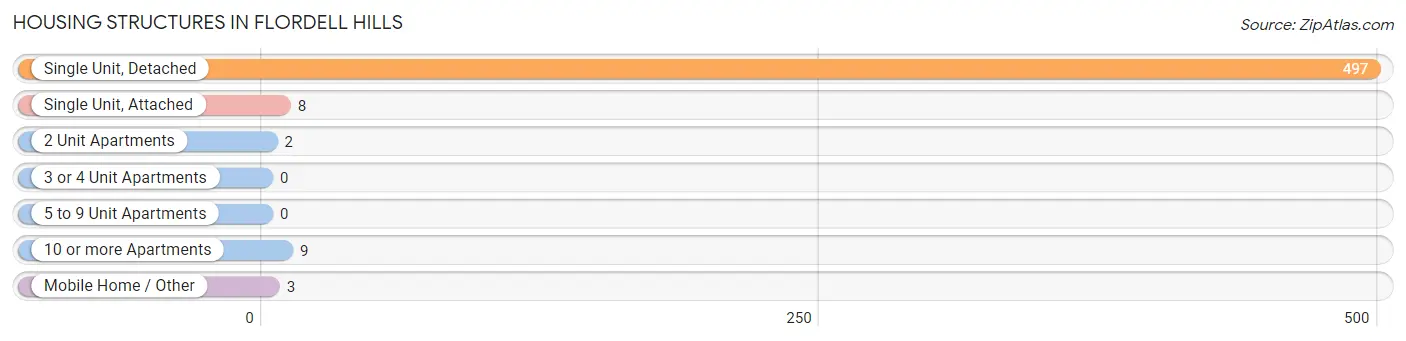
| Structure Type | # Housing Units | % Housing Units |
| Single Unit, Detached | 497 | 95.8% |
| Single Unit, Attached | 8 | 1.5% |
| 2 Unit Apartments | 2 | 0.4% |
| 3 or 4 Unit Apartments | 0 | 0.0% |
| 5 to 9 Unit Apartments | 0 | 0.0% |
| 10 or more Apartments | 9 | 1.7% |
| Mobile Home / Other | 3 | 0.6% |
| Total | 519 | 100.0% |
Housing Structures by Occupancy in Flordell Hills
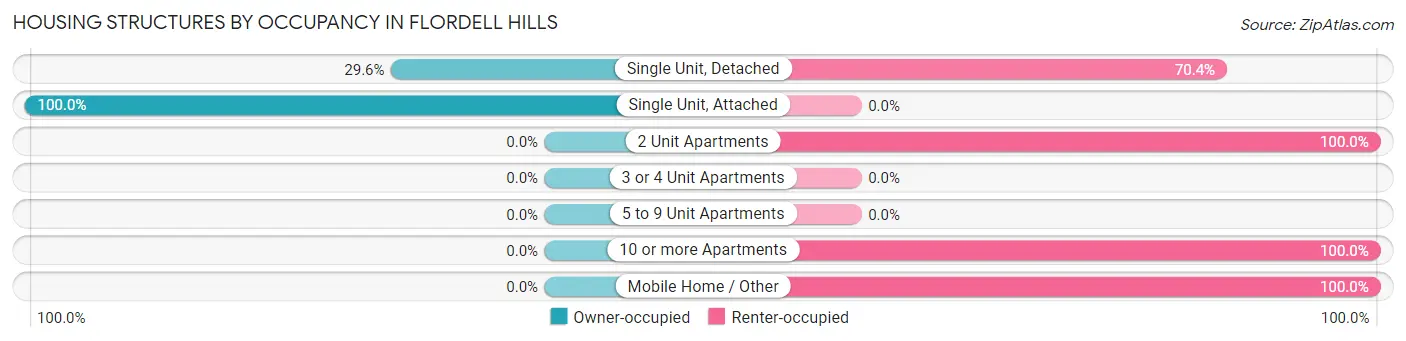
| Structure Type | Owner-occupied | Renter-occupied |
| Single Unit, Detached | 147 (29.6%) | 350 (70.4%) |
| Single Unit, Attached | 8 (100.0%) | 0 (0.0%) |
| 2 Unit Apartments | 0 (0.0%) | 2 (100.0%) |
| 3 or 4 Unit Apartments | 0 (0.0%) | 0 (0.0%) |
| 5 to 9 Unit Apartments | 0 (0.0%) | 0 (0.0%) |
| 10 or more Apartments | 0 (0.0%) | 9 (100.0%) |
| Mobile Home / Other | 0 (0.0%) | 3 (100.0%) |
| Total | 155 (29.9%) | 364 (70.1%) |
Housing Structures by Number of Rooms in Flordell Hills
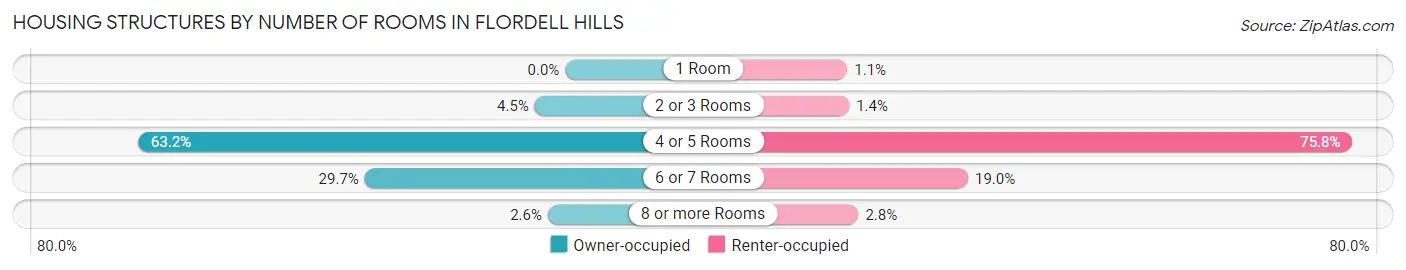
| Number of Rooms | Owner-occupied | Renter-occupied |
| 1 Room | 0 (0.0%) | 4 (1.1%) |
| 2 or 3 Rooms | 7 (4.5%) | 5 (1.4%) |
| 4 or 5 Rooms | 98 (63.2%) | 276 (75.8%) |
| 6 or 7 Rooms | 46 (29.7%) | 69 (19.0%) |
| 8 or more Rooms | 4 (2.6%) | 10 (2.8%) |
| Total | 155 (100.0%) | 364 (100.0%) |
Housing Structure by Heating Type in Flordell Hills
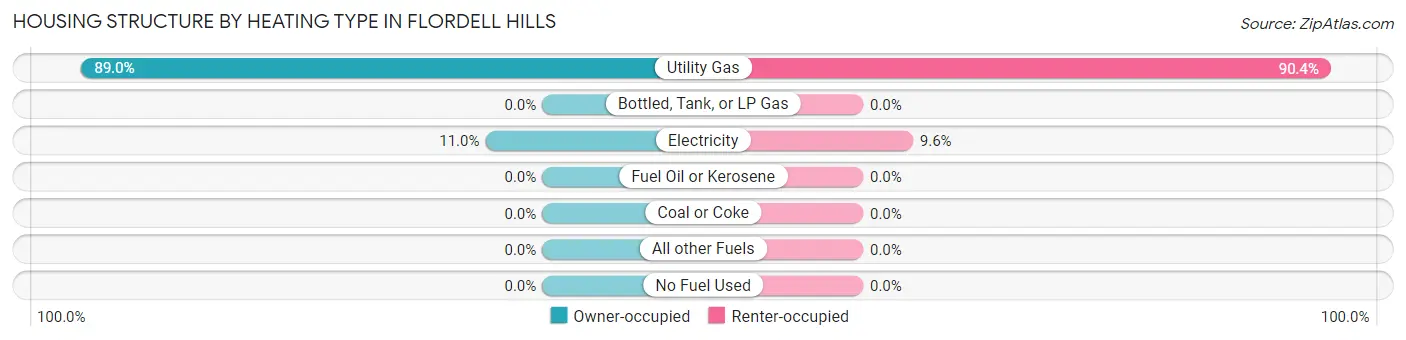
| Heating Type | Owner-occupied | Renter-occupied |
| Utility Gas | 138 (89.0%) | 329 (90.4%) |
| Bottled, Tank, or LP Gas | 0 (0.0%) | 0 (0.0%) |
| Electricity | 17 (11.0%) | 35 (9.6%) |
| Fuel Oil or Kerosene | 0 (0.0%) | 0 (0.0%) |
| Coal or Coke | 0 (0.0%) | 0 (0.0%) |
| All other Fuels | 0 (0.0%) | 0 (0.0%) |
| No Fuel Used | 0 (0.0%) | 0 (0.0%) |
| Total | 155 (100.0%) | 364 (100.0%) |
Household Vehicle Usage in Flordell Hills
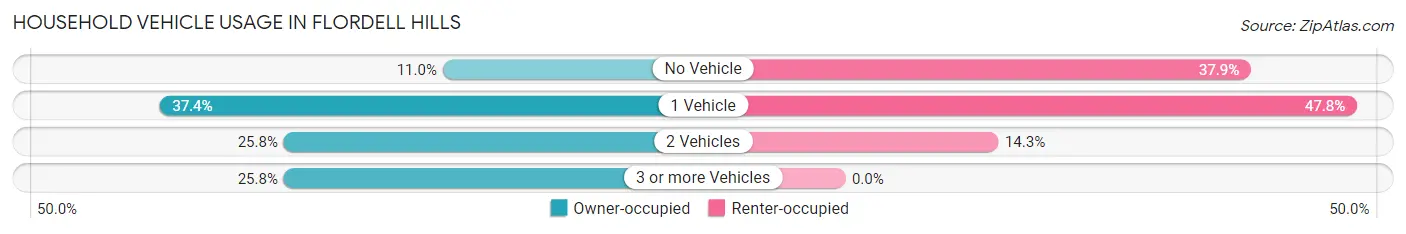
| Vehicles per Household | Owner-occupied | Renter-occupied |
| No Vehicle | 17 (11.0%) | 138 (37.9%) |
| 1 Vehicle | 58 (37.4%) | 174 (47.8%) |
| 2 Vehicles | 40 (25.8%) | 52 (14.3%) |
| 3 or more Vehicles | 40 (25.8%) | 0 (0.0%) |
| Total | 155 (100.0%) | 364 (100.0%) |
Real Estate & Mortgages in Flordell Hills
Real Estate and Mortgage Overview in Flordell Hills
| Characteristic | Without Mortgage | With Mortgage |
| Housing Units | 67 | 88 |
| Median Property Value | $54,300 | $51,700 |
| Median Household Income | $44,375 | $0 |
| Monthly Housing Costs | $354 | $0 |
| Real Estate Taxes | $883 | $4 |
Property Value by Mortgage Status in Flordell Hills
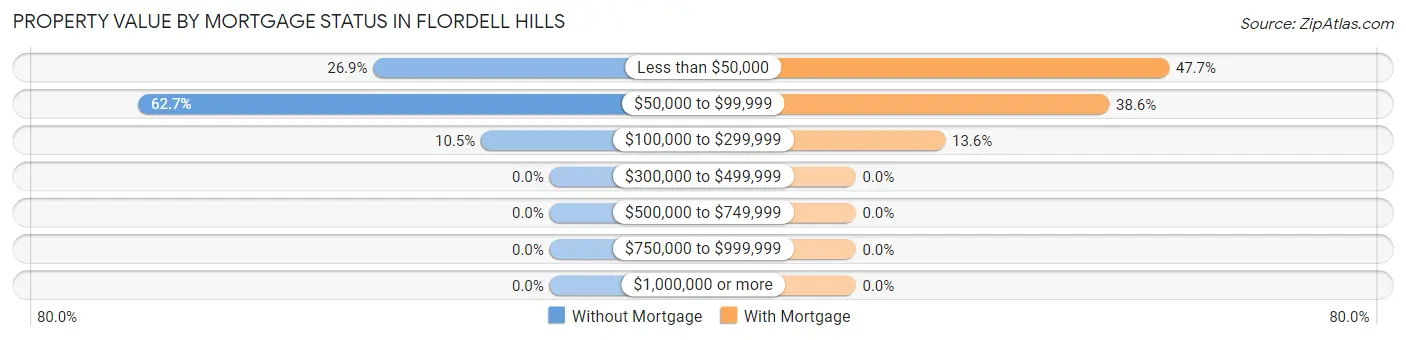
| Property Value | Without Mortgage | With Mortgage |
| Less than $50,000 | 18 (26.9%) | 42 (47.7%) |
| $50,000 to $99,999 | 42 (62.7%) | 34 (38.6%) |
| $100,000 to $299,999 | 7 (10.4%) | 12 (13.6%) |
| $300,000 to $499,999 | 0 (0.0%) | 0 (0.0%) |
| $500,000 to $749,999 | 0 (0.0%) | 0 (0.0%) |
| $750,000 to $999,999 | 0 (0.0%) | 0 (0.0%) |
| $1,000,000 or more | 0 (0.0%) | 0 (0.0%) |
| Total | 67 (100.0%) | 88 (100.0%) |
Household Income by Mortgage Status in Flordell Hills
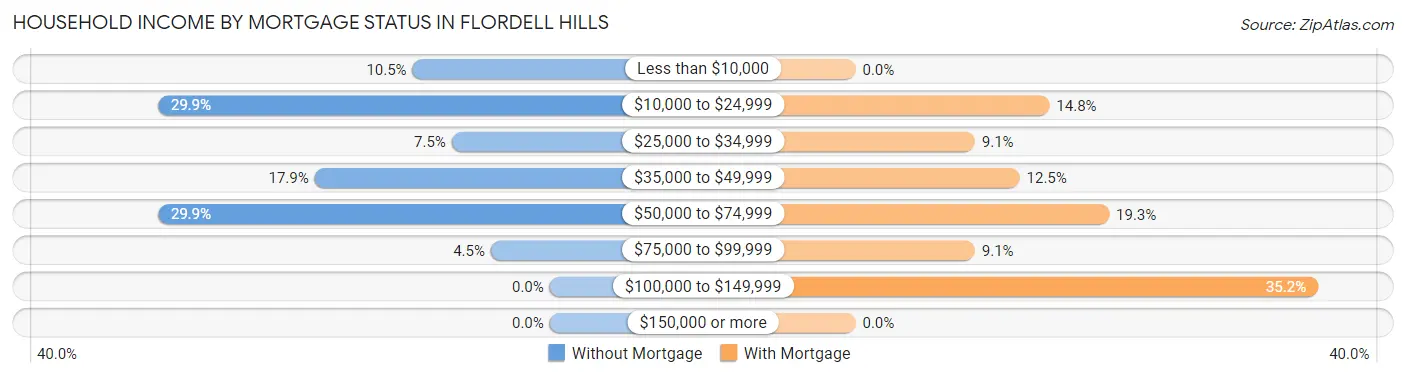
| Household Income | Without Mortgage | With Mortgage |
| Less than $10,000 | 7 (10.4%) | 0 (0.0%) |
| $10,000 to $24,999 | 20 (29.8%) | 13 (14.8%) |
| $25,000 to $34,999 | 5 (7.5%) | 8 (9.1%) |
| $35,000 to $49,999 | 12 (17.9%) | 11 (12.5%) |
| $50,000 to $74,999 | 20 (29.8%) | 17 (19.3%) |
| $75,000 to $99,999 | 3 (4.5%) | 8 (9.1%) |
| $100,000 to $149,999 | 0 (0.0%) | 31 (35.2%) |
| $150,000 or more | 0 (0.0%) | 0 (0.0%) |
| Total | 67 (100.0%) | 88 (100.0%) |
Property Value to Household Income Ratio in Flordell Hills
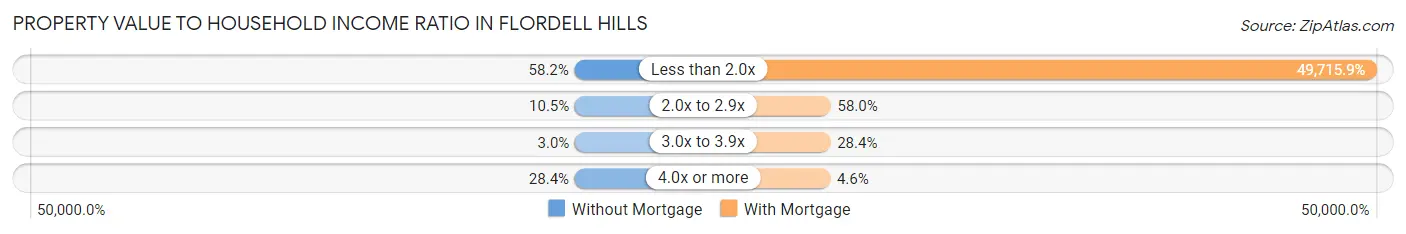
| Value-to-Income Ratio | Without Mortgage | With Mortgage |
| Less than 2.0x | 39 (58.2%) | 43,750 (49,715.9%) |
| 2.0x to 2.9x | 7 (10.4%) | 51 (58.0%) |
| 3.0x to 3.9x | 2 (3.0%) | 25 (28.4%) |
| 4.0x or more | 19 (28.4%) | 4 (4.5%) |
| Total | 67 (100.0%) | 88 (100.0%) |
Real Estate Taxes by Mortgage Status in Flordell Hills
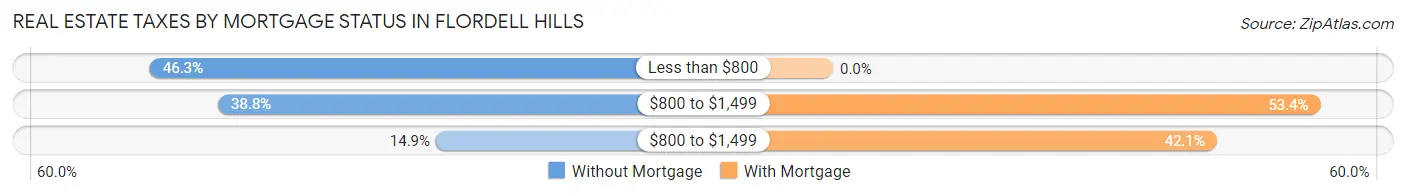
| Property Taxes | Without Mortgage | With Mortgage |
| Less than $800 | 31 (46.3%) | 0 (0.0%) |
| $800 to $1,499 | 26 (38.8%) | 47 (53.4%) |
| $800 to $1,499 | 10 (14.9%) | 37 (42.0%) |
| Total | 67 (100.0%) | 88 (100.0%) |
Health & Disability in Flordell Hills
Health Insurance Coverage by Age in Flordell Hills
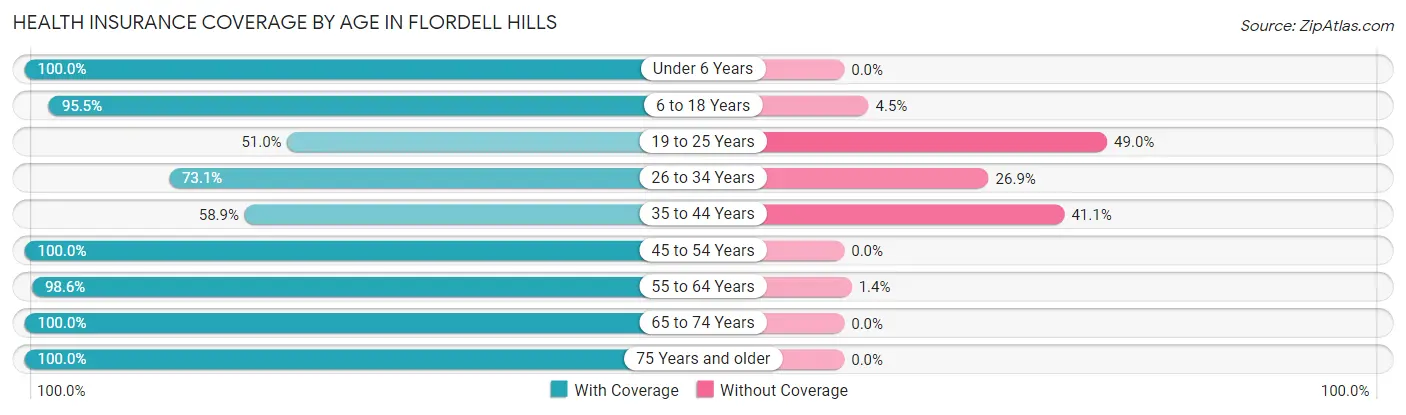
| Age Bracket | With Coverage | Without Coverage |
| Under 6 Years | 76 (100.0%) | 0 (0.0%) |
| 6 to 18 Years | 548 (95.5%) | 26 (4.5%) |
| 19 to 25 Years | 52 (51.0%) | 50 (49.0%) |
| 26 to 34 Years | 114 (73.1%) | 42 (26.9%) |
| 35 to 44 Years | 89 (58.9%) | 62 (41.1%) |
| 45 to 54 Years | 69 (100.0%) | 0 (0.0%) |
| 55 to 64 Years | 143 (98.6%) | 2 (1.4%) |
| 65 to 74 Years | 152 (100.0%) | 0 (0.0%) |
| 75 Years and older | 23 (100.0%) | 0 (0.0%) |
| Total | 1,266 (87.4%) | 182 (12.6%) |
Health Insurance Coverage by Citizenship Status in Flordell Hills
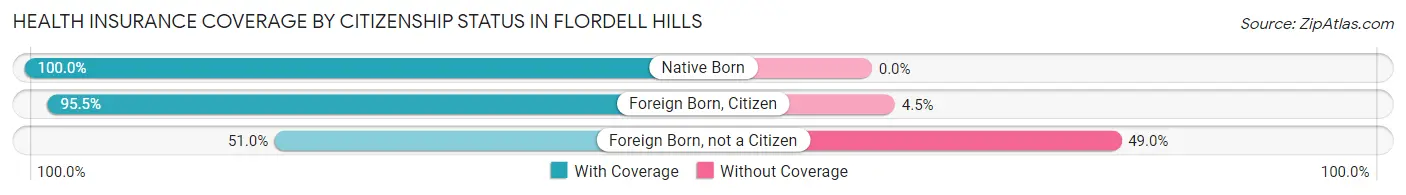
| Citizenship Status | With Coverage | Without Coverage |
| Native Born | 76 (100.0%) | 0 (0.0%) |
| Foreign Born, Citizen | 548 (95.5%) | 26 (4.5%) |
| Foreign Born, not a Citizen | 52 (51.0%) | 50 (49.0%) |
Health Insurance Coverage by Household Income in Flordell Hills
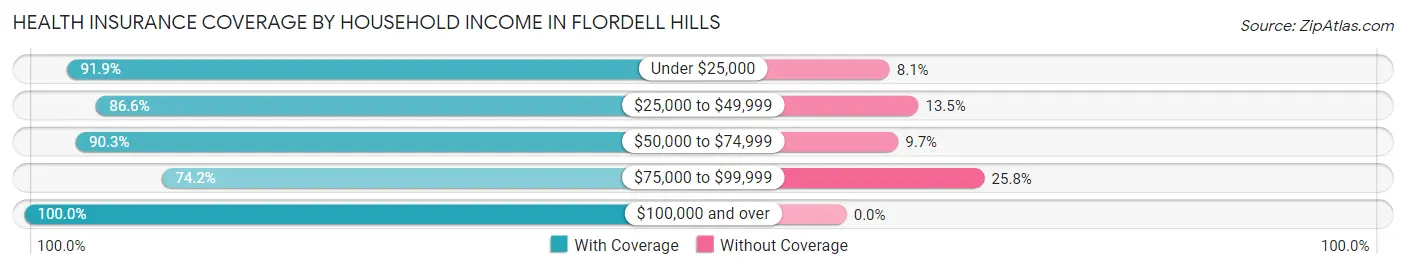
| Household Income | With Coverage | Without Coverage |
| Under $25,000 | 673 (91.9%) | 59 (8.1%) |
| $25,000 to $49,999 | 251 (86.6%) | 39 (13.5%) |
| $50,000 to $74,999 | 131 (90.3%) | 14 (9.7%) |
| $75,000 to $99,999 | 201 (74.2%) | 70 (25.8%) |
| $100,000 and over | 10 (100.0%) | 0 (0.0%) |
Public vs Private Health Insurance Coverage by Age in Flordell Hills
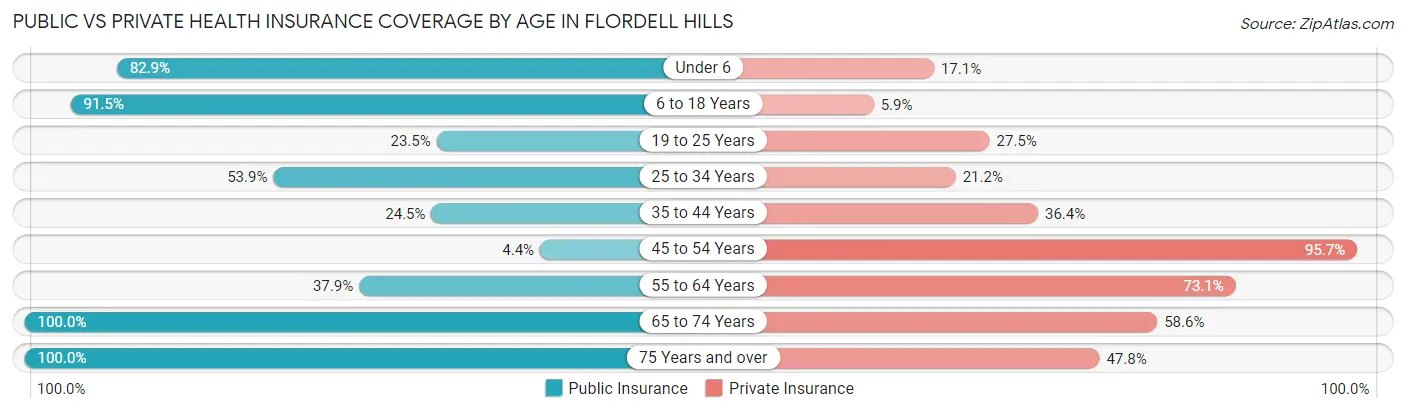
| Age Bracket | Public Insurance | Private Insurance |
| Under 6 | 63 (82.9%) | 13 (17.1%) |
| 6 to 18 Years | 525 (91.5%) | 34 (5.9%) |
| 19 to 25 Years | 24 (23.5%) | 28 (27.5%) |
| 25 to 34 Years | 84 (53.8%) | 33 (21.1%) |
| 35 to 44 Years | 37 (24.5%) | 55 (36.4%) |
| 45 to 54 Years | 3 (4.3%) | 66 (95.7%) |
| 55 to 64 Years | 55 (37.9%) | 106 (73.1%) |
| 65 to 74 Years | 152 (100.0%) | 89 (58.6%) |
| 75 Years and over | 23 (100.0%) | 11 (47.8%) |
| Total | 966 (66.7%) | 435 (30.0%) |
Disability Status by Sex by Age in Flordell Hills
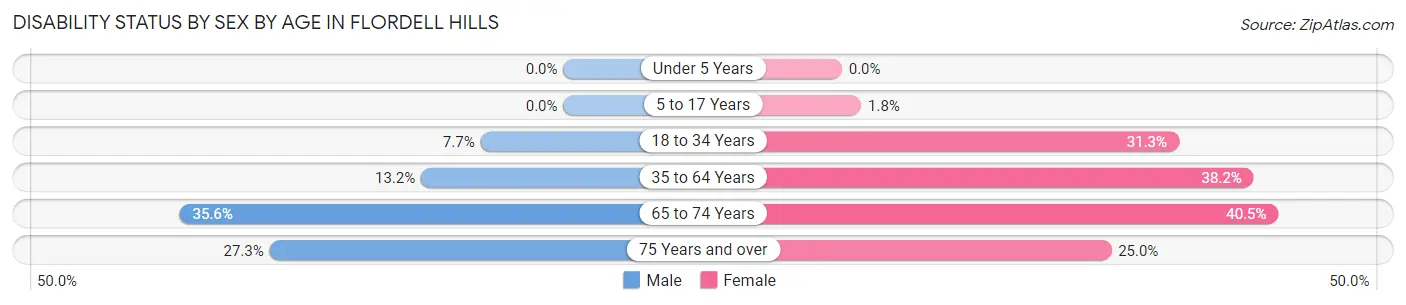
| Age Bracket | Male | Female |
| Under 5 Years | 0 (0.0%) | 0 (0.0%) |
| 5 to 17 Years | 0 (0.0%) | 6 (1.8%) |
| 18 to 34 Years | 6 (7.7%) | 61 (31.3%) |
| 35 to 64 Years | 14 (13.2%) | 99 (38.2%) |
| 65 to 74 Years | 26 (35.6%) | 32 (40.5%) |
| 75 Years and over | 3 (27.3%) | 3 (25.0%) |
Disability Class by Sex by Age in Flordell Hills
Disability Class: Hearing Difficulty
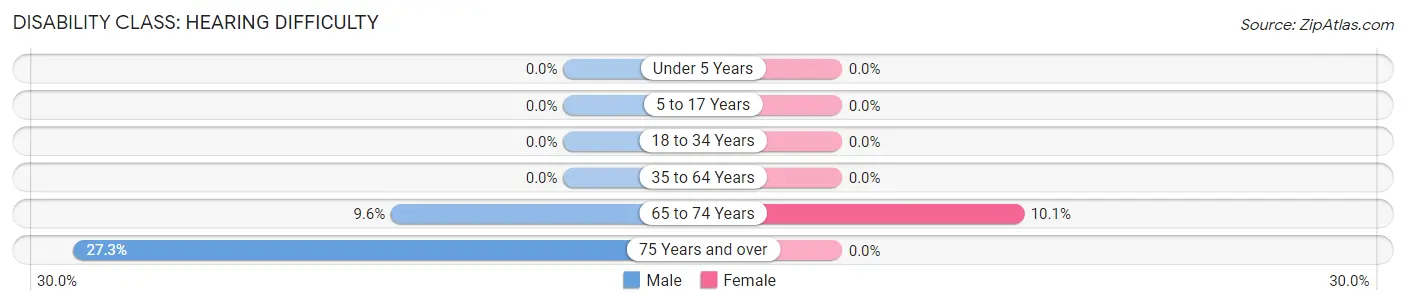
| Age Bracket | Male | Female |
| Under 5 Years | 0 (0.0%) | 0 (0.0%) |
| 5 to 17 Years | 0 (0.0%) | 0 (0.0%) |
| 18 to 34 Years | 0 (0.0%) | 0 (0.0%) |
| 35 to 64 Years | 0 (0.0%) | 0 (0.0%) |
| 65 to 74 Years | 7 (9.6%) | 8 (10.1%) |
| 75 Years and over | 3 (27.3%) | 0 (0.0%) |
Disability Class: Vision Difficulty
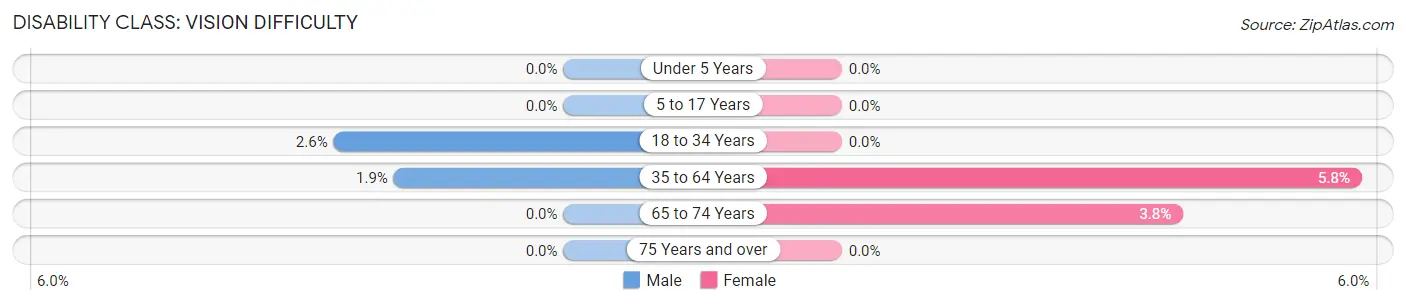
| Age Bracket | Male | Female |
| Under 5 Years | 0 (0.0%) | 0 (0.0%) |
| 5 to 17 Years | 0 (0.0%) | 0 (0.0%) |
| 18 to 34 Years | 2 (2.6%) | 0 (0.0%) |
| 35 to 64 Years | 2 (1.9%) | 15 (5.8%) |
| 65 to 74 Years | 0 (0.0%) | 3 (3.8%) |
| 75 Years and over | 0 (0.0%) | 0 (0.0%) |
Disability Class: Cognitive Difficulty
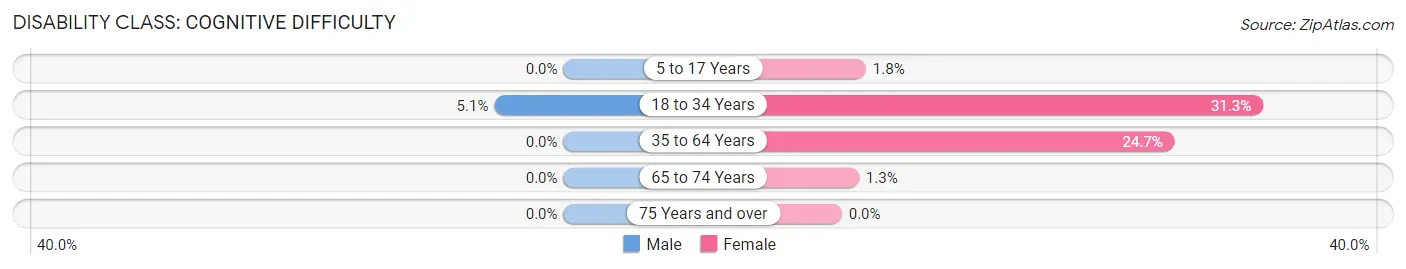
| Age Bracket | Male | Female |
| 5 to 17 Years | 0 (0.0%) | 6 (1.8%) |
| 18 to 34 Years | 4 (5.1%) | 61 (31.3%) |
| 35 to 64 Years | 0 (0.0%) | 64 (24.7%) |
| 65 to 74 Years | 0 (0.0%) | 1 (1.3%) |
| 75 Years and over | 0 (0.0%) | 0 (0.0%) |
Disability Class: Ambulatory Difficulty
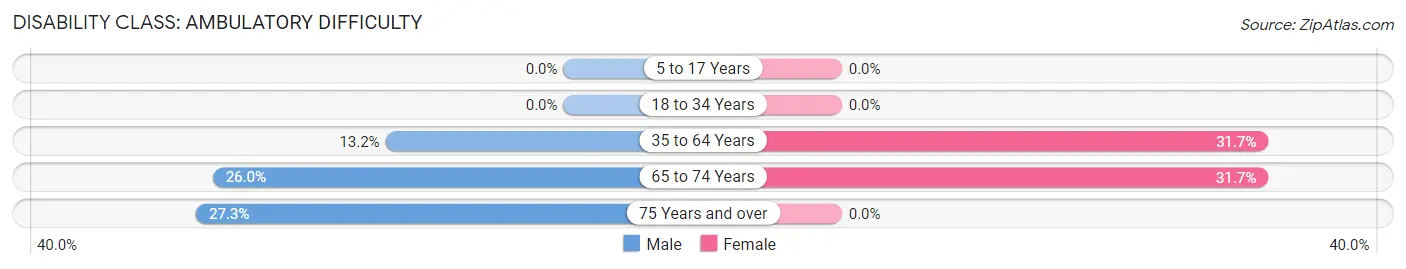
| Age Bracket | Male | Female |
| 5 to 17 Years | 0 (0.0%) | 0 (0.0%) |
| 18 to 34 Years | 0 (0.0%) | 0 (0.0%) |
| 35 to 64 Years | 14 (13.2%) | 82 (31.7%) |
| 65 to 74 Years | 19 (26.0%) | 25 (31.7%) |
| 75 Years and over | 3 (27.3%) | 0 (0.0%) |
Disability Class: Self-Care Difficulty
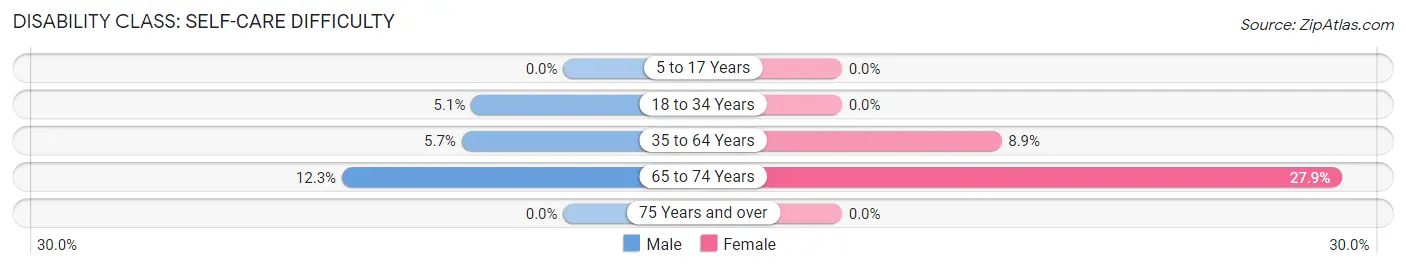
| Age Bracket | Male | Female |
| 5 to 17 Years | 0 (0.0%) | 0 (0.0%) |
| 18 to 34 Years | 4 (5.1%) | 0 (0.0%) |
| 35 to 64 Years | 6 (5.7%) | 23 (8.9%) |
| 65 to 74 Years | 9 (12.3%) | 22 (27.9%) |
| 75 Years and over | 0 (0.0%) | 0 (0.0%) |
Technology Access in Flordell Hills
Computing Device Access in Flordell Hills
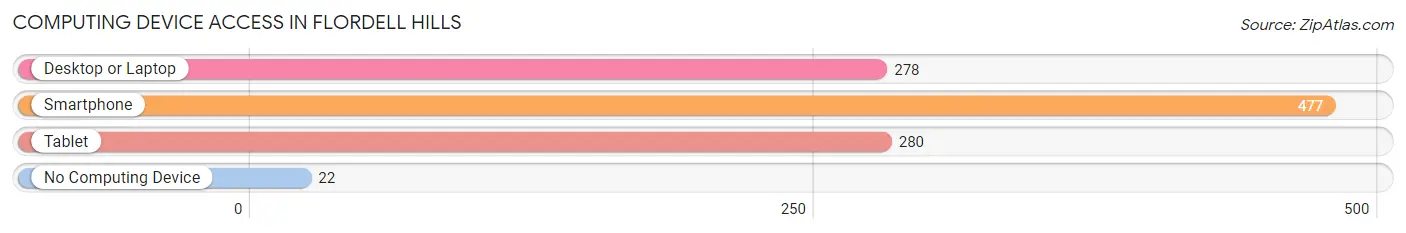
| Device Type | # Households | % Households |
| Desktop or Laptop | 278 | 53.6% |
| Smartphone | 477 | 91.9% |
| Tablet | 280 | 53.9% |
| No Computing Device | 22 | 4.2% |
| Total | 519 | 100.0% |
Internet Access in Flordell Hills
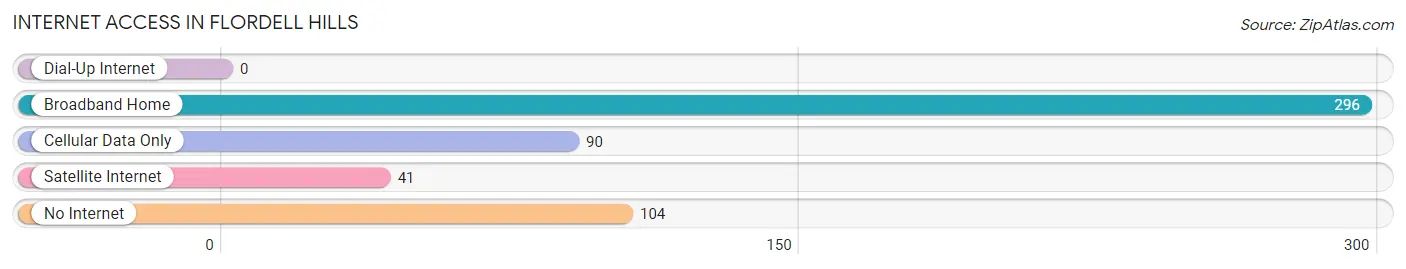
| Internet Type | # Households | % Households |
| Dial-Up Internet | 0 | 0.0% |
| Broadband Home | 296 | 57.0% |
| Cellular Data Only | 90 | 17.3% |
| Satellite Internet | 41 | 7.9% |
| No Internet | 104 | 20.0% |
| Total | 519 | 100.0% |
Flordell Hills Summary
Flordell Hills is a small city located in St. Louis County, Missouri. It is situated in the northwest corner of the county, just south of the Missouri River. The city has a population of approximately 4,000 people and is part of the Greater St. Louis metropolitan area.
History
Flordell Hills was founded in 1876 by a group of German immigrants who had settled in the area. The city was named after the nearby Flordell Hills, which were named after the nearby Flordell Creek. The city was incorporated in 1887 and has remained a small, rural community ever since.
The city was originally a farming community, but in the early 20th century, the city began to develop into a small industrial center. The city was home to several factories, including a shoe factory, a brick factory, and a furniture factory. The city also had a number of small businesses, including a grocery store, a hardware store, and a drug store.
Geography
Flordell Hills is located in the northwest corner of St. Louis County, just south of the Missouri River. The city is situated on a plateau, with the highest point being the Flordell Hills, which are located just south of the city. The city is surrounded by rolling hills and farmland, and is located approximately 20 miles from downtown St. Louis.
The city has a total area of 1.3 square miles, all of which is land. The city is located in the humid continental climate zone, with hot, humid summers and cold, snowy winters.
Economy
Flordell Hills is a small, rural community with a primarily agricultural economy. The city is home to several small businesses, including a grocery store, a hardware store, and a drug store. The city also has a number of small manufacturing businesses, including a shoe factory, a brick factory, and a furniture factory.
The city is also home to a number of small farms, which produce a variety of crops, including corn, soybeans, wheat, and hay. The city is also home to a number of small wineries, which produce a variety of wines.
Demographics
As of the 2010 census, the population of Flordell Hills was 4,000 people. The racial makeup of the city was 95.2% White, 1.2% African American, 0.7% Native American, 0.3% Asian, 0.1% Pacific Islander, 0.7% from other races, and 1.9% from two or more races. Hispanic or Latino of any race were 2.2% of the population.
The median household income in Flordell Hills was $45,000, and the median family income was $50,000. The per capita income for the city was $20,000. About 8.5% of families and 10.2% of the population were below the poverty line, including 14.3% of those under age 18 and 6.2% of those age 65 or over.
Flordell Hills is a small, rural community with a primarily agricultural economy. The city is home to a number of small businesses, farms, and wineries, and has a population of approximately 4,000 people. The city is located in the northwest corner of St. Louis County, just south of the Missouri River, and is part of the Greater St. Louis metropolitan area. The city has a humid continental climate, with hot, humid summers and cold, snowy winters.
Common Questions
What is Per Capita Income in Flordell Hills?
Per Capita income in Flordell Hills is $14,109.
What is the Median Family Income in Flordell Hills?
Median Family Income in Flordell Hills is $29,279.
What is the Median Household income in Flordell Hills?
Median Household Income in Flordell Hills is $32,906.
What is Income or Wage Gap in Flordell Hills?
Income or Wage Gap in Flordell Hills is 40.7%.
Women in Flordell Hills earn 59.3 cents for every dollar earned by a man.
What is Inequality or Gini Index in Flordell Hills?
Inequality or Gini Index in Flordell Hills is 0.40.
What is the Total Population of Flordell Hills?
Total Population of Flordell Hills is 1,448.
What is the Total Male Population of Flordell Hills?
Total Male Population of Flordell Hills is 524.
What is the Total Female Population of Flordell Hills?
Total Female Population of Flordell Hills is 924.
What is the Ratio of Males per 100 Females in Flordell Hills?
There are 56.71 Males per 100 Females in Flordell Hills.
What is the Ratio of Females per 100 Males in Flordell Hills?
There are 176.34 Females per 100 Males in Flordell Hills.
What is the Median Population Age in Flordell Hills?
Median Population Age in Flordell Hills is 25.6 Years.
What is the Average Family Size in Flordell Hills
Average Family Size in Flordell Hills is 3.4 People.
What is the Average Household Size in Flordell Hills
Average Household Size in Flordell Hills is 2.8 People.
How Large is the Labor Force in Flordell Hills?
There are 647 People in the Labor Forcein in Flordell Hills.
What is the Percentage of People in the Labor Force in Flordell Hills?
67.3% of People are in the Labor Force in Flordell Hills.
What is the Unemployment Rate in Flordell Hills?
Unemployment Rate in Flordell Hills is 31.7%.