Humansville, MO Map & Demographics
Humansville Map
Humansville Overview
$20,478
PER CAPITA INCOME
$60,000
AVG FAMILY INCOME
$35,278
AVG HOUSEHOLD INCOME
27.7%
WAGE / INCOME GAP [ % ]
72.3¢/ $1
WAGE / INCOME GAP [ $ ]
0.52
INEQUALITY / GINI INDEX
1,256
TOTAL POPULATION
653
MALE POPULATION
603
FEMALE POPULATION
108.29
MALES / 100 FEMALES
92.34
FEMALES / 100 MALES
41.5
MEDIAN AGE
3.2
AVG FAMILY SIZE
2.6
AVG HOUSEHOLD SIZE
386
LABOR FORCE [ PEOPLE ]
40.8%
PERCENT IN LABOR FORCE
10.1%
UNEMPLOYMENT RATE
Humansville Zip Codes
Humansville Area Codes
Income in Humansville
Income Overview in Humansville
Per Capita Income in Humansville is $20,478, while median incomes of families and households are $60,000 and $35,278 respectively.
| Characteristic | Number | Measure |
| Per Capita Income | 1,256 | $20,478 |
| Median Family Income | 256 | $60,000 |
| Mean Family Income | 256 | $70,959 |
| Median Household Income | 414 | $35,278 |
| Mean Household Income | 414 | $61,299 |
| Income Deficit | 256 | $0 |
| Wage / Income Gap (%) | 1,256 | 27.71% |
| Wage / Income Gap ($) | 1,256 | 72.29¢ per $1 |
| Gini / Inequality Index | 1,256 | 0.52 |
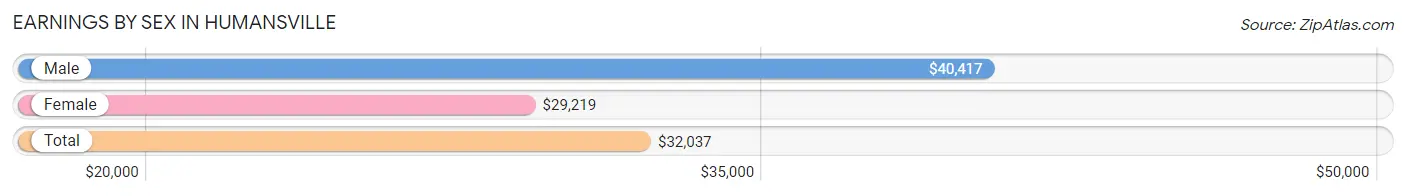
Earnings by Sex in Humansville
Average Earnings in Humansville are $32,037, $40,417 for men and $29,219 for women, a difference of 27.7%.
| Sex | Number | Average Earnings |
| Male | 213 (52.5%) | $40,417 |
| Female | 193 (47.5%) | $29,219 |
| Total | 406 (100.0%) | $32,037 |
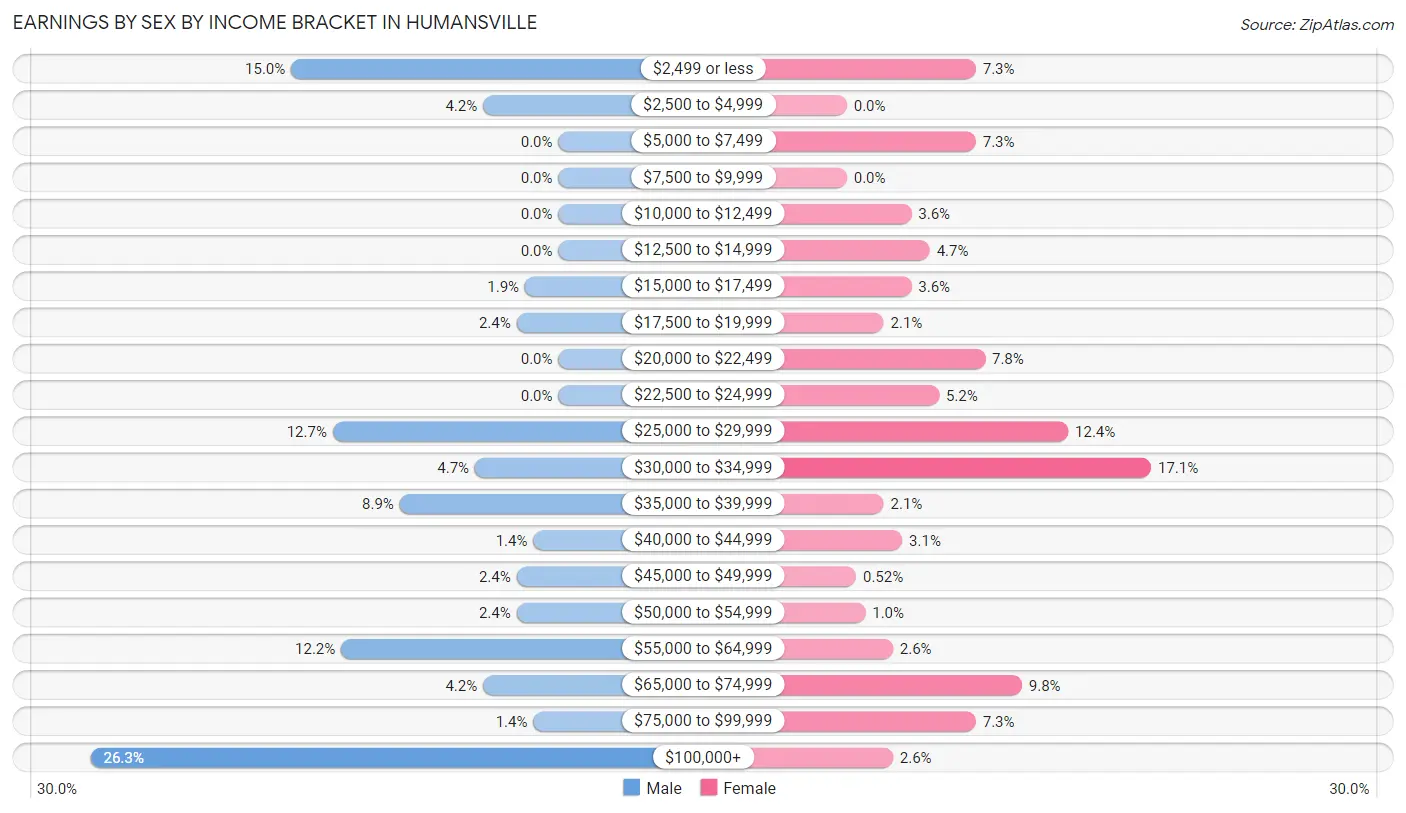
Earnings by Sex by Income Bracket in Humansville
The most common earnings brackets in Humansville are $100,000+ for men (56 | 26.3%) and $30,000 to $34,999 for women (33 | 17.1%).
| Income | Male | Female |
| $2,499 or less | 32 (15.0%) | 14 (7.2%) |
| $2,500 to $4,999 | 9 (4.2%) | 0 (0.0%) |
| $5,000 to $7,499 | 0 (0.0%) | 14 (7.2%) |
| $7,500 to $9,999 | 0 (0.0%) | 0 (0.0%) |
| $10,000 to $12,499 | 0 (0.0%) | 7 (3.6%) |
| $12,500 to $14,999 | 0 (0.0%) | 9 (4.7%) |
| $15,000 to $17,499 | 4 (1.9%) | 7 (3.6%) |
| $17,500 to $19,999 | 5 (2.4%) | 4 (2.1%) |
| $20,000 to $22,499 | 0 (0.0%) | 15 (7.8%) |
| $22,500 to $24,999 | 0 (0.0%) | 10 (5.2%) |
| $25,000 to $29,999 | 27 (12.7%) | 24 (12.4%) |
| $30,000 to $34,999 | 10 (4.7%) | 33 (17.1%) |
| $35,000 to $39,999 | 19 (8.9%) | 4 (2.1%) |
| $40,000 to $44,999 | 3 (1.4%) | 6 (3.1%) |
| $45,000 to $49,999 | 5 (2.4%) | 1 (0.5%) |
| $50,000 to $54,999 | 5 (2.4%) | 2 (1.0%) |
| $55,000 to $64,999 | 26 (12.2%) | 5 (2.6%) |
| $65,000 to $74,999 | 9 (4.2%) | 19 (9.8%) |
| $75,000 to $99,999 | 3 (1.4%) | 14 (7.2%) |
| $100,000+ | 56 (26.3%) | 5 (2.6%) |
| Total | 213 (100.0%) | 193 (100.0%) |
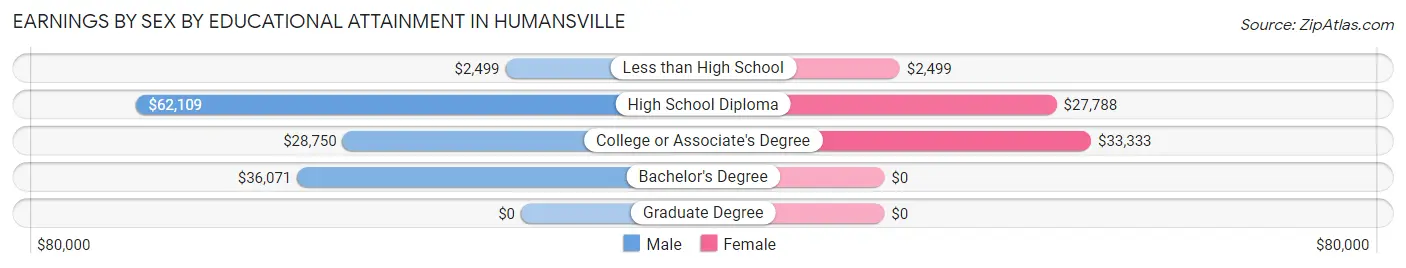
Earnings by Sex by Educational Attainment in Humansville
Average earnings in Humansville are $51,667 for men and $29,145 for women, a difference of 43.6%. Men with an educational attainment of high school diploma enjoy the highest average annual earnings of $62,109, while those with less than high school education earn the least with $2,499. Women with an educational attainment of college or associate's degree earn the most with the average annual earnings of $33,333, while those with less than high school education have the smallest earnings of $2,499.
| Educational Attainment | Male Income | Female Income |
| Less than High School | $2,499 | $2,499 |
| High School Diploma | $62,109 | $27,788 |
| College or Associate's Degree | $28,750 | $33,333 |
| Bachelor's Degree | $36,071 | $0 |
| Graduate Degree | - | - |
| Total | $51,667 | $29,145 |
Family Income in Humansville
Family Income Brackets in Humansville
According to the Humansville family income data, there are 78 families falling into the $100,000 to $149,999 income range, which is the most common income bracket and makes up 30.5% of all families.
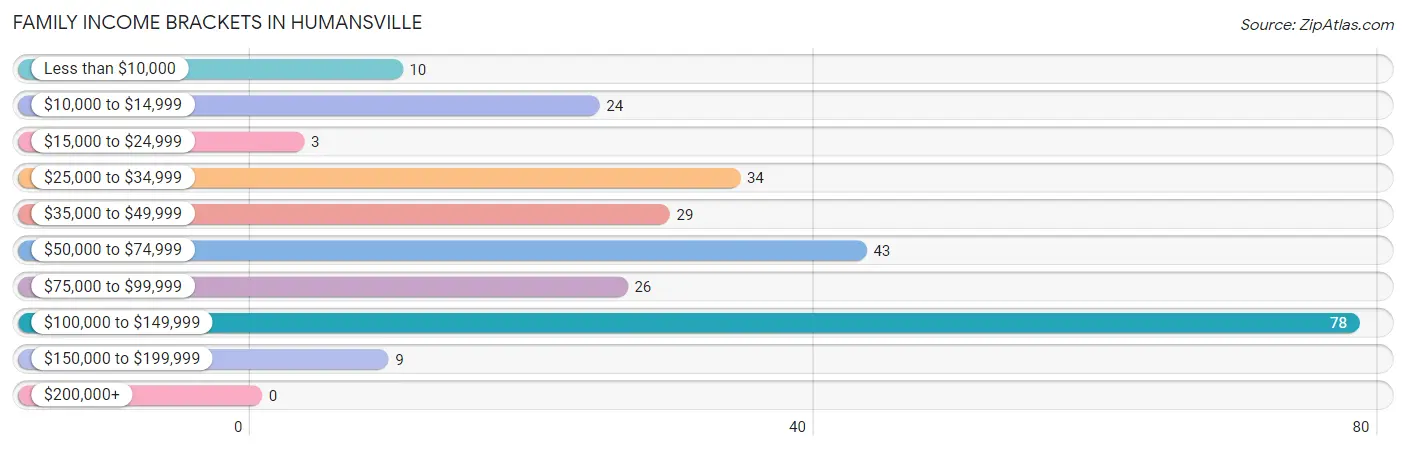
| Income Bracket | # Families | % Families |
| Less than $10,000 | 10 | 3.9% |
| $10,000 to $14,999 | 24 | 9.4% |
| $15,000 to $24,999 | 3 | 1.2% |
| $25,000 to $34,999 | 34 | 13.3% |
| $35,000 to $49,999 | 29 | 11.3% |
| $50,000 to $74,999 | 43 | 16.8% |
| $75,000 to $99,999 | 26 | 10.2% |
| $100,000 to $149,999 | 78 | 30.5% |
| $150,000 to $199,999 | 9 | 3.5% |
| $200,000+ | 0 | 0.0% |
Family Income by Famaliy Size in Humansville
4-person families (87 | 34.0%) account for the highest median family income in Humansville with $113,371 per family, while 4-person families (87 | 34.0%) have the highest median income of $28,343 per family member.
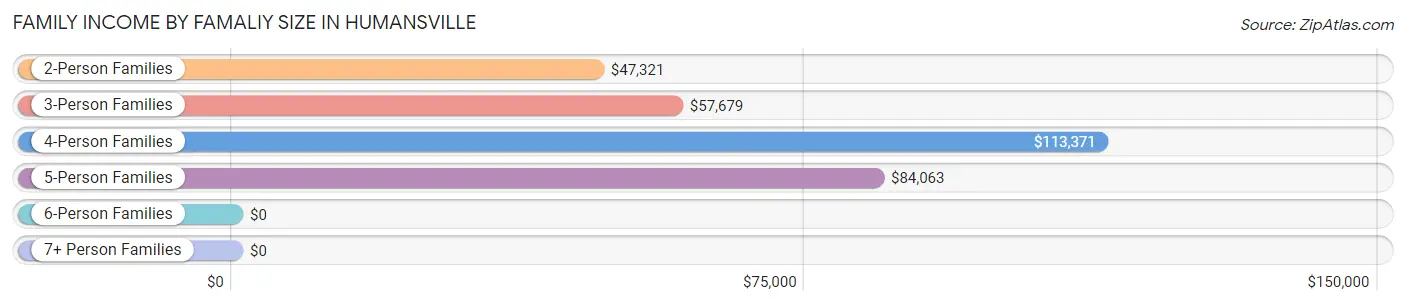
| Income Bracket | # Families | Median Income |
| 2-Person Families | 107 (41.8%) | $47,321 |
| 3-Person Families | 33 (12.9%) | $57,679 |
| 4-Person Families | 87 (34.0%) | $113,371 |
| 5-Person Families | 26 (10.2%) | $84,063 |
| 6-Person Families | 0 (0.0%) | $0 |
| 7+ Person Families | 3 (1.2%) | $0 |
| Total | 256 (100.0%) | $60,000 |
Family Income by Number of Earners in Humansville
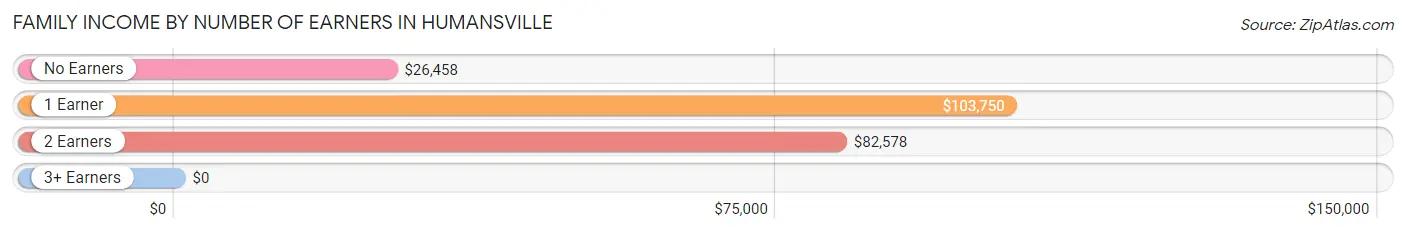
| Number of Earners | # Families | Median Income |
| No Earners | 48 (18.8%) | $26,458 |
| 1 Earner | 118 (46.1%) | $103,750 |
| 2 Earners | 85 (33.2%) | $82,578 |
| 3+ Earners | 5 (1.9%) | $0 |
| Total | 256 (100.0%) | $60,000 |
Household Income in Humansville
Household Income Brackets in Humansville
With 68 households falling in the category, the $150,000 to $199,999 income range is the most frequent in Humansville, accounting for 16.4% of all households.
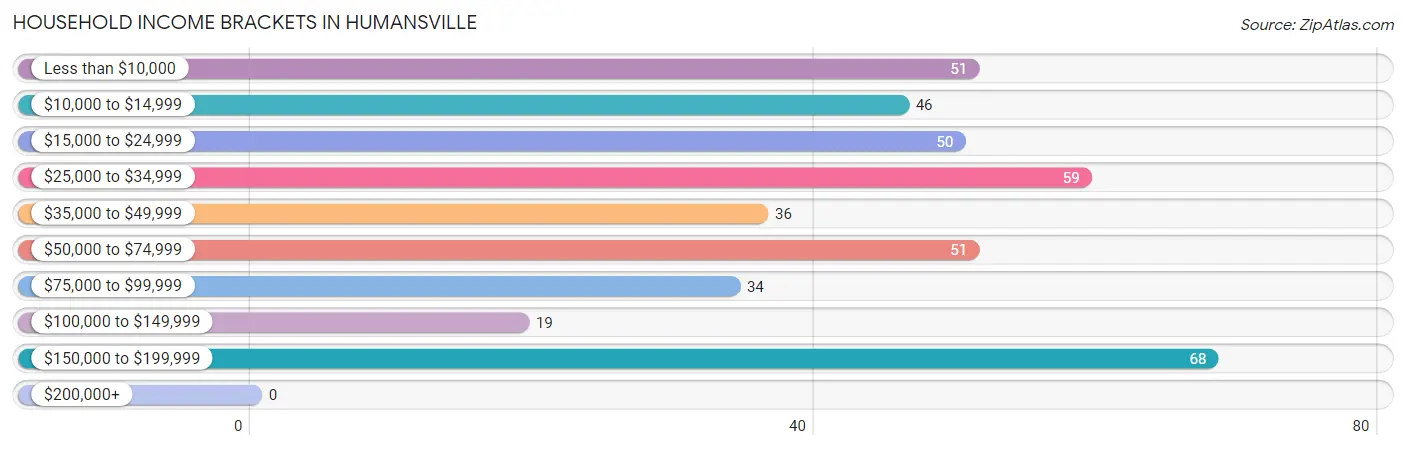
| Income Bracket | # Households | % Households |
| Less than $10,000 | 51 | 12.3% |
| $10,000 to $14,999 | 46 | 11.1% |
| $15,000 to $24,999 | 50 | 12.1% |
| $25,000 to $34,999 | 59 | 14.3% |
| $35,000 to $49,999 | 36 | 8.7% |
| $50,000 to $74,999 | 51 | 12.3% |
| $75,000 to $99,999 | 34 | 8.2% |
| $100,000 to $149,999 | 19 | 4.6% |
| $150,000 to $199,999 | 68 | 16.4% |
| $200,000+ | 0 | 0.0% |
Household Income by Householder Age in Humansville
The median household income in Humansville is $35,278, with the highest median household income of $27,500 found in the 45 to 64 years age bracket for the primary householder. A total of 136 households (32.9%) fall into this category. Meanwhile, the 15 to 24 years age bracket for the primary householder has the lowest median household income of $0, with 7 households (1.7%) in this group.
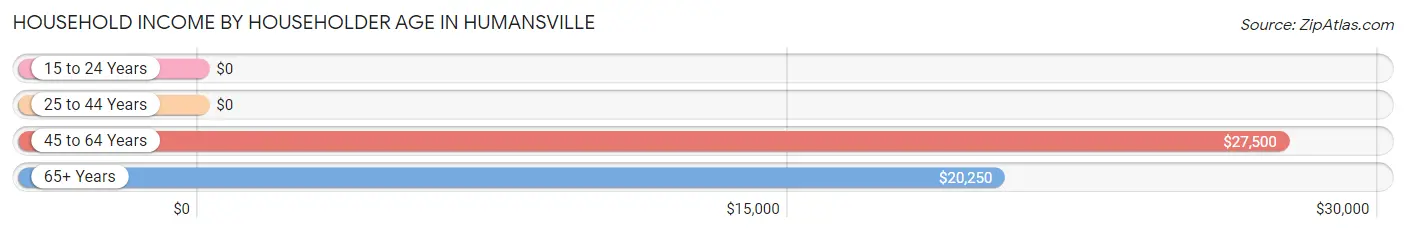
| Income Bracket | # Households | Median Income |
| 15 to 24 Years | 7 (1.7%) | $0 |
| 25 to 44 Years | 146 (35.3%) | $0 |
| 45 to 64 Years | 136 (32.9%) | $27,500 |
| 65+ Years | 125 (30.2%) | $20,250 |
| Total | 414 (100.0%) | $35,278 |
Poverty in Humansville
Income Below Poverty by Sex and Age in Humansville
With 26.1% poverty level for males and 26.3% for females among the residents of Humansville, 16 and 17 year old males and 15 year old females are the most vulnerable to poverty, with 11 males (100.0%) and 14 females (82.4%) in their respective age groups living below the poverty level.
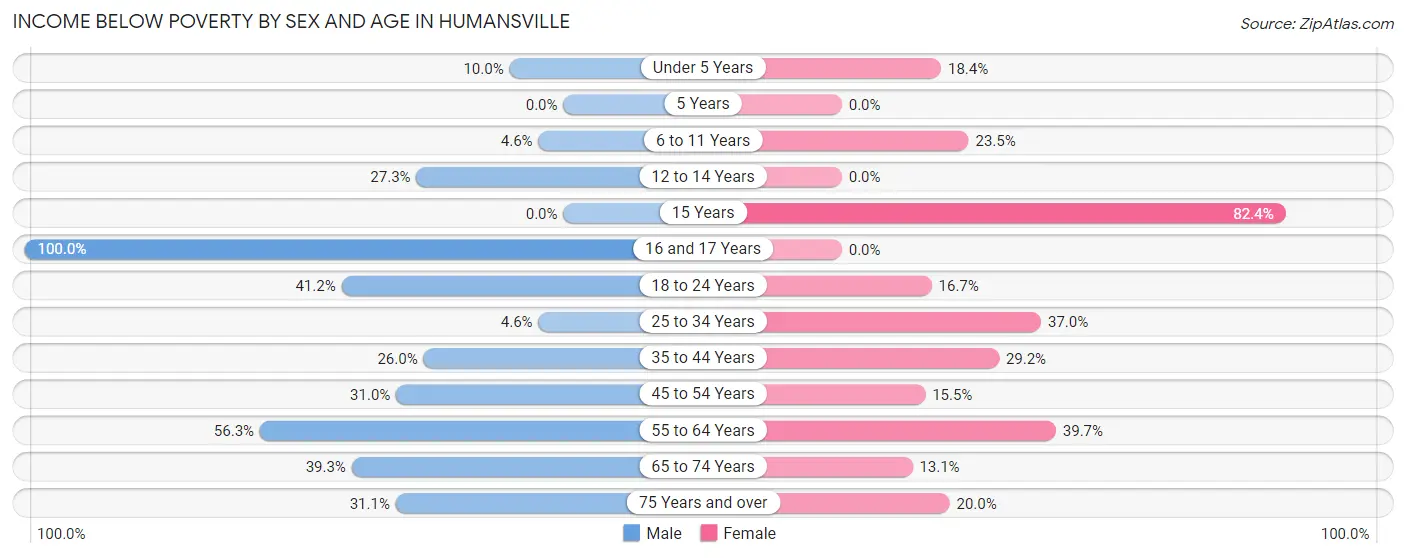
| Age Bracket | Male | Female |
| Under 5 Years | 2 (10.0%) | 7 (18.4%) |
| 5 Years | 0 (0.0%) | 0 (0.0%) |
| 6 to 11 Years | 6 (4.6%) | 16 (23.5%) |
| 12 to 14 Years | 6 (27.3%) | 0 (0.0%) |
| 15 Years | 0 (0.0%) | 14 (82.4%) |
| 16 and 17 Years | 11 (100.0%) | 0 (0.0%) |
| 18 to 24 Years | 14 (41.2%) | 4 (16.7%) |
| 25 to 34 Years | 3 (4.6%) | 27 (37.0%) |
| 35 to 44 Years | 27 (26.0%) | 14 (29.2%) |
| 45 to 54 Years | 9 (31.0%) | 13 (15.5%) |
| 55 to 64 Years | 49 (56.3%) | 29 (39.7%) |
| 65 to 74 Years | 11 (39.3%) | 8 (13.1%) |
| 75 Years and over | 14 (31.1%) | 9 (20.0%) |
| Total | 152 (26.1%) | 141 (26.3%) |
Income Above Poverty by Sex and Age in Humansville
According to the poverty statistics in Humansville, males aged 5 years and females aged 12 to 14 years are the age groups that are most secure financially, with 100.0% of males and 100.0% of females in these age groups living above the poverty line.
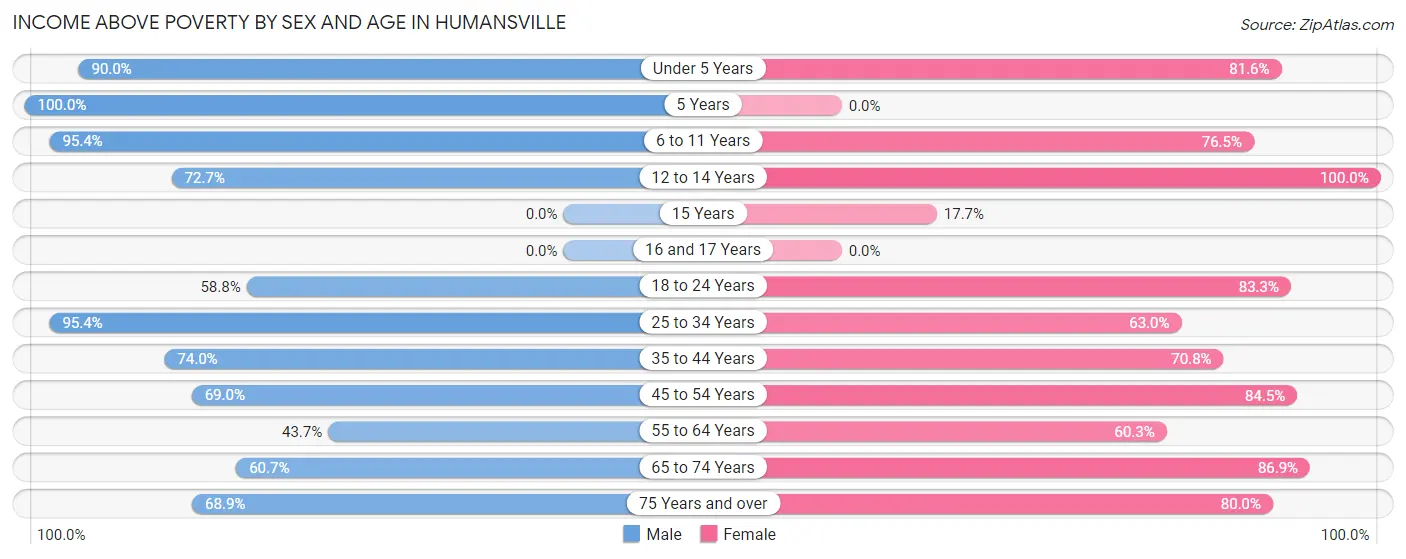
| Age Bracket | Male | Female |
| Under 5 Years | 18 (90.0%) | 31 (81.6%) |
| 5 Years | 7 (100.0%) | 0 (0.0%) |
| 6 to 11 Years | 124 (95.4%) | 52 (76.5%) |
| 12 to 14 Years | 16 (72.7%) | 5 (100.0%) |
| 15 Years | 0 (0.0%) | 3 (17.6%) |
| 16 and 17 Years | 0 (0.0%) | 0 (0.0%) |
| 18 to 24 Years | 20 (58.8%) | 20 (83.3%) |
| 25 to 34 Years | 62 (95.4%) | 46 (63.0%) |
| 35 to 44 Years | 77 (74.0%) | 34 (70.8%) |
| 45 to 54 Years | 20 (69.0%) | 71 (84.5%) |
| 55 to 64 Years | 38 (43.7%) | 44 (60.3%) |
| 65 to 74 Years | 17 (60.7%) | 53 (86.9%) |
| 75 Years and over | 31 (68.9%) | 36 (80.0%) |
| Total | 430 (73.9%) | 395 (73.7%) |
Income Below Poverty Among Married-Couple Families in Humansville
The poverty statistics for married-couple families in Humansville show that 13.0% or 18 of the total 138 families live below the poverty line. Families with 1 or 2 children have the highest poverty rate of 21.9%, comprising of 7 families. On the other hand, families with no children have the lowest poverty rate of 9.5%, which includes 8 families.
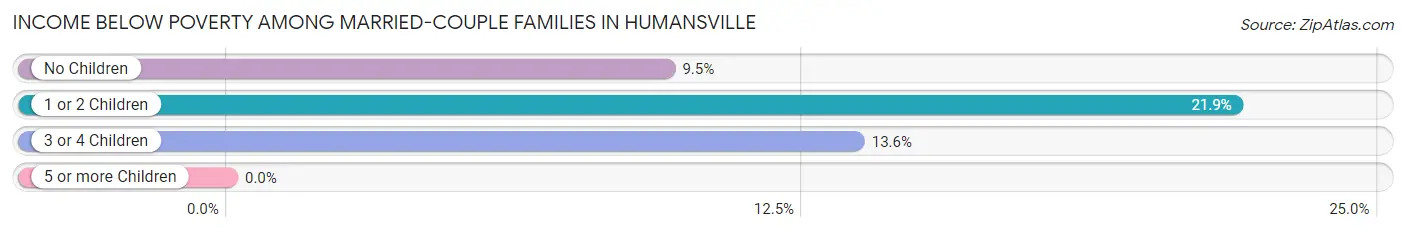
| Children | Above Poverty | Below Poverty |
| No Children | 76 (90.5%) | 8 (9.5%) |
| 1 or 2 Children | 25 (78.1%) | 7 (21.9%) |
| 3 or 4 Children | 19 (86.4%) | 3 (13.6%) |
| 5 or more Children | 0 (0.0%) | 0 (0.0%) |
| Total | 120 (87.0%) | 18 (13.0%) |
Income Below Poverty Among Single-Parent Households in Humansville
According to the poverty data in Humansville, 4.1% or 3 single-father households and 43.2% or 19 single-mother households are living below the poverty line. Among single-father households, those with 1 or 2 children have the highest poverty rate, with 3 households (25.0%) experiencing poverty. Likewise, among single-mother households, those with 3 or 4 children have the highest poverty rate, with 2 households (100.0%) falling below the poverty line.
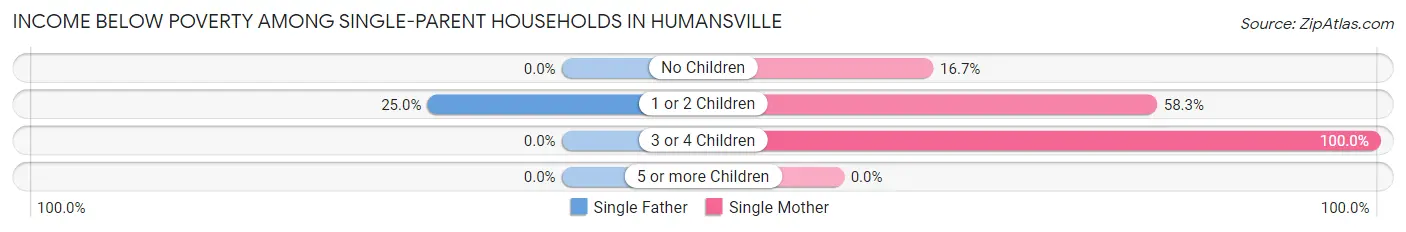
| Children | Single Father | Single Mother |
| No Children | 0 (0.0%) | 3 (16.7%) |
| 1 or 2 Children | 3 (25.0%) | 14 (58.3%) |
| 3 or 4 Children | 0 (0.0%) | 2 (100.0%) |
| 5 or more Children | 0 (0.0%) | 0 (0.0%) |
| Total | 3 (4.1%) | 19 (43.2%) |
Income Below Poverty Among Married-Couple vs Single-Parent Households in Humansville
The poverty data for Humansville shows that 18 of the married-couple family households (13.0%) and 22 of the single-parent households (18.6%) are living below the poverty level. Within the married-couple family households, those with 1 or 2 children have the highest poverty rate, with 7 households (21.9%) falling below the poverty line. Among the single-parent households, those with 1 or 2 children have the highest poverty rate, with 17 household (47.2%) living below poverty.
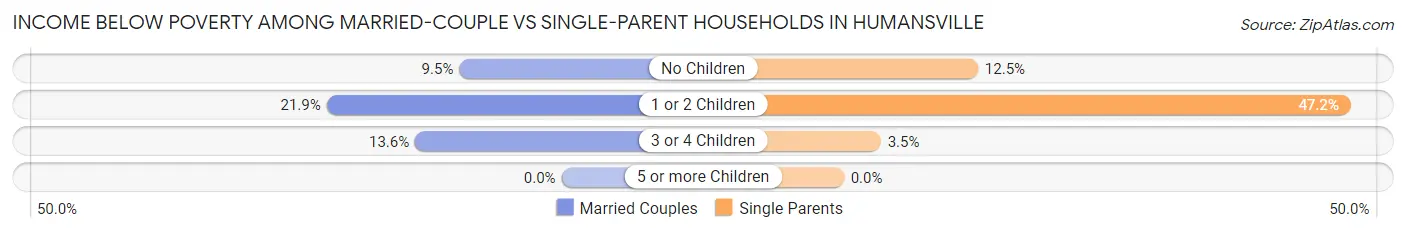
| Children | Married-Couple Families | Single-Parent Households |
| No Children | 8 (9.5%) | 3 (12.5%) |
| 1 or 2 Children | 7 (21.9%) | 17 (47.2%) |
| 3 or 4 Children | 3 (13.6%) | 2 (3.5%) |
| 5 or more Children | 0 (0.0%) | 0 (0.0%) |
| Total | 18 (13.0%) | 22 (18.6%) |
Race in Humansville
The most populous races in Humansville are White / Caucasian (914 | 72.8%), Two or more Races (305 | 24.3%), and Hispanic or Latino (234 | 18.6%).
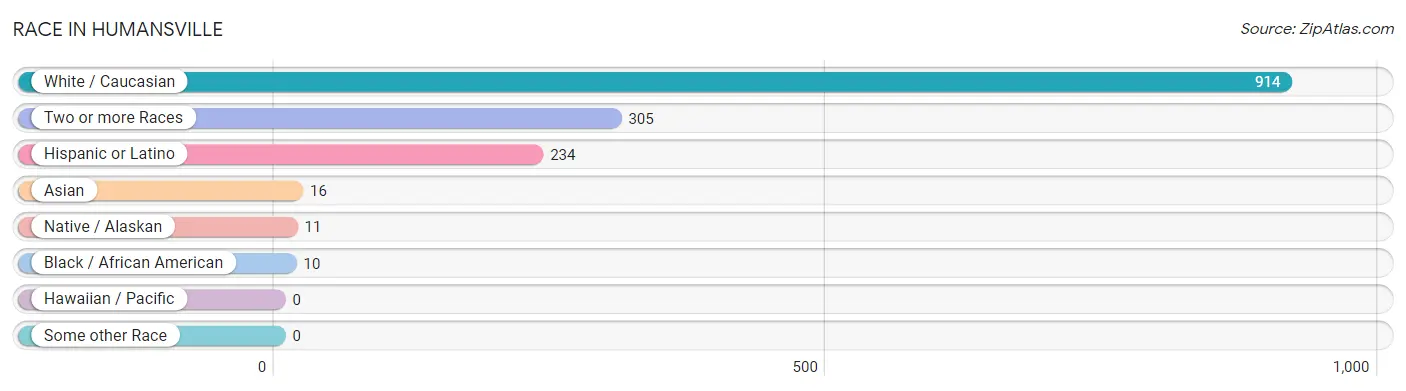
| Race | # Population | % Population |
| Asian | 16 | 1.3% |
| Black / African American | 10 | 0.8% |
| Hawaiian / Pacific | 0 | 0.0% |
| Hispanic or Latino | 234 | 18.6% |
| Native / Alaskan | 11 | 0.9% |
| White / Caucasian | 914 | 72.8% |
| Two or more Races | 305 | 24.3% |
| Some other Race | 0 | 0.0% |
| Total | 1,256 | 100.0% |
Ancestry in Humansville
The most populous ancestries reported in Humansville are Mexican (228 | 18.1%), German (220 | 17.5%), Irish (184 | 14.6%), American (146 | 11.6%), and English (60 | 4.8%), together accounting for 66.7% of all Humansville residents.
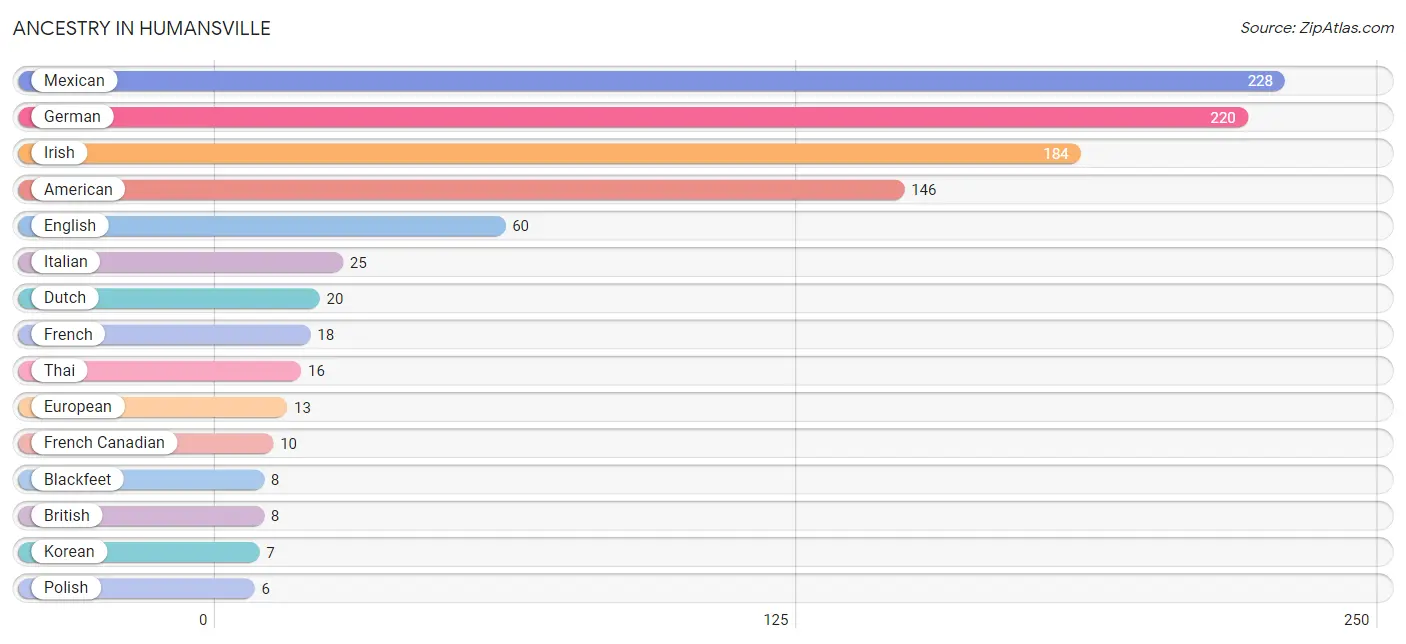
| Ancestry | # Population | % Population |
| American | 146 | 11.6% |
| Bhutanese | 4 | 0.3% |
| Blackfeet | 8 | 0.6% |
| British | 8 | 0.6% |
| Central American | 2 | 0.2% |
| Cherokee | 1 | 0.1% |
| Czech | 1 | 0.1% |
| Dutch | 20 | 1.6% |
| English | 60 | 4.8% |
| European | 13 | 1.0% |
| Finnish | 5 | 0.4% |
| French | 18 | 1.4% |
| French Canadian | 10 | 0.8% |
| German | 220 | 17.5% |
| Irish | 184 | 14.6% |
| Italian | 25 | 2.0% |
| Korean | 7 | 0.6% |
| Lithuanian | 1 | 0.1% |
| Mexican | 228 | 18.1% |
| Norwegian | 3 | 0.2% |
| Panamanian | 2 | 0.2% |
| Polish | 6 | 0.5% |
| Scandinavian | 5 | 0.4% |
| Scotch-Irish | 4 | 0.3% |
| Scottish | 4 | 0.3% |
| Swedish | 1 | 0.1% |
| Thai | 16 | 1.3% | View All 27 Rows |
Immigrants in Humansville
The most numerous immigrant groups reported in Humansville came from Asia (12 | 1.0%), China (6 | 0.5%), Eastern Asia (6 | 0.5%), India (6 | 0.5%), and South Central Asia (6 | 0.5%), together accounting for 2.9% of all Humansville residents.
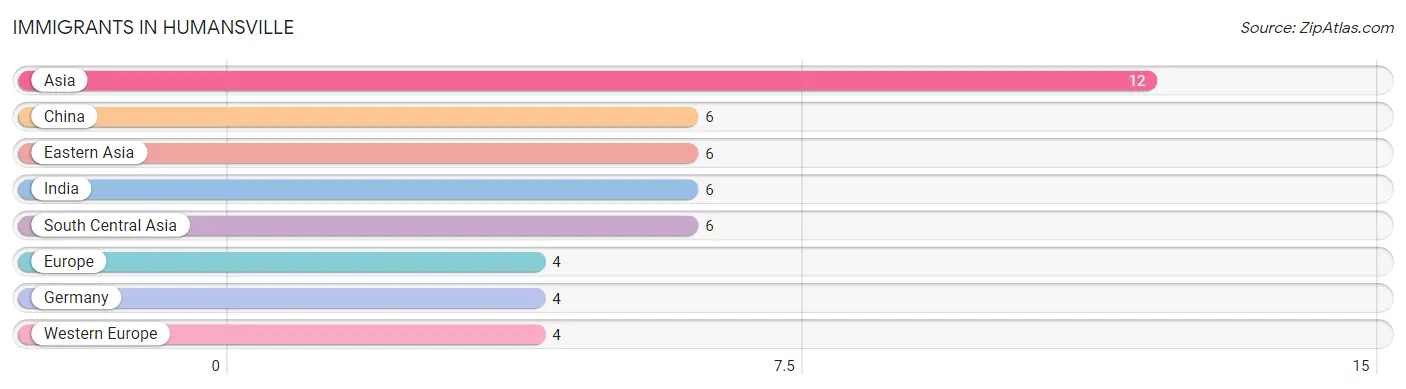
| Immigration Origin | # Population | % Population |
| Asia | 12 | 1.0% |
| China | 6 | 0.5% |
| Eastern Asia | 6 | 0.5% |
| Europe | 4 | 0.3% |
| Germany | 4 | 0.3% |
| India | 6 | 0.5% |
| South Central Asia | 6 | 0.5% |
| Western Europe | 4 | 0.3% | View All 8 Rows |
Sex and Age in Humansville
Sex and Age in Humansville
The most populous age groups in Humansville are 5 to 9 Years (140 | 21.4%) for men and 10 to 14 Years (59 | 9.8%) for women.
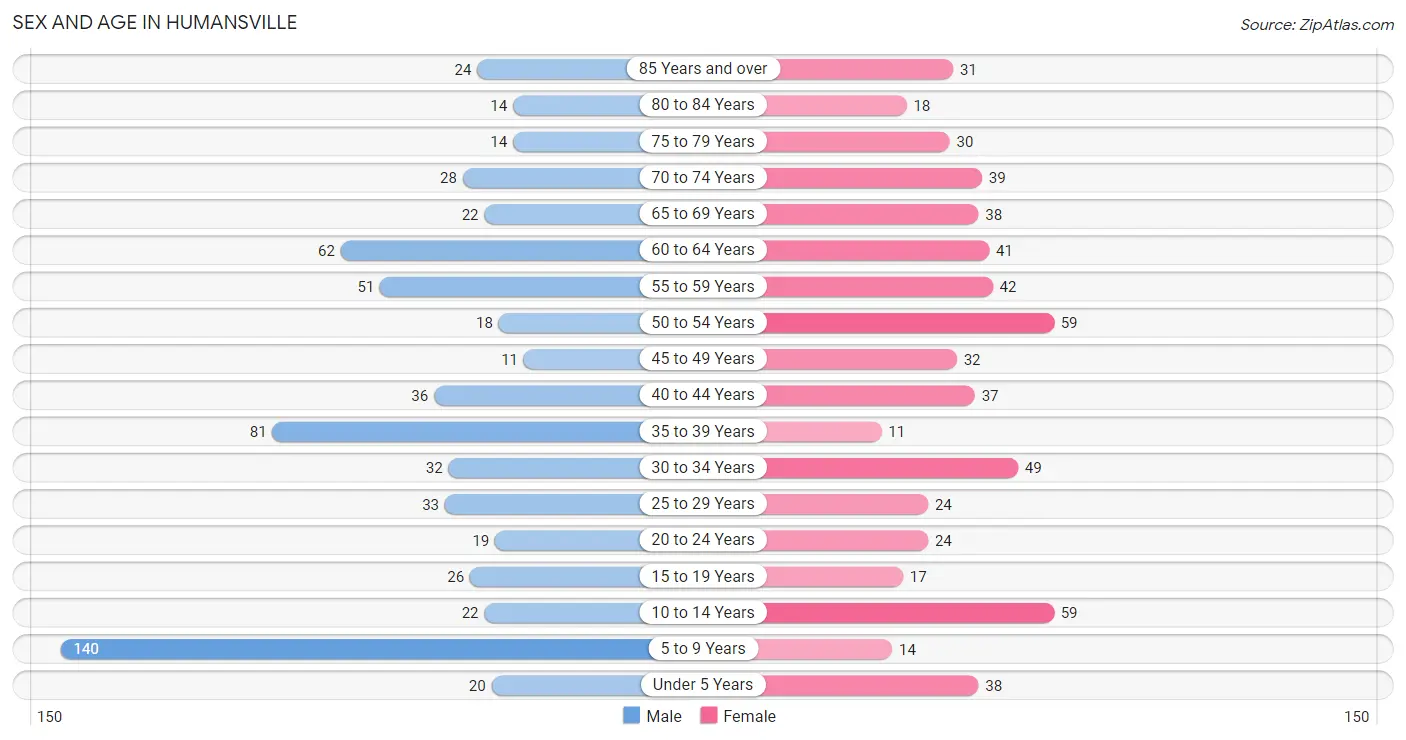
| Age Bracket | Male | Female |
| Under 5 Years | 20 (3.1%) | 38 (6.3%) |
| 5 to 9 Years | 140 (21.4%) | 14 (2.3%) |
| 10 to 14 Years | 22 (3.4%) | 59 (9.8%) |
| 15 to 19 Years | 26 (4.0%) | 17 (2.8%) |
| 20 to 24 Years | 19 (2.9%) | 24 (4.0%) |
| 25 to 29 Years | 33 (5.1%) | 24 (4.0%) |
| 30 to 34 Years | 32 (4.9%) | 49 (8.1%) |
| 35 to 39 Years | 81 (12.4%) | 11 (1.8%) |
| 40 to 44 Years | 36 (5.5%) | 37 (6.1%) |
| 45 to 49 Years | 11 (1.7%) | 32 (5.3%) |
| 50 to 54 Years | 18 (2.8%) | 59 (9.8%) |
| 55 to 59 Years | 51 (7.8%) | 42 (7.0%) |
| 60 to 64 Years | 62 (9.5%) | 41 (6.8%) |
| 65 to 69 Years | 22 (3.4%) | 38 (6.3%) |
| 70 to 74 Years | 28 (4.3%) | 39 (6.5%) |
| 75 to 79 Years | 14 (2.1%) | 30 (5.0%) |
| 80 to 84 Years | 14 (2.1%) | 18 (3.0%) |
| 85 Years and over | 24 (3.7%) | 31 (5.1%) |
| Total | 653 (100.0%) | 603 (100.0%) |
Families and Households in Humansville
Median Family Size in Humansville
The median family size in Humansville is 3.21 persons per family, with single male/father families (74 | 28.9%) accounting for the largest median family size of 3.61 persons per family. On the other hand, single female/mother families (44 | 17.2%) represent the smallest median family size with 3.02 persons per family.
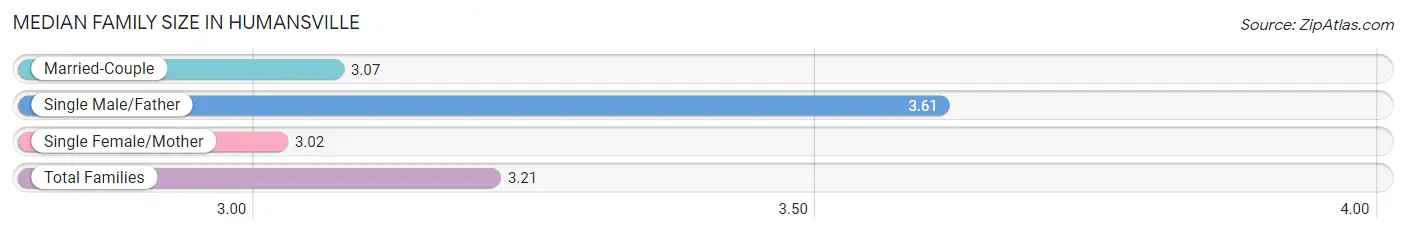
| Family Type | # Families | Family Size |
| Married-Couple | 138 (53.9%) | 3.07 |
| Single Male/Father | 74 (28.9%) | 3.61 |
| Single Female/Mother | 44 (17.2%) | 3.02 |
| Total Families | 256 (100.0%) | 3.21 |
Median Household Size in Humansville
The median household size in Humansville is 2.63 persons per household, with single male/father households (74 | 17.9%) accounting for the largest median household size of 3.97 persons per household. non-family households (158 | 38.2%) represent the smallest median household size with 1.30 persons per household.
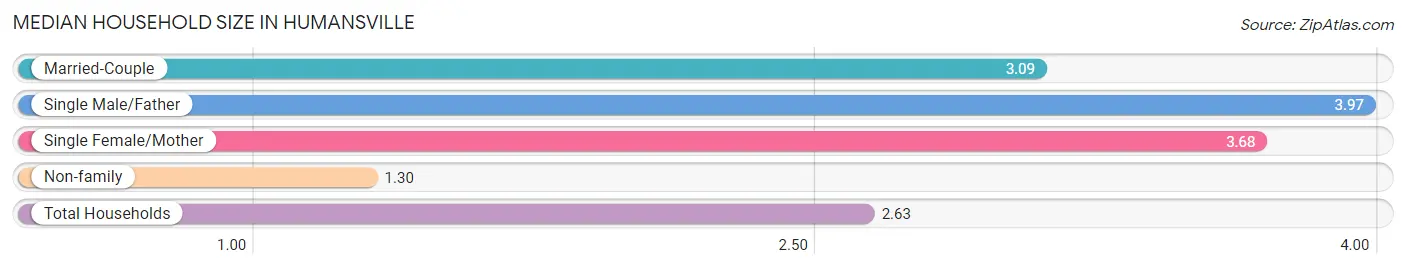
| Household Type | # Households | Household Size |
| Married-Couple | 138 (33.3%) | 3.09 |
| Single Male/Father | 74 (17.9%) | 3.97 |
| Single Female/Mother | 44 (10.6%) | 3.68 |
| Non-family | 158 (38.2%) | 1.30 |
| Total Households | 414 (100.0%) | 2.63 |
Household Size by Marriage Status in Humansville
Out of a total of 414 households in Humansville, 256 (61.8%) are family households, while 158 (38.2%) are nonfamily households. The most numerous type of family households are 2-person households, comprising 91, and the most common type of nonfamily households are 1-person households, comprising 130.
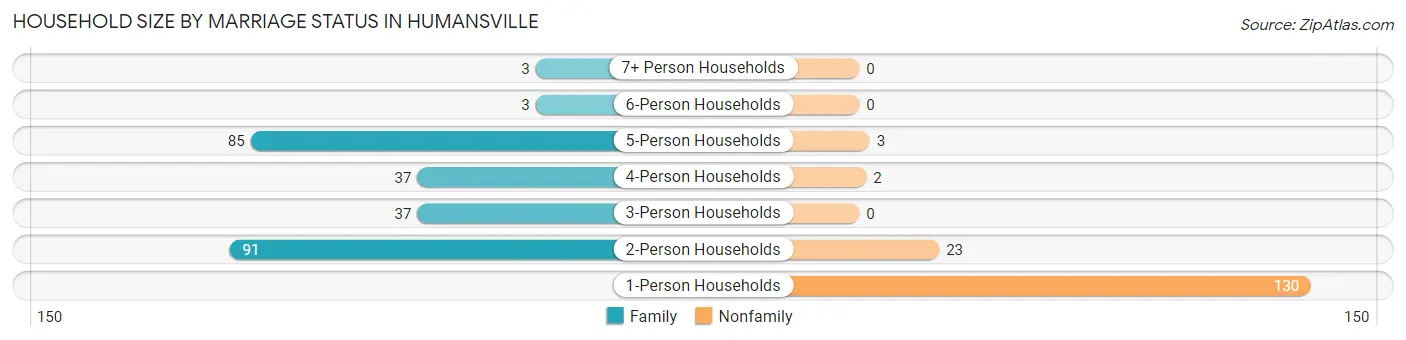
| Household Size | Family Households | Nonfamily Households |
| 1-Person Households | - | 130 (31.4%) |
| 2-Person Households | 91 (22.0%) | 23 (5.6%) |
| 3-Person Households | 37 (8.9%) | 0 (0.0%) |
| 4-Person Households | 37 (8.9%) | 2 (0.5%) |
| 5-Person Households | 85 (20.5%) | 3 (0.7%) |
| 6-Person Households | 3 (0.7%) | 0 (0.0%) |
| 7+ Person Households | 3 (0.7%) | 0 (0.0%) |
| Total | 256 (61.8%) | 158 (38.2%) |
Female Fertility in Humansville
Fertility by Age in Humansville
Average fertility rate in Humansville is 76.0 births per 1,000 women. Women in the age bracket of 20 to 34 years have the highest fertility rate with 155.0 births per 1,000 women. Women in the age bracket of 20 to 34 years acount for 100.0% of all women with births.
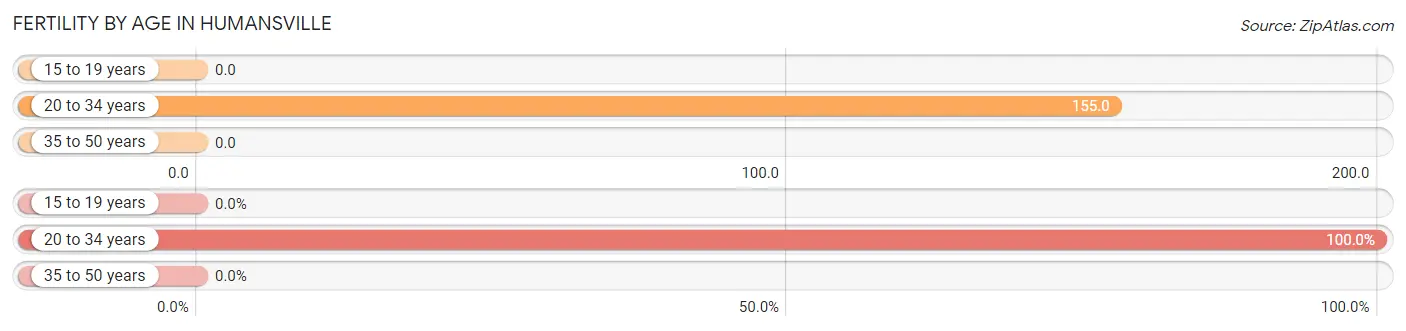
| Age Bracket | Women with Births | Births / 1,000 Women |
| 15 to 19 years | 0 (0.0%) | 0.0 |
| 20 to 34 years | 15 (100.0%) | 155.0 |
| 35 to 50 years | 0 (0.0%) | 0.0 |
| Total | 15 (100.0%) | 76.0 |
Fertility by Age by Marriage Status in Humansville
73.3% of women with births (15) in Humansville are married. The highest percentage of unmarried women with births falls into 20 to 34 years age bracket with 26.7% of them unmarried at the time of birth, while the lowest percentage of unmarried women with births belong to 20 to 34 years age bracket with 26.7% of them unmarried.
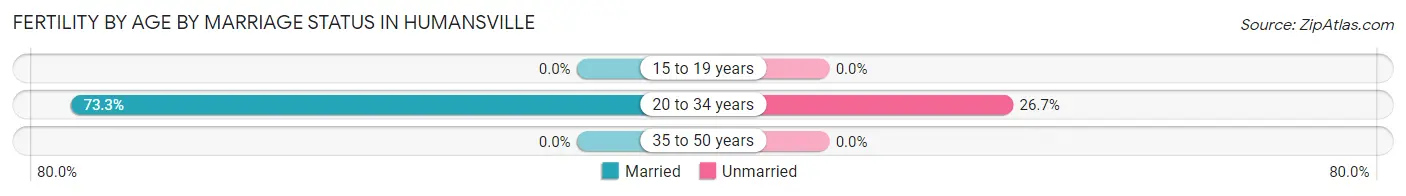
| Age Bracket | Married | Unmarried |
| 15 to 19 years | 0 (0.0%) | 0 (0.0%) |
| 20 to 34 years | 11 (73.3%) | 4 (26.7%) |
| 35 to 50 years | 0 (0.0%) | 0 (0.0%) |
| Total | 11 (73.3%) | 4 (26.7%) |
Fertility by Education in Humansville
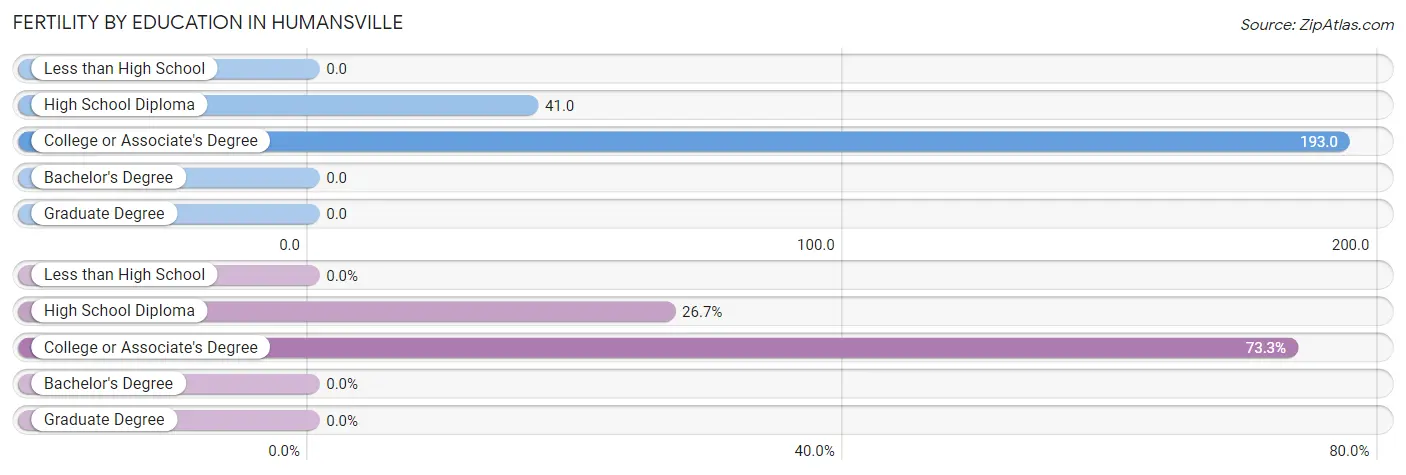
| Educational Attainment | Women with Births | Births / 1,000 Women |
| Less than High School | 0 (0.0%) | 0.0 |
| High School Diploma | 4 (26.7%) | 41.0 |
| College or Associate's Degree | 11 (73.3%) | 193.0 |
| Bachelor's Degree | 0 (0.0%) | 0.0 |
| Graduate Degree | 0 (0.0%) | 0.0 |
| Total | 15 (100.0%) | 76.0 |
Fertility by Education by Marriage Status in Humansville
26.7% of women with births in Humansville are unmarried. Women with the educational attainment of college or associate's degree are most likely to be married with 100.0% of them married at childbirth, while women with the educational attainment of high school diploma are least likely to be married with 100.0% of them unmarried at childbirth.
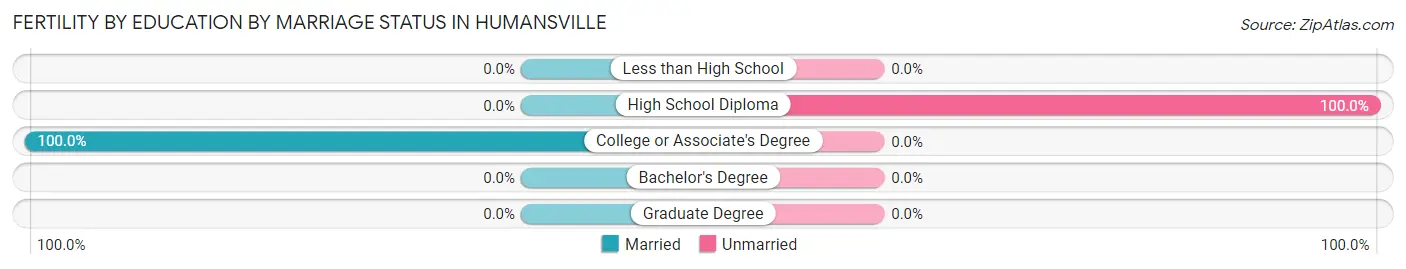
| Educational Attainment | Married | Unmarried |
| Less than High School | 0 (0.0%) | 0 (0.0%) |
| High School Diploma | 0 (0.0%) | 4 (100.0%) |
| College or Associate's Degree | 11 (100.0%) | 0 (0.0%) |
| Bachelor's Degree | 0 (0.0%) | 0 (0.0%) |
| Graduate Degree | 0 (0.0%) | 0 (0.0%) |
| Total | 11 (73.3%) | 4 (26.7%) |
Employment Characteristics in Humansville
Employment by Class of Employer in Humansville
Among the 323 employed individuals in Humansville, private company employees (238 | 73.7%), local government employees (32 | 9.9%), and not-for-profit organizations (27 | 8.4%) make up the most common classes of employment.
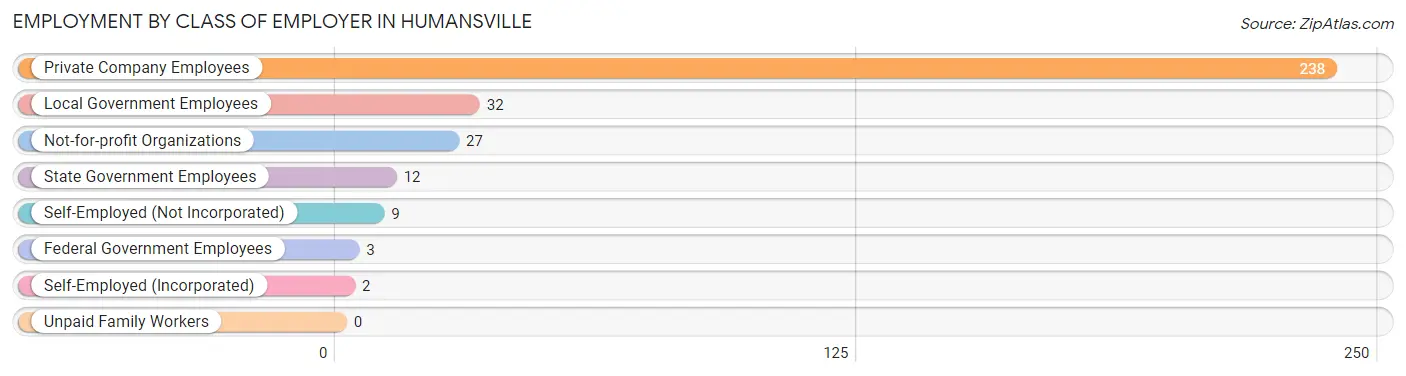
| Employer Class | # Employees | % Employees |
| Private Company Employees | 238 | 73.7% |
| Self-Employed (Incorporated) | 2 | 0.6% |
| Self-Employed (Not Incorporated) | 9 | 2.8% |
| Not-for-profit Organizations | 27 | 8.4% |
| Local Government Employees | 32 | 9.9% |
| State Government Employees | 12 | 3.7% |
| Federal Government Employees | 3 | 0.9% |
| Unpaid Family Workers | 0 | 0.0% |
| Total | 323 | 100.0% |
Employment Status by Age in Humansville
According to the labor force statistics for Humansville, out of the total population over 16 years of age (946), 40.8% or 386 individuals are in the labor force, with 10.1% or 39 of them unemployed. The age group with the highest labor force participation rate is 20 to 24 years, with 93.0% or 40 individuals in the labor force. Within the labor force, the 16 to 19 years age range has the highest percentage of unemployed individuals, with 100.0% or 6 of them being unemployed.
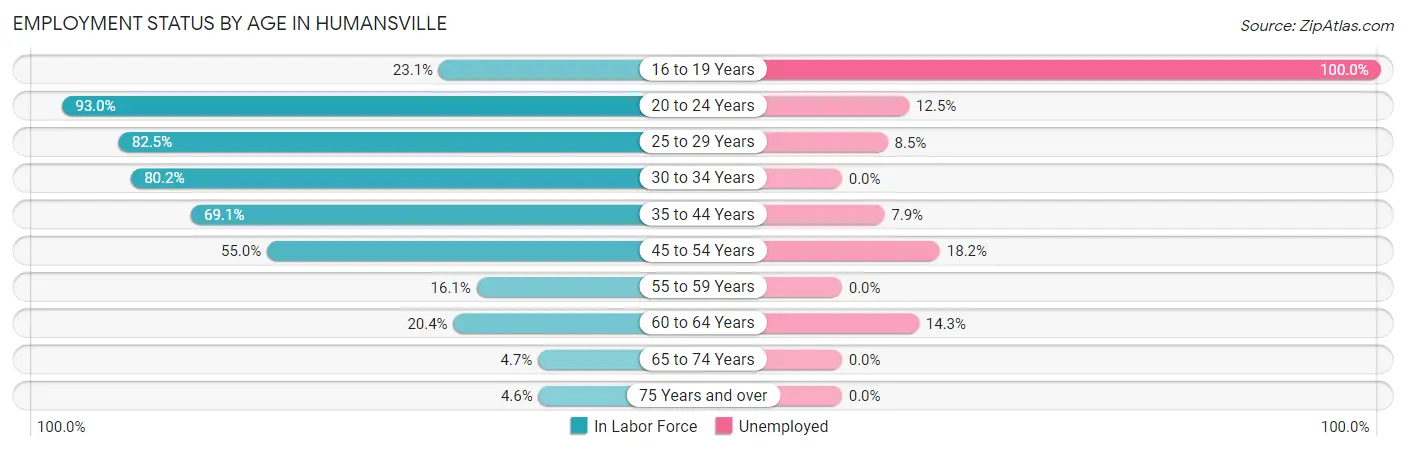
| Age Bracket | In Labor Force | Unemployed |
| 16 to 19 Years | 6 (23.1%) | 6 (100.0%) |
| 20 to 24 Years | 40 (93.0%) | 5 (12.5%) |
| 25 to 29 Years | 47 (82.5%) | 4 (8.5%) |
| 30 to 34 Years | 65 (80.2%) | 0 (0.0%) |
| 35 to 44 Years | 114 (69.1%) | 9 (7.9%) |
| 45 to 54 Years | 66 (55.0%) | 12 (18.2%) |
| 55 to 59 Years | 15 (16.1%) | 0 (0.0%) |
| 60 to 64 Years | 21 (20.4%) | 3 (14.3%) |
| 65 to 74 Years | 6 (4.7%) | 0 (0.0%) |
| 75 Years and over | 6 (4.6%) | 0 (0.0%) |
| Total | 386 (40.8%) | 39 (10.1%) |
Employment Status by Educational Attainment in Humansville
According to labor force statistics for Humansville, 53.0% of individuals (328) out of the total population between 25 and 64 years of age (619) are in the labor force, with 8.5% or 28 of them being unemployed. The group with the highest labor force participation rate are those with the educational attainment of bachelor's degree or higher, with 75.6% or 34 individuals in the labor force. Within the labor force, individuals with less than high school education have the highest percentage of unemployment, with 61.5% or 16 of them being unemployed.
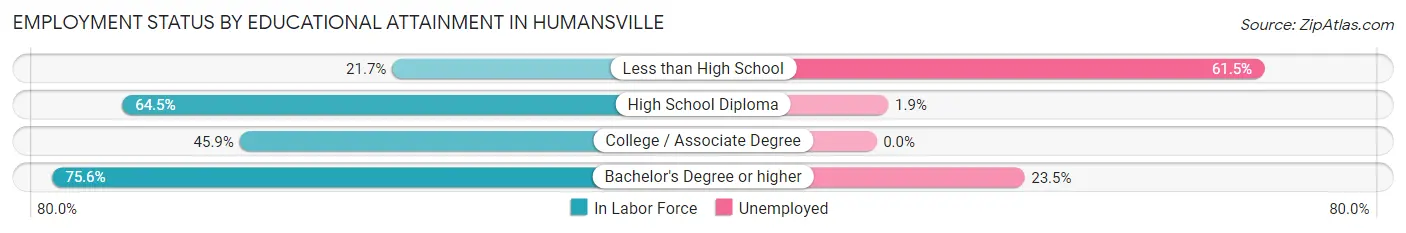
| Educational Attainment | In Labor Force | Unemployed |
| Less than High School | 26 (21.7%) | 74 (61.5%) |
| High School Diploma | 207 (64.5%) | 6 (1.9%) |
| College / Associate Degree | 61 (45.9%) | 0 (0.0%) |
| Bachelor's Degree or higher | 34 (75.6%) | 11 (23.5%) |
| Total | 328 (53.0%) | 53 (8.5%) |
Employment Occupations by Sex in Humansville
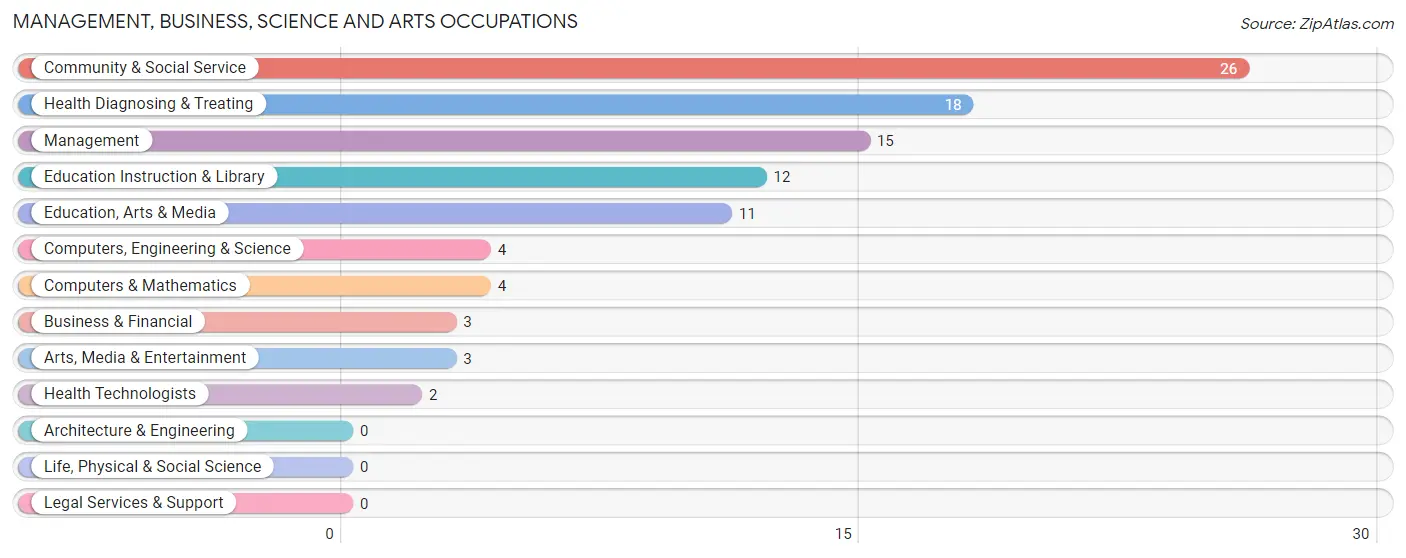
Management, Business, Science and Arts Occupations
The most common Management, Business, Science and Arts occupations in Humansville are Community & Social Service (26 | 7.5%), Health Diagnosing & Treating (18 | 5.2%), Management (15 | 4.3%), Education Instruction & Library (12 | 3.5%), and Education, Arts & Media (11 | 3.2%).
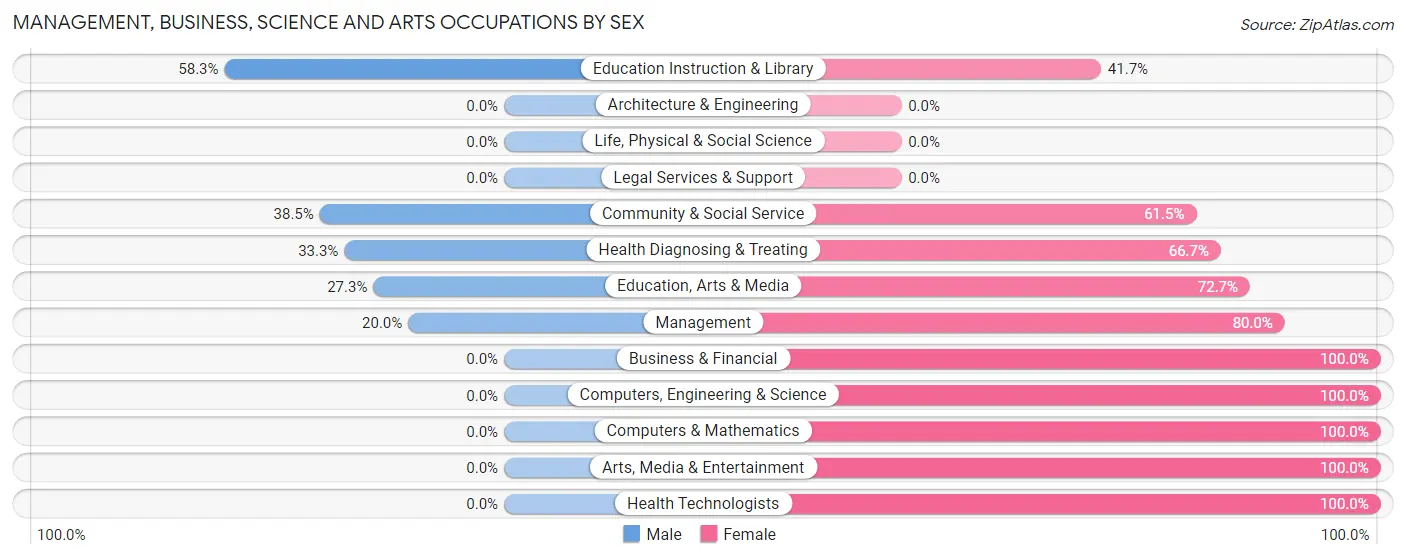
Management, Business, Science and Arts Occupations by Sex
Within the Management, Business, Science and Arts occupations in Humansville, the most male-oriented occupations are Education Instruction & Library (58.3%), Community & Social Service (38.5%), and Health Diagnosing & Treating (33.3%), while the most female-oriented occupations are Business & Financial (100.0%), Computers, Engineering & Science (100.0%), and Computers & Mathematics (100.0%).
| Occupation | Male | Female |
| Management | 3 (20.0%) | 12 (80.0%) |
| Business & Financial | 0 (0.0%) | 3 (100.0%) |
| Computers, Engineering & Science | 0 (0.0%) | 4 (100.0%) |
| Computers & Mathematics | 0 (0.0%) | 4 (100.0%) |
| Architecture & Engineering | 0 (0.0%) | 0 (0.0%) |
| Life, Physical & Social Science | 0 (0.0%) | 0 (0.0%) |
| Community & Social Service | 10 (38.5%) | 16 (61.5%) |
| Education, Arts & Media | 3 (27.3%) | 8 (72.7%) |
| Legal Services & Support | 0 (0.0%) | 0 (0.0%) |
| Education Instruction & Library | 7 (58.3%) | 5 (41.7%) |
| Arts, Media & Entertainment | 0 (0.0%) | 3 (100.0%) |
| Health Diagnosing & Treating | 6 (33.3%) | 12 (66.7%) |
| Health Technologists | 0 (0.0%) | 2 (100.0%) |
| Total (Category) | 19 (28.8%) | 47 (71.2%) |
| Total (Overall) | 177 (51.0%) | 170 (49.0%) |
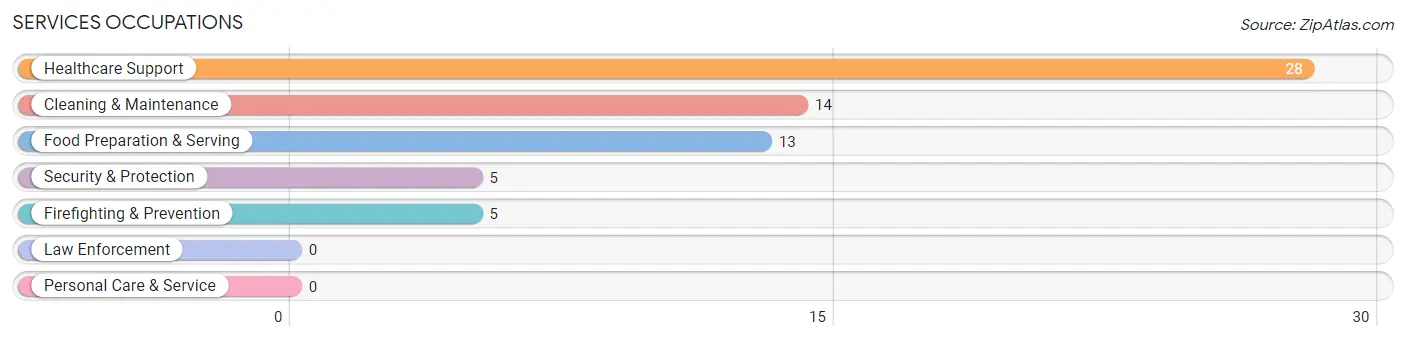
Services Occupations
The most common Services occupations in Humansville are Healthcare Support (28 | 8.1%), Cleaning & Maintenance (14 | 4.0%), Food Preparation & Serving (13 | 3.7%), Security & Protection (5 | 1.4%), and Firefighting & Prevention (5 | 1.4%).
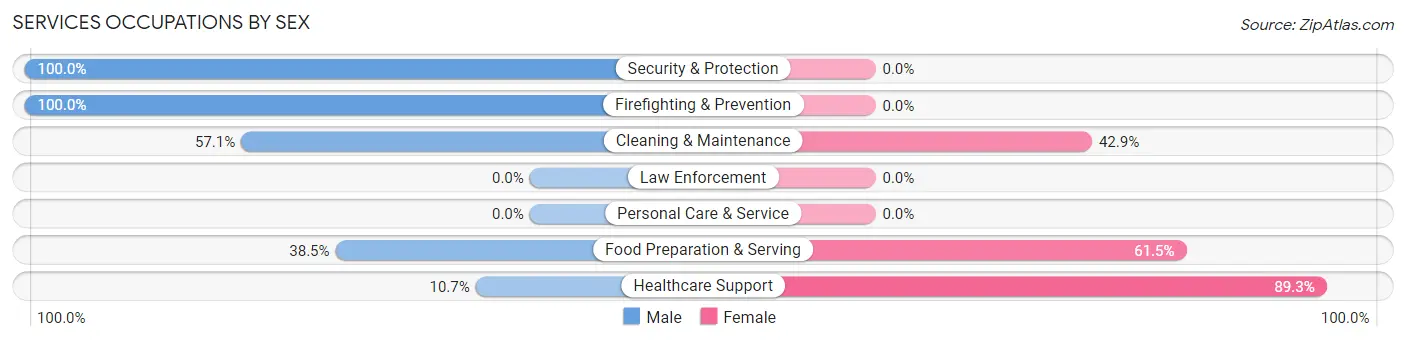
Services Occupations by Sex
Within the Services occupations in Humansville, the most male-oriented occupations are Security & Protection (100.0%), Firefighting & Prevention (100.0%), and Cleaning & Maintenance (57.1%), while the most female-oriented occupations are Healthcare Support (89.3%), Food Preparation & Serving (61.5%), and Cleaning & Maintenance (42.9%).
| Occupation | Male | Female |
| Healthcare Support | 3 (10.7%) | 25 (89.3%) |
| Security & Protection | 5 (100.0%) | 0 (0.0%) |
| Firefighting & Prevention | 5 (100.0%) | 0 (0.0%) |
| Law Enforcement | 0 (0.0%) | 0 (0.0%) |
| Food Preparation & Serving | 5 (38.5%) | 8 (61.5%) |
| Cleaning & Maintenance | 8 (57.1%) | 6 (42.9%) |
| Personal Care & Service | 0 (0.0%) | 0 (0.0%) |
| Total (Category) | 21 (35.0%) | 39 (65.0%) |
| Total (Overall) | 177 (51.0%) | 170 (49.0%) |
Sales and Office Occupations
The most common Sales and Office occupations in Humansville are Sales & Related (34 | 9.8%), and Office & Administration (20 | 5.8%).
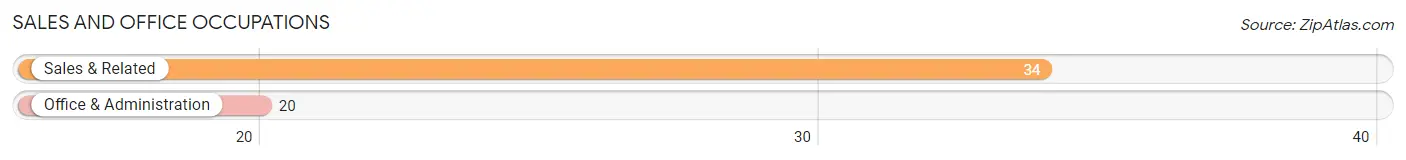
Sales and Office Occupations by Sex

| Occupation | Male | Female |
| Sales & Related | 25 (73.5%) | 9 (26.5%) |
| Office & Administration | 0 (0.0%) | 20 (100.0%) |
| Total (Category) | 25 (46.3%) | 29 (53.7%) |
| Total (Overall) | 177 (51.0%) | 170 (49.0%) |
Natural Resources, Construction and Maintenance Occupations
The most common Natural Resources, Construction and Maintenance occupations in Humansville are , and Construction & Extraction (87 | 25.1%).
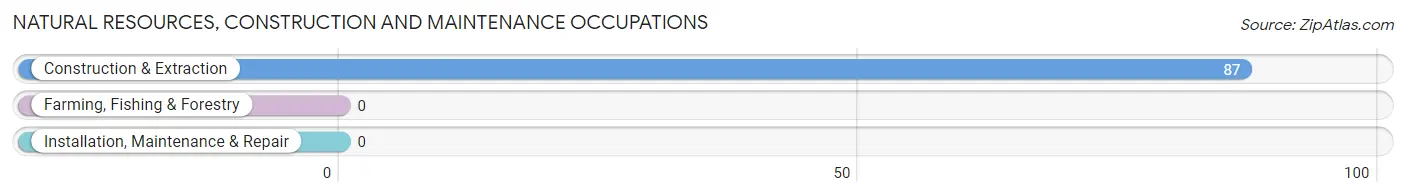
Natural Resources, Construction and Maintenance Occupations by Sex

| Occupation | Male | Female |
| Farming, Fishing & Forestry | 0 (0.0%) | 0 (0.0%) |
| Construction & Extraction | 84 (96.6%) | 3 (3.5%) |
| Installation, Maintenance & Repair | 0 (0.0%) | 0 (0.0%) |
| Total (Category) | 84 (96.6%) | 3 (3.5%) |
| Total (Overall) | 177 (51.0%) | 170 (49.0%) |
Production, Transportation and Moving Occupations
The most common Production, Transportation and Moving occupations in Humansville are Production (39 | 11.2%), Material Moving (35 | 10.1%), and Transportation (6 | 1.7%).
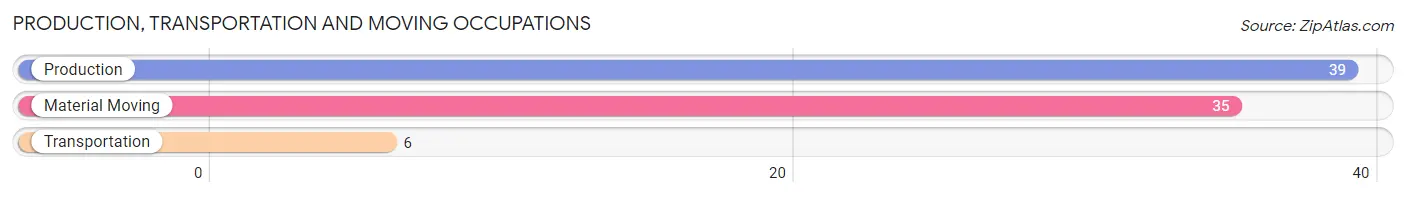
Production, Transportation and Moving Occupations by Sex
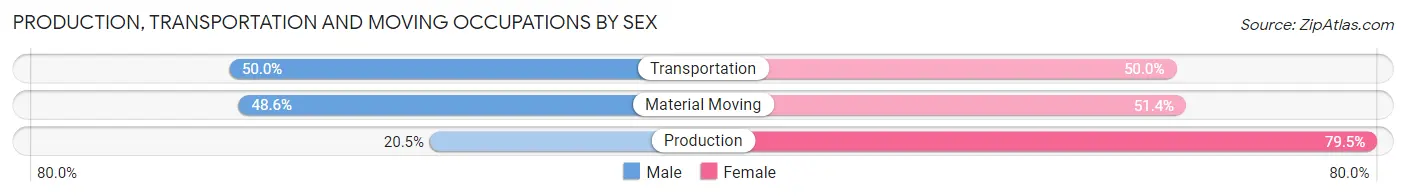
| Occupation | Male | Female |
| Production | 8 (20.5%) | 31 (79.5%) |
| Transportation | 3 (50.0%) | 3 (50.0%) |
| Material Moving | 17 (48.6%) | 18 (51.4%) |
| Total (Category) | 28 (35.0%) | 52 (65.0%) |
| Total (Overall) | 177 (51.0%) | 170 (49.0%) |
Employment Industries by Sex in Humansville
Employment Industries in Humansville
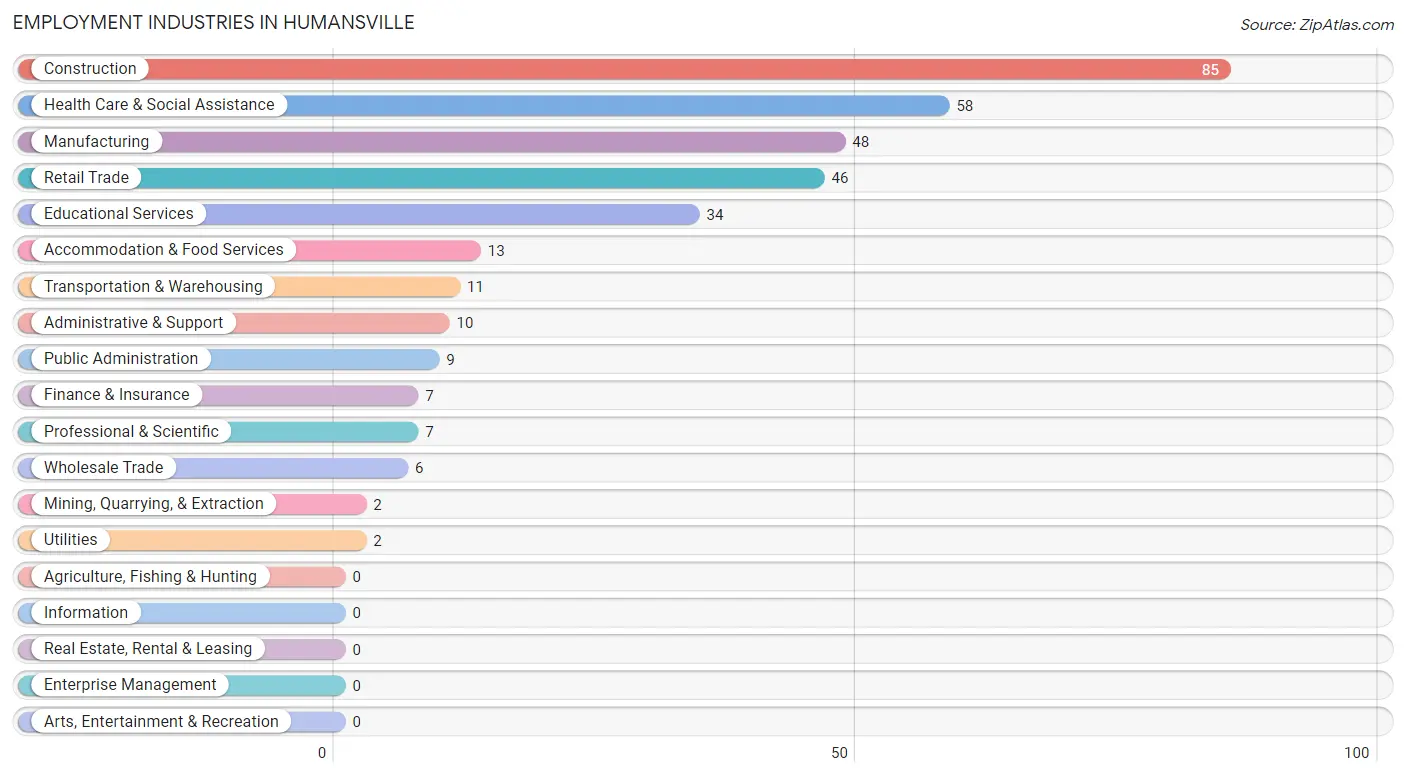
The major employment industries in Humansville include Construction (85 | 24.5%), Health Care & Social Assistance (58 | 16.7%), Manufacturing (48 | 13.8%), Retail Trade (46 | 13.3%), and Educational Services (34 | 9.8%).
Employment Industries by Sex in Humansville
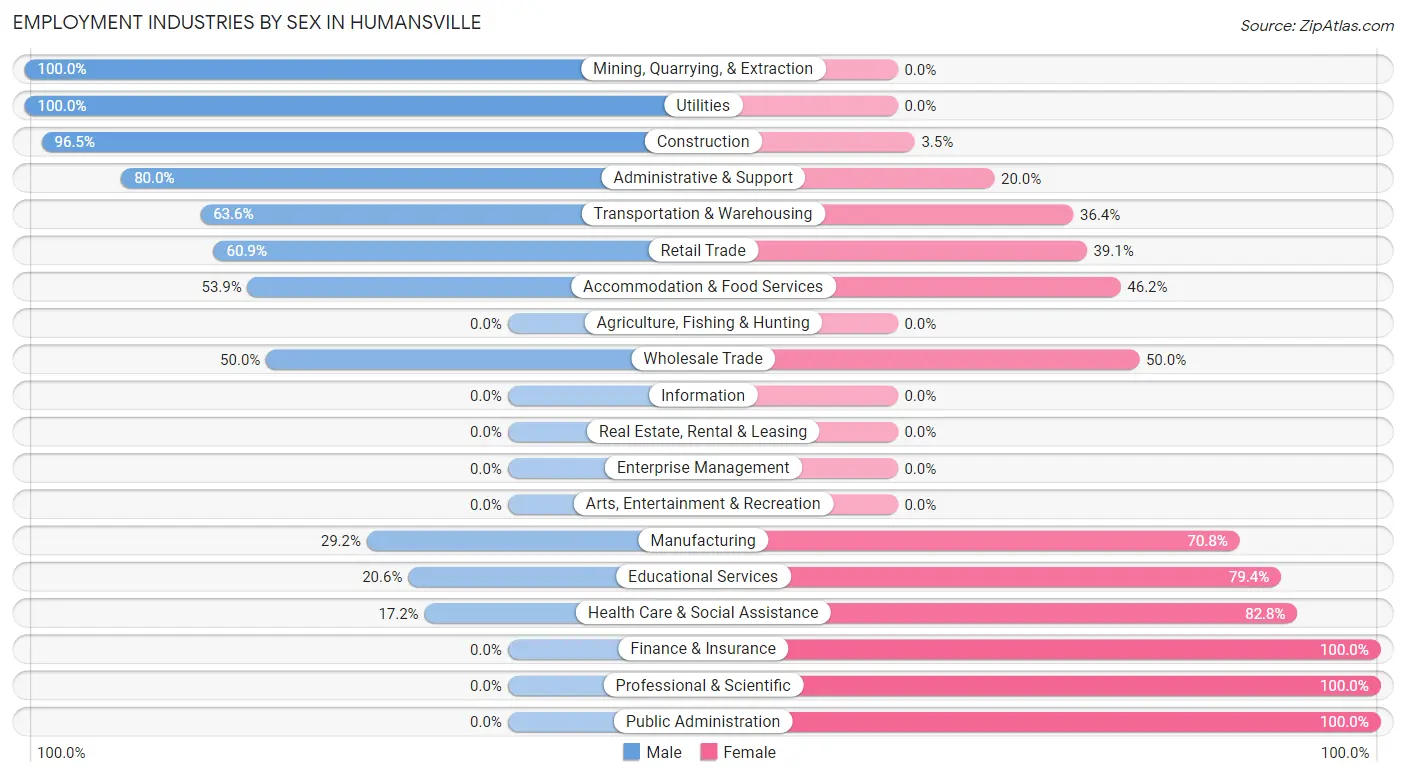
The Humansville industries that see more men than women are Mining, Quarrying, & Extraction (100.0%), Utilities (100.0%), and Construction (96.5%), whereas the industries that tend to have a higher number of women are Finance & Insurance (100.0%), Professional & Scientific (100.0%), and Public Administration (100.0%).
| Industry | Male | Female |
| Agriculture, Fishing & Hunting | 0 (0.0%) | 0 (0.0%) |
| Mining, Quarrying, & Extraction | 2 (100.0%) | 0 (0.0%) |
| Construction | 82 (96.5%) | 3 (3.5%) |
| Manufacturing | 14 (29.2%) | 34 (70.8%) |
| Wholesale Trade | 3 (50.0%) | 3 (50.0%) |
| Retail Trade | 28 (60.9%) | 18 (39.1%) |
| Transportation & Warehousing | 7 (63.6%) | 4 (36.4%) |
| Utilities | 2 (100.0%) | 0 (0.0%) |
| Information | 0 (0.0%) | 0 (0.0%) |
| Finance & Insurance | 0 (0.0%) | 7 (100.0%) |
| Real Estate, Rental & Leasing | 0 (0.0%) | 0 (0.0%) |
| Professional & Scientific | 0 (0.0%) | 7 (100.0%) |
| Enterprise Management | 0 (0.0%) | 0 (0.0%) |
| Administrative & Support | 8 (80.0%) | 2 (20.0%) |
| Educational Services | 7 (20.6%) | 27 (79.4%) |
| Health Care & Social Assistance | 10 (17.2%) | 48 (82.8%) |
| Arts, Entertainment & Recreation | 0 (0.0%) | 0 (0.0%) |
| Accommodation & Food Services | 7 (53.8%) | 6 (46.2%) |
| Public Administration | 0 (0.0%) | 9 (100.0%) |
| Total | 177 (51.0%) | 170 (49.0%) |
Education in Humansville
School Enrollment in Humansville
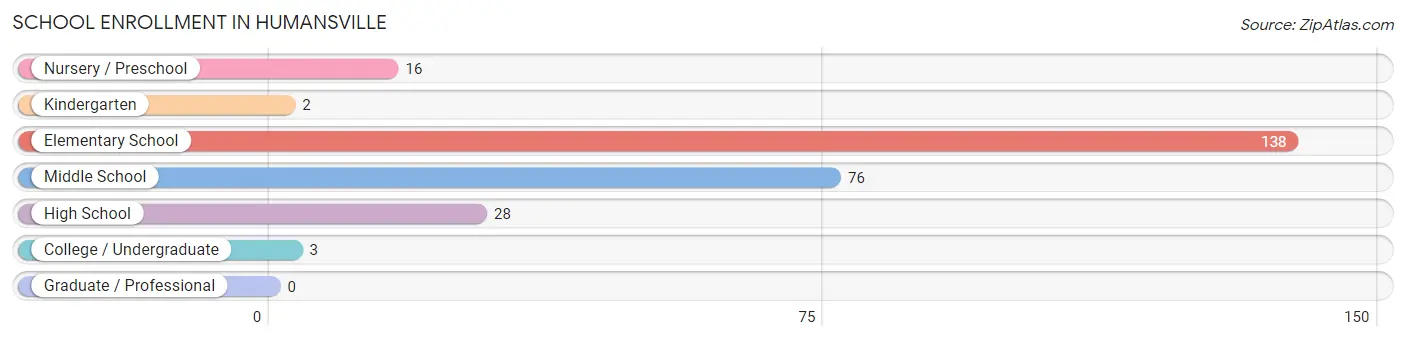
The most common levels of schooling among the 263 students in Humansville are elementary school (138 | 52.5%), middle school (76 | 28.9%), and high school (28 | 10.6%).
| School Level | # Students | % Students |
| Nursery / Preschool | 16 | 6.1% |
| Kindergarten | 2 | 0.8% |
| Elementary School | 138 | 52.5% |
| Middle School | 76 | 28.9% |
| High School | 28 | 10.6% |
| College / Undergraduate | 3 | 1.1% |
| Graduate / Professional | 0 | 0.0% |
| Total | 263 | 100.0% |
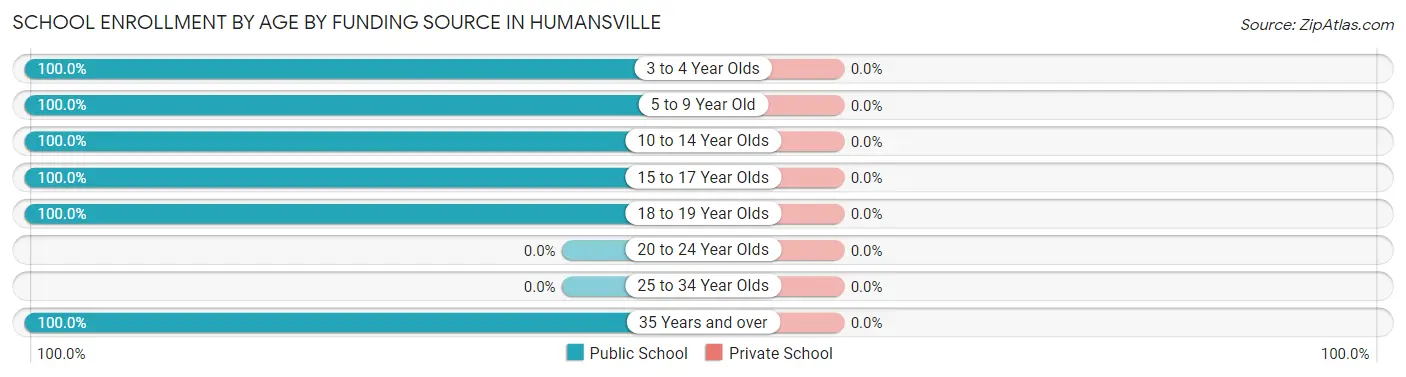
School Enrollment by Age by Funding Source in Humansville
| Age Bracket | Public School | Private School |
| 3 to 4 Year Olds | 11 (100.0%) | 0 (0.0%) |
| 5 to 9 Year Old | 145 (100.0%) | 0 (0.0%) |
| 10 to 14 Year Olds | 72 (100.0%) | 0 (0.0%) |
| 15 to 17 Year Olds | 24 (100.0%) | 0 (0.0%) |
| 18 to 19 Year Olds | 8 (100.0%) | 0 (0.0%) |
| 20 to 24 Year Olds | 0 (0.0%) | 0 (0.0%) |
| 25 to 34 Year Olds | 0 (0.0%) | 0 (0.0%) |
| 35 Years and over | 3 (100.0%) | 0 (0.0%) |
| Total | 263 (100.0%) | 0 (0.0%) |
Educational Attainment by Field of Study in Humansville
Business (20 | 29.4%), engineering (13 | 19.1%), bio, nature & agricultural (7 | 10.3%), science & technology (7 | 10.3%), and education (7 | 10.3%) are the most common fields of study among 68 individuals in Humansville who have obtained a bachelor's degree or higher.
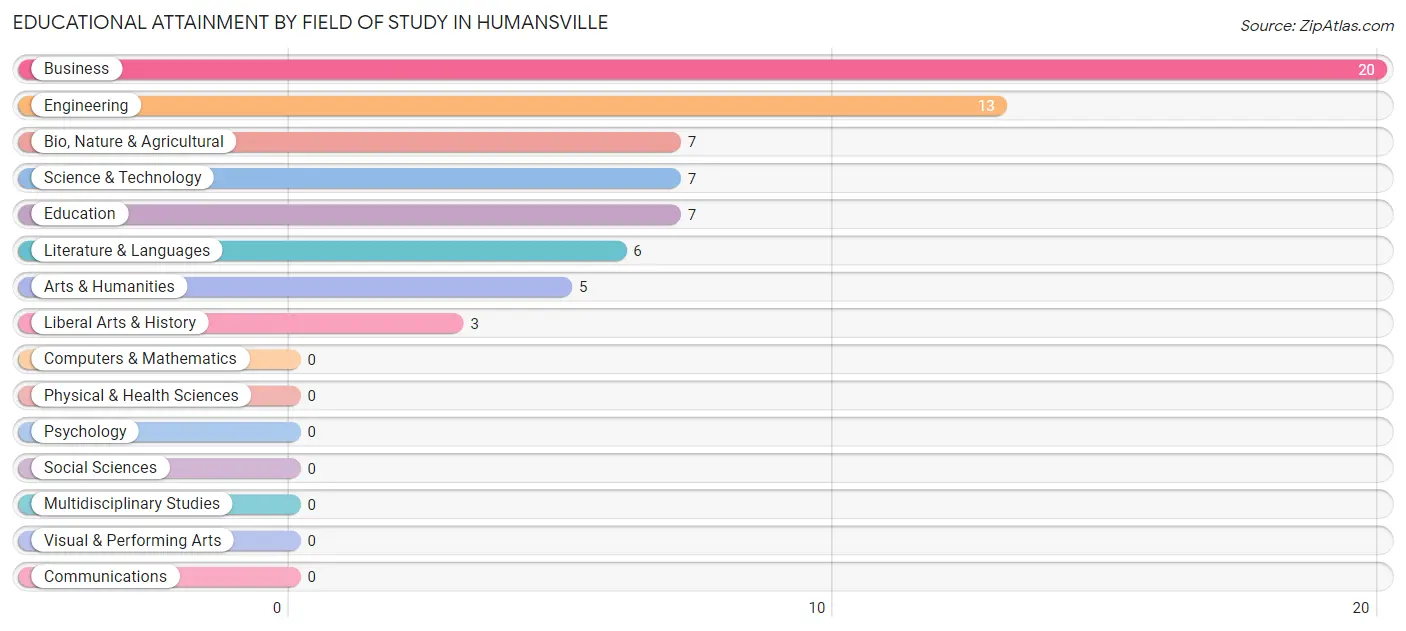
| Field of Study | # Graduates | % Graduates |
| Computers & Mathematics | 0 | 0.0% |
| Bio, Nature & Agricultural | 7 | 10.3% |
| Physical & Health Sciences | 0 | 0.0% |
| Psychology | 0 | 0.0% |
| Social Sciences | 0 | 0.0% |
| Engineering | 13 | 19.1% |
| Multidisciplinary Studies | 0 | 0.0% |
| Science & Technology | 7 | 10.3% |
| Business | 20 | 29.4% |
| Education | 7 | 10.3% |
| Literature & Languages | 6 | 8.8% |
| Liberal Arts & History | 3 | 4.4% |
| Visual & Performing Arts | 0 | 0.0% |
| Communications | 0 | 0.0% |
| Arts & Humanities | 5 | 7.3% |
| Total | 68 | 100.0% |
Transportation & Commute in Humansville
Vehicle Availability by Sex in Humansville
The most prevalent vehicle ownership categories in Humansville are males with 2 vehicles (114, accounting for 67.1%) and females with 2 vehicles (74, making up 74.5%).
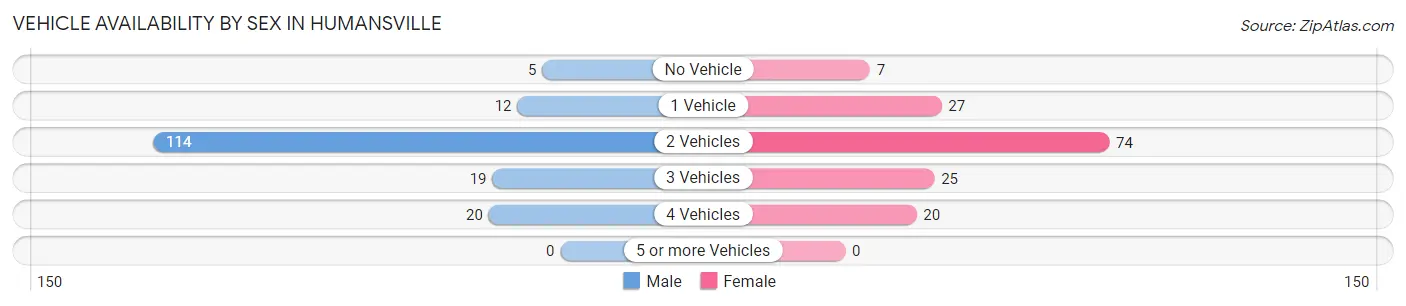
| Vehicles Available | Male | Female |
| No Vehicle | 5 (2.9%) | 7 (4.6%) |
| 1 Vehicle | 12 (7.1%) | 27 (17.6%) |
| 2 Vehicles | 114 (67.1%) | 74 (48.4%) |
| 3 Vehicles | 19 (11.2%) | 25 (16.3%) |
| 4 Vehicles | 20 (11.8%) | 20 (13.1%) |
| 5 or more Vehicles | 0 (0.0%) | 0 (0.0%) |
| Total | 170 (100.0%) | 153 (100.0%) |
Commute Time in Humansville
The most frequently occuring commute durations in Humansville are 60 to 89 minutes (128 commuters, 39.9%), 5 to 9 minutes (48 commuters, 14.9%), and 25 to 29 minutes (24 commuters, 7.5%).
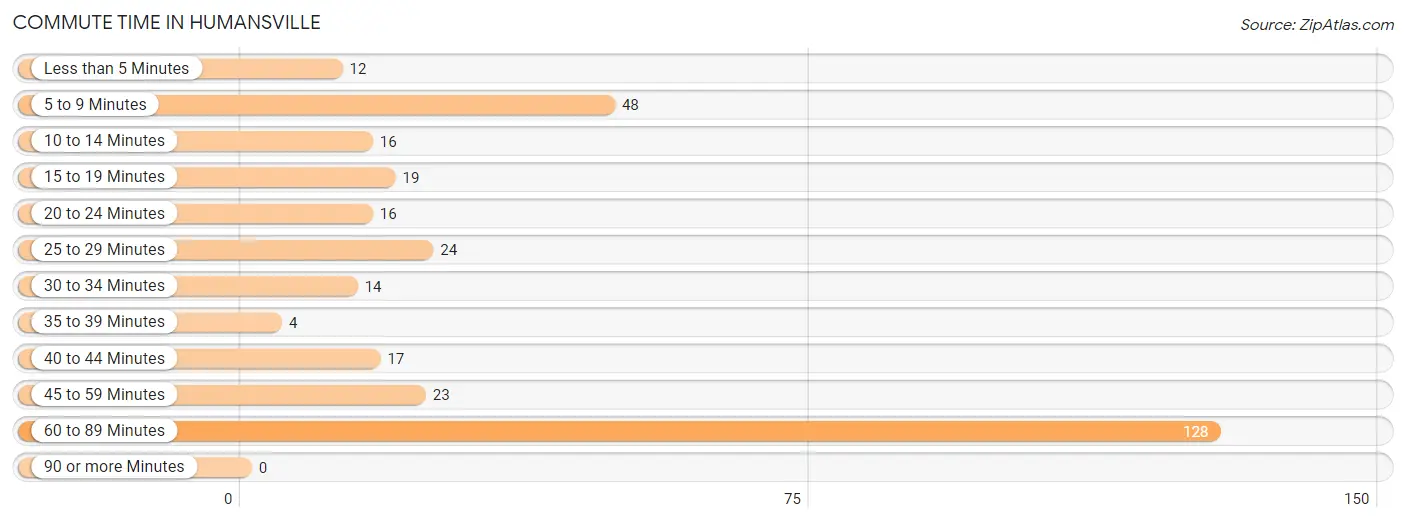
| Commute Time | # Commuters | % Commuters |
| Less than 5 Minutes | 12 | 3.7% |
| 5 to 9 Minutes | 48 | 14.9% |
| 10 to 14 Minutes | 16 | 5.0% |
| 15 to 19 Minutes | 19 | 5.9% |
| 20 to 24 Minutes | 16 | 5.0% |
| 25 to 29 Minutes | 24 | 7.5% |
| 30 to 34 Minutes | 14 | 4.4% |
| 35 to 39 Minutes | 4 | 1.3% |
| 40 to 44 Minutes | 17 | 5.3% |
| 45 to 59 Minutes | 23 | 7.2% |
| 60 to 89 Minutes | 128 | 39.9% |
| 90 or more Minutes | 0 | 0.0% |
Commute Time by Sex in Humansville
The most common commute times in Humansville are 60 to 89 minutes (95 commuters, 55.9%) for males and 60 to 89 minutes (33 commuters, 21.8%) for females.
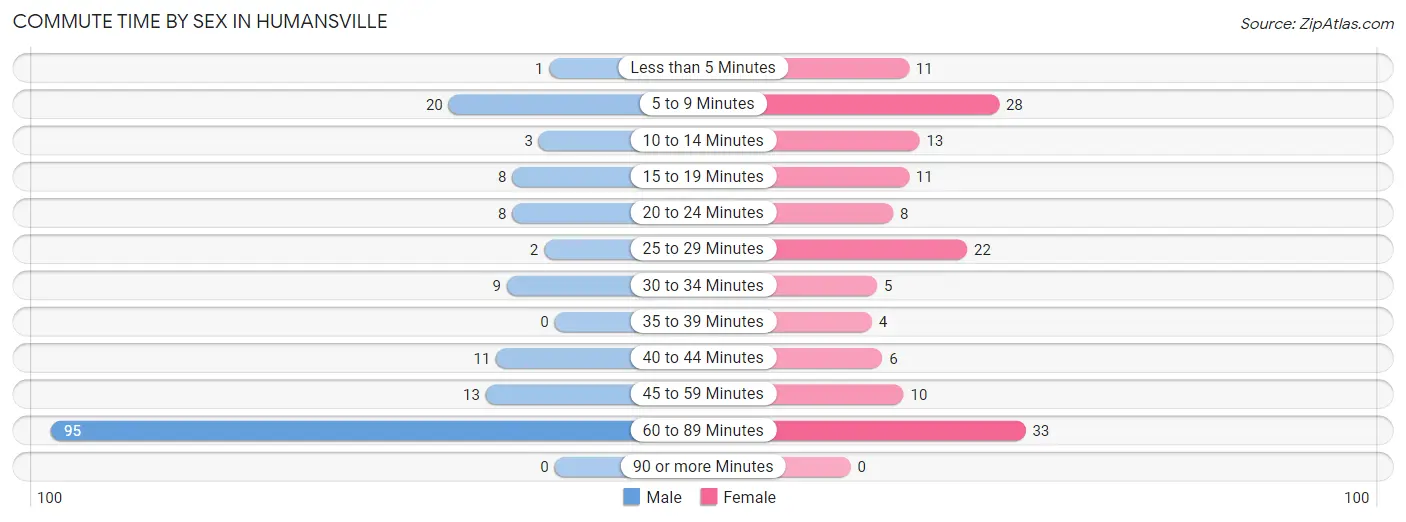
| Commute Time | Male | Female |
| Less than 5 Minutes | 1 (0.6%) | 11 (7.3%) |
| 5 to 9 Minutes | 20 (11.8%) | 28 (18.5%) |
| 10 to 14 Minutes | 3 (1.8%) | 13 (8.6%) |
| 15 to 19 Minutes | 8 (4.7%) | 11 (7.3%) |
| 20 to 24 Minutes | 8 (4.7%) | 8 (5.3%) |
| 25 to 29 Minutes | 2 (1.2%) | 22 (14.6%) |
| 30 to 34 Minutes | 9 (5.3%) | 5 (3.3%) |
| 35 to 39 Minutes | 0 (0.0%) | 4 (2.6%) |
| 40 to 44 Minutes | 11 (6.5%) | 6 (4.0%) |
| 45 to 59 Minutes | 13 (7.6%) | 10 (6.6%) |
| 60 to 89 Minutes | 95 (55.9%) | 33 (21.8%) |
| 90 or more Minutes | 0 (0.0%) | 0 (0.0%) |
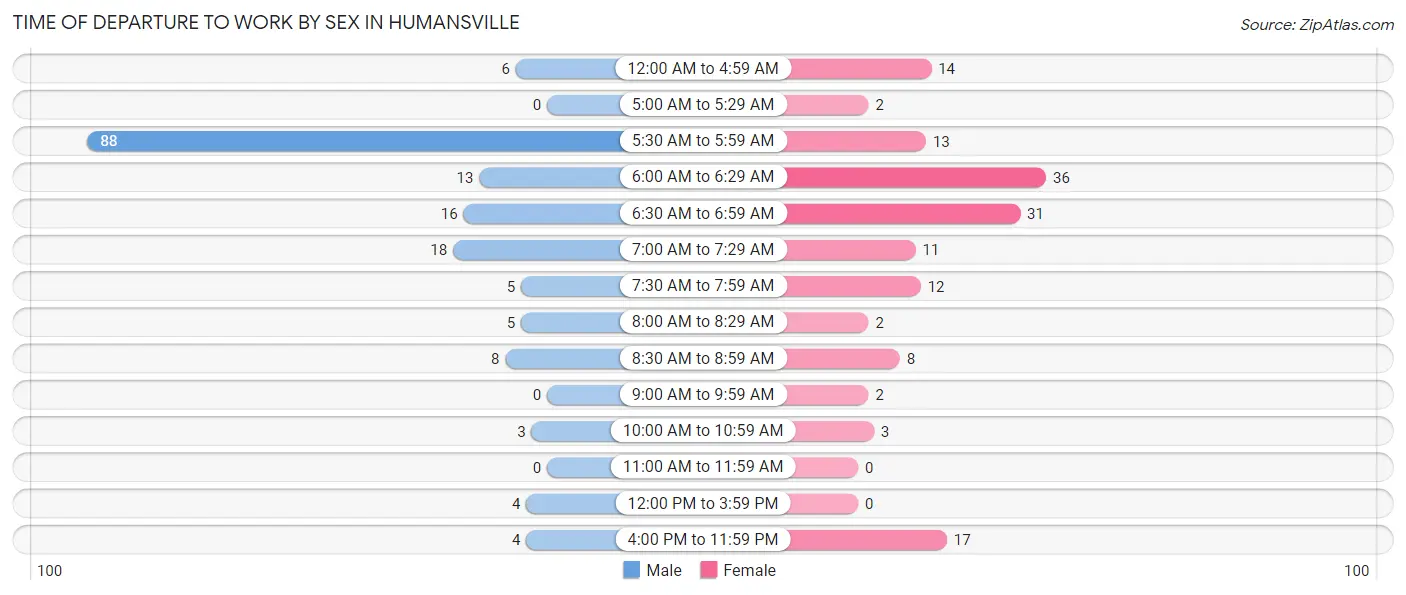
Time of Departure to Work by Sex in Humansville
The most frequent times of departure to work in Humansville are 5:30 AM to 5:59 AM (88, 51.8%) for males and 6:00 AM to 6:29 AM (36, 23.8%) for females.
| Time of Departure | Male | Female |
| 12:00 AM to 4:59 AM | 6 (3.5%) | 14 (9.3%) |
| 5:00 AM to 5:29 AM | 0 (0.0%) | 2 (1.3%) |
| 5:30 AM to 5:59 AM | 88 (51.8%) | 13 (8.6%) |
| 6:00 AM to 6:29 AM | 13 (7.6%) | 36 (23.8%) |
| 6:30 AM to 6:59 AM | 16 (9.4%) | 31 (20.5%) |
| 7:00 AM to 7:29 AM | 18 (10.6%) | 11 (7.3%) |
| 7:30 AM to 7:59 AM | 5 (2.9%) | 12 (8.0%) |
| 8:00 AM to 8:29 AM | 5 (2.9%) | 2 (1.3%) |
| 8:30 AM to 8:59 AM | 8 (4.7%) | 8 (5.3%) |
| 9:00 AM to 9:59 AM | 0 (0.0%) | 2 (1.3%) |
| 10:00 AM to 10:59 AM | 3 (1.8%) | 3 (2.0%) |
| 11:00 AM to 11:59 AM | 0 (0.0%) | 0 (0.0%) |
| 12:00 PM to 3:59 PM | 4 (2.4%) | 0 (0.0%) |
| 4:00 PM to 11:59 PM | 4 (2.4%) | 17 (11.3%) |
| Total | 170 (100.0%) | 151 (100.0%) |
Housing Occupancy in Humansville
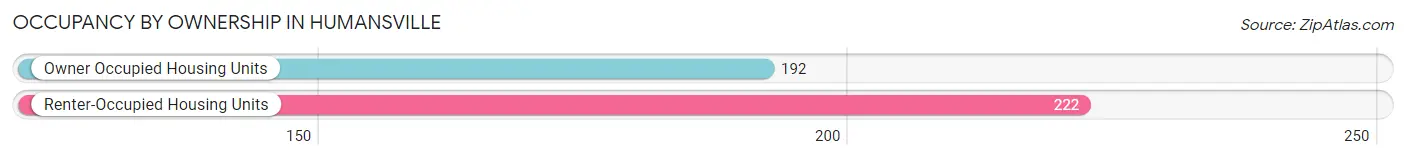
Occupancy by Ownership in Humansville
Of the total 414 dwellings in Humansville, owner-occupied units account for 192 (46.4%), while renter-occupied units make up 222 (53.6%).
| Occupancy | # Housing Units | % Housing Units |
| Owner Occupied Housing Units | 192 | 46.4% |
| Renter-Occupied Housing Units | 222 | 53.6% |
| Total Occupied Housing Units | 414 | 100.0% |
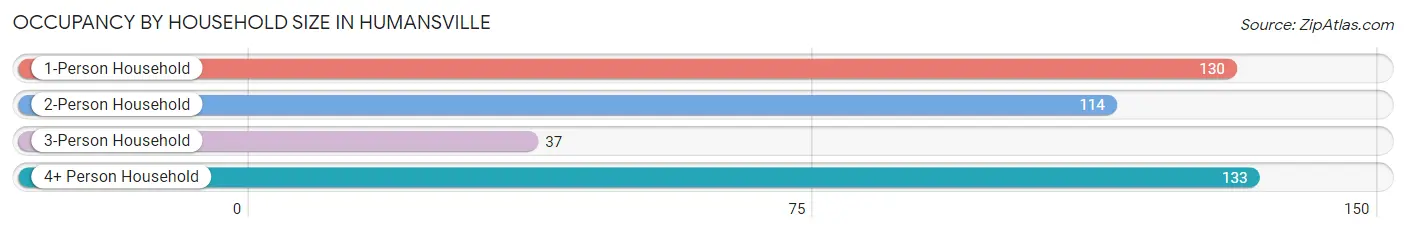
Occupancy by Household Size in Humansville
| Household Size | # Housing Units | % Housing Units |
| 1-Person Household | 130 | 31.4% |
| 2-Person Household | 114 | 27.5% |
| 3-Person Household | 37 | 8.9% |
| 4+ Person Household | 133 | 32.1% |
| Total Housing Units | 414 | 100.0% |
Occupancy by Ownership by Household Size in Humansville
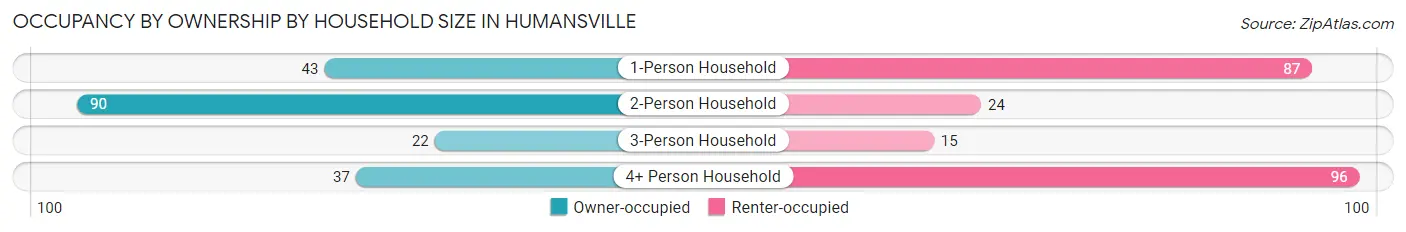
| Household Size | Owner-occupied | Renter-occupied |
| 1-Person Household | 43 (33.1%) | 87 (66.9%) |
| 2-Person Household | 90 (78.9%) | 24 (21.0%) |
| 3-Person Household | 22 (59.5%) | 15 (40.5%) |
| 4+ Person Household | 37 (27.8%) | 96 (72.2%) |
| Total Housing Units | 192 (46.4%) | 222 (53.6%) |
Occupancy by Educational Attainment in Humansville
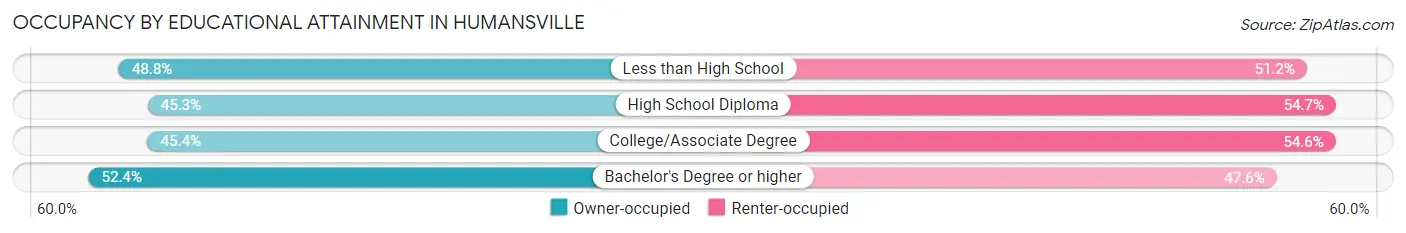
| Household Size | Owner-occupied | Renter-occupied |
| Less than High School | 40 (48.8%) | 42 (51.2%) |
| High School Diploma | 97 (45.3%) | 117 (54.7%) |
| College/Associate Degree | 44 (45.4%) | 53 (54.6%) |
| Bachelor's Degree or higher | 11 (52.4%) | 10 (47.6%) |
Occupancy by Age of Householder in Humansville
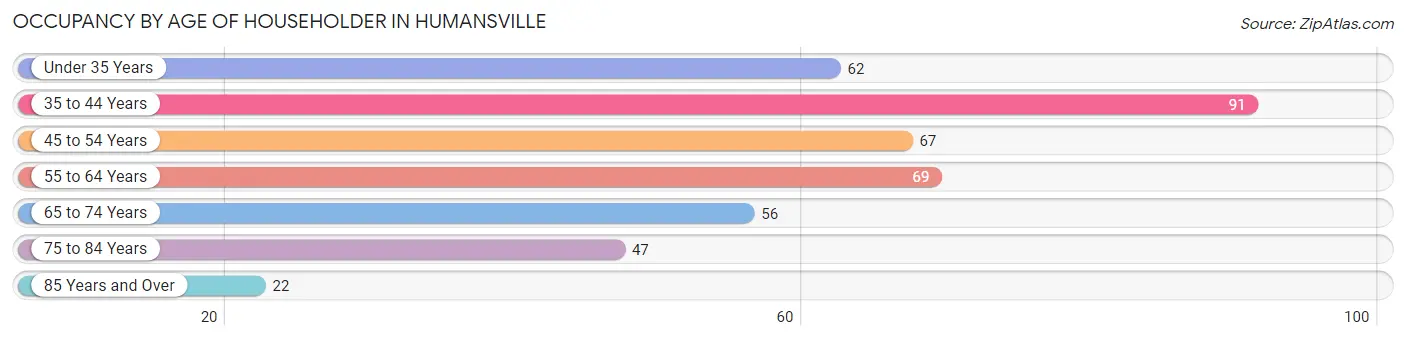
| Age Bracket | # Households | % Households |
| Under 35 Years | 62 | 15.0% |
| 35 to 44 Years | 91 | 22.0% |
| 45 to 54 Years | 67 | 16.2% |
| 55 to 64 Years | 69 | 16.7% |
| 65 to 74 Years | 56 | 13.5% |
| 75 to 84 Years | 47 | 11.4% |
| 85 Years and Over | 22 | 5.3% |
| Total | 414 | 100.0% |
Housing Finances in Humansville
Median Income by Occupancy in Humansville
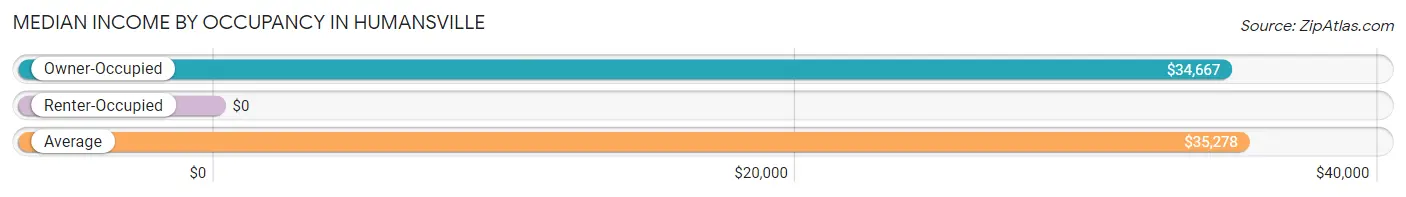
| Occupancy Type | # Households | Median Income |
| Owner-Occupied | 192 (46.4%) | $34,667 |
| Renter-Occupied | 222 (53.6%) | $0 |
| Average | 414 (100.0%) | $35,278 |
Occupancy by Householder Income Bracket in Humansville
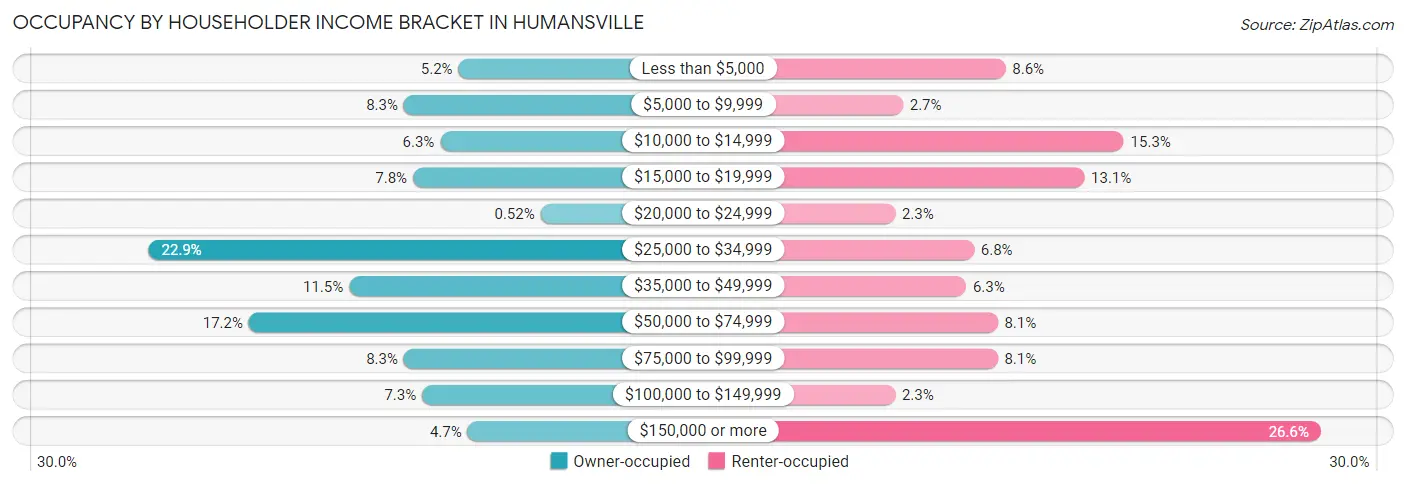
| Income Bracket | Owner-occupied | Renter-occupied |
| Less than $5,000 | 10 (5.2%) | 19 (8.6%) |
| $5,000 to $9,999 | 16 (8.3%) | 6 (2.7%) |
| $10,000 to $14,999 | 12 (6.2%) | 34 (15.3%) |
| $15,000 to $19,999 | 15 (7.8%) | 29 (13.1%) |
| $20,000 to $24,999 | 1 (0.5%) | 5 (2.2%) |
| $25,000 to $34,999 | 44 (22.9%) | 15 (6.8%) |
| $35,000 to $49,999 | 22 (11.5%) | 14 (6.3%) |
| $50,000 to $74,999 | 33 (17.2%) | 18 (8.1%) |
| $75,000 to $99,999 | 16 (8.3%) | 18 (8.1%) |
| $100,000 to $149,999 | 14 (7.3%) | 5 (2.2%) |
| $150,000 or more | 9 (4.7%) | 59 (26.6%) |
| Total | 192 (100.0%) | 222 (100.0%) |
Monthly Housing Cost Tiers in Humansville
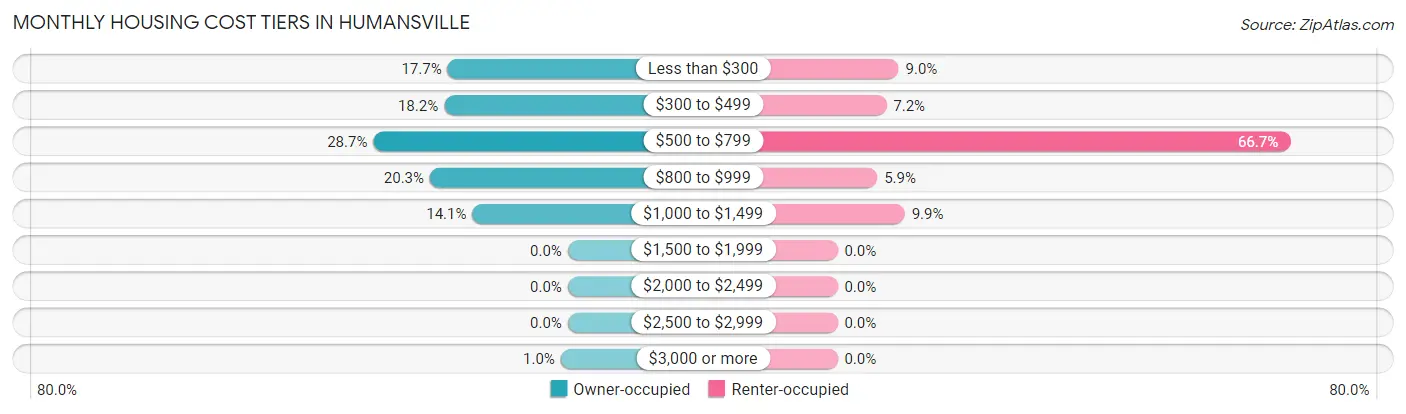
| Monthly Cost | Owner-occupied | Renter-occupied |
| Less than $300 | 34 (17.7%) | 20 (9.0%) |
| $300 to $499 | 35 (18.2%) | 16 (7.2%) |
| $500 to $799 | 55 (28.6%) | 148 (66.7%) |
| $800 to $999 | 39 (20.3%) | 13 (5.9%) |
| $1,000 to $1,499 | 27 (14.1%) | 22 (9.9%) |
| $1,500 to $1,999 | 0 (0.0%) | 0 (0.0%) |
| $2,000 to $2,499 | 0 (0.0%) | 0 (0.0%) |
| $2,500 to $2,999 | 0 (0.0%) | 0 (0.0%) |
| $3,000 or more | 2 (1.0%) | 0 (0.0%) |
| Total | 192 (100.0%) | 222 (100.0%) |
Physical Housing Characteristics in Humansville
Housing Structures in Humansville
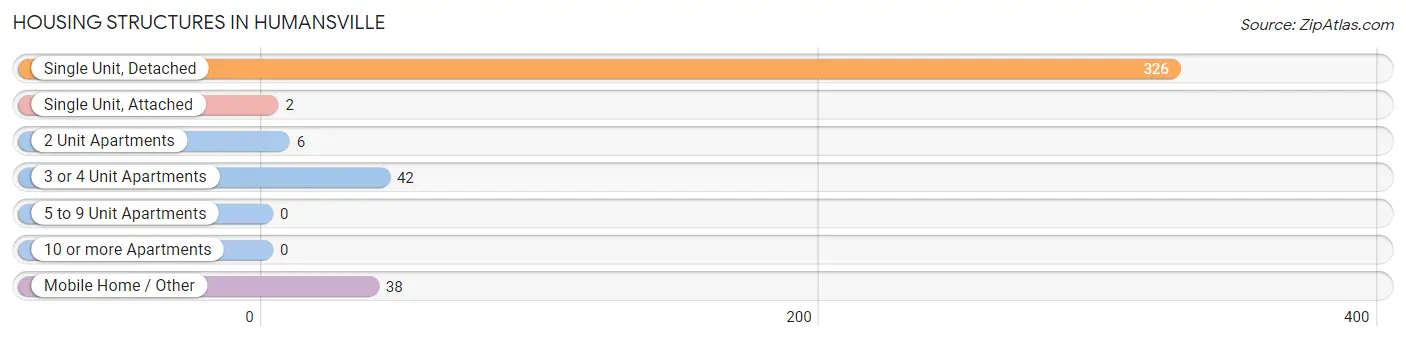
| Structure Type | # Housing Units | % Housing Units |
| Single Unit, Detached | 326 | 78.7% |
| Single Unit, Attached | 2 | 0.5% |
| 2 Unit Apartments | 6 | 1.5% |
| 3 or 4 Unit Apartments | 42 | 10.1% |
| 5 to 9 Unit Apartments | 0 | 0.0% |
| 10 or more Apartments | 0 | 0.0% |
| Mobile Home / Other | 38 | 9.2% |
| Total | 414 | 100.0% |
Housing Structures by Occupancy in Humansville
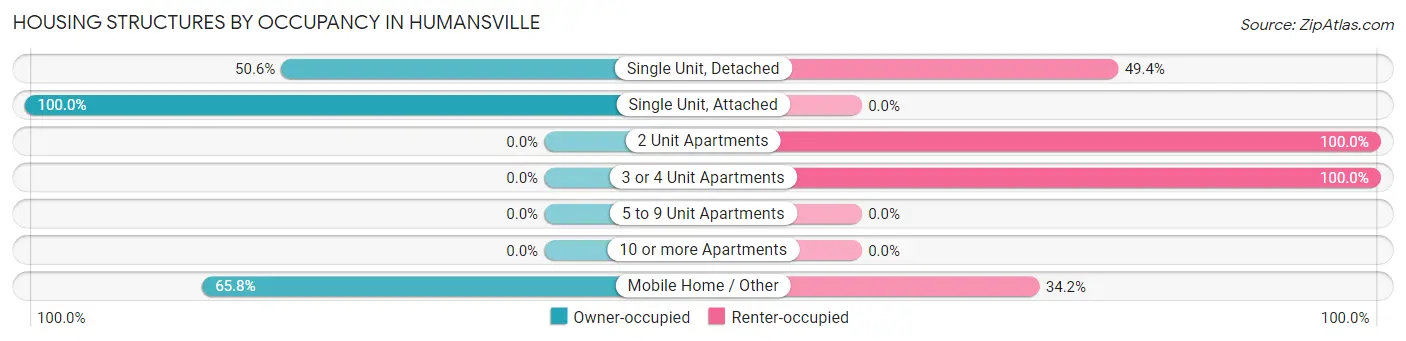
| Structure Type | Owner-occupied | Renter-occupied |
| Single Unit, Detached | 165 (50.6%) | 161 (49.4%) |
| Single Unit, Attached | 2 (100.0%) | 0 (0.0%) |
| 2 Unit Apartments | 0 (0.0%) | 6 (100.0%) |
| 3 or 4 Unit Apartments | 0 (0.0%) | 42 (100.0%) |
| 5 to 9 Unit Apartments | 0 (0.0%) | 0 (0.0%) |
| 10 or more Apartments | 0 (0.0%) | 0 (0.0%) |
| Mobile Home / Other | 25 (65.8%) | 13 (34.2%) |
| Total | 192 (46.4%) | 222 (53.6%) |
Housing Structures by Number of Rooms in Humansville
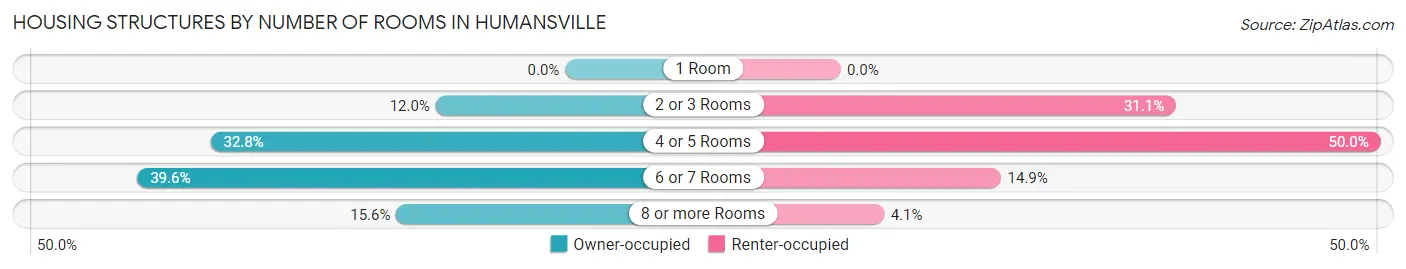
| Number of Rooms | Owner-occupied | Renter-occupied |
| 1 Room | 0 (0.0%) | 0 (0.0%) |
| 2 or 3 Rooms | 23 (12.0%) | 69 (31.1%) |
| 4 or 5 Rooms | 63 (32.8%) | 111 (50.0%) |
| 6 or 7 Rooms | 76 (39.6%) | 33 (14.9%) |
| 8 or more Rooms | 30 (15.6%) | 9 (4.1%) |
| Total | 192 (100.0%) | 222 (100.0%) |
Housing Structure by Heating Type in Humansville
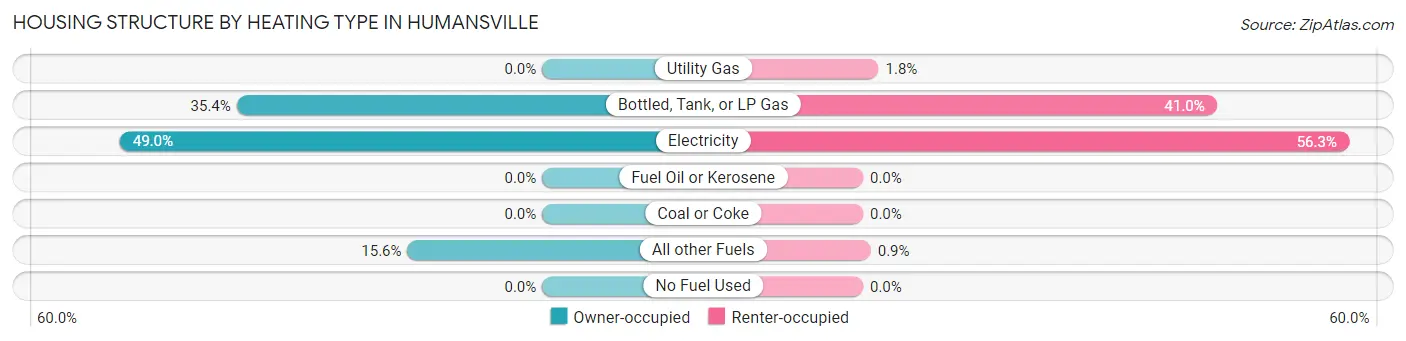
| Heating Type | Owner-occupied | Renter-occupied |
| Utility Gas | 0 (0.0%) | 4 (1.8%) |
| Bottled, Tank, or LP Gas | 68 (35.4%) | 91 (41.0%) |
| Electricity | 94 (49.0%) | 125 (56.3%) |
| Fuel Oil or Kerosene | 0 (0.0%) | 0 (0.0%) |
| Coal or Coke | 0 (0.0%) | 0 (0.0%) |
| All other Fuels | 30 (15.6%) | 2 (0.9%) |
| No Fuel Used | 0 (0.0%) | 0 (0.0%) |
| Total | 192 (100.0%) | 222 (100.0%) |
Household Vehicle Usage in Humansville
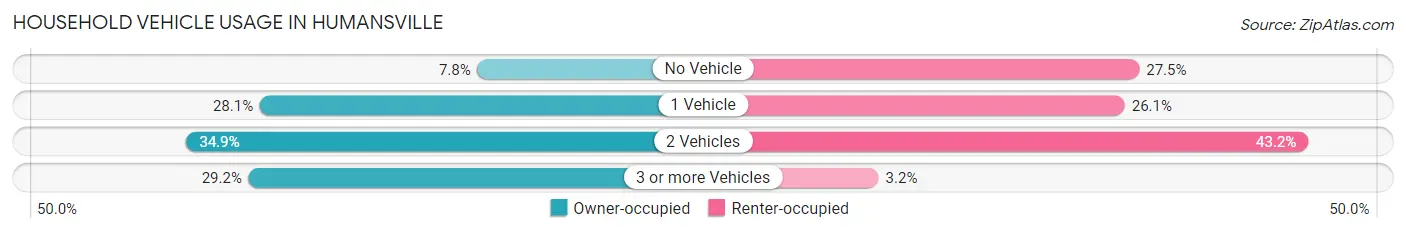
| Vehicles per Household | Owner-occupied | Renter-occupied |
| No Vehicle | 15 (7.8%) | 61 (27.5%) |
| 1 Vehicle | 54 (28.1%) | 58 (26.1%) |
| 2 Vehicles | 67 (34.9%) | 96 (43.2%) |
| 3 or more Vehicles | 56 (29.2%) | 7 (3.2%) |
| Total | 192 (100.0%) | 222 (100.0%) |
Real Estate & Mortgages in Humansville
Real Estate and Mortgage Overview in Humansville
| Characteristic | Without Mortgage | With Mortgage |
| Housing Units | 103 | 89 |
| Median Property Value | $44,800 | $75,000 |
| Median Household Income | $34,063 | $4 |
| Monthly Housing Costs | $346 | $2 |
| Real Estate Taxes | $518 | $3 |
Property Value by Mortgage Status in Humansville
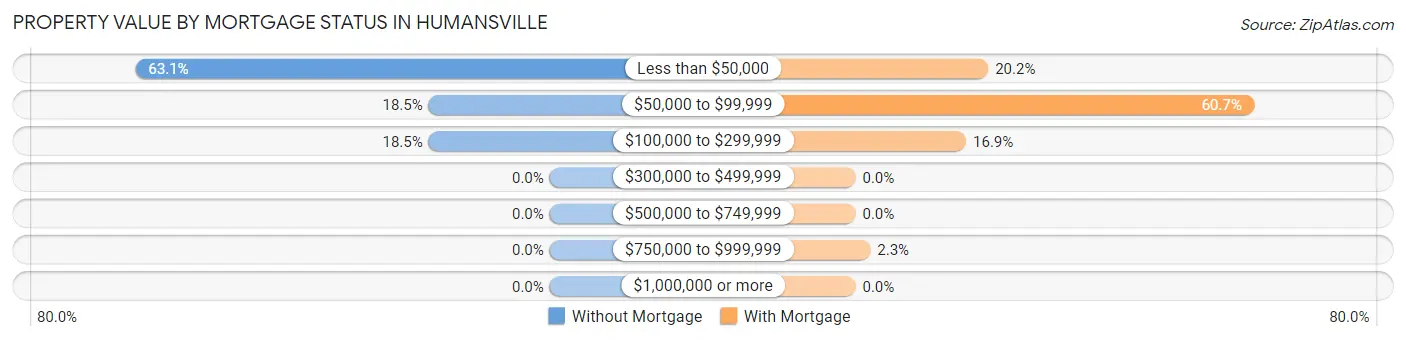
| Property Value | Without Mortgage | With Mortgage |
| Less than $50,000 | 65 (63.1%) | 18 (20.2%) |
| $50,000 to $99,999 | 19 (18.4%) | 54 (60.7%) |
| $100,000 to $299,999 | 19 (18.4%) | 15 (16.9%) |
| $300,000 to $499,999 | 0 (0.0%) | 0 (0.0%) |
| $500,000 to $749,999 | 0 (0.0%) | 0 (0.0%) |
| $750,000 to $999,999 | 0 (0.0%) | 2 (2.2%) |
| $1,000,000 or more | 0 (0.0%) | 0 (0.0%) |
| Total | 103 (100.0%) | 89 (100.0%) |
Household Income by Mortgage Status in Humansville
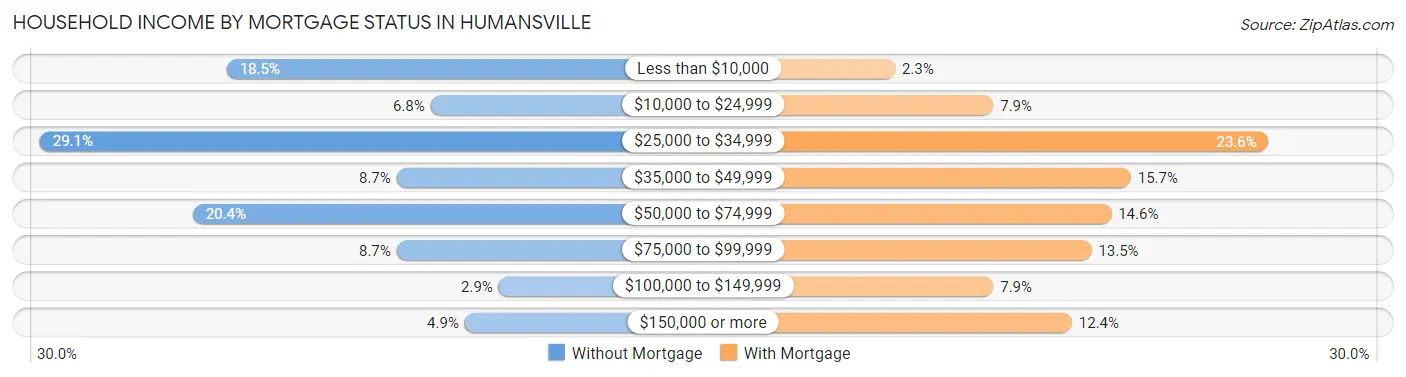
| Household Income | Without Mortgage | With Mortgage |
| Less than $10,000 | 19 (18.4%) | 2 (2.2%) |
| $10,000 to $24,999 | 7 (6.8%) | 7 (7.9%) |
| $25,000 to $34,999 | 30 (29.1%) | 21 (23.6%) |
| $35,000 to $49,999 | 9 (8.7%) | 14 (15.7%) |
| $50,000 to $74,999 | 21 (20.4%) | 13 (14.6%) |
| $75,000 to $99,999 | 9 (8.7%) | 12 (13.5%) |
| $100,000 to $149,999 | 3 (2.9%) | 7 (7.9%) |
| $150,000 or more | 5 (4.9%) | 11 (12.4%) |
| Total | 103 (100.0%) | 89 (100.0%) |
Property Value to Household Income Ratio in Humansville
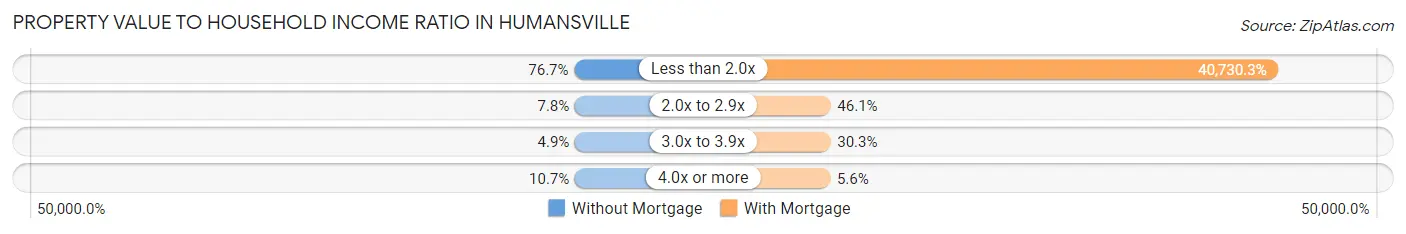
| Value-to-Income Ratio | Without Mortgage | With Mortgage |
| Less than 2.0x | 79 (76.7%) | 36,250 (40,730.3%) |
| 2.0x to 2.9x | 8 (7.8%) | 41 (46.1%) |
| 3.0x to 3.9x | 5 (4.9%) | 27 (30.3%) |
| 4.0x or more | 11 (10.7%) | 5 (5.6%) |
| Total | 103 (100.0%) | 89 (100.0%) |
Real Estate Taxes by Mortgage Status in Humansville
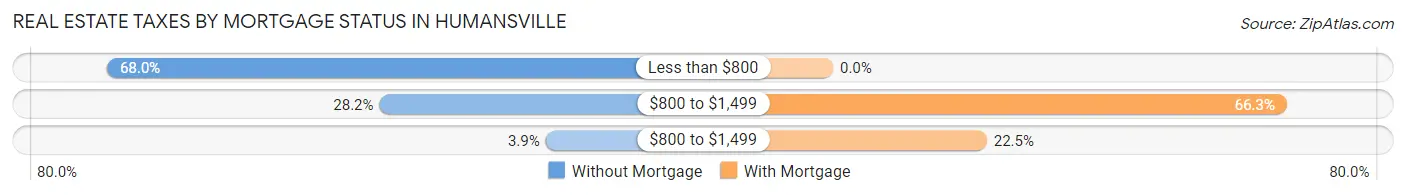
| Property Taxes | Without Mortgage | With Mortgage |
| Less than $800 | 70 (68.0%) | 0 (0.0%) |
| $800 to $1,499 | 29 (28.2%) | 59 (66.3%) |
| $800 to $1,499 | 4 (3.9%) | 20 (22.5%) |
| Total | 103 (100.0%) | 89 (100.0%) |
Health & Disability in Humansville
Health Insurance Coverage by Age in Humansville
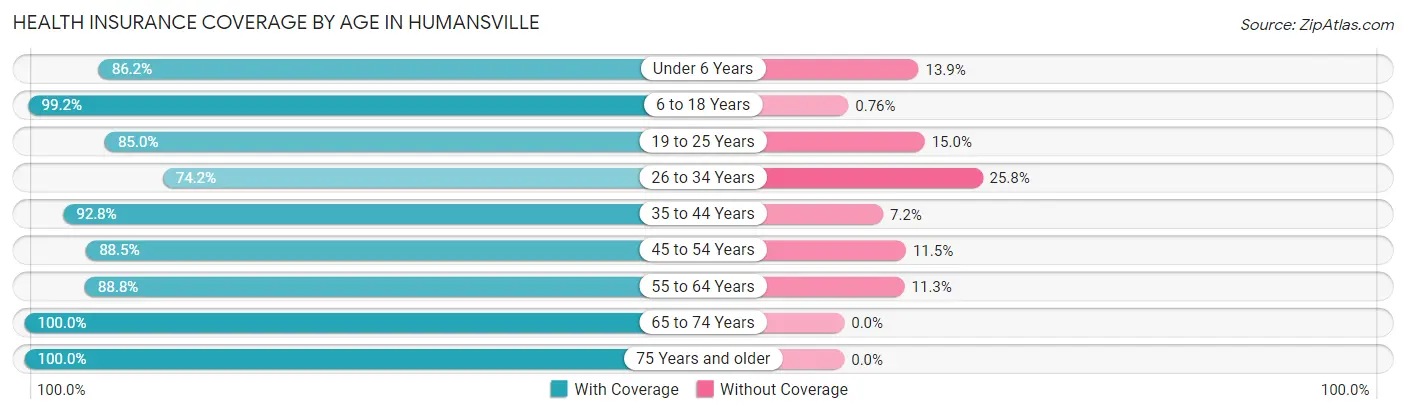
| Age Bracket | With Coverage | Without Coverage |
| Under 6 Years | 56 (86.2%) | 9 (13.9%) |
| 6 to 18 Years | 262 (99.2%) | 2 (0.8%) |
| 19 to 25 Years | 51 (85.0%) | 9 (15.0%) |
| 26 to 34 Years | 95 (74.2%) | 33 (25.8%) |
| 35 to 44 Years | 141 (92.8%) | 11 (7.2%) |
| 45 to 54 Years | 100 (88.5%) | 13 (11.5%) |
| 55 to 64 Years | 142 (88.7%) | 18 (11.3%) |
| 65 to 74 Years | 89 (100.0%) | 0 (0.0%) |
| 75 Years and older | 90 (100.0%) | 0 (0.0%) |
| Total | 1,026 (91.5%) | 95 (8.5%) |
Health Insurance Coverage by Citizenship Status in Humansville
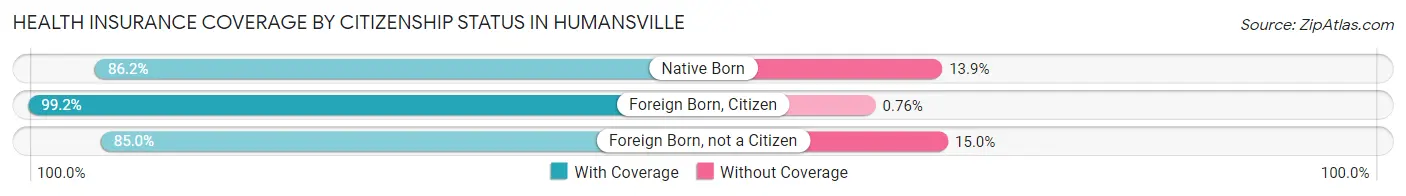
| Citizenship Status | With Coverage | Without Coverage |
| Native Born | 56 (86.2%) | 9 (13.9%) |
| Foreign Born, Citizen | 262 (99.2%) | 2 (0.8%) |
| Foreign Born, not a Citizen | 51 (85.0%) | 9 (15.0%) |
Health Insurance Coverage by Household Income in Humansville
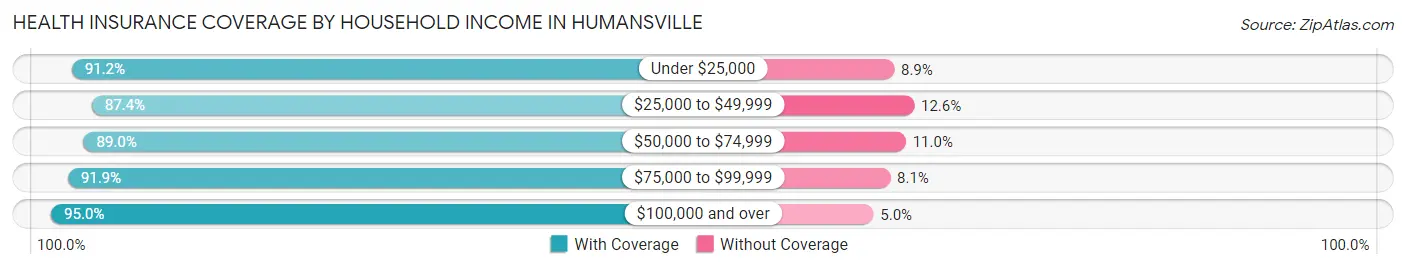
| Household Income | With Coverage | Without Coverage |
| Under $25,000 | 206 (91.1%) | 20 (8.8%) |
| $25,000 to $49,999 | 222 (87.4%) | 32 (12.6%) |
| $50,000 to $74,999 | 137 (89.0%) | 17 (11.0%) |
| $75,000 to $99,999 | 102 (91.9%) | 9 (8.1%) |
| $100,000 and over | 325 (95.0%) | 17 (5.0%) |
Public vs Private Health Insurance Coverage by Age in Humansville
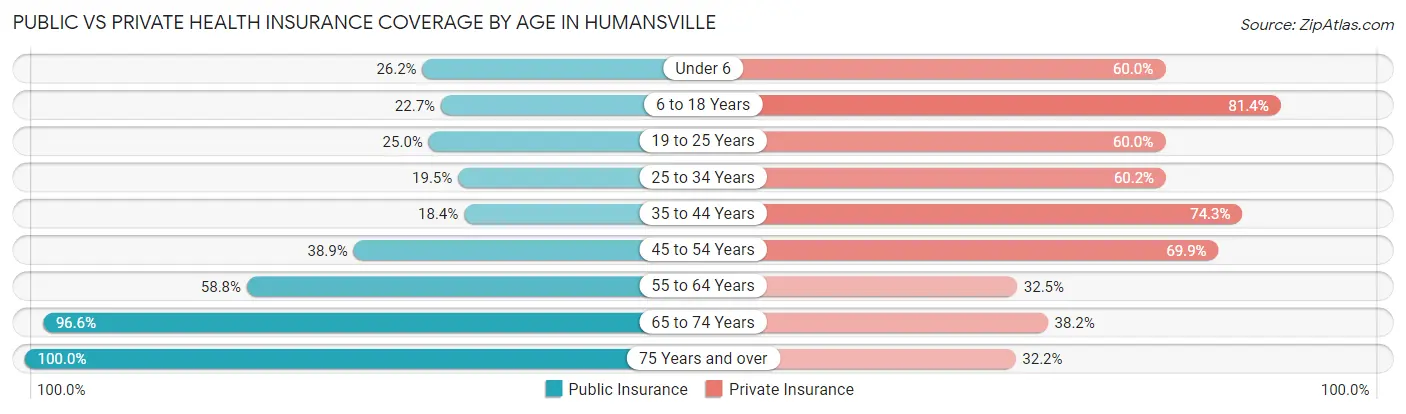
| Age Bracket | Public Insurance | Private Insurance |
| Under 6 | 17 (26.2%) | 39 (60.0%) |
| 6 to 18 Years | 60 (22.7%) | 215 (81.4%) |
| 19 to 25 Years | 15 (25.0%) | 36 (60.0%) |
| 25 to 34 Years | 25 (19.5%) | 77 (60.2%) |
| 35 to 44 Years | 28 (18.4%) | 113 (74.3%) |
| 45 to 54 Years | 44 (38.9%) | 79 (69.9%) |
| 55 to 64 Years | 94 (58.8%) | 52 (32.5%) |
| 65 to 74 Years | 86 (96.6%) | 34 (38.2%) |
| 75 Years and over | 90 (100.0%) | 29 (32.2%) |
| Total | 459 (40.9%) | 674 (60.1%) |
Disability Status by Sex by Age in Humansville
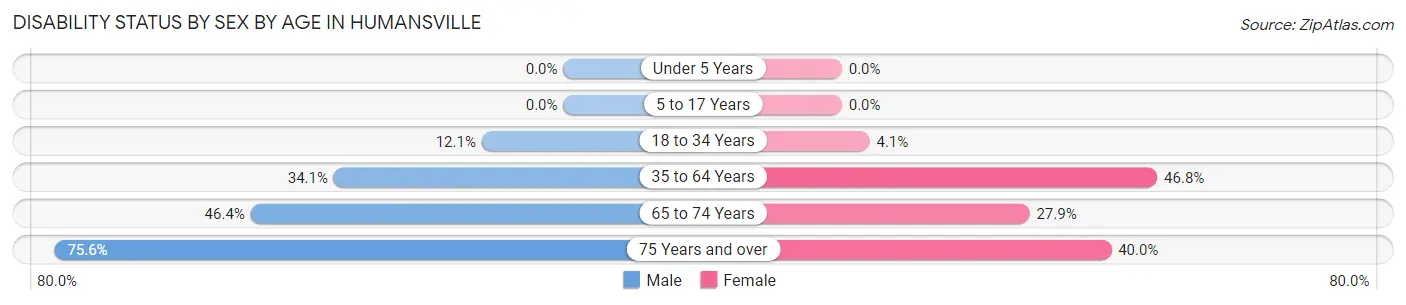
| Age Bracket | Male | Female |
| Under 5 Years | 0 (0.0%) | 0 (0.0%) |
| 5 to 17 Years | 0 (0.0%) | 0 (0.0%) |
| 18 to 34 Years | 12 (12.1%) | 4 (4.1%) |
| 35 to 64 Years | 75 (34.1%) | 96 (46.8%) |
| 65 to 74 Years | 13 (46.4%) | 17 (27.9%) |
| 75 Years and over | 34 (75.6%) | 18 (40.0%) |
Disability Class by Sex by Age in Humansville
Disability Class: Hearing Difficulty
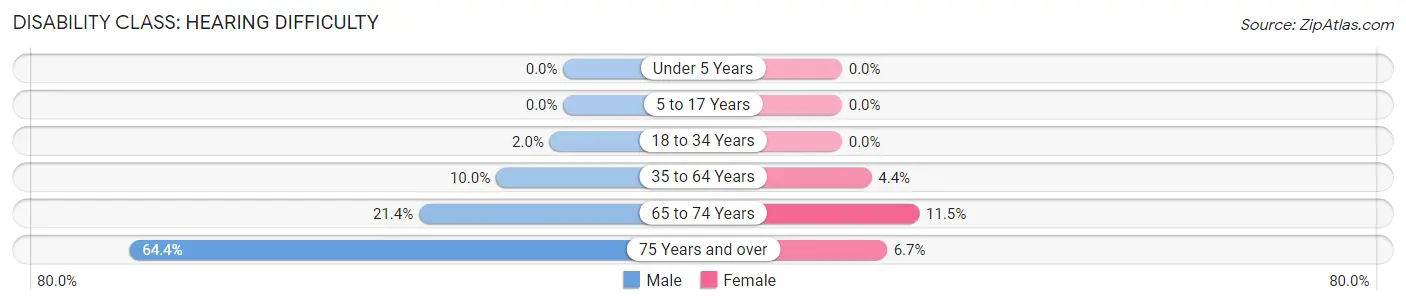
| Age Bracket | Male | Female |
| Under 5 Years | 0 (0.0%) | 0 (0.0%) |
| 5 to 17 Years | 0 (0.0%) | 0 (0.0%) |
| 18 to 34 Years | 2 (2.0%) | 0 (0.0%) |
| 35 to 64 Years | 22 (10.0%) | 9 (4.4%) |
| 65 to 74 Years | 6 (21.4%) | 7 (11.5%) |
| 75 Years and over | 29 (64.4%) | 3 (6.7%) |
Disability Class: Vision Difficulty
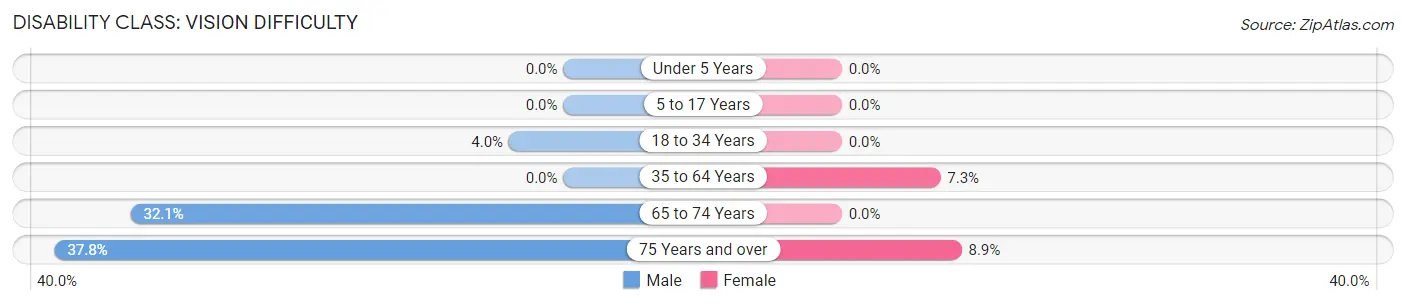
| Age Bracket | Male | Female |
| Under 5 Years | 0 (0.0%) | 0 (0.0%) |
| 5 to 17 Years | 0 (0.0%) | 0 (0.0%) |
| 18 to 34 Years | 4 (4.0%) | 0 (0.0%) |
| 35 to 64 Years | 0 (0.0%) | 15 (7.3%) |
| 65 to 74 Years | 9 (32.1%) | 0 (0.0%) |
| 75 Years and over | 17 (37.8%) | 4 (8.9%) |
Disability Class: Cognitive Difficulty
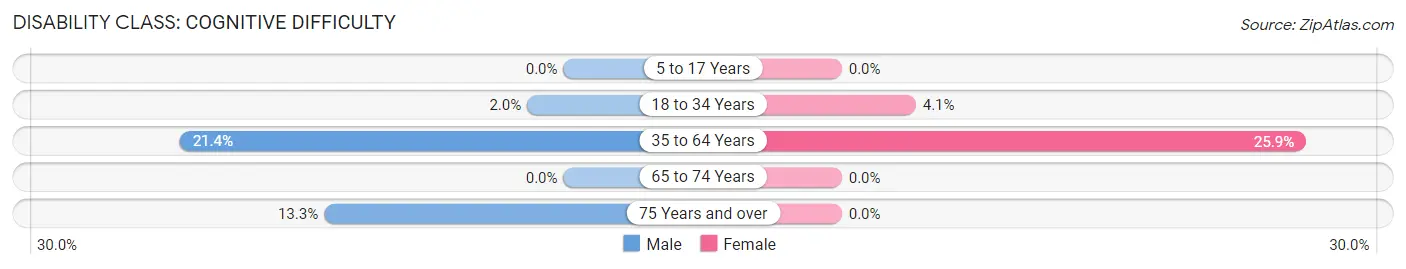
| Age Bracket | Male | Female |
| 5 to 17 Years | 0 (0.0%) | 0 (0.0%) |
| 18 to 34 Years | 2 (2.0%) | 4 (4.1%) |
| 35 to 64 Years | 47 (21.4%) | 53 (25.9%) |
| 65 to 74 Years | 0 (0.0%) | 0 (0.0%) |
| 75 Years and over | 6 (13.3%) | 0 (0.0%) |
Disability Class: Ambulatory Difficulty
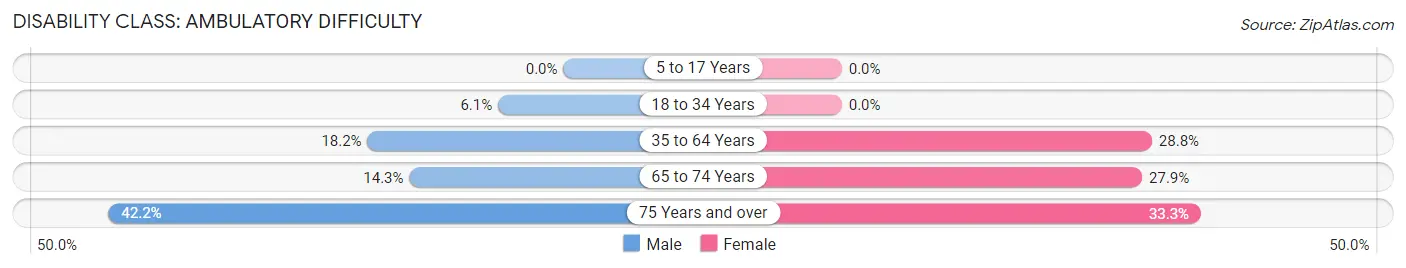
| Age Bracket | Male | Female |
| 5 to 17 Years | 0 (0.0%) | 0 (0.0%) |
| 18 to 34 Years | 6 (6.1%) | 0 (0.0%) |
| 35 to 64 Years | 40 (18.2%) | 59 (28.8%) |
| 65 to 74 Years | 4 (14.3%) | 17 (27.9%) |
| 75 Years and over | 19 (42.2%) | 15 (33.3%) |
Disability Class: Self-Care Difficulty
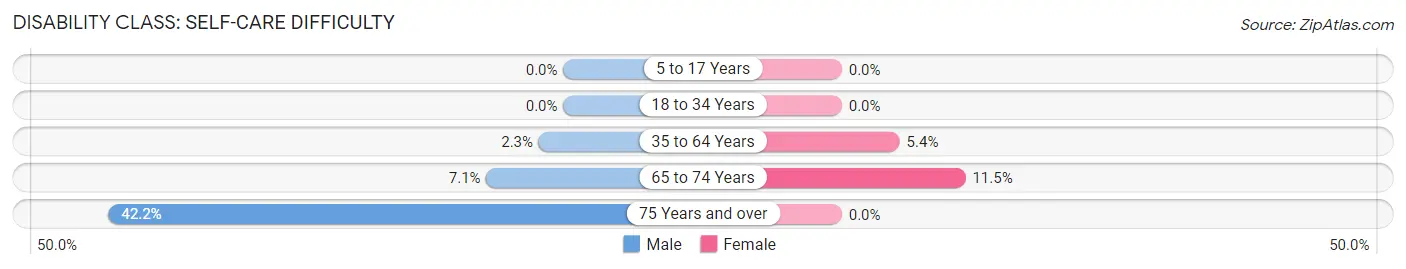
| Age Bracket | Male | Female |
| 5 to 17 Years | 0 (0.0%) | 0 (0.0%) |
| 18 to 34 Years | 0 (0.0%) | 0 (0.0%) |
| 35 to 64 Years | 5 (2.3%) | 11 (5.4%) |
| 65 to 74 Years | 2 (7.1%) | 7 (11.5%) |
| 75 Years and over | 19 (42.2%) | 0 (0.0%) |
Technology Access in Humansville
Computing Device Access in Humansville
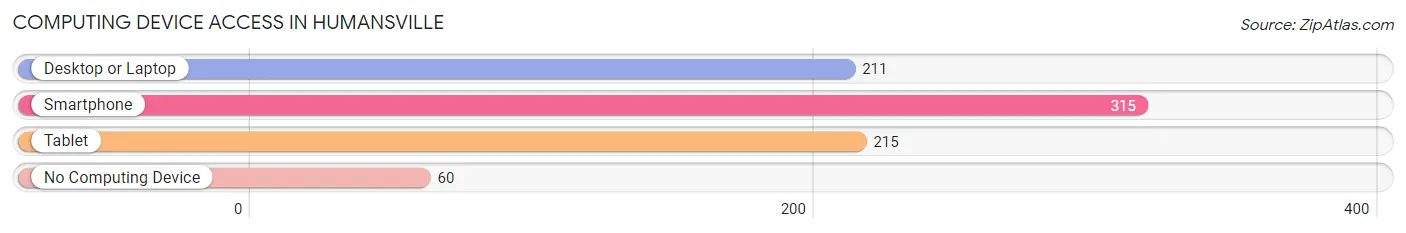
| Device Type | # Households | % Households |
| Desktop or Laptop | 211 | 51.0% |
| Smartphone | 315 | 76.1% |
| Tablet | 215 | 51.9% |
| No Computing Device | 60 | 14.5% |
| Total | 414 | 100.0% |
Internet Access in Humansville
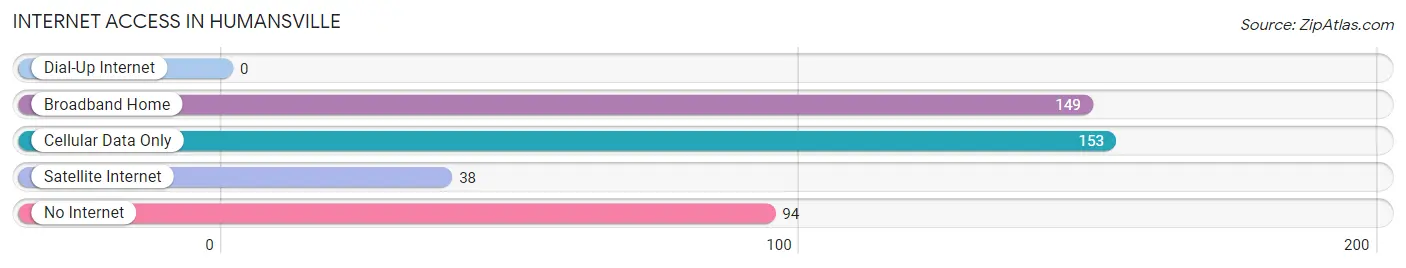
| Internet Type | # Households | % Households |
| Dial-Up Internet | 0 | 0.0% |
| Broadband Home | 149 | 36.0% |
| Cellular Data Only | 153 | 37.0% |
| Satellite Internet | 38 | 9.2% |
| No Internet | 94 | 22.7% |
| Total | 414 | 100.0% |
Humansville Summary
Humansville, Missouri is a small town located in Polk County, Missouri. It is situated in the Ozark Mountains, approximately 50 miles east of Springfield. The town was founded in 1845 and was named after the first settler, William Human. The population of Humansville was 1,093 at the 2010 census.
Geography
Humansville is located at 37°25'25" North, 93°25'25" West (37.423, -93.423). It is situated in the Ozark Mountains, approximately 50 miles east of Springfield. The town is located on the banks of the Pomme de Terre River. The terrain is mostly rolling hills and wooded areas. The average elevation is 890 feet above sea level.
Climate
Humansville has a humid subtropical climate, with hot, humid summers and cold, wet winters. The average annual temperature is 57°F, with an average high of 79°F in July and an average low of 35°F in January. The average annual precipitation is 40 inches, with the wettest month being May.
Demographics
As of the 2010 census, there were 1,093 people, 441 households, and 294 families residing in Humansville. The population density was 545.3 people per square mile. The racial makeup of the town was 97.2% White, 0.7% African American, 0.2% Native American, 0.2% Asian, 0.2% from other races, and 1.7% from two or more races. Hispanic or Latino of any race were 1.2% of the population.
Economy
Humansville is a small, rural town with a limited economy. The main industries are agriculture and tourism. The town is home to several small businesses, including a grocery store, a hardware store, a restaurant, and a few other small shops. The town also has a few small manufacturing companies.
Agriculture is the main economic activity in Humansville. The town is home to several large farms, which produce corn, soybeans, wheat, and hay. The town also has several small farms, which produce fruits and vegetables.
Tourism is also an important part of the local economy. The town is home to several attractions, including the Humansville Historic District, the Humansville Museum, and the Humansville State Park. The town also hosts several annual events, such as the Humansville Fall Festival and the Humansville Christmas Parade.
Education
Humansville is served by the Humansville R-IV School District. The district operates one elementary school, one middle school, and one high school. The district also operates a public library.
Conclusion
Humansville, Missouri is a small town located in Polk County, Missouri. It is situated in the Ozark Mountains, approximately 50 miles east of Springfield. The town was founded in 1845 and was named after the first settler, William Human. The population of Humansville was 1,093 at the 2010 census. The town is home to several small businesses, including a grocery store, a hardware store, a restaurant, and a few other small shops. The main industries are agriculture and tourism. The town is home to several large farms, which produce corn, soybeans, wheat, and hay. The town also has several small farms, which produce fruits and vegetables. The town is served by the Humansville R-IV School District, which operates one elementary school, one middle school, and one high school. The district also operates a public library.
Common Questions
What is Per Capita Income in Humansville?
Per Capita income in Humansville is $20,478.
What is the Median Family Income in Humansville?
Median Family Income in Humansville is $60,000.
What is the Median Household income in Humansville?
Median Household Income in Humansville is $35,278.
What is Income or Wage Gap in Humansville?
Income or Wage Gap in Humansville is 27.7%.
Women in Humansville earn 72.3 cents for every dollar earned by a man.
What is Inequality or Gini Index in Humansville?
Inequality or Gini Index in Humansville is 0.52.
What is the Total Population of Humansville?
Total Population of Humansville is 1,256.
What is the Total Male Population of Humansville?
Total Male Population of Humansville is 653.
What is the Total Female Population of Humansville?
Total Female Population of Humansville is 603.
What is the Ratio of Males per 100 Females in Humansville?
There are 108.29 Males per 100 Females in Humansville.
What is the Ratio of Females per 100 Males in Humansville?
There are 92.34 Females per 100 Males in Humansville.
What is the Median Population Age in Humansville?
Median Population Age in Humansville is 41.5 Years.
What is the Average Family Size in Humansville
Average Family Size in Humansville is 3.2 People.
What is the Average Household Size in Humansville
Average Household Size in Humansville is 2.6 People.
How Large is the Labor Force in Humansville?
There are 386 People in the Labor Forcein in Humansville.
What is the Percentage of People in the Labor Force in Humansville?
40.8% of People are in the Labor Force in Humansville.
What is the Unemployment Rate in Humansville?
Unemployment Rate in Humansville is 10.1%.