Leasburg, MO Map & Demographics
Leasburg Map
Leasburg Overview
$16,000
PER CAPITA INCOME
$43,550
AVG FAMILY INCOME
$40,313
AVG HOUSEHOLD INCOME
0.50
INEQUALITY / GINI INDEX
469
TOTAL POPULATION
188
MALE POPULATION
281
FEMALE POPULATION
66.90
MALES / 100 FEMALES
149.47
FEMALES / 100 MALES
24.6
MEDIAN AGE
4.1
AVG FAMILY SIZE
3.3
AVG HOUSEHOLD SIZE
213
LABOR FORCE [ PEOPLE ]
62.8%
PERCENT IN LABOR FORCE
25.4%
UNEMPLOYMENT RATE
Leasburg Zip Codes
Leasburg Area Codes
Income in Leasburg
Income Overview in Leasburg
Per Capita Income in Leasburg is $16,000, while median incomes of families and households are $43,550 and $40,313 respectively.
| Characteristic | Number | Measure |
| Per Capita Income | 469 | $16,000 |
| Median Family Income | 99 | $43,550 |
| Mean Family Income | 99 | $57,478 |
| Median Household Income | 142 | $40,313 |
| Mean Household Income | 142 | $48,880 |
| Income Deficit | 99 | $0 |
| Wage / Income Gap (%) | 469 | 0.00% |
| Wage / Income Gap ($) | 469 | 100.00¢ per $1 |
| Gini / Inequality Index | 469 | 0.50 |
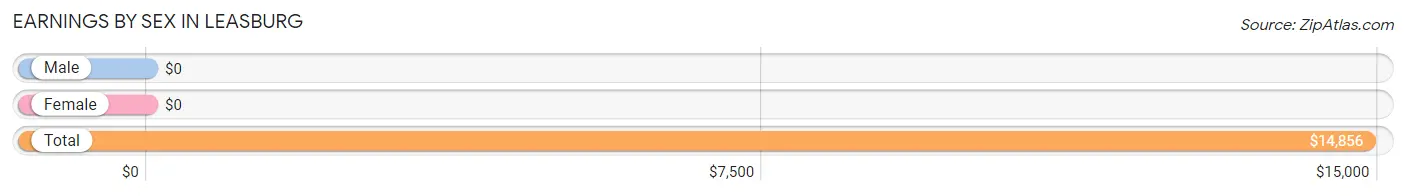
Earnings by Sex in Leasburg
| Sex | Number | Average Earnings |
| Male | 79 (36.1%) | $0 |
| Female | 140 (63.9%) | $0 |
| Total | 219 (100.0%) | $14,856 |
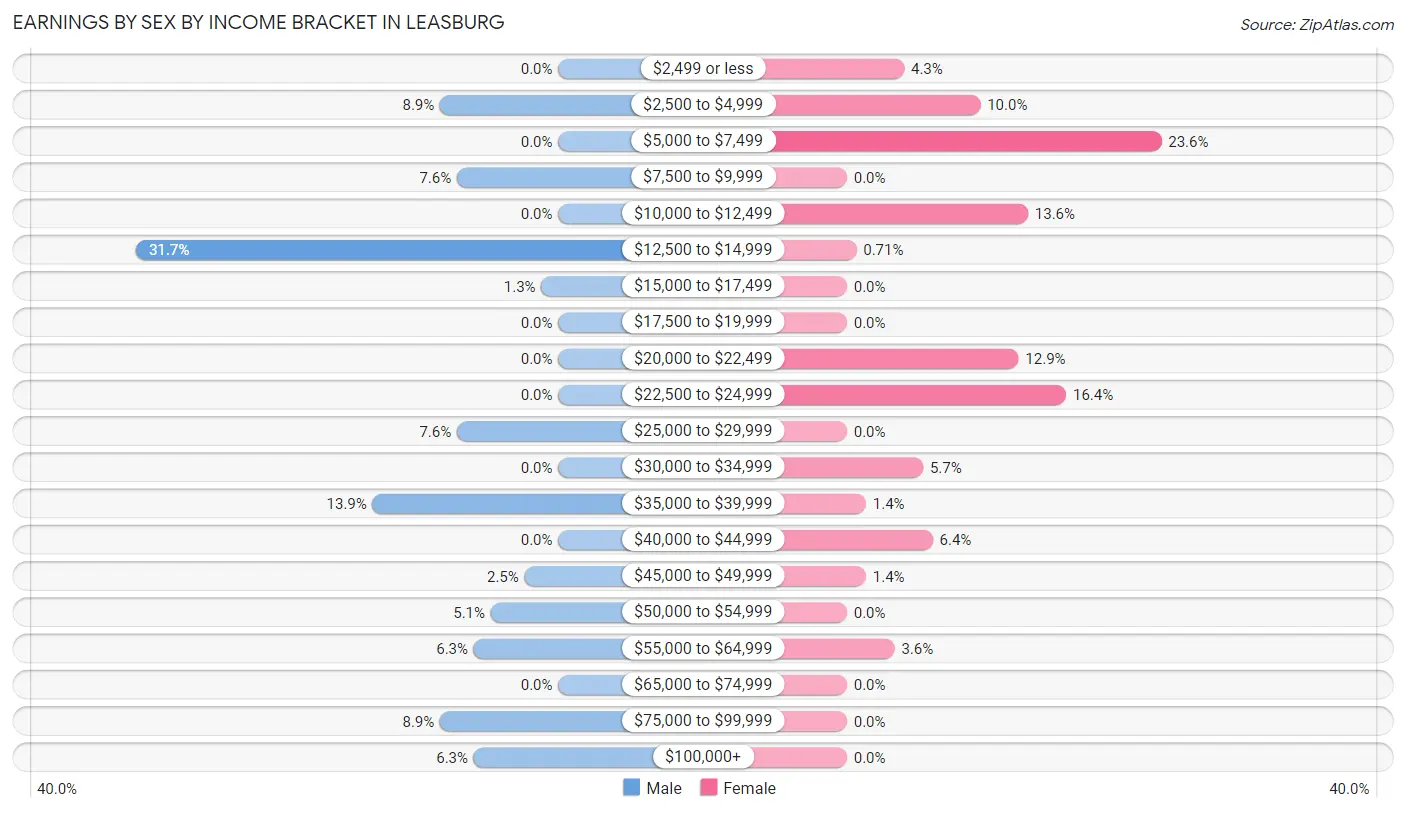
Earnings by Sex by Income Bracket in Leasburg
The most common earnings brackets in Leasburg are $12,500 to $14,999 for men (25 | 31.7%) and $5,000 to $7,499 for women (33 | 23.6%).
| Income | Male | Female |
| $2,499 or less | 0 (0.0%) | 6 (4.3%) |
| $2,500 to $4,999 | 7 (8.9%) | 14 (10.0%) |
| $5,000 to $7,499 | 0 (0.0%) | 33 (23.6%) |
| $7,500 to $9,999 | 6 (7.6%) | 0 (0.0%) |
| $10,000 to $12,499 | 0 (0.0%) | 19 (13.6%) |
| $12,500 to $14,999 | 25 (31.7%) | 1 (0.7%) |
| $15,000 to $17,499 | 1 (1.3%) | 0 (0.0%) |
| $17,500 to $19,999 | 0 (0.0%) | 0 (0.0%) |
| $20,000 to $22,499 | 0 (0.0%) | 18 (12.9%) |
| $22,500 to $24,999 | 0 (0.0%) | 23 (16.4%) |
| $25,000 to $29,999 | 6 (7.6%) | 0 (0.0%) |
| $30,000 to $34,999 | 0 (0.0%) | 8 (5.7%) |
| $35,000 to $39,999 | 11 (13.9%) | 2 (1.4%) |
| $40,000 to $44,999 | 0 (0.0%) | 9 (6.4%) |
| $45,000 to $49,999 | 2 (2.5%) | 2 (1.4%) |
| $50,000 to $54,999 | 4 (5.1%) | 0 (0.0%) |
| $55,000 to $64,999 | 5 (6.3%) | 5 (3.6%) |
| $65,000 to $74,999 | 0 (0.0%) | 0 (0.0%) |
| $75,000 to $99,999 | 7 (8.9%) | 0 (0.0%) |
| $100,000+ | 5 (6.3%) | 0 (0.0%) |
| Total | 79 (100.0%) | 140 (100.0%) |
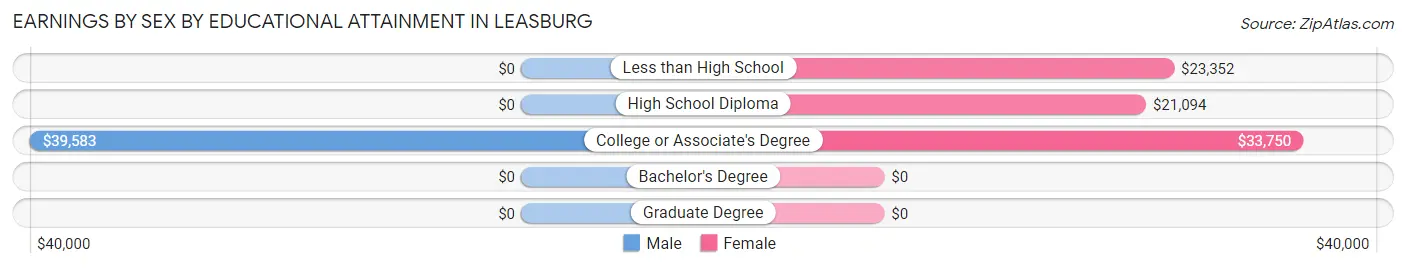
Earnings by Sex by Educational Attainment in Leasburg
Average earnings in Leasburg are $39,091 for men and $23,043 for women, a difference of 41.0%. Men with an educational attainment of college or associate's degree enjoy the highest average annual earnings of $39,583, while those with college or associate's degree education earn the least with $39,583. Women with an educational attainment of college or associate's degree earn the most with the average annual earnings of $33,750, while those with high school diploma education have the smallest earnings of $21,094.
| Educational Attainment | Male Income | Female Income |
| Less than High School | - | - |
| High School Diploma | - | - |
| College or Associate's Degree | $39,583 | $33,750 |
| Bachelor's Degree | - | - |
| Graduate Degree | - | - |
| Total | $39,091 | $23,043 |
Family Income in Leasburg
Family Income Brackets in Leasburg
According to the Leasburg family income data, there are 29 families falling into the $35,000 to $49,999 income range, which is the most common income bracket and makes up 29.3% of all families. Conversely, the $150,000 to $199,999 income bracket is the least frequent group with only 1 families (1.0%) belonging to this category.
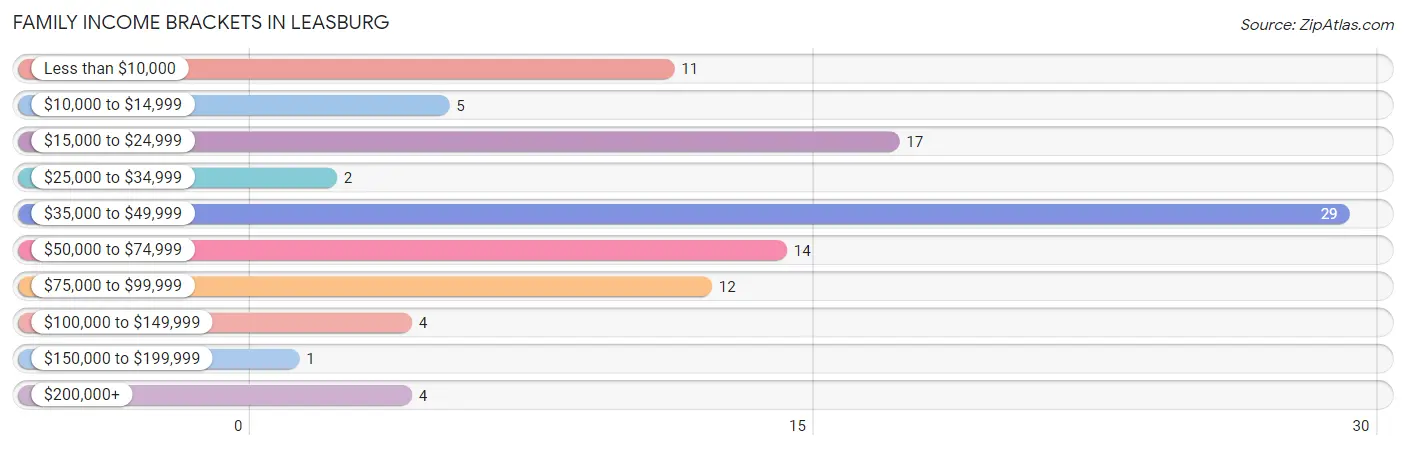
| Income Bracket | # Families | % Families |
| Less than $10,000 | 11 | 11.1% |
| $10,000 to $14,999 | 5 | 5.1% |
| $15,000 to $24,999 | 17 | 17.2% |
| $25,000 to $34,999 | 2 | 2.0% |
| $35,000 to $49,999 | 29 | 29.3% |
| $50,000 to $74,999 | 14 | 14.1% |
| $75,000 to $99,999 | 12 | 12.1% |
| $100,000 to $149,999 | 4 | 4.0% |
| $150,000 to $199,999 | 1 | 1.0% |
| $200,000+ | 4 | 4.0% |
Family Income by Famaliy Size in Leasburg
3-person families (18 | 18.2%) account for the highest median family income in Leasburg with $55,417 per family, while 2-person families (36 | 36.4%) have the highest median income of $26,250 per family member.
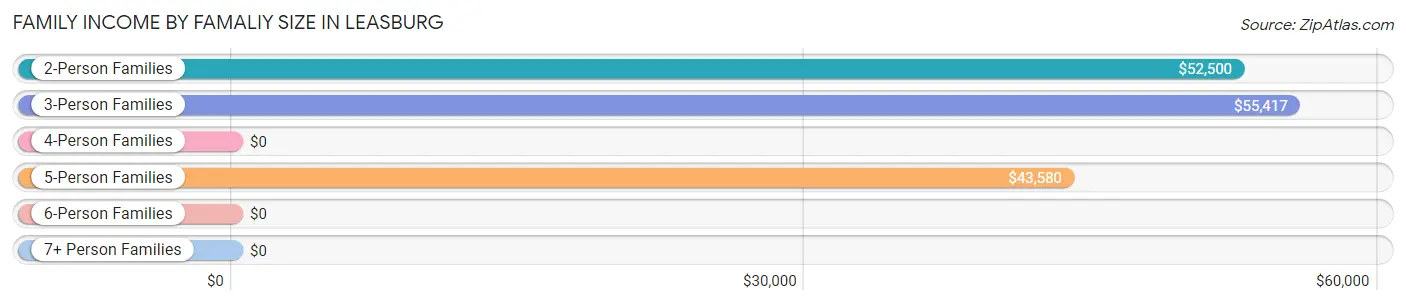
| Income Bracket | # Families | Median Income |
| 2-Person Families | 36 (36.4%) | $52,500 |
| 3-Person Families | 18 (18.2%) | $55,417 |
| 4-Person Families | 12 (12.1%) | $0 |
| 5-Person Families | 33 (33.3%) | $43,580 |
| 6-Person Families | 0 (0.0%) | $0 |
| 7+ Person Families | 0 (0.0%) | $0 |
| Total | 99 (100.0%) | $43,550 |
Family Income by Number of Earners in Leasburg
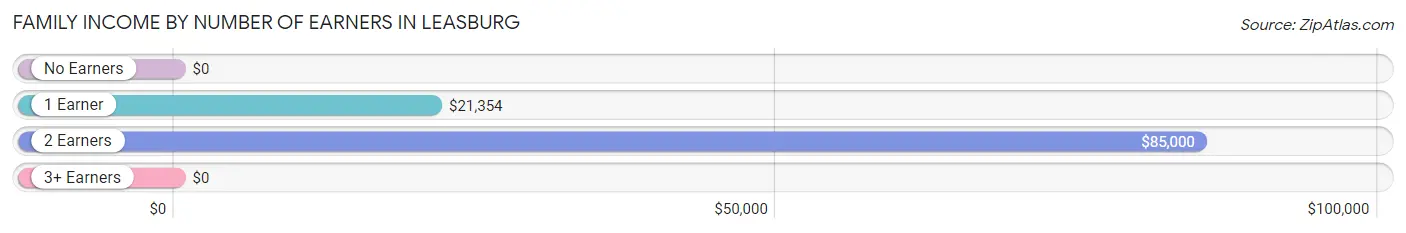
| Number of Earners | # Families | Median Income |
| No Earners | 13 (13.1%) | $0 |
| 1 Earner | 37 (37.4%) | $21,354 |
| 2 Earners | 26 (26.3%) | $85,000 |
| 3+ Earners | 23 (23.2%) | $0 |
| Total | 99 (100.0%) | $43,550 |
Household Income in Leasburg
Household Income Brackets in Leasburg
With 37 households falling in the category, the $35,000 to $49,999 income range is the most frequent in Leasburg, accounting for 26.1% of all households. In contrast, only 1 households (0.7%) fall into the $150,000 to $199,999 income bracket, making it the least populous group.
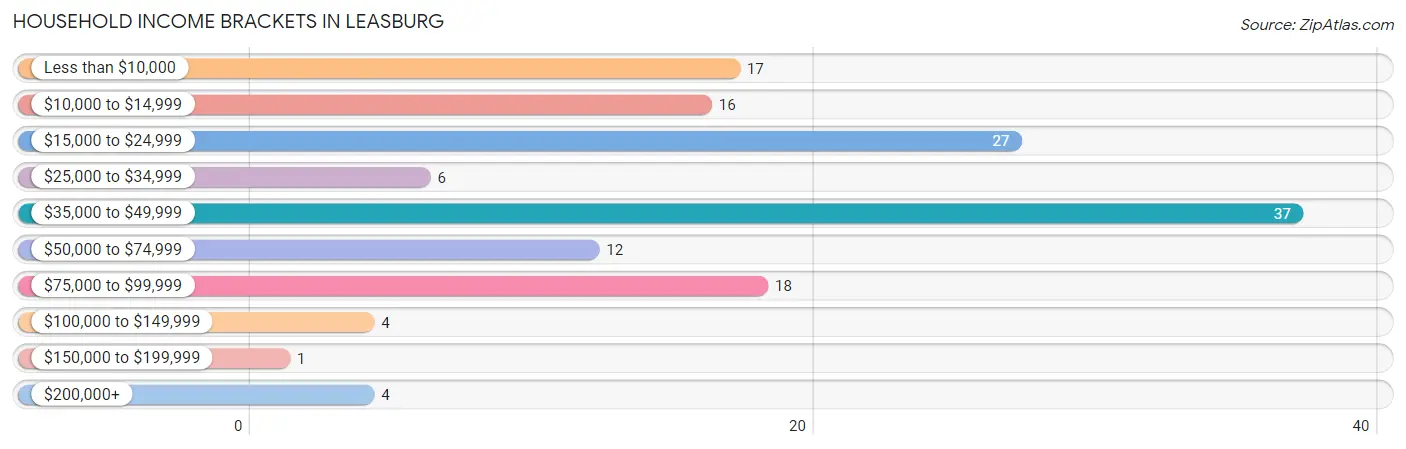
| Income Bracket | # Households | % Households |
| Less than $10,000 | 17 | 12.0% |
| $10,000 to $14,999 | 16 | 11.3% |
| $15,000 to $24,999 | 27 | 19.0% |
| $25,000 to $34,999 | 6 | 4.2% |
| $35,000 to $49,999 | 37 | 26.1% |
| $50,000 to $74,999 | 12 | 8.5% |
| $75,000 to $99,999 | 18 | 12.7% |
| $100,000 to $149,999 | 4 | 2.8% |
| $150,000 to $199,999 | 1 | 0.7% |
| $200,000+ | 4 | 2.8% |
Household Income by Householder Age in Leasburg
The median household income in Leasburg is $40,313, with the highest median household income of $43,000 found in the 45 to 64 years age bracket for the primary householder. A total of 70 households (49.3%) fall into this category.
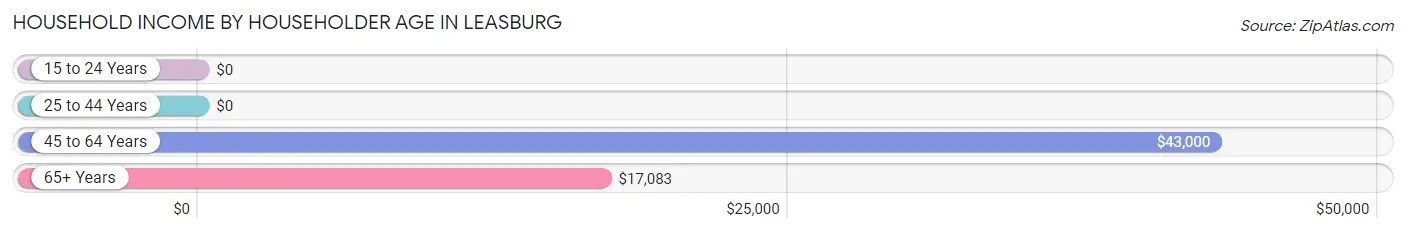
| Income Bracket | # Households | Median Income |
| 15 to 24 Years | 0 (0.0%) | $0 |
| 25 to 44 Years | 46 (32.4%) | $0 |
| 45 to 64 Years | 70 (49.3%) | $43,000 |
| 65+ Years | 26 (18.3%) | $17,083 |
| Total | 142 (100.0%) | $40,313 |
Poverty in Leasburg
Income Below Poverty by Sex and Age in Leasburg
With 29.8% poverty level for males and 32.0% for females among the residents of Leasburg, 12 to 14 year old males and under 5 year old females are the most vulnerable to poverty, with 17 males (68.0%) and 21 females (100.0%) in their respective age groups living below the poverty level.
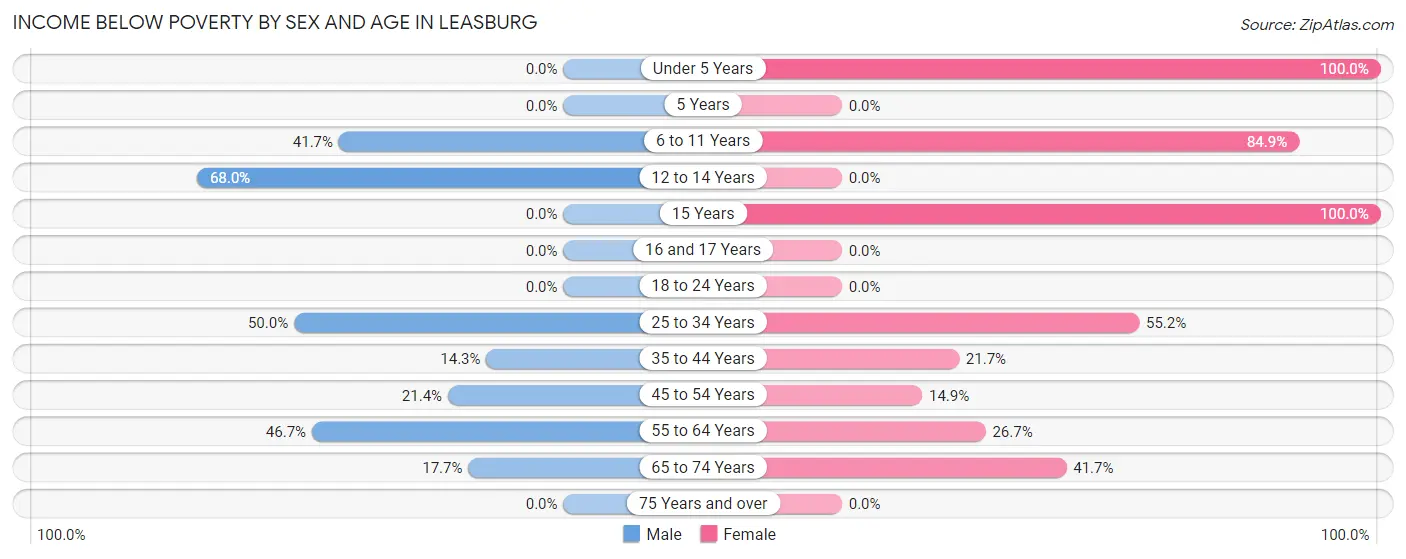
| Age Bracket | Male | Female |
| Under 5 Years | 0 (0.0%) | 21 (100.0%) |
| 5 Years | 0 (0.0%) | 0 (0.0%) |
| 6 to 11 Years | 10 (41.7%) | 28 (84.9%) |
| 12 to 14 Years | 17 (68.0%) | 0 (0.0%) |
| 15 Years | 0 (0.0%) | 4 (100.0%) |
| 16 and 17 Years | 0 (0.0%) | 0 (0.0%) |
| 18 to 24 Years | 0 (0.0%) | 0 (0.0%) |
| 25 to 34 Years | 14 (50.0%) | 16 (55.2%) |
| 35 to 44 Years | 2 (14.3%) | 5 (21.7%) |
| 45 to 54 Years | 3 (21.4%) | 7 (14.9%) |
| 55 to 64 Years | 7 (46.7%) | 4 (26.7%) |
| 65 to 74 Years | 3 (17.6%) | 5 (41.7%) |
| 75 Years and over | 0 (0.0%) | 0 (0.0%) |
| Total | 56 (29.8%) | 90 (32.0%) |
Income Above Poverty by Sex and Age in Leasburg
According to the poverty statistics in Leasburg, males aged under 5 years and females aged 12 to 14 years are the age groups that are most secure financially, with 100.0% of males and 100.0% of females in these age groups living above the poverty line.
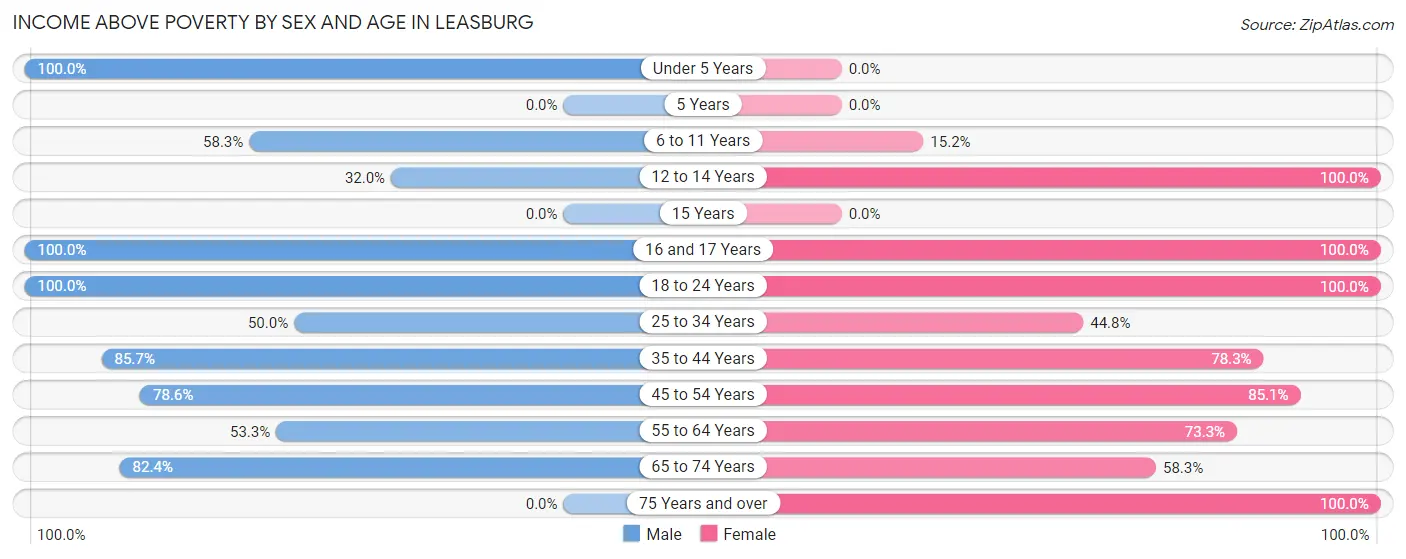
| Age Bracket | Male | Female |
| Under 5 Years | 21 (100.0%) | 0 (0.0%) |
| 5 Years | 0 (0.0%) | 0 (0.0%) |
| 6 to 11 Years | 14 (58.3%) | 5 (15.1%) |
| 12 to 14 Years | 8 (32.0%) | 2 (100.0%) |
| 15 Years | 0 (0.0%) | 0 (0.0%) |
| 16 and 17 Years | 7 (100.0%) | 6 (100.0%) |
| 18 to 24 Years | 23 (100.0%) | 82 (100.0%) |
| 25 to 34 Years | 14 (50.0%) | 13 (44.8%) |
| 35 to 44 Years | 12 (85.7%) | 18 (78.3%) |
| 45 to 54 Years | 11 (78.6%) | 40 (85.1%) |
| 55 to 64 Years | 8 (53.3%) | 11 (73.3%) |
| 65 to 74 Years | 14 (82.4%) | 7 (58.3%) |
| 75 Years and over | 0 (0.0%) | 7 (100.0%) |
| Total | 132 (70.2%) | 191 (68.0%) |
Income Below Poverty Among Married-Couple Families in Leasburg
| Children | Above Poverty | Below Poverty |
| No Children | 19 (100.0%) | 0 (0.0%) |
| 1 or 2 Children | 6 (100.0%) | 0 (0.0%) |
| 3 or 4 Children | 4 (100.0%) | 0 (0.0%) |
| 5 or more Children | 0 (0.0%) | 0 (0.0%) |
| Total | 29 (100.0%) | 0 (0.0%) |
Income Below Poverty Among Single-Parent Households in Leasburg
According to the poverty data in Leasburg, 87.5% or 7 single-father households and 37.1% or 23 single-mother households are living below the poverty line. Among single-father households, those with no children have the highest poverty rate, with 5 households (100.0%) experiencing poverty. Likewise, among single-mother households, those with 3 or 4 children have the highest poverty rate, with 16 households (100.0%) falling below the poverty line.
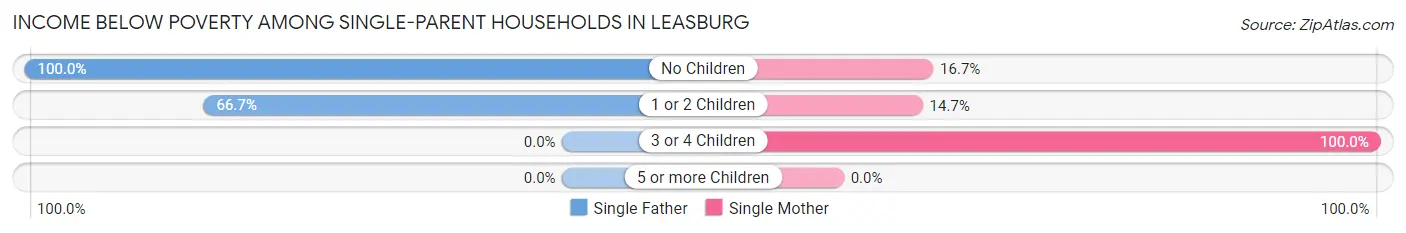
| Children | Single Father | Single Mother |
| No Children | 5 (100.0%) | 2 (16.7%) |
| 1 or 2 Children | 2 (66.7%) | 5 (14.7%) |
| 3 or 4 Children | 0 (0.0%) | 16 (100.0%) |
| 5 or more Children | 0 (0.0%) | 0 (0.0%) |
| Total | 7 (87.5%) | 23 (37.1%) |
Income Below Poverty Among Married-Couple vs Single-Parent Households in Leasburg
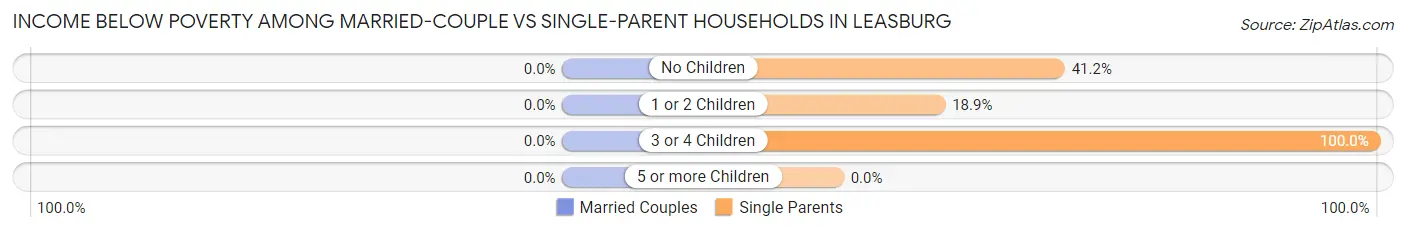
| Children | Married-Couple Families | Single-Parent Households |
| No Children | 0 (0.0%) | 7 (41.2%) |
| 1 or 2 Children | 0 (0.0%) | 7 (18.9%) |
| 3 or 4 Children | 0 (0.0%) | 16 (100.0%) |
| 5 or more Children | 0 (0.0%) | 0 (0.0%) |
| Total | 0 (0.0%) | 30 (42.9%) |
Race in Leasburg
The most populous races in Leasburg are White / Caucasian (460 | 98.1%), Two or more Races (9 | 1.9%), and Hispanic or Latino (5 | 1.1%).
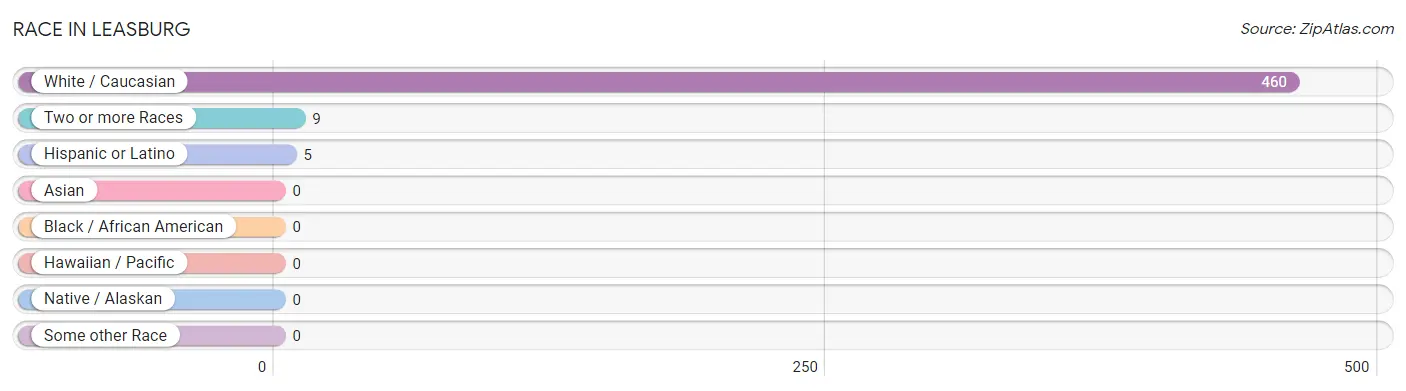
| Race | # Population | % Population |
| Asian | 0 | 0.0% |
| Black / African American | 0 | 0.0% |
| Hawaiian / Pacific | 0 | 0.0% |
| Hispanic or Latino | 5 | 1.1% |
| Native / Alaskan | 0 | 0.0% |
| White / Caucasian | 460 | 98.1% |
| Two or more Races | 9 | 1.9% |
| Some other Race | 0 | 0.0% |
| Total | 469 | 100.0% |
Ancestry in Leasburg
The most populous ancestries reported in Leasburg are German (136 | 29.0%), Irish (112 | 23.9%), English (64 | 13.7%), Italian (13 | 2.8%), and American (11 | 2.4%), together accounting for 71.6% of all Leasburg residents.
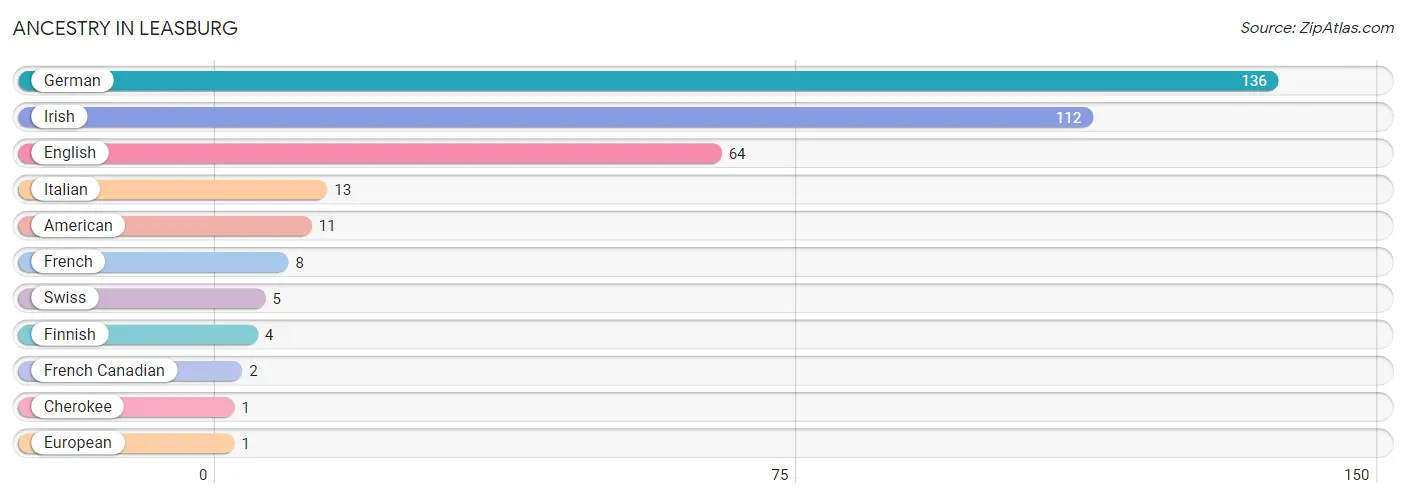
| Ancestry | # Population | % Population |
| American | 11 | 2.4% |
| Cherokee | 1 | 0.2% |
| English | 64 | 13.7% |
| European | 1 | 0.2% |
| Finnish | 4 | 0.9% |
| French | 8 | 1.7% |
| French Canadian | 2 | 0.4% |
| German | 136 | 29.0% |
| Irish | 112 | 23.9% |
| Italian | 13 | 2.8% |
| Swiss | 5 | 1.1% | View All 11 Rows |
Immigrants in Leasburg
The most numerous immigrant groups reported in Leasburg came from Europe (2 | 0.4%), Ireland (2 | 0.4%), and Northern Europe (2 | 0.4%), together accounting for 1.3% of all Leasburg residents.
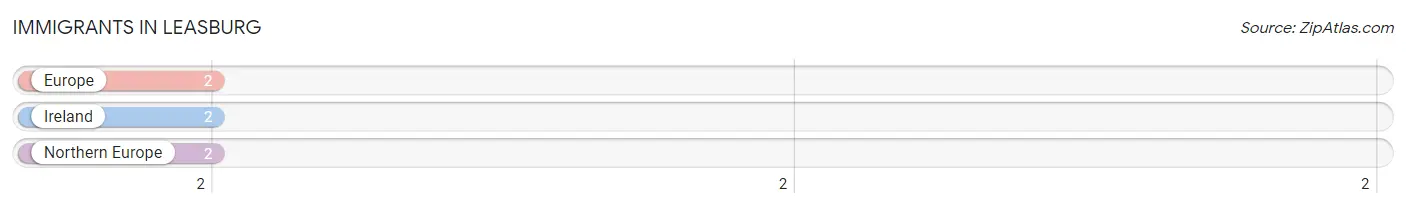
| Immigration Origin | # Population | % Population |
| Europe | 2 | 0.4% |
| Ireland | 2 | 0.4% |
| Northern Europe | 2 | 0.4% | View All 3 Rows |
Sex and Age in Leasburg
Sex and Age in Leasburg
The most populous age groups in Leasburg are 10 to 14 Years (35 | 18.6%) for men and 20 to 24 Years (57 | 20.3%) for women.
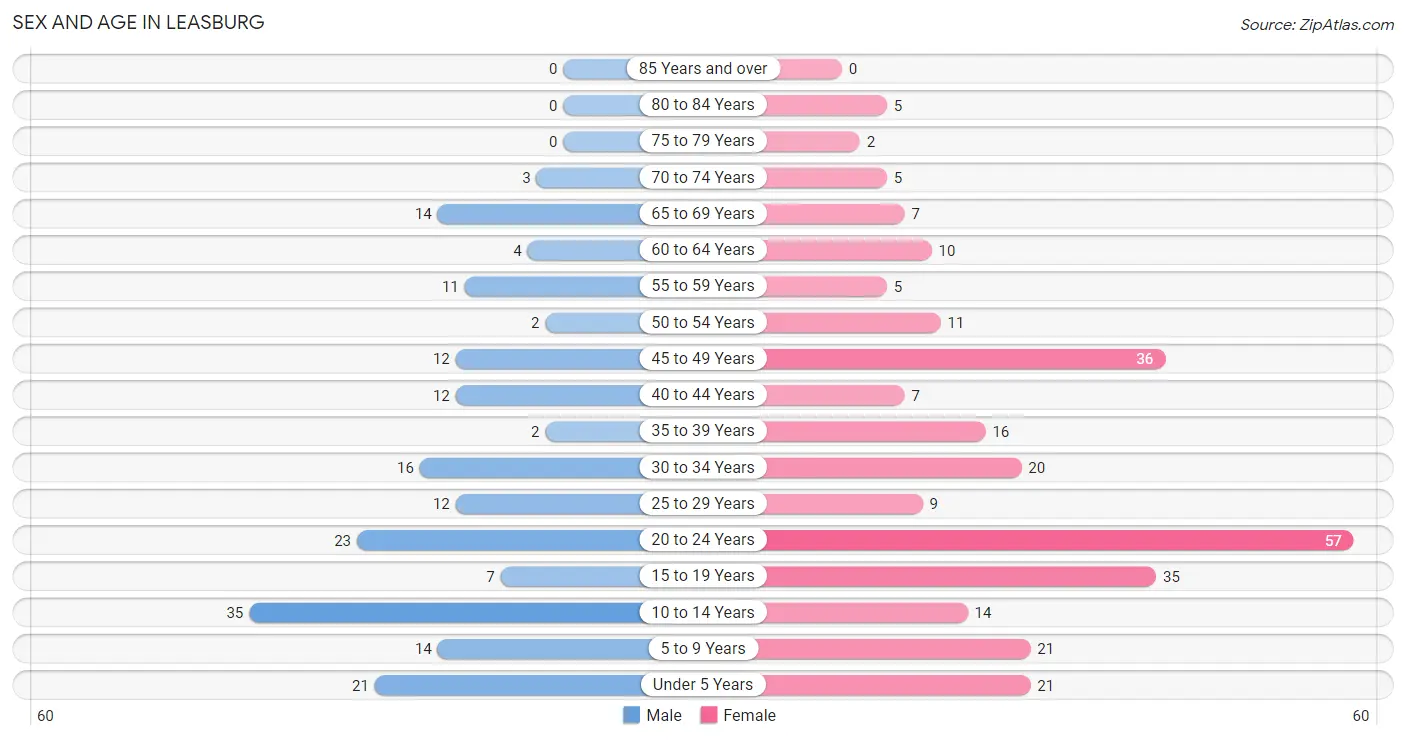
| Age Bracket | Male | Female |
| Under 5 Years | 21 (11.2%) | 21 (7.5%) |
| 5 to 9 Years | 14 (7.4%) | 21 (7.5%) |
| 10 to 14 Years | 35 (18.6%) | 14 (5.0%) |
| 15 to 19 Years | 7 (3.7%) | 35 (12.5%) |
| 20 to 24 Years | 23 (12.2%) | 57 (20.3%) |
| 25 to 29 Years | 12 (6.4%) | 9 (3.2%) |
| 30 to 34 Years | 16 (8.5%) | 20 (7.1%) |
| 35 to 39 Years | 2 (1.1%) | 16 (5.7%) |
| 40 to 44 Years | 12 (6.4%) | 7 (2.5%) |
| 45 to 49 Years | 12 (6.4%) | 36 (12.8%) |
| 50 to 54 Years | 2 (1.1%) | 11 (3.9%) |
| 55 to 59 Years | 11 (5.9%) | 5 (1.8%) |
| 60 to 64 Years | 4 (2.1%) | 10 (3.6%) |
| 65 to 69 Years | 14 (7.4%) | 7 (2.5%) |
| 70 to 74 Years | 3 (1.6%) | 5 (1.8%) |
| 75 to 79 Years | 0 (0.0%) | 2 (0.7%) |
| 80 to 84 Years | 0 (0.0%) | 5 (1.8%) |
| 85 Years and over | 0 (0.0%) | 0 (0.0%) |
| Total | 188 (100.0%) | 281 (100.0%) |
Families and Households in Leasburg
Median Family Size in Leasburg
The median family size in Leasburg is 4.11 persons per family, with single male/father families (8 | 8.1%) accounting for the largest median family size of 4.88 persons per family. On the other hand, married-couple families (29 | 29.3%) represent the smallest median family size with 3.00 persons per family.
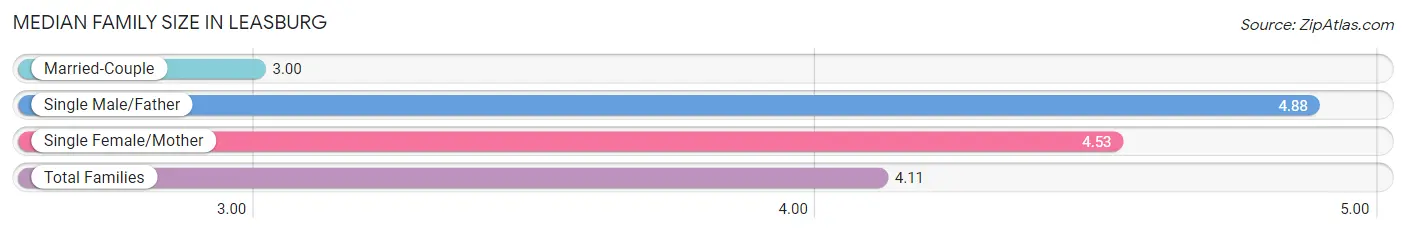
| Family Type | # Families | Family Size |
| Married-Couple | 29 (29.3%) | 3.00 |
| Single Male/Father | 8 (8.1%) | 4.88 |
| Single Female/Mother | 62 (62.6%) | 4.53 |
| Total Families | 99 (100.0%) | 4.11 |
Median Household Size in Leasburg
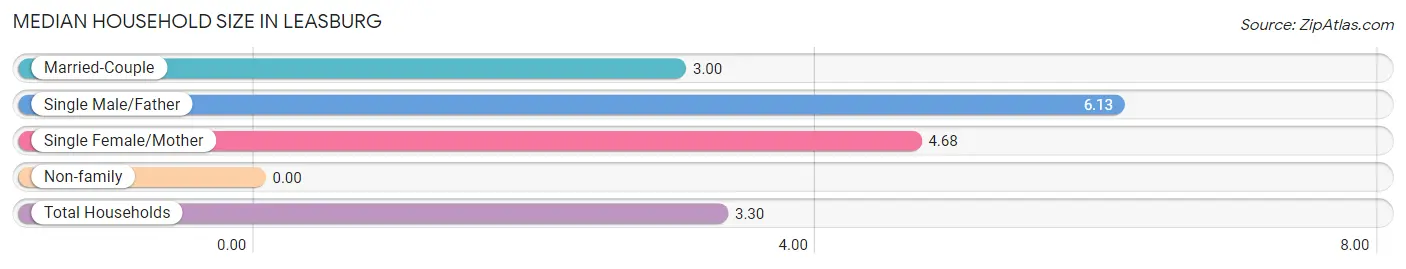
| Household Type | # Households | Household Size |
| Married-Couple | 29 (20.4%) | 3.00 |
| Single Male/Father | 8 (5.6%) | 6.13 |
| Single Female/Mother | 62 (43.7%) | 4.68 |
| Non-family | 43 (30.3%) | - |
| Total Households | 142 (100.0%) | 3.30 |
Household Size by Marriage Status in Leasburg
Out of a total of 142 households in Leasburg, 99 (69.7%) are family households, while 43 (30.3%) are nonfamily households. The most numerous type of family households are 2-person households, comprising 36, and the most common type of nonfamily households are 1-person households, comprising 43.
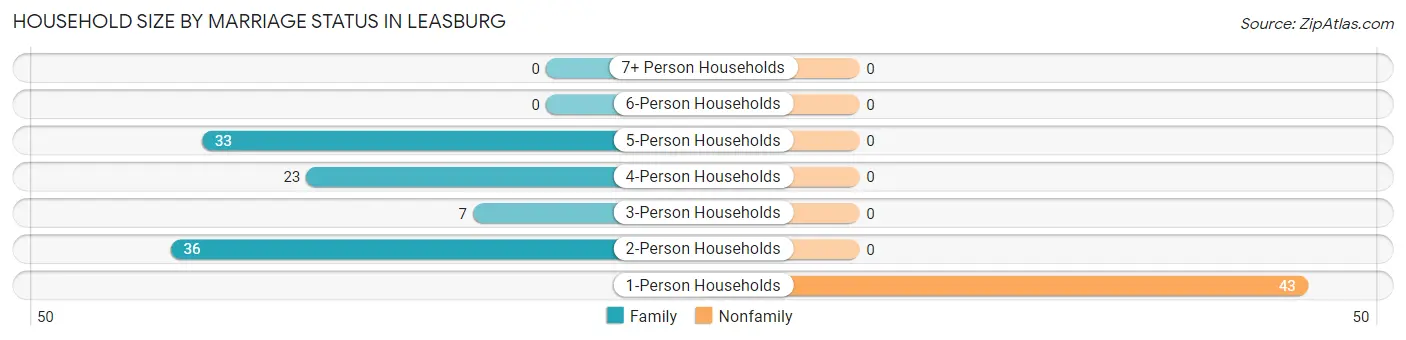
| Household Size | Family Households | Nonfamily Households |
| 1-Person Households | - | 43 (30.3%) |
| 2-Person Households | 36 (25.4%) | 0 (0.0%) |
| 3-Person Households | 7 (4.9%) | 0 (0.0%) |
| 4-Person Households | 23 (16.2%) | 0 (0.0%) |
| 5-Person Households | 33 (23.2%) | 0 (0.0%) |
| 6-Person Households | 0 (0.0%) | 0 (0.0%) |
| 7+ Person Households | 0 (0.0%) | 0 (0.0%) |
| Total | 99 (69.7%) | 43 (30.3%) |
Female Fertility in Leasburg
Fertility by Age in Leasburg
Average fertility rate in Leasburg is 156.0 births per 1,000 women. Women in the age bracket of 20 to 34 years have the highest fertility rate with 326.0 births per 1,000 women. Women in the age bracket of 20 to 34 years acount for 100.0% of all women with births.
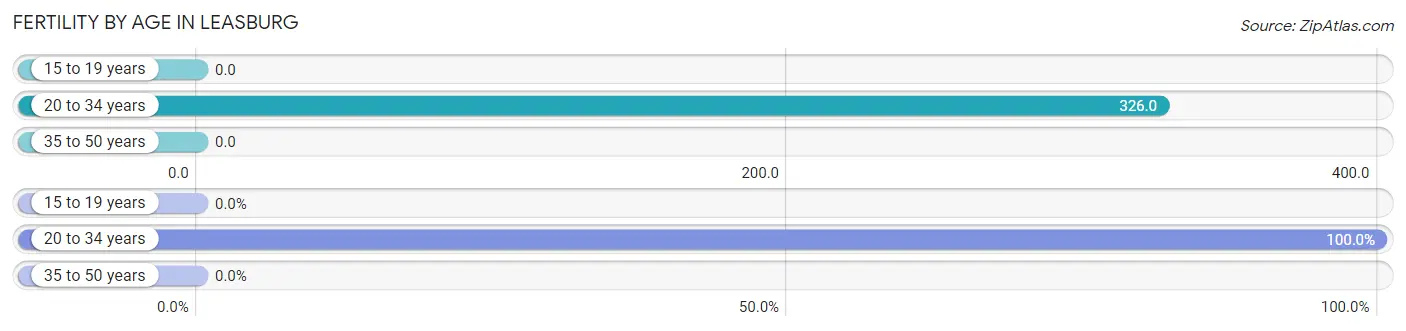
| Age Bracket | Women with Births | Births / 1,000 Women |
| 15 to 19 years | 0 (0.0%) | 0.0 |
| 20 to 34 years | 28 (100.0%) | 326.0 |
| 35 to 50 years | 0 (0.0%) | 0.0 |
| Total | 28 (100.0%) | 156.0 |
Fertility by Age by Marriage Status in Leasburg
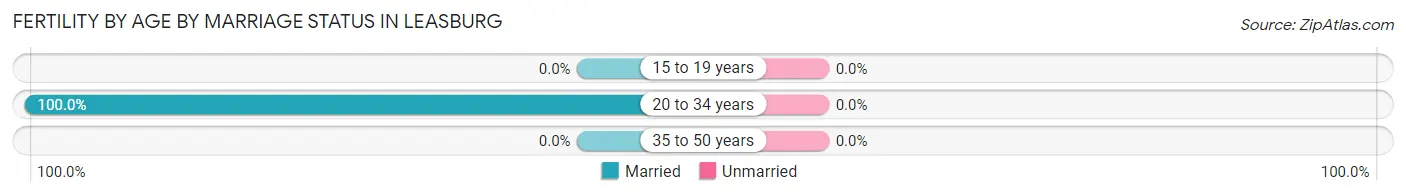
| Age Bracket | Married | Unmarried |
| 15 to 19 years | 0 (0.0%) | 0 (0.0%) |
| 20 to 34 years | 28 (100.0%) | 0 (0.0%) |
| 35 to 50 years | 0 (0.0%) | 0 (0.0%) |
| Total | 28 (100.0%) | 0 (0.0%) |
Fertility by Education in Leasburg
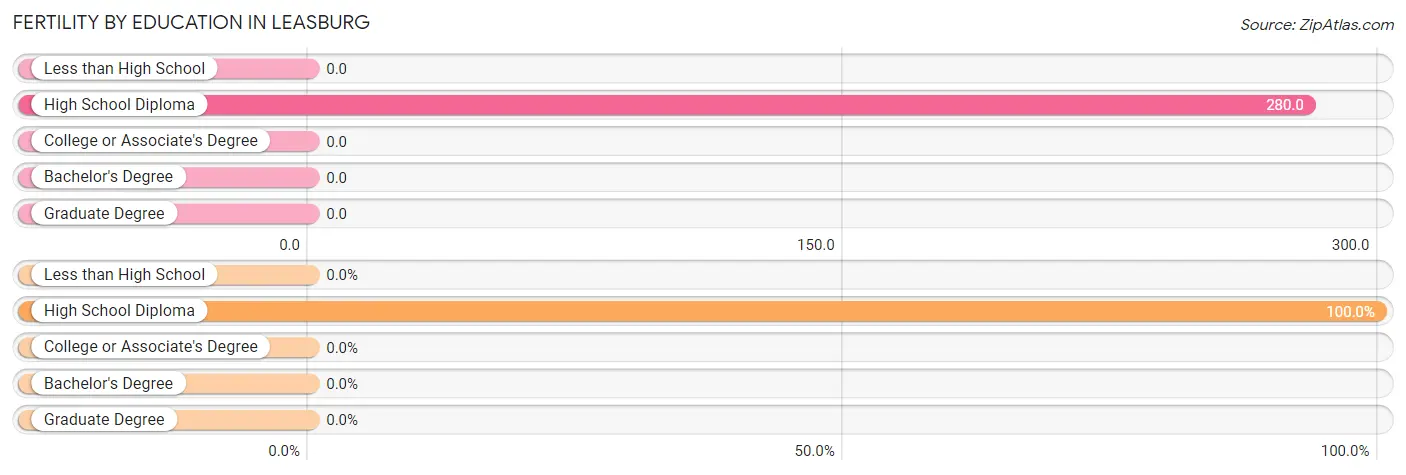
| Educational Attainment | Women with Births | Births / 1,000 Women |
| Less than High School | 0 (0.0%) | 0.0 |
| High School Diploma | 28 (100.0%) | 280.0 |
| College or Associate's Degree | 0 (0.0%) | 0.0 |
| Bachelor's Degree | 0 (0.0%) | 0.0 |
| Graduate Degree | 0 (0.0%) | 0.0 |
| Total | 28 (100.0%) | 156.0 |
Fertility by Education by Marriage Status in Leasburg
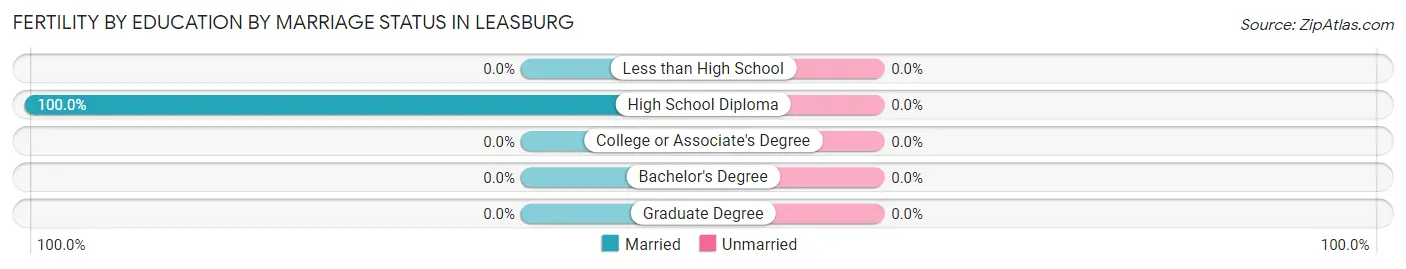
| Educational Attainment | Married | Unmarried |
| Less than High School | 0 (0.0%) | 0 (0.0%) |
| High School Diploma | 28 (100.0%) | 0 (0.0%) |
| College or Associate's Degree | 0 (0.0%) | 0 (0.0%) |
| Bachelor's Degree | 0 (0.0%) | 0 (0.0%) |
| Graduate Degree | 0 (0.0%) | 0 (0.0%) |
| Total | 28 (100.0%) | 0 (0.0%) |
Employment Characteristics in Leasburg
Employment by Class of Employer in Leasburg
Among the 150 employed individuals in Leasburg, private company employees (119 | 79.3%), state government employees (22 | 14.7%), and self-employed (incorporated) (4 | 2.7%) make up the most common classes of employment.
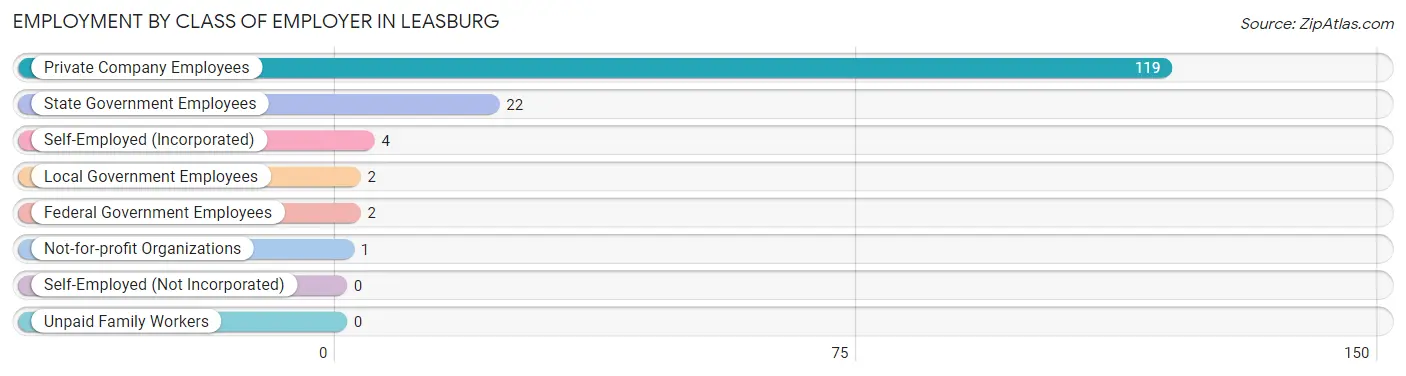
| Employer Class | # Employees | % Employees |
| Private Company Employees | 119 | 79.3% |
| Self-Employed (Incorporated) | 4 | 2.7% |
| Self-Employed (Not Incorporated) | 0 | 0.0% |
| Not-for-profit Organizations | 1 | 0.7% |
| Local Government Employees | 2 | 1.3% |
| State Government Employees | 22 | 14.7% |
| Federal Government Employees | 2 | 1.3% |
| Unpaid Family Workers | 0 | 0.0% |
| Total | 150 | 100.0% |
Employment Status by Age in Leasburg
According to the labor force statistics for Leasburg, out of the total population over 16 years of age (339), 62.8% or 213 individuals are in the labor force, with 25.4% or 54 of them unemployed. The age group with the highest labor force participation rate is 25 to 29 years, with 100.0% or 21 individuals in the labor force. Within the labor force, the 20 to 24 years age range has the highest percentage of unemployed individuals, with 52.3% or 23 of them being unemployed.
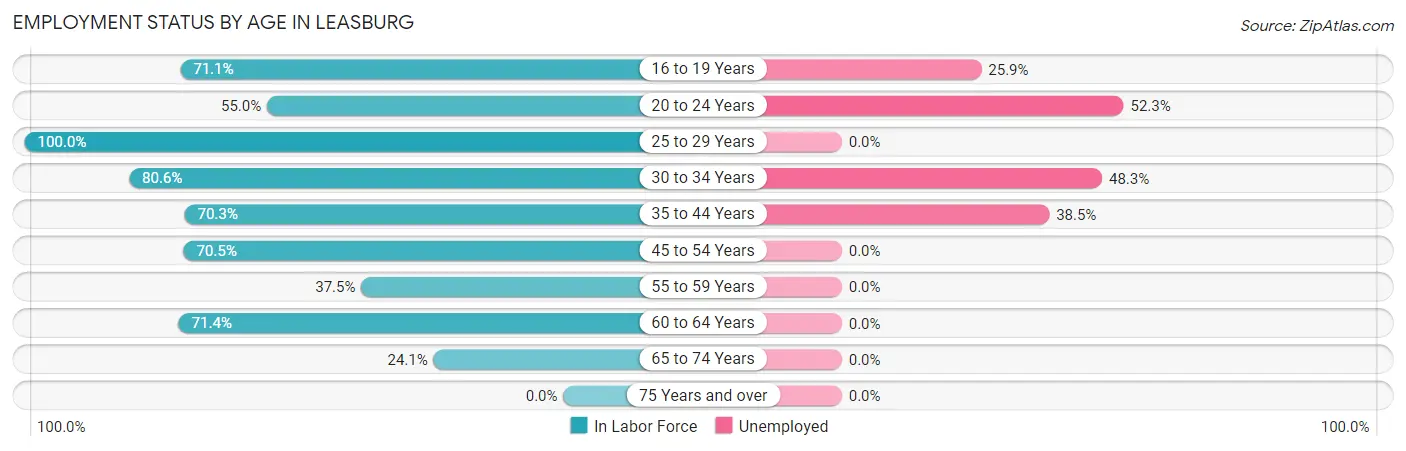
| Age Bracket | In Labor Force | Unemployed |
| 16 to 19 Years | 27 (71.1%) | 7 (25.9%) |
| 20 to 24 Years | 44 (55.0%) | 23 (52.3%) |
| 25 to 29 Years | 21 (100.0%) | 0 (0.0%) |
| 30 to 34 Years | 29 (80.6%) | 14 (48.3%) |
| 35 to 44 Years | 26 (70.3%) | 10 (38.5%) |
| 45 to 54 Years | 43 (70.5%) | 0 (0.0%) |
| 55 to 59 Years | 6 (37.5%) | 0 (0.0%) |
| 60 to 64 Years | 10 (71.4%) | 0 (0.0%) |
| 65 to 74 Years | 7 (24.1%) | 0 (0.0%) |
| 75 Years and over | 0 (0.0%) | 0 (0.0%) |
| Total | 213 (62.8%) | 54 (25.4%) |
Employment Status by Educational Attainment in Leasburg
According to labor force statistics for Leasburg, 73.0% of individuals (135) out of the total population between 25 and 64 years of age (185) are in the labor force, with 17.8% or 24 of them being unemployed. The group with the highest labor force participation rate are those with the educational attainment of bachelor's degree or higher, with 100.0% or 20 individuals in the labor force. Within the labor force, individuals with bachelor's degree or higher education have the highest percentage of unemployment, with 50.0% or 10 of them being unemployed.
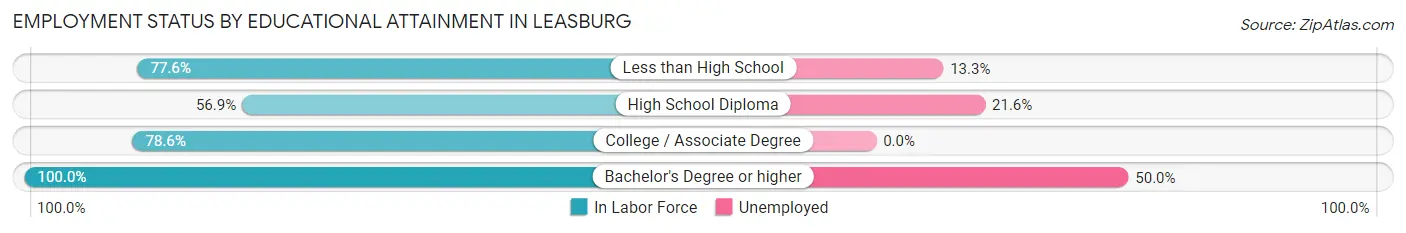
| Educational Attainment | In Labor Force | Unemployed |
| Less than High School | 45 (77.6%) | 8 (13.3%) |
| High School Diploma | 37 (56.9%) | 14 (21.6%) |
| College / Associate Degree | 33 (78.6%) | 0 (0.0%) |
| Bachelor's Degree or higher | 20 (100.0%) | 10 (50.0%) |
| Total | 135 (73.0%) | 33 (17.8%) |
Employment Occupations by Sex in Leasburg
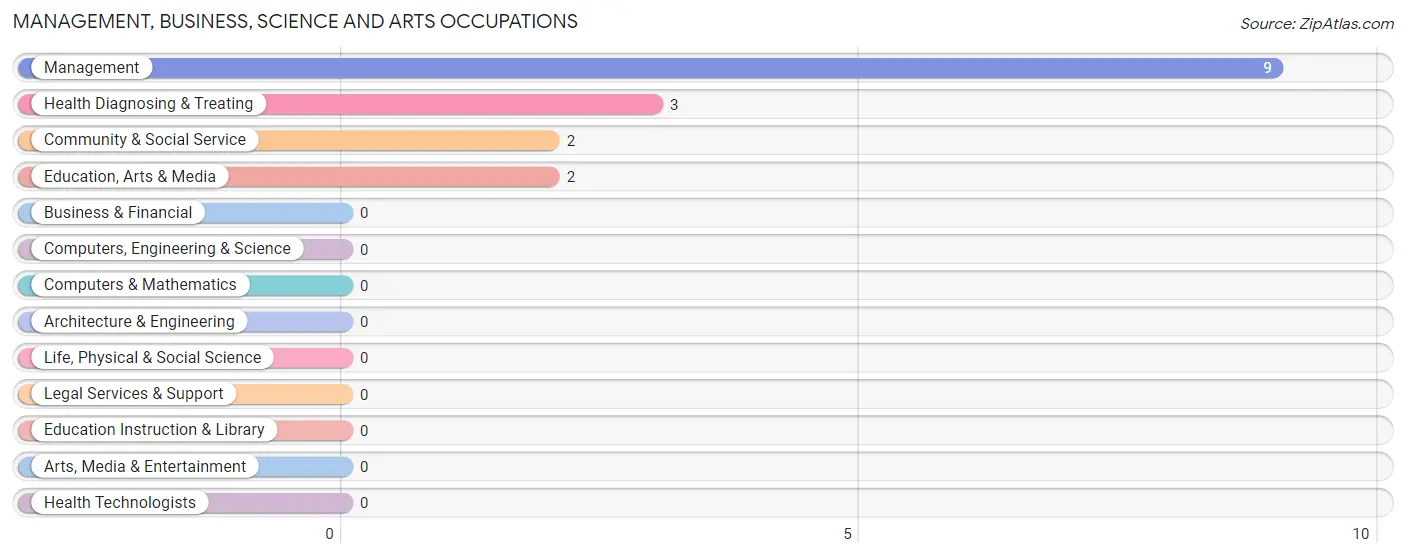
Management, Business, Science and Arts Occupations
The most common Management, Business, Science and Arts occupations in Leasburg are Management (9 | 5.7%), Health Diagnosing & Treating (3 | 1.9%), Community & Social Service (2 | 1.3%), and Education, Arts & Media (2 | 1.3%).
Management, Business, Science and Arts Occupations by Sex
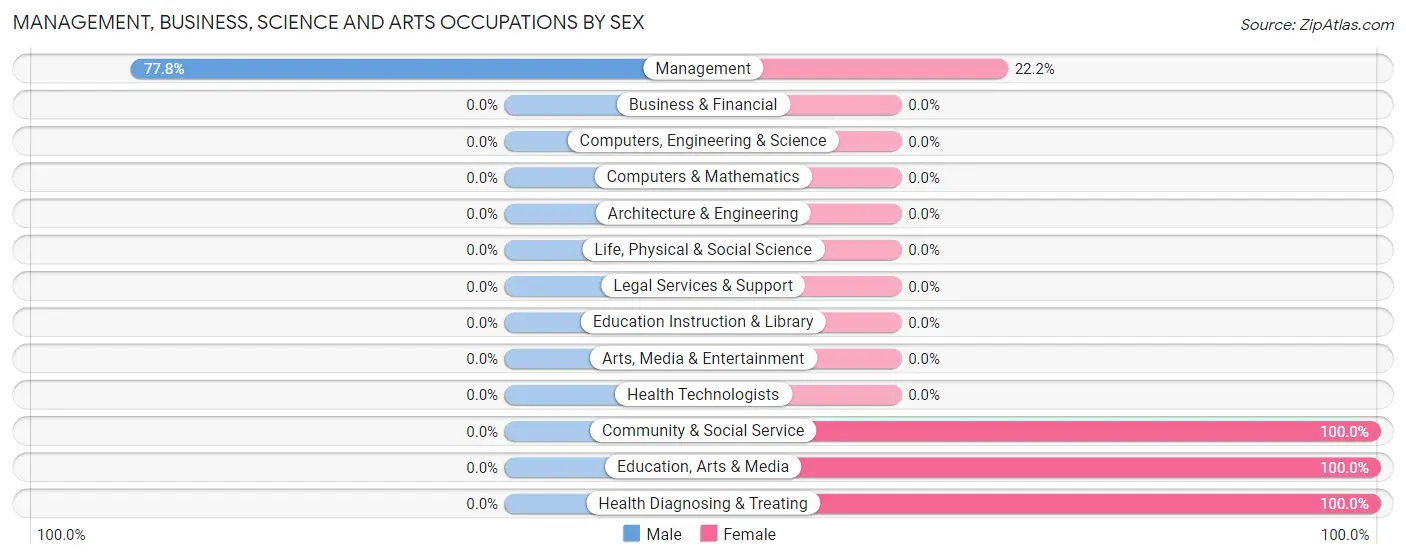
| Occupation | Male | Female |
| Management | 7 (77.8%) | 2 (22.2%) |
| Business & Financial | 0 (0.0%) | 0 (0.0%) |
| Computers, Engineering & Science | 0 (0.0%) | 0 (0.0%) |
| Computers & Mathematics | 0 (0.0%) | 0 (0.0%) |
| Architecture & Engineering | 0 (0.0%) | 0 (0.0%) |
| Life, Physical & Social Science | 0 (0.0%) | 0 (0.0%) |
| Community & Social Service | 0 (0.0%) | 2 (100.0%) |
| Education, Arts & Media | 0 (0.0%) | 2 (100.0%) |
| Legal Services & Support | 0 (0.0%) | 0 (0.0%) |
| Education Instruction & Library | 0 (0.0%) | 0 (0.0%) |
| Arts, Media & Entertainment | 0 (0.0%) | 0 (0.0%) |
| Health Diagnosing & Treating | 0 (0.0%) | 3 (100.0%) |
| Health Technologists | 0 (0.0%) | 0 (0.0%) |
| Total (Category) | 7 (50.0%) | 7 (50.0%) |
| Total (Overall) | 49 (30.8%) | 110 (69.2%) |
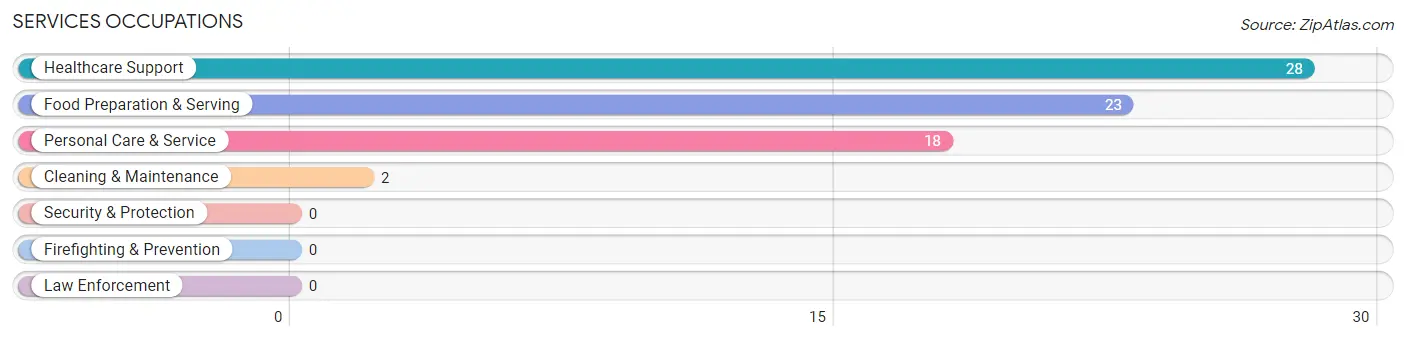
Services Occupations
The most common Services occupations in Leasburg are Healthcare Support (28 | 17.6%), Food Preparation & Serving (23 | 14.5%), Personal Care & Service (18 | 11.3%), and Cleaning & Maintenance (2 | 1.3%).
Services Occupations by Sex
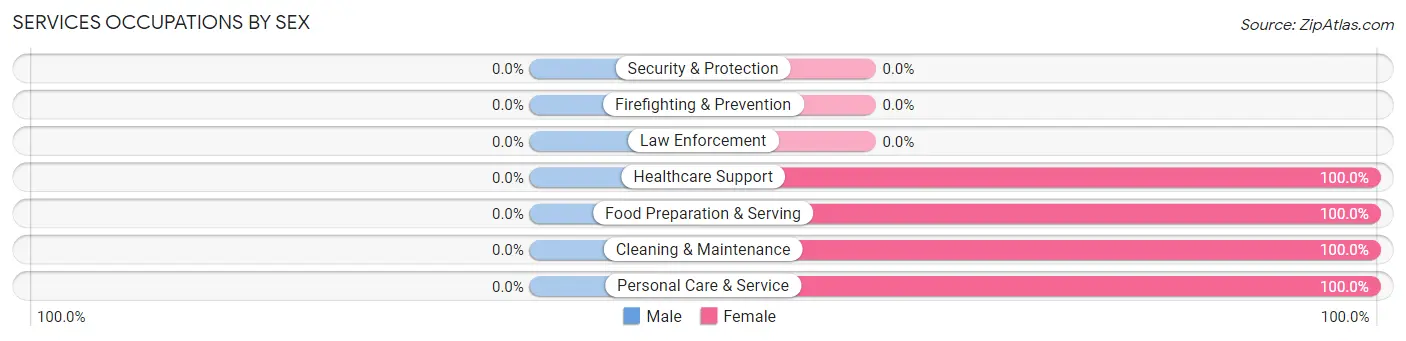
| Occupation | Male | Female |
| Healthcare Support | 0 (0.0%) | 28 (100.0%) |
| Security & Protection | 0 (0.0%) | 0 (0.0%) |
| Firefighting & Prevention | 0 (0.0%) | 0 (0.0%) |
| Law Enforcement | 0 (0.0%) | 0 (0.0%) |
| Food Preparation & Serving | 0 (0.0%) | 23 (100.0%) |
| Cleaning & Maintenance | 0 (0.0%) | 2 (100.0%) |
| Personal Care & Service | 0 (0.0%) | 18 (100.0%) |
| Total (Category) | 0 (0.0%) | 71 (100.0%) |
| Total (Overall) | 49 (30.8%) | 110 (69.2%) |
Sales and Office Occupations
The most common Sales and Office occupations in Leasburg are Sales & Related (24 | 15.1%), and Office & Administration (3 | 1.9%).
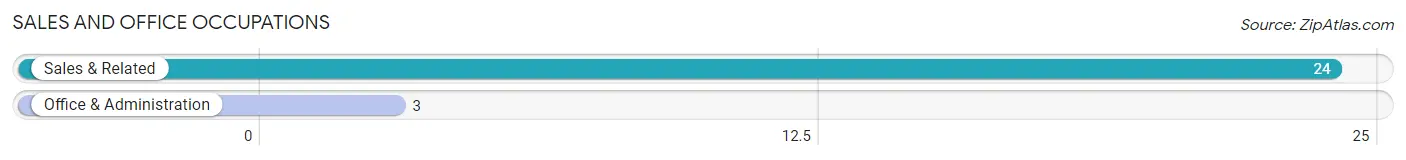
Sales and Office Occupations by Sex
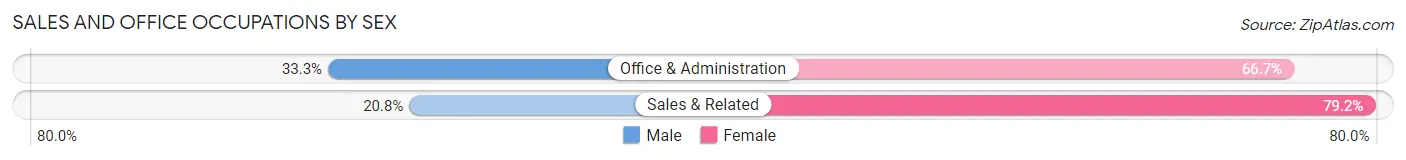
| Occupation | Male | Female |
| Sales & Related | 5 (20.8%) | 19 (79.2%) |
| Office & Administration | 1 (33.3%) | 2 (66.7%) |
| Total (Category) | 6 (22.2%) | 21 (77.8%) |
| Total (Overall) | 49 (30.8%) | 110 (69.2%) |
Natural Resources, Construction and Maintenance Occupations
The most common Natural Resources, Construction and Maintenance occupations in Leasburg are Construction & Extraction (7 | 4.4%), and Installation, Maintenance & Repair (4 | 2.5%).
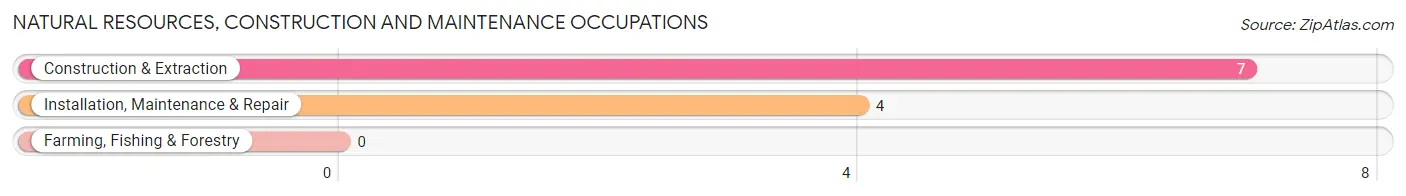
Natural Resources, Construction and Maintenance Occupations by Sex
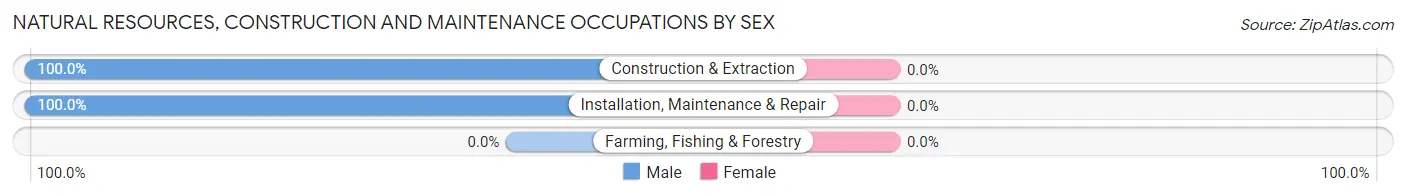
| Occupation | Male | Female |
| Farming, Fishing & Forestry | 0 (0.0%) | 0 (0.0%) |
| Construction & Extraction | 7 (100.0%) | 0 (0.0%) |
| Installation, Maintenance & Repair | 4 (100.0%) | 0 (0.0%) |
| Total (Category) | 11 (100.0%) | 0 (0.0%) |
| Total (Overall) | 49 (30.8%) | 110 (69.2%) |
Production, Transportation and Moving Occupations
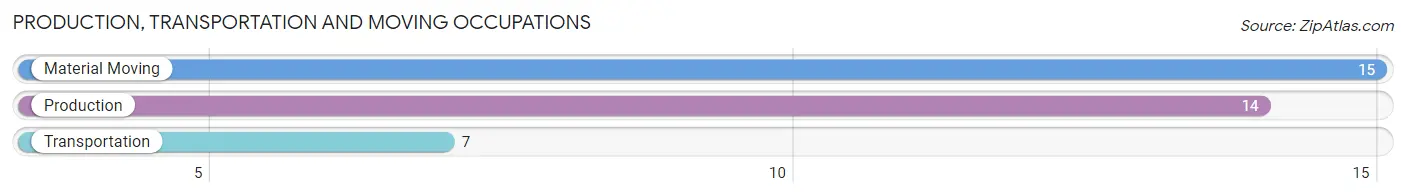
The most common Production, Transportation and Moving occupations in Leasburg are Material Moving (15 | 9.4%), Production (14 | 8.8%), and Transportation (7 | 4.4%).
Production, Transportation and Moving Occupations by Sex
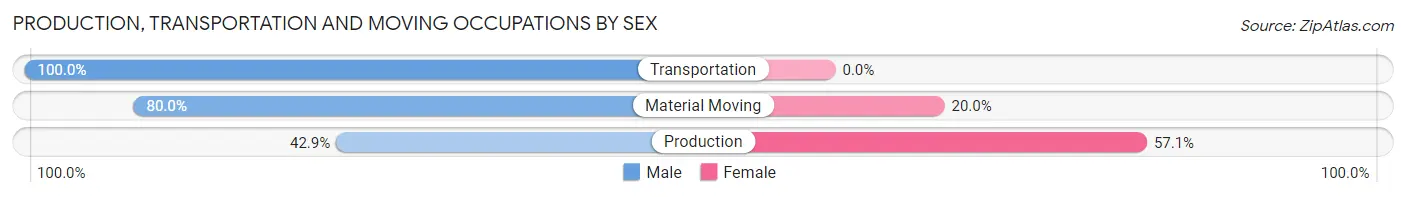
| Occupation | Male | Female |
| Production | 6 (42.9%) | 8 (57.1%) |
| Transportation | 7 (100.0%) | 0 (0.0%) |
| Material Moving | 12 (80.0%) | 3 (20.0%) |
| Total (Category) | 25 (69.4%) | 11 (30.6%) |
| Total (Overall) | 49 (30.8%) | 110 (69.2%) |
Employment Industries by Sex in Leasburg
Employment Industries in Leasburg
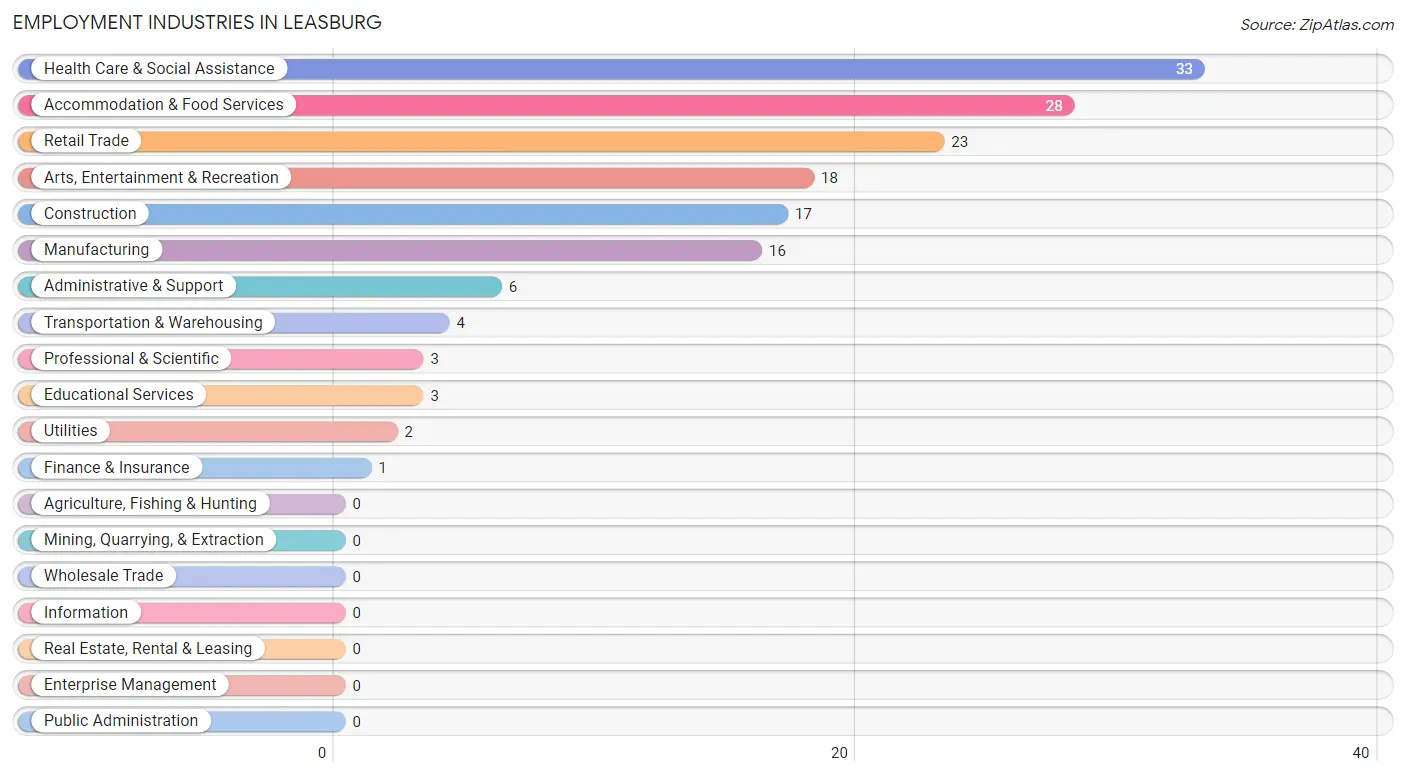
The major employment industries in Leasburg include Health Care & Social Assistance (33 | 20.7%), Accommodation & Food Services (28 | 17.6%), Retail Trade (23 | 14.5%), Arts, Entertainment & Recreation (18 | 11.3%), and Construction (17 | 10.7%).
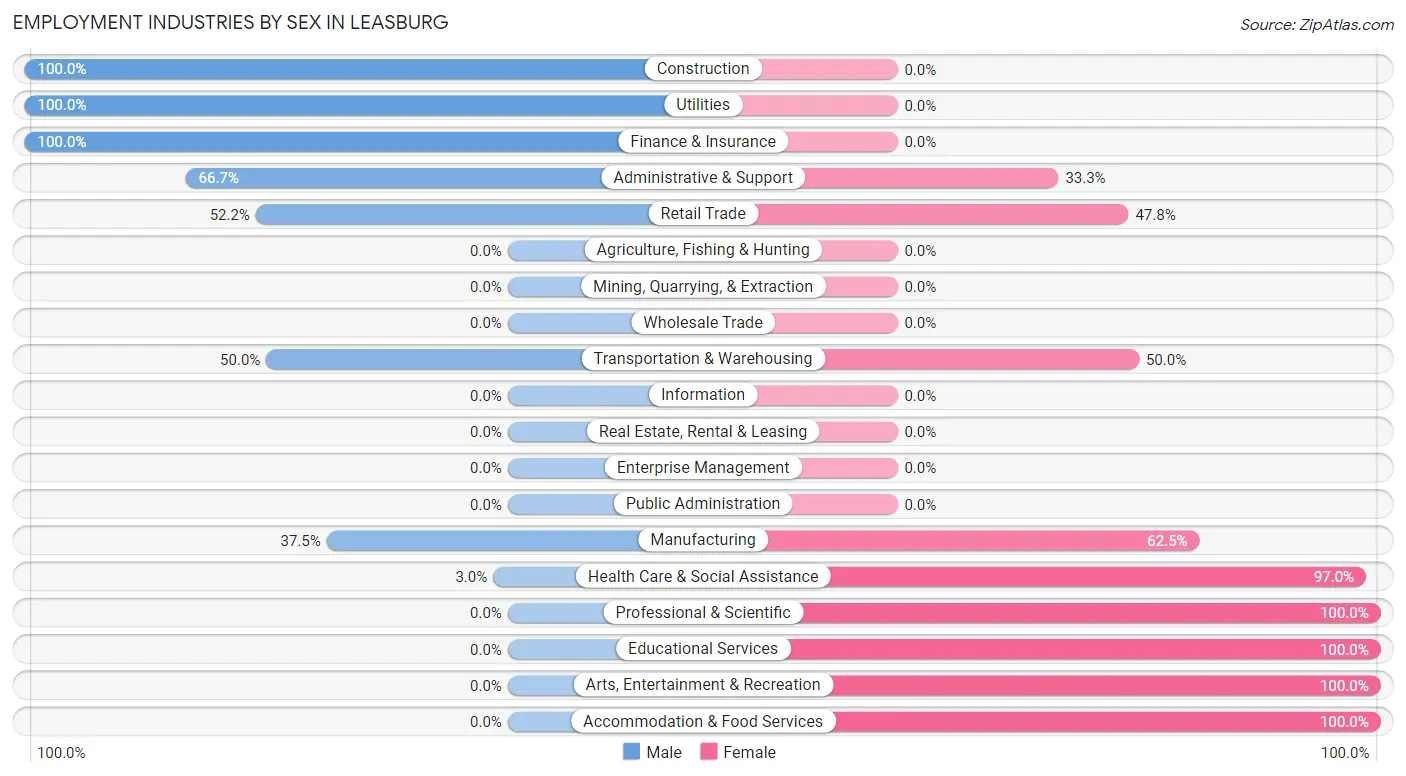
Employment Industries by Sex in Leasburg
The Leasburg industries that see more men than women are Construction (100.0%), Utilities (100.0%), and Finance & Insurance (100.0%), whereas the industries that tend to have a higher number of women are Professional & Scientific (100.0%), Educational Services (100.0%), and Arts, Entertainment & Recreation (100.0%).
| Industry | Male | Female |
| Agriculture, Fishing & Hunting | 0 (0.0%) | 0 (0.0%) |
| Mining, Quarrying, & Extraction | 0 (0.0%) | 0 (0.0%) |
| Construction | 17 (100.0%) | 0 (0.0%) |
| Manufacturing | 6 (37.5%) | 10 (62.5%) |
| Wholesale Trade | 0 (0.0%) | 0 (0.0%) |
| Retail Trade | 12 (52.2%) | 11 (47.8%) |
| Transportation & Warehousing | 2 (50.0%) | 2 (50.0%) |
| Utilities | 2 (100.0%) | 0 (0.0%) |
| Information | 0 (0.0%) | 0 (0.0%) |
| Finance & Insurance | 1 (100.0%) | 0 (0.0%) |
| Real Estate, Rental & Leasing | 0 (0.0%) | 0 (0.0%) |
| Professional & Scientific | 0 (0.0%) | 3 (100.0%) |
| Enterprise Management | 0 (0.0%) | 0 (0.0%) |
| Administrative & Support | 4 (66.7%) | 2 (33.3%) |
| Educational Services | 0 (0.0%) | 3 (100.0%) |
| Health Care & Social Assistance | 1 (3.0%) | 32 (97.0%) |
| Arts, Entertainment & Recreation | 0 (0.0%) | 18 (100.0%) |
| Accommodation & Food Services | 0 (0.0%) | 28 (100.0%) |
| Public Administration | 0 (0.0%) | 0 (0.0%) |
| Total | 49 (30.8%) | 110 (69.2%) |
Education in Leasburg
School Enrollment in Leasburg
The most common levels of schooling among the 117 students in Leasburg are middle school (41 | 35.0%), high school (28 | 23.9%), and elementary school (26 | 22.2%).
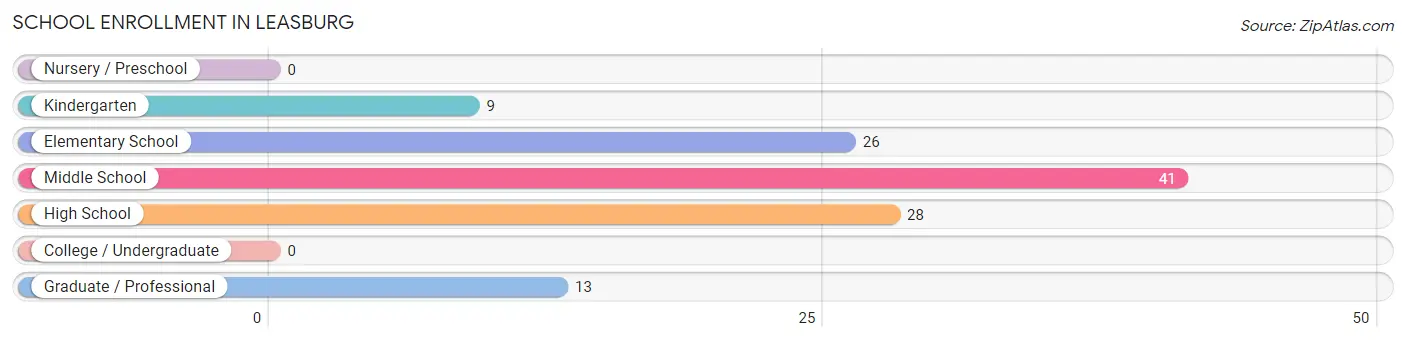
| School Level | # Students | % Students |
| Nursery / Preschool | 0 | 0.0% |
| Kindergarten | 9 | 7.7% |
| Elementary School | 26 | 22.2% |
| Middle School | 41 | 35.0% |
| High School | 28 | 23.9% |
| College / Undergraduate | 0 | 0.0% |
| Graduate / Professional | 13 | 11.1% |
| Total | 117 | 100.0% |
School Enrollment by Age by Funding Source in Leasburg
Out of a total of 117 students who are enrolled in schools in Leasburg, 3 (2.6%) attend a private institution, while the remaining 114 (97.4%) are enrolled in public schools. The age group of 25 to 34 year olds has the highest likelihood of being enrolled in private schools, with 3 (100.0% in the age bracket) enrolled. Conversely, the age group of 5 to 9 year old has the lowest likelihood of being enrolled in a private school, with 35 (100.0% in the age bracket) attending a public institution.
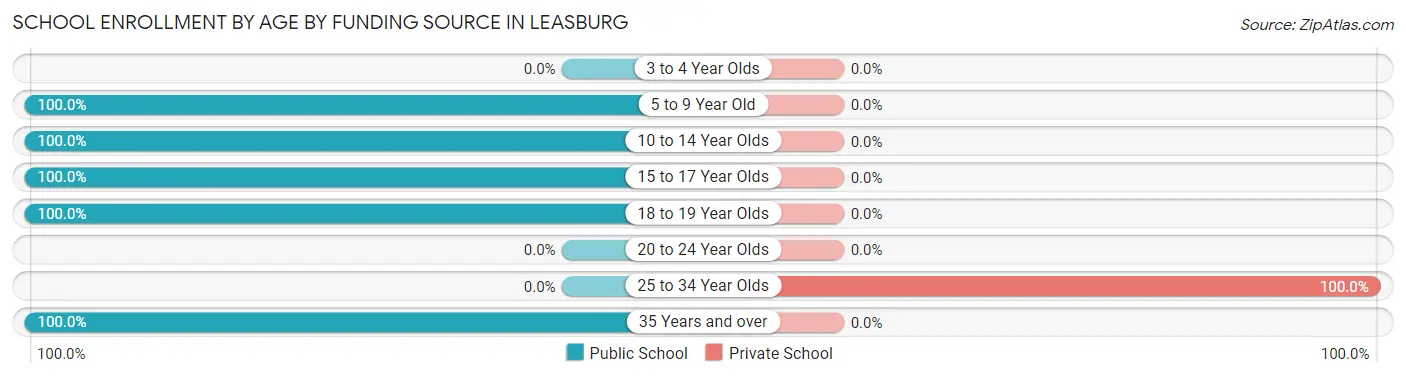
| Age Bracket | Public School | Private School |
| 3 to 4 Year Olds | 0 (0.0%) | 0 (0.0%) |
| 5 to 9 Year Old | 35 (100.0%) | 0 (0.0%) |
| 10 to 14 Year Olds | 45 (100.0%) | 0 (0.0%) |
| 15 to 17 Year Olds | 17 (100.0%) | 0 (0.0%) |
| 18 to 19 Year Olds | 7 (100.0%) | 0 (0.0%) |
| 20 to 24 Year Olds | 0 (0.0%) | 0 (0.0%) |
| 25 to 34 Year Olds | 0 (0.0%) | 3 (100.0%) |
| 35 Years and over | 10 (100.0%) | 0 (0.0%) |
| Total | 114 (97.4%) | 3 (2.6%) |
Educational Attainment by Field of Study in Leasburg
Education (12 | 60.0%), and arts & humanities (8 | 40.0%) are the most common fields of study among 20 individuals in Leasburg who have obtained a bachelor's degree or higher.
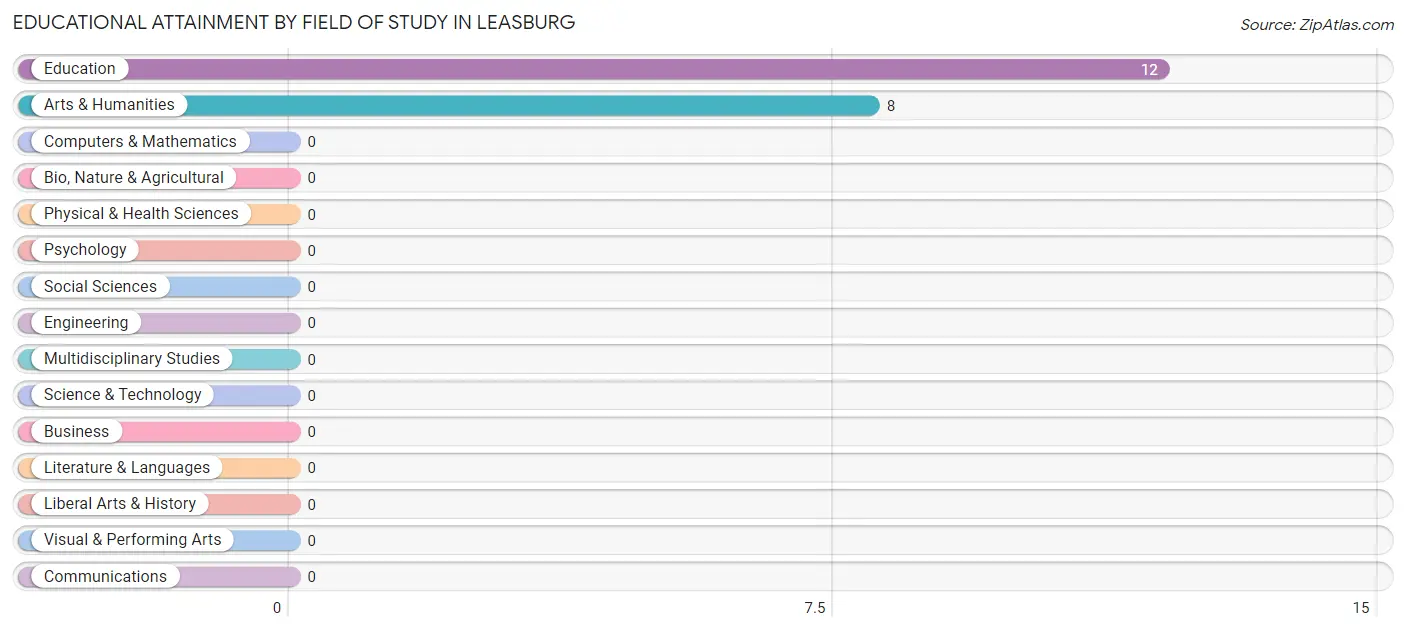
| Field of Study | # Graduates | % Graduates |
| Computers & Mathematics | 0 | 0.0% |
| Bio, Nature & Agricultural | 0 | 0.0% |
| Physical & Health Sciences | 0 | 0.0% |
| Psychology | 0 | 0.0% |
| Social Sciences | 0 | 0.0% |
| Engineering | 0 | 0.0% |
| Multidisciplinary Studies | 0 | 0.0% |
| Science & Technology | 0 | 0.0% |
| Business | 0 | 0.0% |
| Education | 12 | 60.0% |
| Literature & Languages | 0 | 0.0% |
| Liberal Arts & History | 0 | 0.0% |
| Visual & Performing Arts | 0 | 0.0% |
| Communications | 0 | 0.0% |
| Arts & Humanities | 8 | 40.0% |
| Total | 20 | 100.0% |
Transportation & Commute in Leasburg
Vehicle Availability by Sex in Leasburg
The most prevalent vehicle ownership categories in Leasburg are males with 4 vehicles (19, accounting for 47.5%) and females with 4 vehicles (8, making up 17.3%).
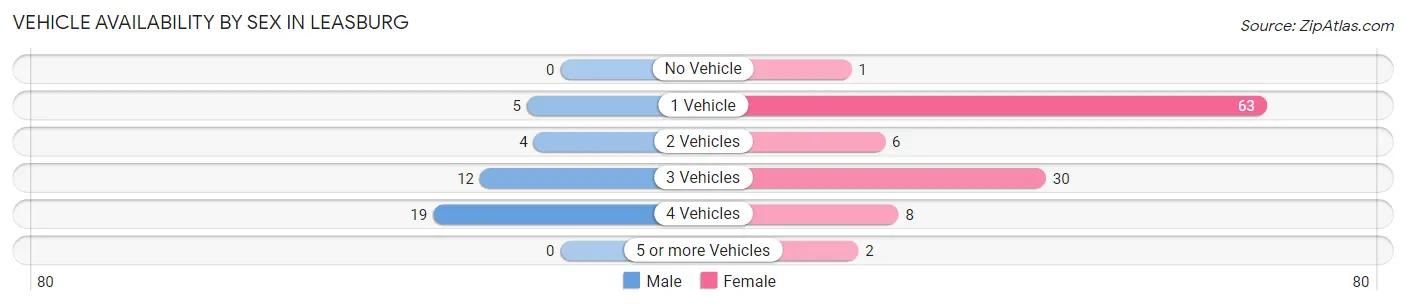
| Vehicles Available | Male | Female |
| No Vehicle | 0 (0.0%) | 1 (0.9%) |
| 1 Vehicle | 5 (12.5%) | 63 (57.3%) |
| 2 Vehicles | 4 (10.0%) | 6 (5.4%) |
| 3 Vehicles | 12 (30.0%) | 30 (27.3%) |
| 4 Vehicles | 19 (47.5%) | 8 (7.3%) |
| 5 or more Vehicles | 0 (0.0%) | 2 (1.8%) |
| Total | 40 (100.0%) | 110 (100.0%) |
Commute Time in Leasburg
The most frequently occuring commute durations in Leasburg are 15 to 19 minutes (48 commuters, 32.2%), 20 to 24 minutes (32 commuters, 21.5%), and 10 to 14 minutes (24 commuters, 16.1%).
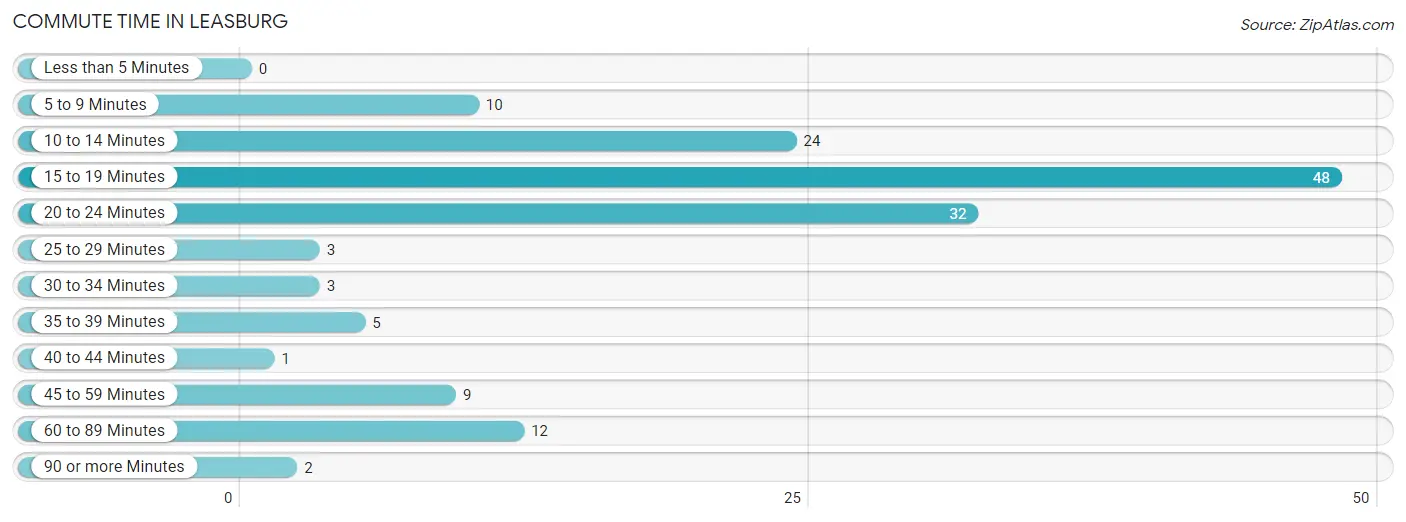
| Commute Time | # Commuters | % Commuters |
| Less than 5 Minutes | 0 | 0.0% |
| 5 to 9 Minutes | 10 | 6.7% |
| 10 to 14 Minutes | 24 | 16.1% |
| 15 to 19 Minutes | 48 | 32.2% |
| 20 to 24 Minutes | 32 | 21.5% |
| 25 to 29 Minutes | 3 | 2.0% |
| 30 to 34 Minutes | 3 | 2.0% |
| 35 to 39 Minutes | 5 | 3.4% |
| 40 to 44 Minutes | 1 | 0.7% |
| 45 to 59 Minutes | 9 | 6.0% |
| 60 to 89 Minutes | 12 | 8.1% |
| 90 or more Minutes | 2 | 1.3% |
Commute Time by Sex in Leasburg
The most common commute times in Leasburg are 15 to 19 minutes (14 commuters, 35.9%) for males and 15 to 19 minutes (34 commuters, 30.9%) for females.
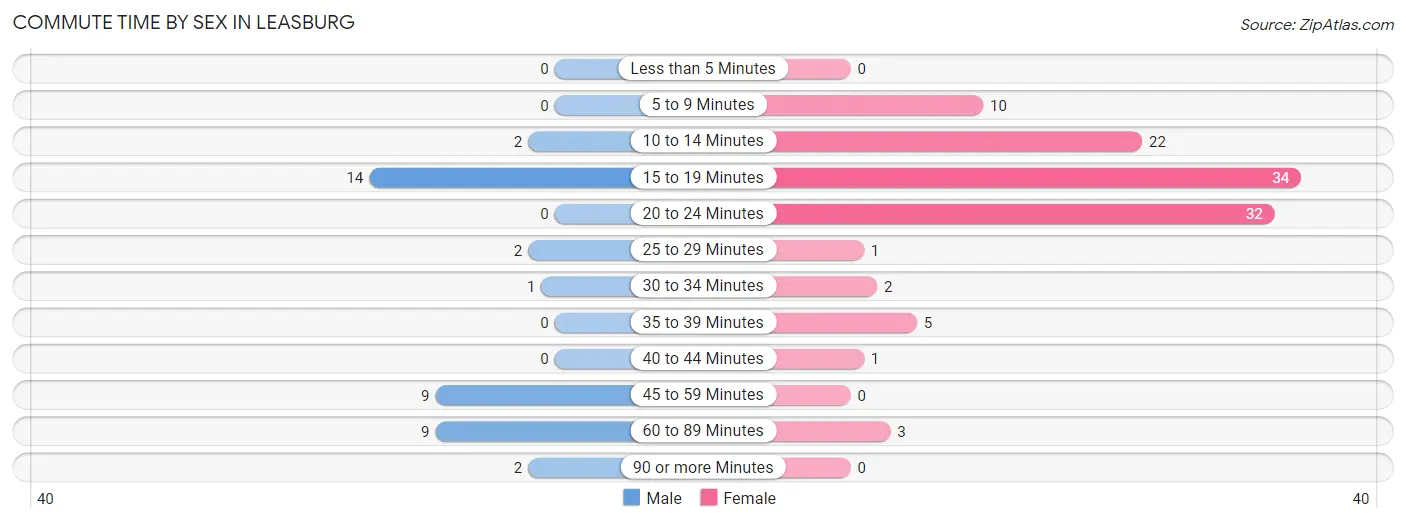
| Commute Time | Male | Female |
| Less than 5 Minutes | 0 (0.0%) | 0 (0.0%) |
| 5 to 9 Minutes | 0 (0.0%) | 10 (9.1%) |
| 10 to 14 Minutes | 2 (5.1%) | 22 (20.0%) |
| 15 to 19 Minutes | 14 (35.9%) | 34 (30.9%) |
| 20 to 24 Minutes | 0 (0.0%) | 32 (29.1%) |
| 25 to 29 Minutes | 2 (5.1%) | 1 (0.9%) |
| 30 to 34 Minutes | 1 (2.6%) | 2 (1.8%) |
| 35 to 39 Minutes | 0 (0.0%) | 5 (4.5%) |
| 40 to 44 Minutes | 0 (0.0%) | 1 (0.9%) |
| 45 to 59 Minutes | 9 (23.1%) | 0 (0.0%) |
| 60 to 89 Minutes | 9 (23.1%) | 3 (2.7%) |
| 90 or more Minutes | 2 (5.1%) | 0 (0.0%) |
Time of Departure to Work by Sex in Leasburg
The most frequent times of departure to work in Leasburg are 6:00 AM to 6:29 AM (9, 23.1%) for males and 4:00 PM to 11:59 PM (31, 28.2%) for females.
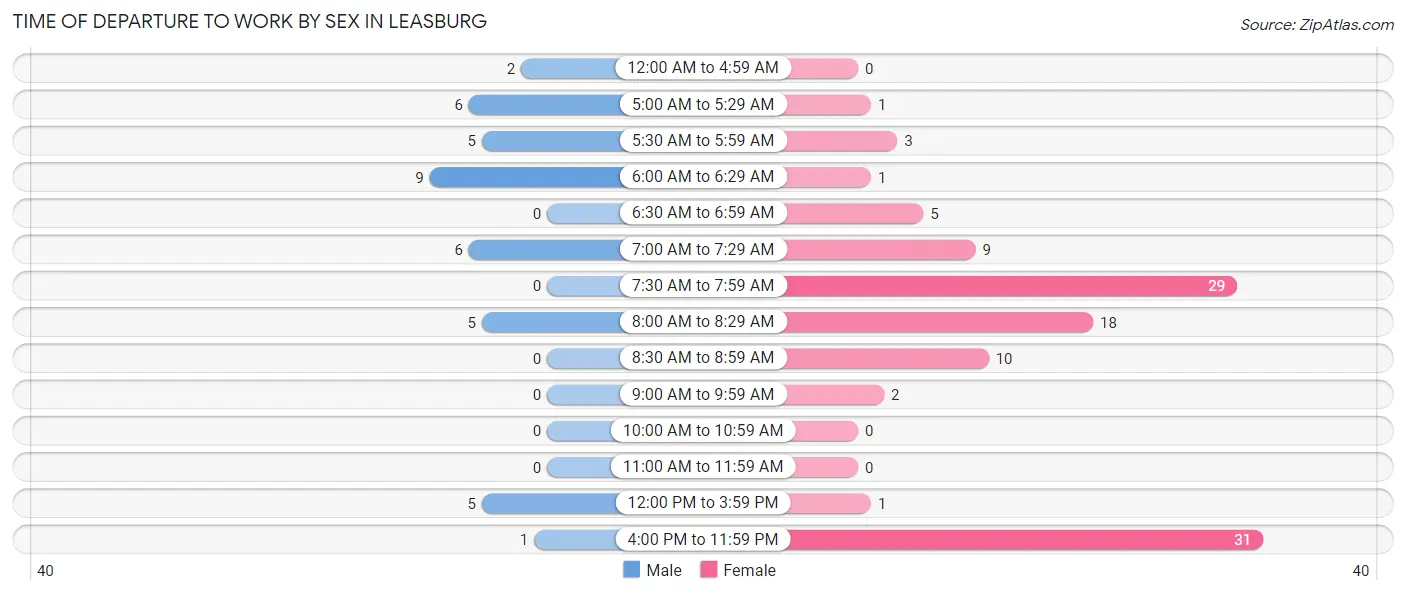
| Time of Departure | Male | Female |
| 12:00 AM to 4:59 AM | 2 (5.1%) | 0 (0.0%) |
| 5:00 AM to 5:29 AM | 6 (15.4%) | 1 (0.9%) |
| 5:30 AM to 5:59 AM | 5 (12.8%) | 3 (2.7%) |
| 6:00 AM to 6:29 AM | 9 (23.1%) | 1 (0.9%) |
| 6:30 AM to 6:59 AM | 0 (0.0%) | 5 (4.5%) |
| 7:00 AM to 7:29 AM | 6 (15.4%) | 9 (8.2%) |
| 7:30 AM to 7:59 AM | 0 (0.0%) | 29 (26.4%) |
| 8:00 AM to 8:29 AM | 5 (12.8%) | 18 (16.4%) |
| 8:30 AM to 8:59 AM | 0 (0.0%) | 10 (9.1%) |
| 9:00 AM to 9:59 AM | 0 (0.0%) | 2 (1.8%) |
| 10:00 AM to 10:59 AM | 0 (0.0%) | 0 (0.0%) |
| 11:00 AM to 11:59 AM | 0 (0.0%) | 0 (0.0%) |
| 12:00 PM to 3:59 PM | 5 (12.8%) | 1 (0.9%) |
| 4:00 PM to 11:59 PM | 1 (2.6%) | 31 (28.2%) |
| Total | 39 (100.0%) | 110 (100.0%) |
Housing Occupancy in Leasburg
Occupancy by Ownership in Leasburg
Of the total 142 dwellings in Leasburg, owner-occupied units account for 74 (52.1%), while renter-occupied units make up 68 (47.9%).
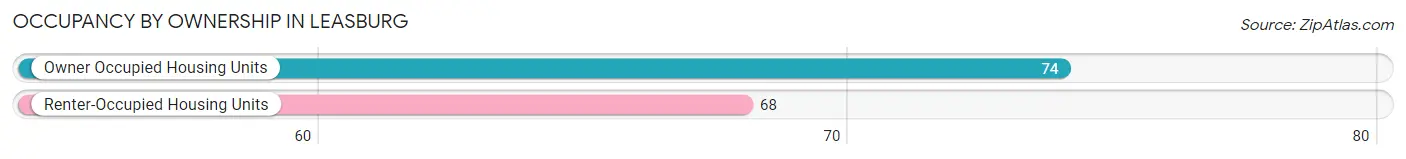
| Occupancy | # Housing Units | % Housing Units |
| Owner Occupied Housing Units | 74 | 52.1% |
| Renter-Occupied Housing Units | 68 | 47.9% |
| Total Occupied Housing Units | 142 | 100.0% |
Occupancy by Household Size in Leasburg
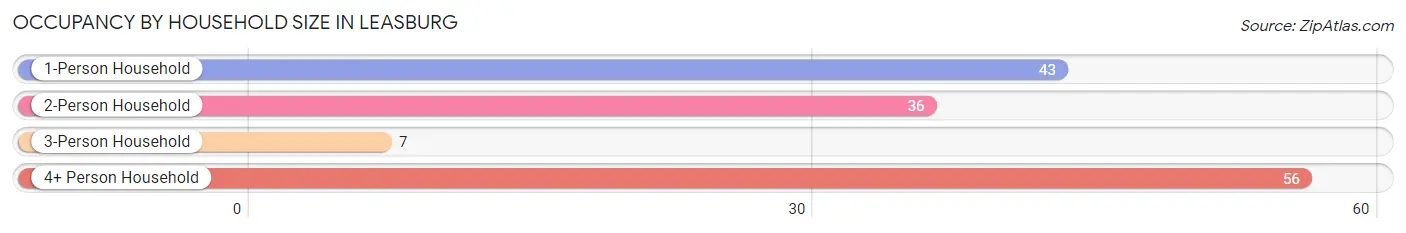
| Household Size | # Housing Units | % Housing Units |
| 1-Person Household | 43 | 30.3% |
| 2-Person Household | 36 | 25.4% |
| 3-Person Household | 7 | 4.9% |
| 4+ Person Household | 56 | 39.4% |
| Total Housing Units | 142 | 100.0% |
Occupancy by Ownership by Household Size in Leasburg
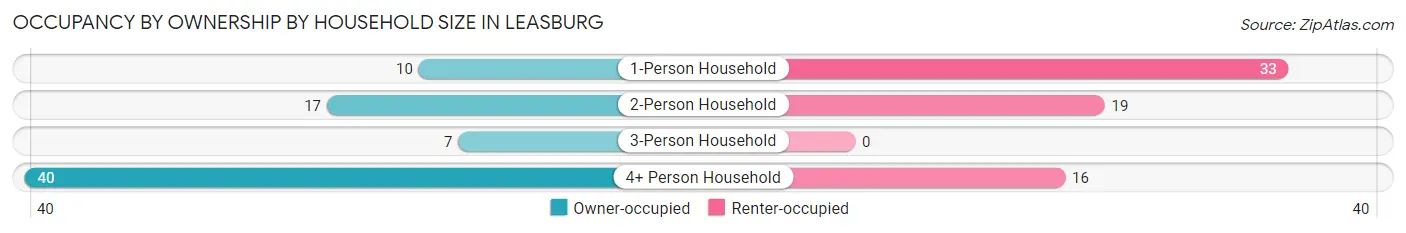
| Household Size | Owner-occupied | Renter-occupied |
| 1-Person Household | 10 (23.3%) | 33 (76.7%) |
| 2-Person Household | 17 (47.2%) | 19 (52.8%) |
| 3-Person Household | 7 (100.0%) | 0 (0.0%) |
| 4+ Person Household | 40 (71.4%) | 16 (28.6%) |
| Total Housing Units | 74 (52.1%) | 68 (47.9%) |
Occupancy by Educational Attainment in Leasburg
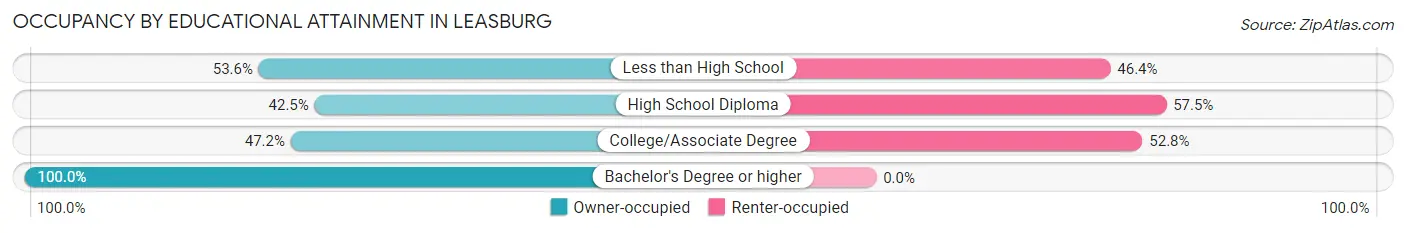
| Household Size | Owner-occupied | Renter-occupied |
| Less than High School | 30 (53.6%) | 26 (46.4%) |
| High School Diploma | 17 (42.5%) | 23 (57.5%) |
| College/Associate Degree | 17 (47.2%) | 19 (52.8%) |
| Bachelor's Degree or higher | 10 (100.0%) | 0 (0.0%) |
Occupancy by Age of Householder in Leasburg
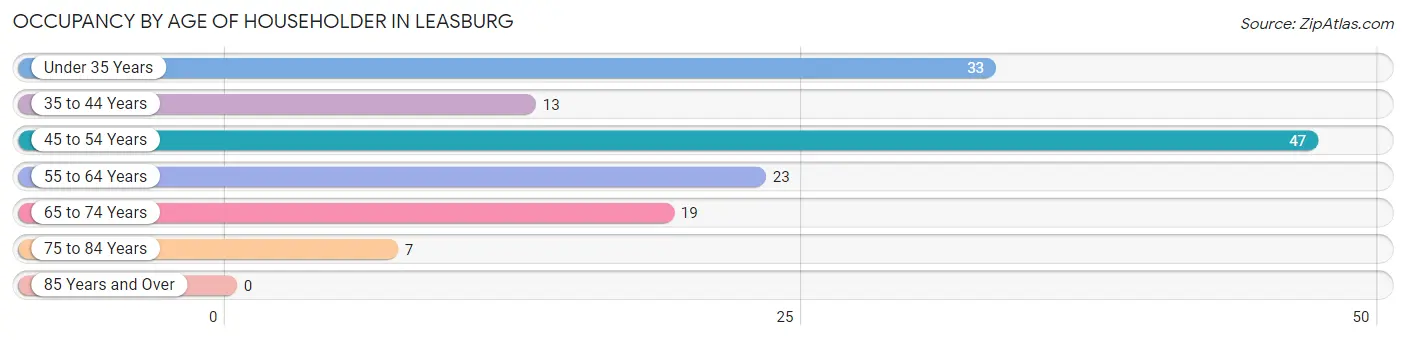
| Age Bracket | # Households | % Households |
| Under 35 Years | 33 | 23.2% |
| 35 to 44 Years | 13 | 9.1% |
| 45 to 54 Years | 47 | 33.1% |
| 55 to 64 Years | 23 | 16.2% |
| 65 to 74 Years | 19 | 13.4% |
| 75 to 84 Years | 7 | 4.9% |
| 85 Years and Over | 0 | 0.0% |
| Total | 142 | 100.0% |
Housing Finances in Leasburg
Median Income by Occupancy in Leasburg
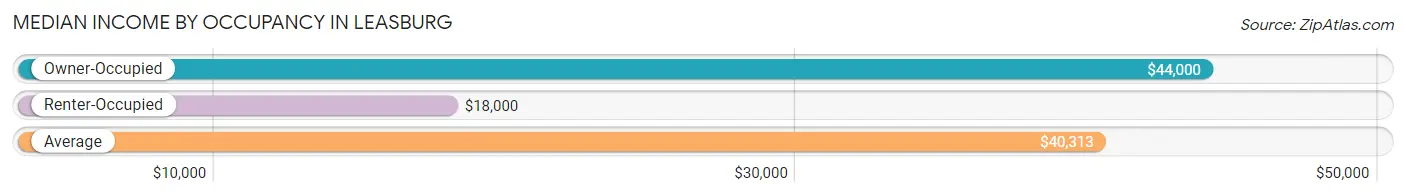
| Occupancy Type | # Households | Median Income |
| Owner-Occupied | 74 (52.1%) | $44,000 |
| Renter-Occupied | 68 (47.9%) | $18,000 |
| Average | 142 (100.0%) | $40,313 |
Occupancy by Householder Income Bracket in Leasburg
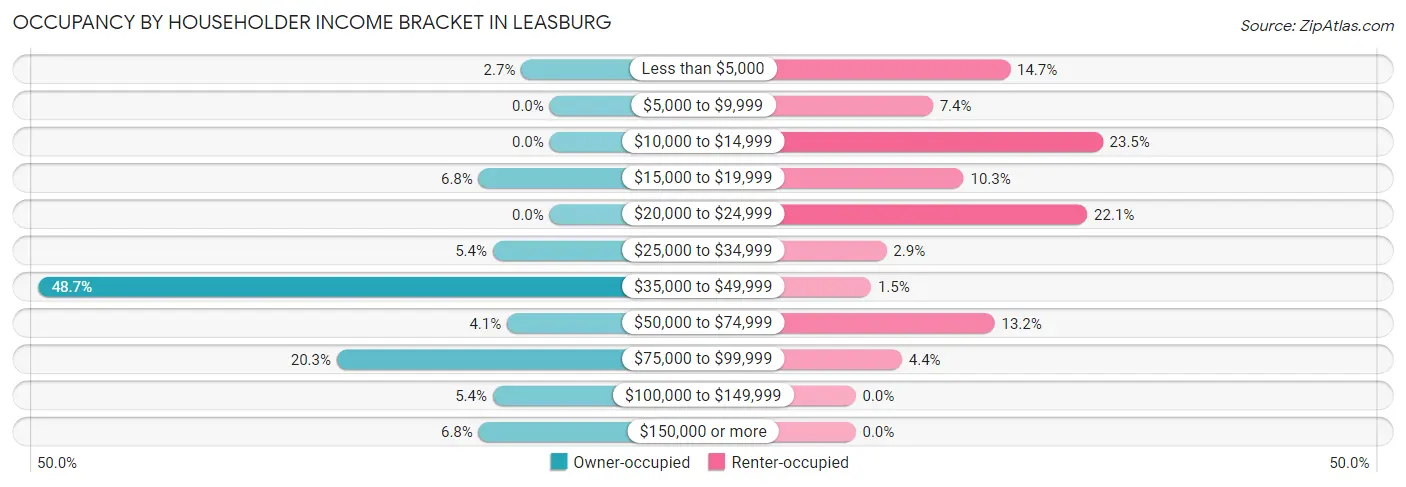
| Income Bracket | Owner-occupied | Renter-occupied |
| Less than $5,000 | 2 (2.7%) | 10 (14.7%) |
| $5,000 to $9,999 | 0 (0.0%) | 5 (7.3%) |
| $10,000 to $14,999 | 0 (0.0%) | 16 (23.5%) |
| $15,000 to $19,999 | 5 (6.8%) | 7 (10.3%) |
| $20,000 to $24,999 | 0 (0.0%) | 15 (22.1%) |
| $25,000 to $34,999 | 4 (5.4%) | 2 (2.9%) |
| $35,000 to $49,999 | 36 (48.6%) | 1 (1.5%) |
| $50,000 to $74,999 | 3 (4.1%) | 9 (13.2%) |
| $75,000 to $99,999 | 15 (20.3%) | 3 (4.4%) |
| $100,000 to $149,999 | 4 (5.4%) | 0 (0.0%) |
| $150,000 or more | 5 (6.8%) | 0 (0.0%) |
| Total | 74 (100.0%) | 68 (100.0%) |
Monthly Housing Cost Tiers in Leasburg
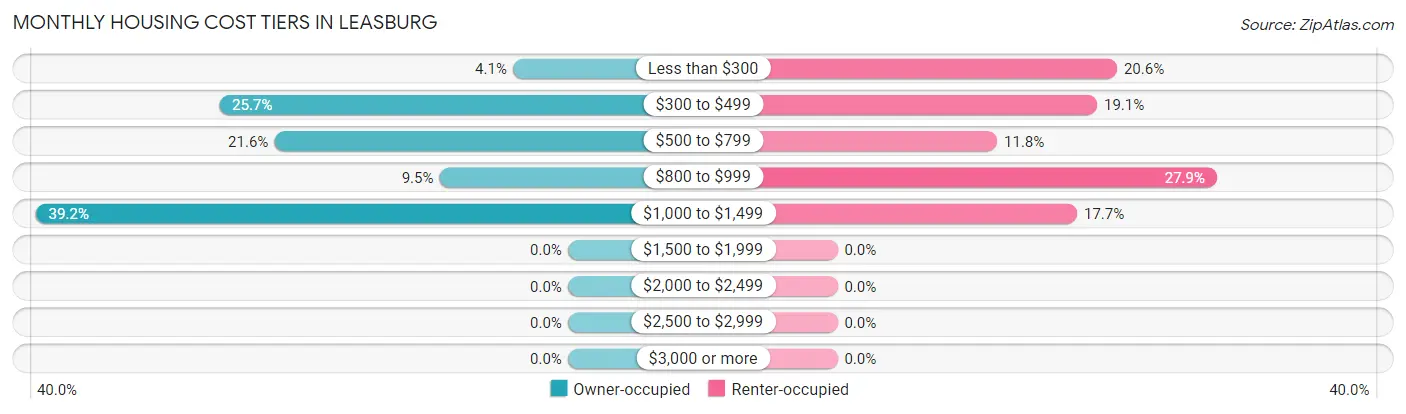
| Monthly Cost | Owner-occupied | Renter-occupied |
| Less than $300 | 3 (4.1%) | 14 (20.6%) |
| $300 to $499 | 19 (25.7%) | 13 (19.1%) |
| $500 to $799 | 16 (21.6%) | 8 (11.8%) |
| $800 to $999 | 7 (9.5%) | 19 (27.9%) |
| $1,000 to $1,499 | 29 (39.2%) | 12 (17.6%) |
| $1,500 to $1,999 | 0 (0.0%) | 0 (0.0%) |
| $2,000 to $2,499 | 0 (0.0%) | 0 (0.0%) |
| $2,500 to $2,999 | 0 (0.0%) | 0 (0.0%) |
| $3,000 or more | 0 (0.0%) | 0 (0.0%) |
| Total | 74 (100.0%) | 68 (100.0%) |
Physical Housing Characteristics in Leasburg
Housing Structures in Leasburg
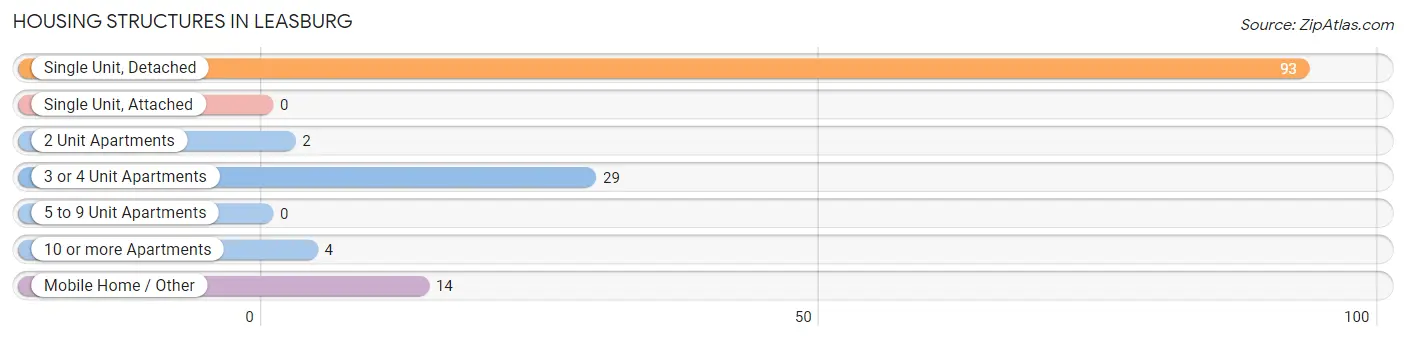
| Structure Type | # Housing Units | % Housing Units |
| Single Unit, Detached | 93 | 65.5% |
| Single Unit, Attached | 0 | 0.0% |
| 2 Unit Apartments | 2 | 1.4% |
| 3 or 4 Unit Apartments | 29 | 20.4% |
| 5 to 9 Unit Apartments | 0 | 0.0% |
| 10 or more Apartments | 4 | 2.8% |
| Mobile Home / Other | 14 | 9.9% |
| Total | 142 | 100.0% |
Housing Structures by Occupancy in Leasburg
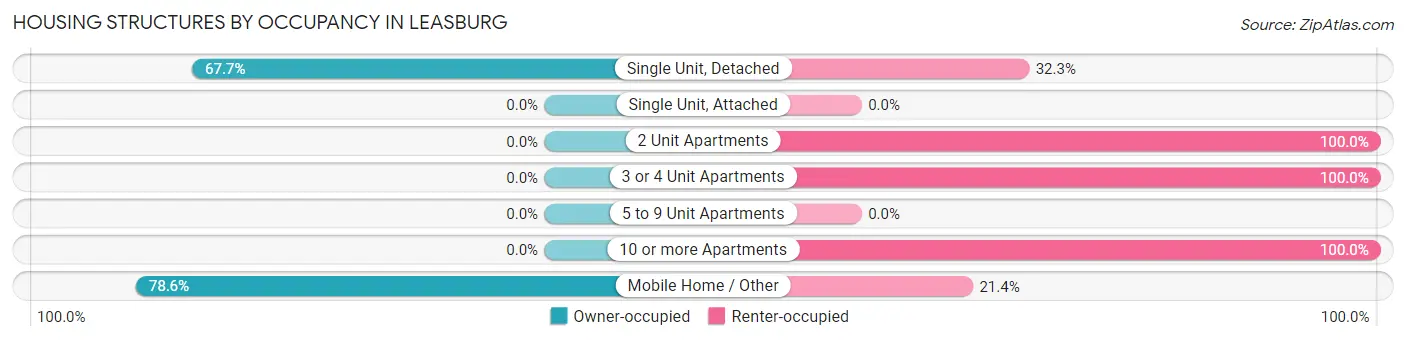
| Structure Type | Owner-occupied | Renter-occupied |
| Single Unit, Detached | 63 (67.7%) | 30 (32.3%) |
| Single Unit, Attached | 0 (0.0%) | 0 (0.0%) |
| 2 Unit Apartments | 0 (0.0%) | 2 (100.0%) |
| 3 or 4 Unit Apartments | 0 (0.0%) | 29 (100.0%) |
| 5 to 9 Unit Apartments | 0 (0.0%) | 0 (0.0%) |
| 10 or more Apartments | 0 (0.0%) | 4 (100.0%) |
| Mobile Home / Other | 11 (78.6%) | 3 (21.4%) |
| Total | 74 (52.1%) | 68 (47.9%) |
Housing Structures by Number of Rooms in Leasburg
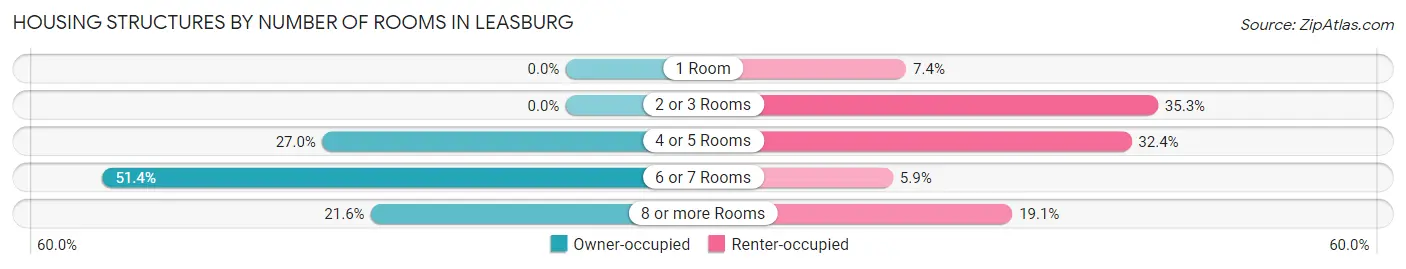
| Number of Rooms | Owner-occupied | Renter-occupied |
| 1 Room | 0 (0.0%) | 5 (7.3%) |
| 2 or 3 Rooms | 0 (0.0%) | 24 (35.3%) |
| 4 or 5 Rooms | 20 (27.0%) | 22 (32.4%) |
| 6 or 7 Rooms | 38 (51.3%) | 4 (5.9%) |
| 8 or more Rooms | 16 (21.6%) | 13 (19.1%) |
| Total | 74 (100.0%) | 68 (100.0%) |
Housing Structure by Heating Type in Leasburg
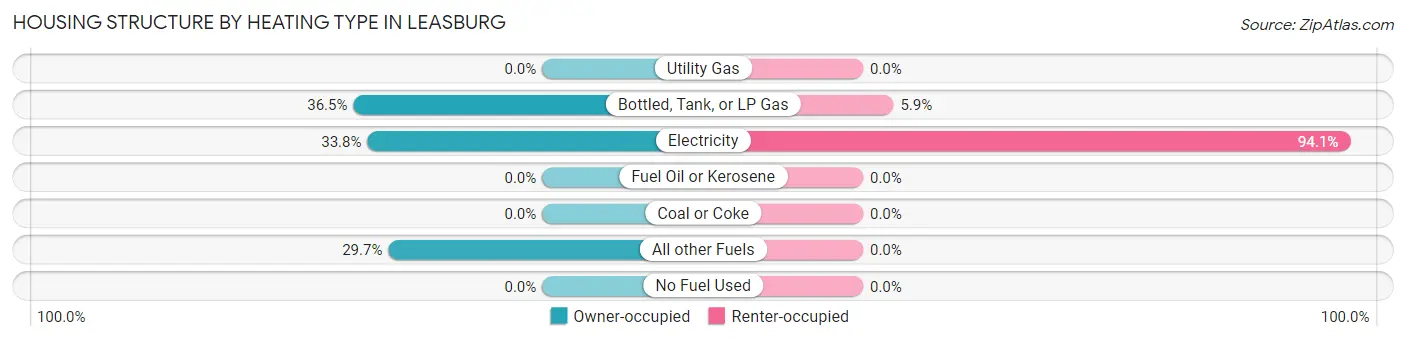
| Heating Type | Owner-occupied | Renter-occupied |
| Utility Gas | 0 (0.0%) | 0 (0.0%) |
| Bottled, Tank, or LP Gas | 27 (36.5%) | 4 (5.9%) |
| Electricity | 25 (33.8%) | 64 (94.1%) |
| Fuel Oil or Kerosene | 0 (0.0%) | 0 (0.0%) |
| Coal or Coke | 0 (0.0%) | 0 (0.0%) |
| All other Fuels | 22 (29.7%) | 0 (0.0%) |
| No Fuel Used | 0 (0.0%) | 0 (0.0%) |
| Total | 74 (100.0%) | 68 (100.0%) |
Household Vehicle Usage in Leasburg
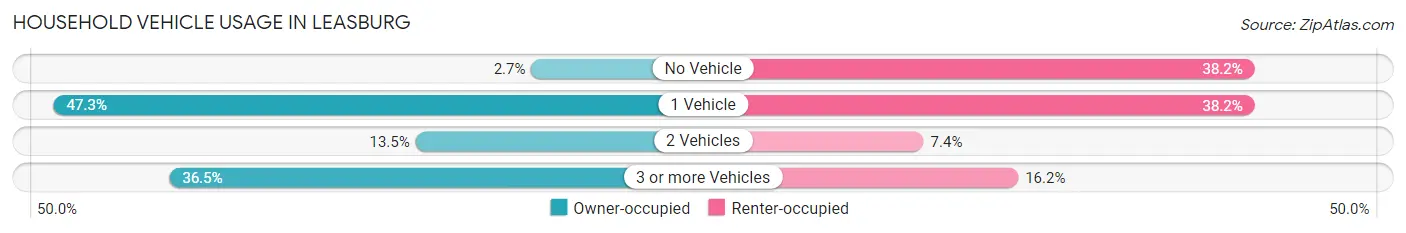
| Vehicles per Household | Owner-occupied | Renter-occupied |
| No Vehicle | 2 (2.7%) | 26 (38.2%) |
| 1 Vehicle | 35 (47.3%) | 26 (38.2%) |
| 2 Vehicles | 10 (13.5%) | 5 (7.3%) |
| 3 or more Vehicles | 27 (36.5%) | 11 (16.2%) |
| Total | 74 (100.0%) | 68 (100.0%) |
Real Estate & Mortgages in Leasburg
Real Estate and Mortgage Overview in Leasburg
| Characteristic | Without Mortgage | With Mortgage |
| Housing Units | 25 | 49 |
| Median Property Value | $67,900 | $94,100 |
| Median Household Income | $40,781 | $5 |
| Monthly Housing Costs | $340 | $0 |
| Real Estate Taxes | $567 | $0 |
Property Value by Mortgage Status in Leasburg
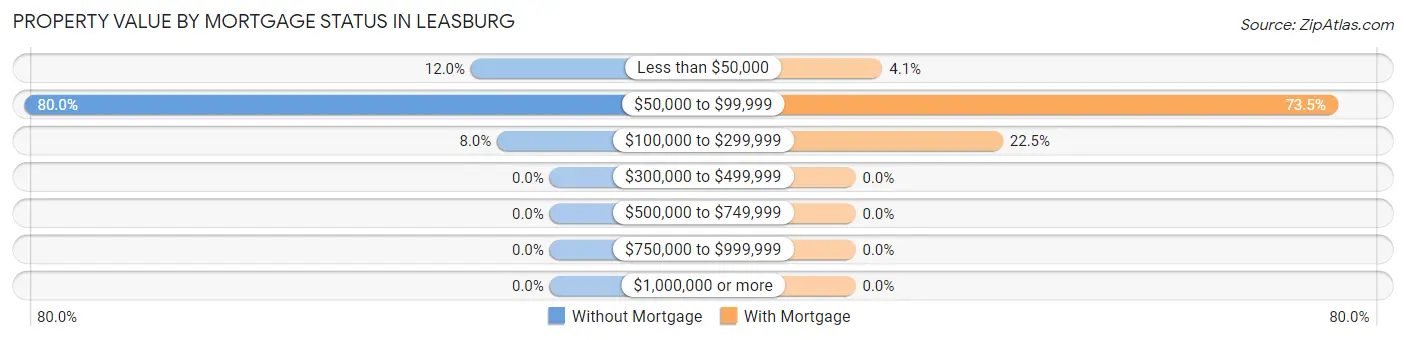
| Property Value | Without Mortgage | With Mortgage |
| Less than $50,000 | 3 (12.0%) | 2 (4.1%) |
| $50,000 to $99,999 | 20 (80.0%) | 36 (73.5%) |
| $100,000 to $299,999 | 2 (8.0%) | 11 (22.5%) |
| $300,000 to $499,999 | 0 (0.0%) | 0 (0.0%) |
| $500,000 to $749,999 | 0 (0.0%) | 0 (0.0%) |
| $750,000 to $999,999 | 0 (0.0%) | 0 (0.0%) |
| $1,000,000 or more | 0 (0.0%) | 0 (0.0%) |
| Total | 25 (100.0%) | 49 (100.0%) |
Household Income by Mortgage Status in Leasburg
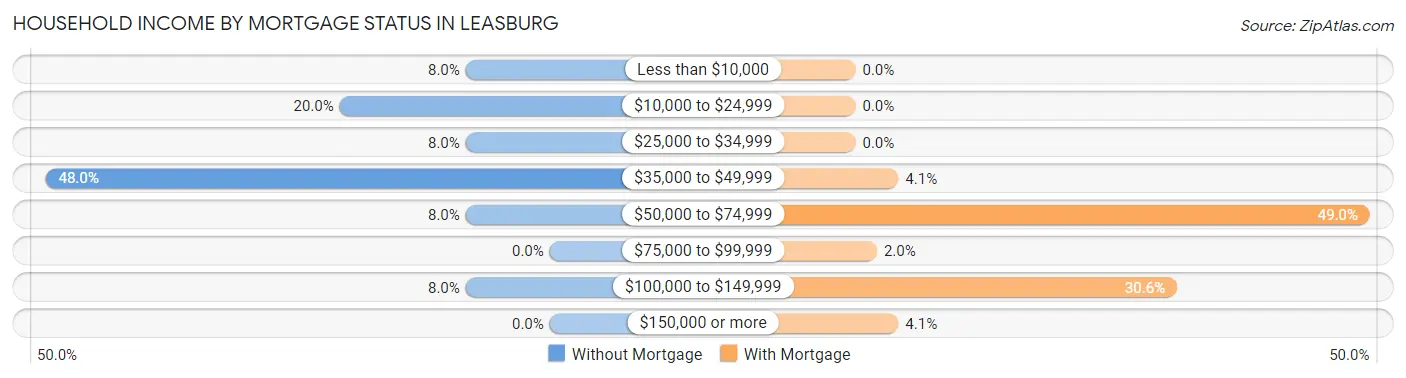
| Household Income | Without Mortgage | With Mortgage |
| Less than $10,000 | 2 (8.0%) | 0 (0.0%) |
| $10,000 to $24,999 | 5 (20.0%) | 0 (0.0%) |
| $25,000 to $34,999 | 2 (8.0%) | 0 (0.0%) |
| $35,000 to $49,999 | 12 (48.0%) | 2 (4.1%) |
| $50,000 to $74,999 | 2 (8.0%) | 24 (49.0%) |
| $75,000 to $99,999 | 0 (0.0%) | 1 (2.0%) |
| $100,000 to $149,999 | 2 (8.0%) | 15 (30.6%) |
| $150,000 or more | 0 (0.0%) | 2 (4.1%) |
| Total | 25 (100.0%) | 49 (100.0%) |
Property Value to Household Income Ratio in Leasburg
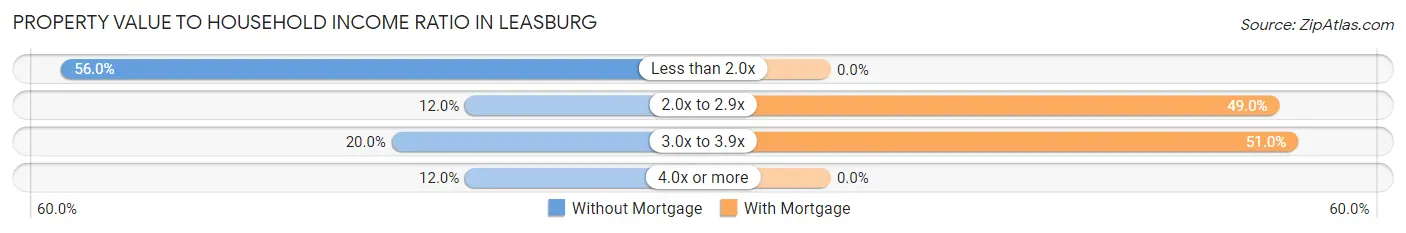
| Value-to-Income Ratio | Without Mortgage | With Mortgage |
| Less than 2.0x | 14 (56.0%) | 0 (0.0%) |
| 2.0x to 2.9x | 3 (12.0%) | 24 (49.0%) |
| 3.0x to 3.9x | 5 (20.0%) | 25 (51.0%) |
| 4.0x or more | 3 (12.0%) | 0 (0.0%) |
| Total | 25 (100.0%) | 49 (100.0%) |
Real Estate Taxes by Mortgage Status in Leasburg
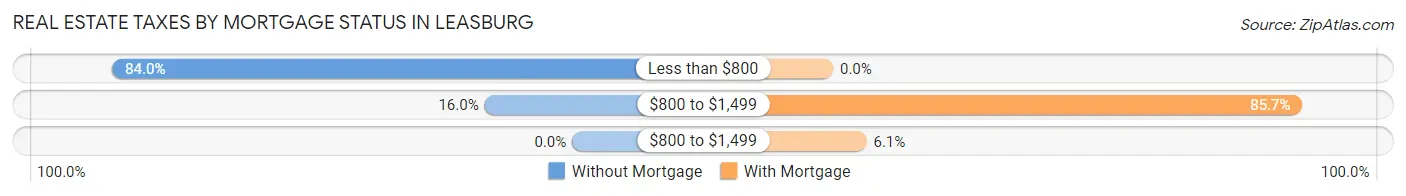
| Property Taxes | Without Mortgage | With Mortgage |
| Less than $800 | 21 (84.0%) | 0 (0.0%) |
| $800 to $1,499 | 4 (16.0%) | 42 (85.7%) |
| $800 to $1,499 | 0 (0.0%) | 3 (6.1%) |
| Total | 25 (100.0%) | 49 (100.0%) |
Health & Disability in Leasburg
Health Insurance Coverage by Age in Leasburg
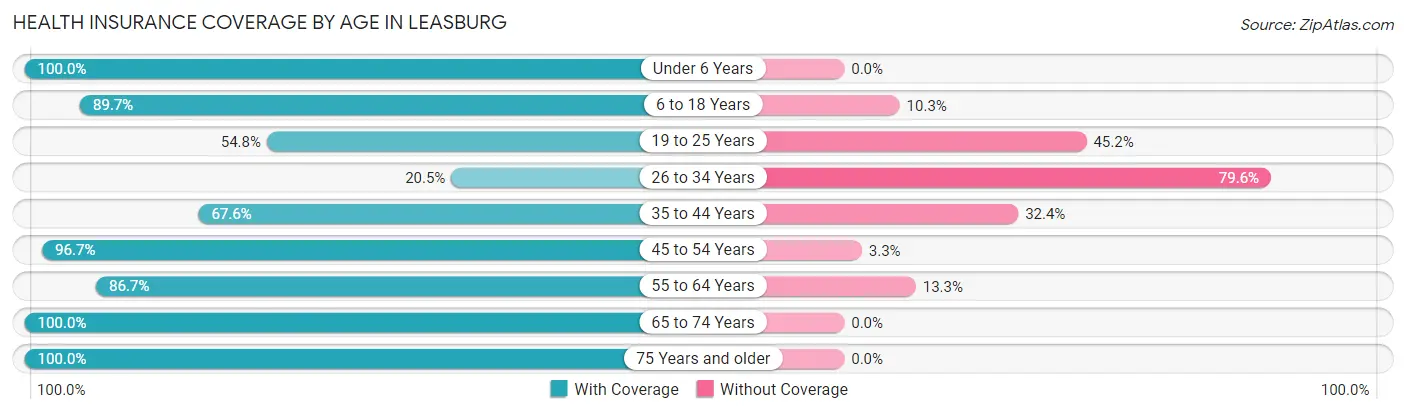
| Age Bracket | With Coverage | Without Coverage |
| Under 6 Years | 42 (100.0%) | 0 (0.0%) |
| 6 to 18 Years | 113 (89.7%) | 13 (10.3%) |
| 19 to 25 Years | 51 (54.8%) | 42 (45.2%) |
| 26 to 34 Years | 9 (20.4%) | 35 (79.5%) |
| 35 to 44 Years | 25 (67.6%) | 12 (32.4%) |
| 45 to 54 Years | 59 (96.7%) | 2 (3.3%) |
| 55 to 64 Years | 26 (86.7%) | 4 (13.3%) |
| 65 to 74 Years | 29 (100.0%) | 0 (0.0%) |
| 75 Years and older | 7 (100.0%) | 0 (0.0%) |
| Total | 361 (77.0%) | 108 (23.0%) |
Health Insurance Coverage by Citizenship Status in Leasburg
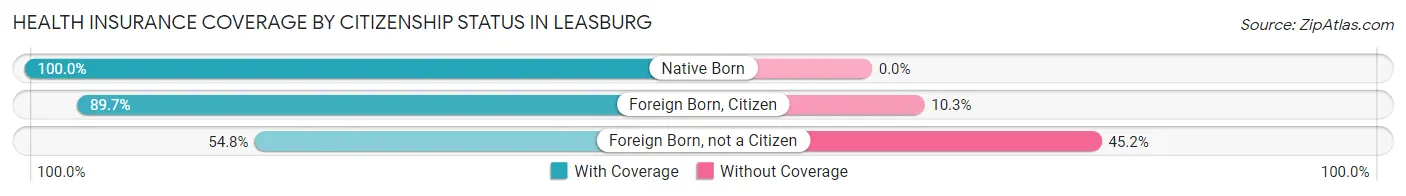
| Citizenship Status | With Coverage | Without Coverage |
| Native Born | 42 (100.0%) | 0 (0.0%) |
| Foreign Born, Citizen | 113 (89.7%) | 13 (10.3%) |
| Foreign Born, not a Citizen | 51 (54.8%) | 42 (45.2%) |
Health Insurance Coverage by Household Income in Leasburg
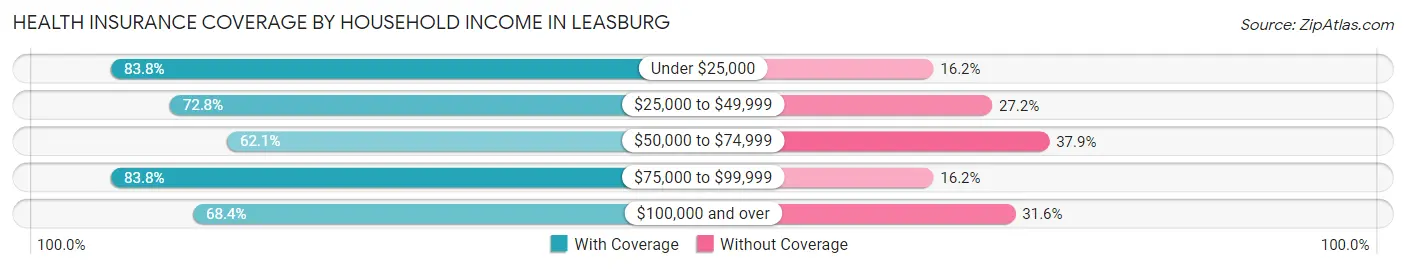
| Household Income | With Coverage | Without Coverage |
| Under $25,000 | 124 (83.8%) | 24 (16.2%) |
| $25,000 to $49,999 | 131 (72.8%) | 49 (27.2%) |
| $50,000 to $74,999 | 18 (62.1%) | 11 (37.9%) |
| $75,000 to $99,999 | 62 (83.8%) | 12 (16.2%) |
| $100,000 and over | 26 (68.4%) | 12 (31.6%) |
Public vs Private Health Insurance Coverage by Age in Leasburg
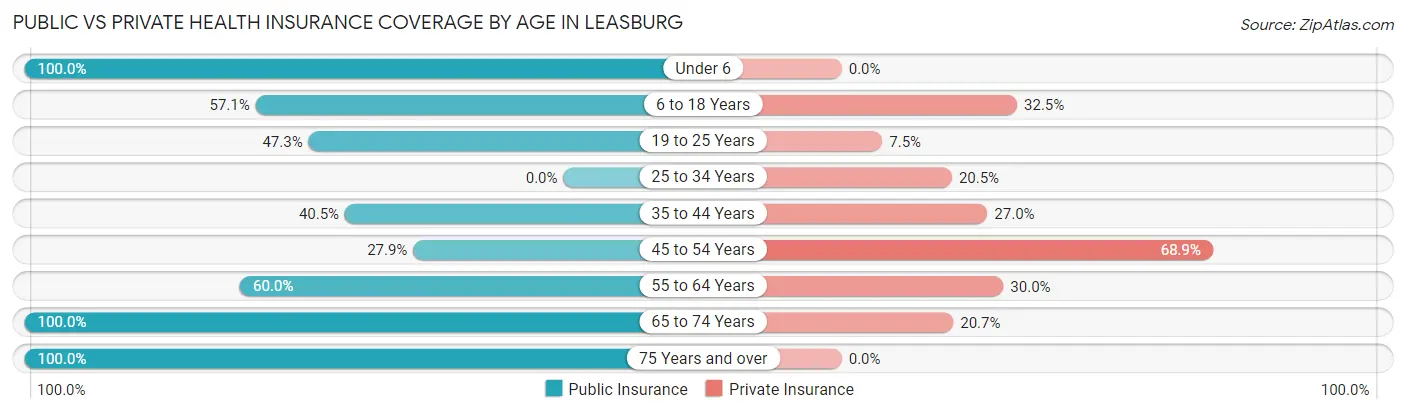
| Age Bracket | Public Insurance | Private Insurance |
| Under 6 | 42 (100.0%) | 0 (0.0%) |
| 6 to 18 Years | 72 (57.1%) | 41 (32.5%) |
| 19 to 25 Years | 44 (47.3%) | 7 (7.5%) |
| 25 to 34 Years | 0 (0.0%) | 9 (20.4%) |
| 35 to 44 Years | 15 (40.5%) | 10 (27.0%) |
| 45 to 54 Years | 17 (27.9%) | 42 (68.9%) |
| 55 to 64 Years | 18 (60.0%) | 9 (30.0%) |
| 65 to 74 Years | 29 (100.0%) | 6 (20.7%) |
| 75 Years and over | 7 (100.0%) | 0 (0.0%) |
| Total | 244 (52.0%) | 124 (26.4%) |
Disability Status by Sex by Age in Leasburg
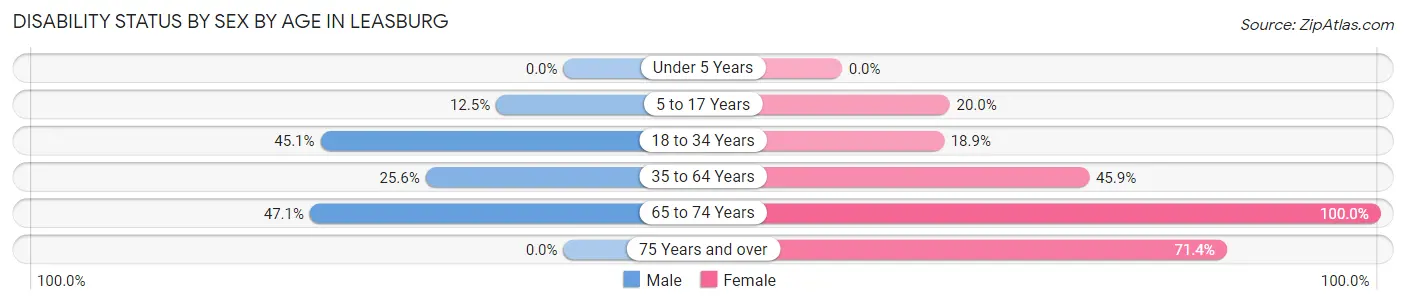
| Age Bracket | Male | Female |
| Under 5 Years | 0 (0.0%) | 0 (0.0%) |
| 5 to 17 Years | 7 (12.5%) | 9 (20.0%) |
| 18 to 34 Years | 23 (45.1%) | 21 (18.9%) |
| 35 to 64 Years | 11 (25.6%) | 39 (45.9%) |
| 65 to 74 Years | 8 (47.1%) | 12 (100.0%) |
| 75 Years and over | 0 (0.0%) | 5 (71.4%) |
Disability Class by Sex by Age in Leasburg
Disability Class: Hearing Difficulty
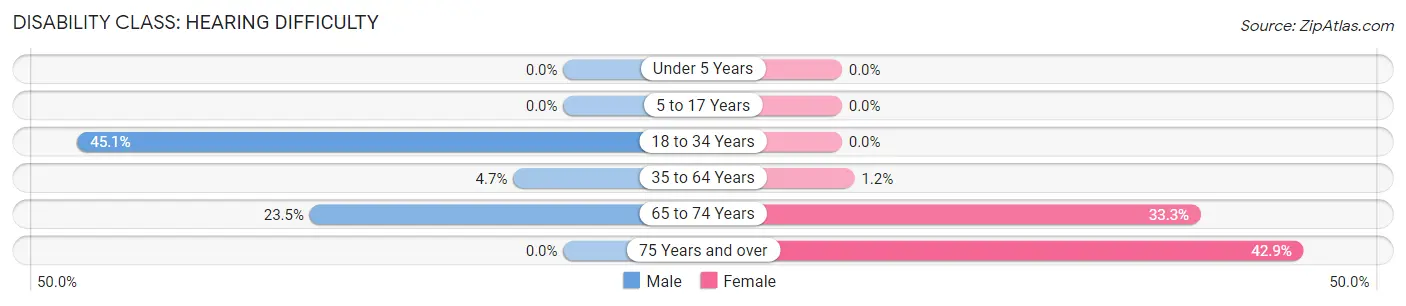
| Age Bracket | Male | Female |
| Under 5 Years | 0 (0.0%) | 0 (0.0%) |
| 5 to 17 Years | 0 (0.0%) | 0 (0.0%) |
| 18 to 34 Years | 23 (45.1%) | 0 (0.0%) |
| 35 to 64 Years | 2 (4.6%) | 1 (1.2%) |
| 65 to 74 Years | 4 (23.5%) | 4 (33.3%) |
| 75 Years and over | 0 (0.0%) | 3 (42.9%) |
Disability Class: Vision Difficulty
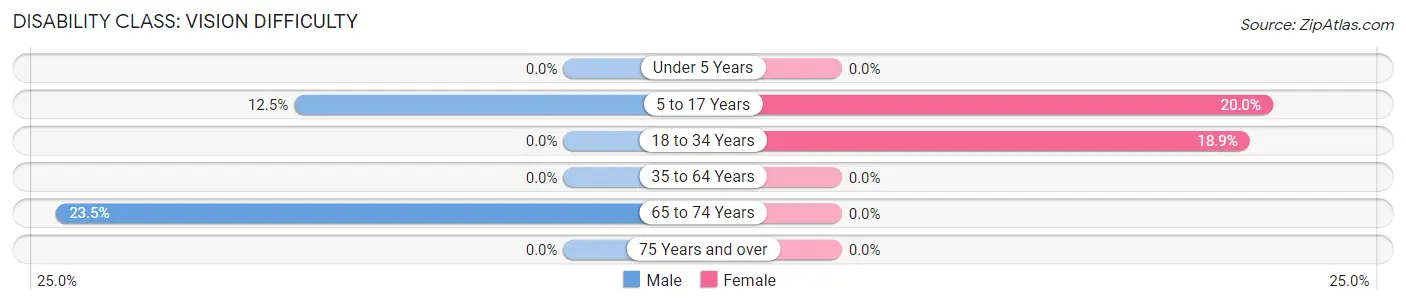
| Age Bracket | Male | Female |
| Under 5 Years | 0 (0.0%) | 0 (0.0%) |
| 5 to 17 Years | 7 (12.5%) | 9 (20.0%) |
| 18 to 34 Years | 0 (0.0%) | 21 (18.9%) |
| 35 to 64 Years | 0 (0.0%) | 0 (0.0%) |
| 65 to 74 Years | 4 (23.5%) | 0 (0.0%) |
| 75 Years and over | 0 (0.0%) | 0 (0.0%) |
Disability Class: Cognitive Difficulty
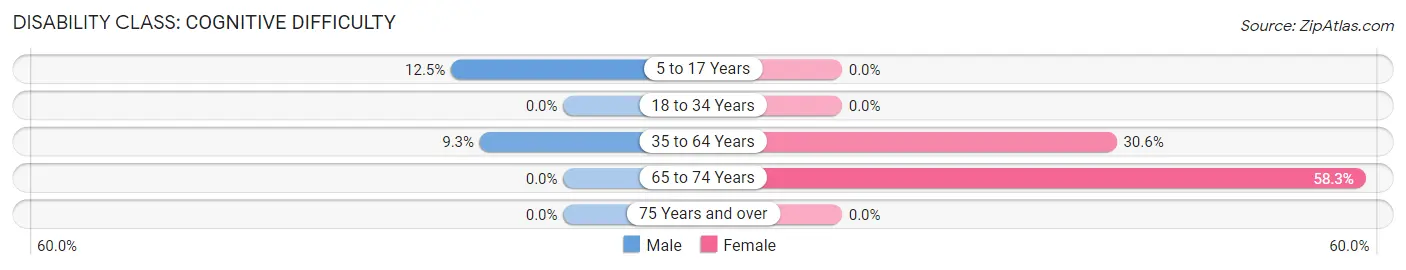
| Age Bracket | Male | Female |
| 5 to 17 Years | 7 (12.5%) | 0 (0.0%) |
| 18 to 34 Years | 0 (0.0%) | 0 (0.0%) |
| 35 to 64 Years | 4 (9.3%) | 26 (30.6%) |
| 65 to 74 Years | 0 (0.0%) | 7 (58.3%) |
| 75 Years and over | 0 (0.0%) | 0 (0.0%) |
Disability Class: Ambulatory Difficulty
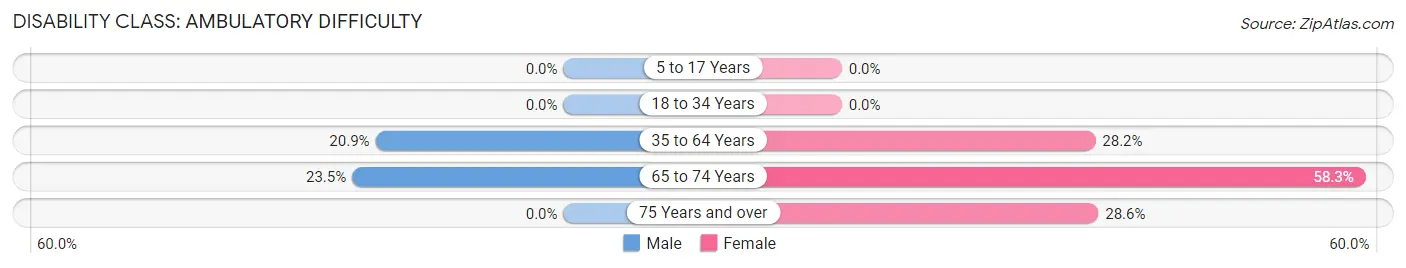
| Age Bracket | Male | Female |
| 5 to 17 Years | 0 (0.0%) | 0 (0.0%) |
| 18 to 34 Years | 0 (0.0%) | 0 (0.0%) |
| 35 to 64 Years | 9 (20.9%) | 24 (28.2%) |
| 65 to 74 Years | 4 (23.5%) | 7 (58.3%) |
| 75 Years and over | 0 (0.0%) | 2 (28.6%) |
Disability Class: Self-Care Difficulty
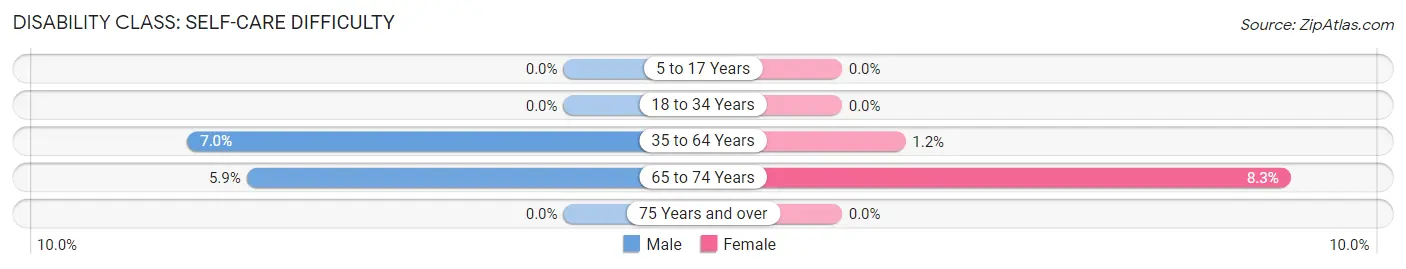
| Age Bracket | Male | Female |
| 5 to 17 Years | 0 (0.0%) | 0 (0.0%) |
| 18 to 34 Years | 0 (0.0%) | 0 (0.0%) |
| 35 to 64 Years | 3 (7.0%) | 1 (1.2%) |
| 65 to 74 Years | 1 (5.9%) | 1 (8.3%) |
| 75 Years and over | 0 (0.0%) | 0 (0.0%) |
Technology Access in Leasburg
Computing Device Access in Leasburg
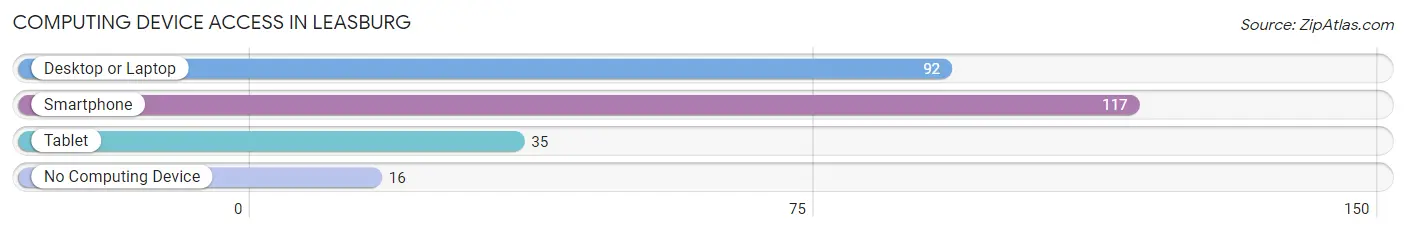
| Device Type | # Households | % Households |
| Desktop or Laptop | 92 | 64.8% |
| Smartphone | 117 | 82.4% |
| Tablet | 35 | 24.6% |
| No Computing Device | 16 | 11.3% |
| Total | 142 | 100.0% |
Internet Access in Leasburg
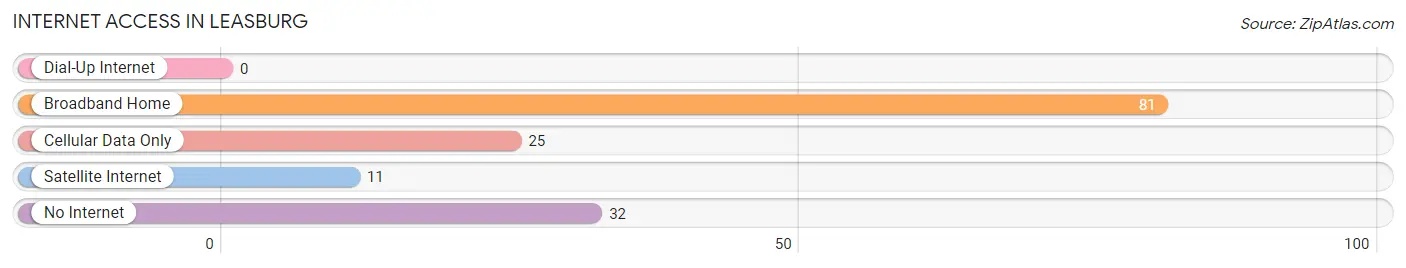
| Internet Type | # Households | % Households |
| Dial-Up Internet | 0 | 0.0% |
| Broadband Home | 81 | 57.0% |
| Cellular Data Only | 25 | 17.6% |
| Satellite Internet | 11 | 7.7% |
| No Internet | 32 | 22.5% |
| Total | 142 | 100.0% |
Leasburg Summary
Leasburg, Missouri is a small unincorporated community located in Crawford County, Missouri. It is situated on the banks of the Meramec River, approximately 10 miles south of Steelville and 25 miles west of Sullivan. The population of Leasburg was estimated to be around 200 people in 2020.
History
Leasburg was founded in 1845 by William Lea, a settler from Tennessee. He purchased the land from the government and established a trading post and ferry service on the Meramec River. The town was named after him and was incorporated in 1851.
Leasburg was a thriving community in the late 19th century, with a population of over 500 people. It had a post office, a school, a hotel, a blacksmith shop, a general store, and several other businesses. The town was also home to a large number of churches, including the Methodist Episcopal Church, the Baptist Church, and the Presbyterian Church.
In the early 20th century, the population of Leasburg began to decline as people moved away to larger cities. By the 1950s, the population had dropped to around 200 people. The town has remained relatively unchanged since then, with a few new businesses opening up in recent years.
Geography
Leasburg is located in the Ozark Mountains region of Missouri. The town is situated on the banks of the Meramec River, which is a tributary of the Mississippi River. The town is surrounded by rolling hills and forests, and is located approximately 10 miles south of Steelville and 25 miles west of Sullivan.
The climate in Leasburg is humid subtropical, with hot summers and mild winters. The average annual temperature is around 60 degrees Fahrenheit, and the average annual precipitation is around 40 inches.
Economy
Leasburg’s economy is largely based on agriculture and tourism. The town is home to several farms, which produce a variety of crops, including corn, soybeans, wheat, and hay. The town is also home to several wineries, which produce a variety of wines.
Tourism is an important part of the local economy, as the town is located near several popular attractions, including the Meramec Caverns, the Onondaga Cave State Park, and the Meramec State Park. The town is also home to several restaurants, antique shops, and other businesses that cater to tourists.
Demographics
The population of Leasburg was estimated to be around 200 people in 2020. The town is predominantly white, with a small minority population. The median household income is around $35,000, and the median home value is around $90,000.
Leasburg is served by the Crawford County School District, which includes two elementary schools, one middle school, and one high school. The town is also home to several churches, including the Methodist Episcopal Church, the Baptist Church, and the Presbyterian Church.
Leasburg is a small, rural community that has remained relatively unchanged for the past several decades. The town is home to a variety of businesses and attractions, and is a popular destination for tourists. The town is also home to a diverse population, with a mix of races and cultures.
Common Questions
What is Per Capita Income in Leasburg?
Per Capita income in Leasburg is $16,000.
What is the Median Family Income in Leasburg?
Median Family Income in Leasburg is $43,550.
What is the Median Household income in Leasburg?
Median Household Income in Leasburg is $40,313.
What is Inequality or Gini Index in Leasburg?
Inequality or Gini Index in Leasburg is 0.50.
What is the Total Population of Leasburg?
Total Population of Leasburg is 469.
What is the Total Male Population of Leasburg?
Total Male Population of Leasburg is 188.
What is the Total Female Population of Leasburg?
Total Female Population of Leasburg is 281.
What is the Ratio of Males per 100 Females in Leasburg?
There are 66.90 Males per 100 Females in Leasburg.
What is the Ratio of Females per 100 Males in Leasburg?
There are 149.47 Females per 100 Males in Leasburg.
What is the Median Population Age in Leasburg?
Median Population Age in Leasburg is 24.6 Years.
What is the Average Family Size in Leasburg
Average Family Size in Leasburg is 4.1 People.
What is the Average Household Size in Leasburg
Average Household Size in Leasburg is 3.3 People.
How Large is the Labor Force in Leasburg?
There are 213 People in the Labor Forcein in Leasburg.
What is the Percentage of People in the Labor Force in Leasburg?
62.8% of People are in the Labor Force in Leasburg.
What is the Unemployment Rate in Leasburg?
Unemployment Rate in Leasburg is 25.4%.