El Dorado Springs, MO Map & Demographics
El Dorado Springs Map
El Dorado Springs Overview
$20,209
PER CAPITA INCOME
$49,904
AVG FAMILY INCOME
$33,173
AVG HOUSEHOLD INCOME
5.4%
WAGE / INCOME GAP [ % ]
94.6¢/ $1
WAGE / INCOME GAP [ $ ]
0.42
INEQUALITY / GINI INDEX
3,531
TOTAL POPULATION
1,693
MALE POPULATION
1,838
FEMALE POPULATION
92.11
MALES / 100 FEMALES
108.56
FEMALES / 100 MALES
40.8
MEDIAN AGE
3.1
AVG FAMILY SIZE
2.3
AVG HOUSEHOLD SIZE
1,498
LABOR FORCE [ PEOPLE ]
52.0%
PERCENT IN LABOR FORCE
3.7%
UNEMPLOYMENT RATE
El Dorado Springs Zip Codes
El Dorado Springs Area Codes
Income in El Dorado Springs
Income Overview in El Dorado Springs
Per Capita Income in El Dorado Springs is $20,209, while median incomes of families and households are $49,904 and $33,173 respectively.
| Characteristic | Number | Measure |
| Per Capita Income | 3,531 | $20,209 |
| Median Family Income | 743 | $49,904 |
| Mean Family Income | 743 | $60,766 |
| Median Household Income | 1,488 | $33,173 |
| Mean Household Income | 1,488 | $45,303 |
| Income Deficit | 743 | $0 |
| Wage / Income Gap (%) | 3,531 | 5.40% |
| Wage / Income Gap ($) | 3,531 | 94.60¢ per $1 |
| Gini / Inequality Index | 3,531 | 0.42 |
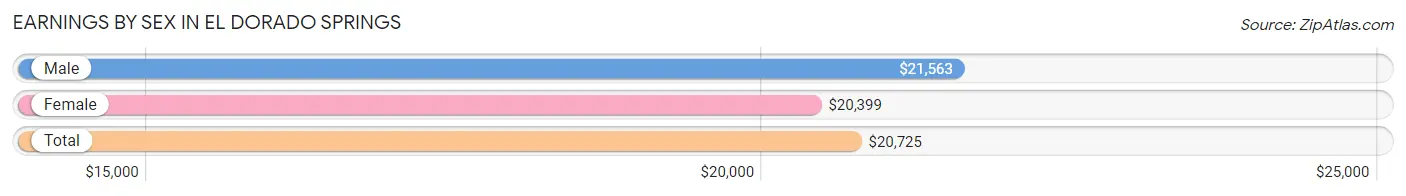
Earnings by Sex in El Dorado Springs
Average Earnings in El Dorado Springs are $20,725, $21,563 for men and $20,399 for women, a difference of 5.4%.
| Sex | Number | Average Earnings |
| Male | 807 (46.8%) | $21,563 |
| Female | 919 (53.2%) | $20,399 |
| Total | 1,726 (100.0%) | $20,725 |
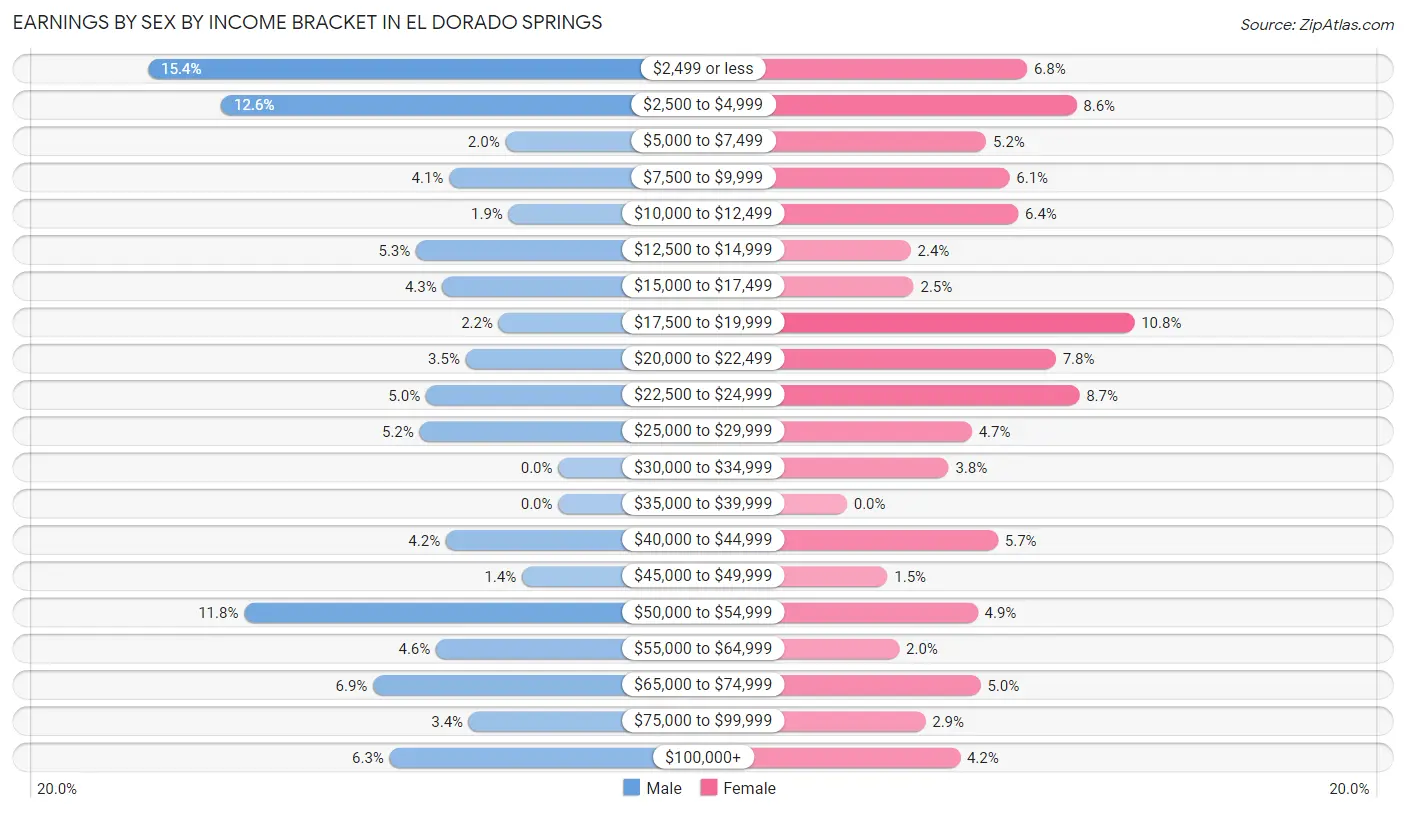
Earnings by Sex by Income Bracket in El Dorado Springs
The most common earnings brackets in El Dorado Springs are $2,499 or less for men (124 | 15.4%) and $17,500 to $19,999 for women (99 | 10.8%).
| Income | Male | Female |
| $2,499 or less | 124 (15.4%) | 62 (6.8%) |
| $2,500 to $4,999 | 102 (12.6%) | 79 (8.6%) |
| $5,000 to $7,499 | 16 (2.0%) | 48 (5.2%) |
| $7,500 to $9,999 | 33 (4.1%) | 56 (6.1%) |
| $10,000 to $12,499 | 15 (1.9%) | 59 (6.4%) |
| $12,500 to $14,999 | 43 (5.3%) | 22 (2.4%) |
| $15,000 to $17,499 | 35 (4.3%) | 23 (2.5%) |
| $17,500 to $19,999 | 18 (2.2%) | 99 (10.8%) |
| $20,000 to $22,499 | 28 (3.5%) | 72 (7.8%) |
| $22,500 to $24,999 | 40 (5.0%) | 80 (8.7%) |
| $25,000 to $29,999 | 42 (5.2%) | 43 (4.7%) |
| $30,000 to $34,999 | 0 (0.0%) | 35 (3.8%) |
| $35,000 to $39,999 | 0 (0.0%) | 0 (0.0%) |
| $40,000 to $44,999 | 34 (4.2%) | 52 (5.7%) |
| $45,000 to $49,999 | 11 (1.4%) | 14 (1.5%) |
| $50,000 to $54,999 | 95 (11.8%) | 45 (4.9%) |
| $55,000 to $64,999 | 37 (4.6%) | 18 (2.0%) |
| $65,000 to $74,999 | 56 (6.9%) | 46 (5.0%) |
| $75,000 to $99,999 | 27 (3.4%) | 27 (2.9%) |
| $100,000+ | 51 (6.3%) | 39 (4.2%) |
| Total | 807 (100.0%) | 919 (100.0%) |
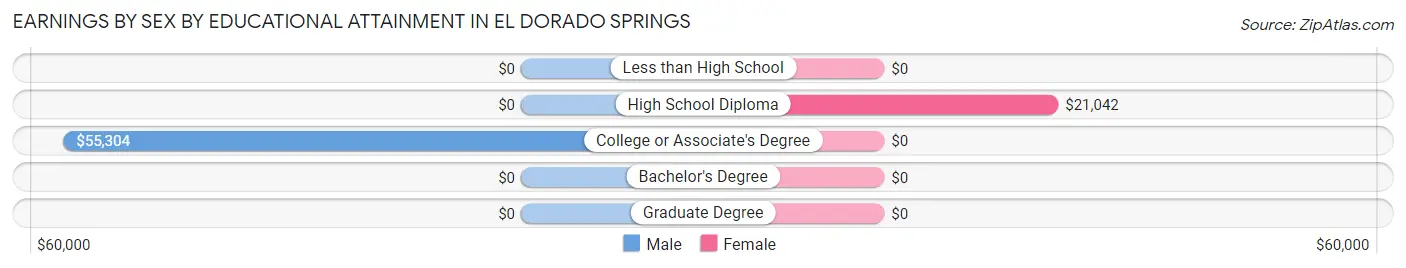
Earnings by Sex by Educational Attainment in El Dorado Springs
Average earnings in El Dorado Springs are $24,219 for men and $21,198 for women, a difference of 12.5%. Men with an educational attainment of college or associate's degree enjoy the highest average annual earnings of $55,304, while those with college or associate's degree education earn the least with $55,304. Women with an educational attainment of high school diploma earn the most with the average annual earnings of $21,042, while those with high school diploma education have the smallest earnings of $21,042.
| Educational Attainment | Male Income | Female Income |
| Less than High School | - | - |
| High School Diploma | - | - |
| College or Associate's Degree | $55,304 | $0 |
| Bachelor's Degree | - | - |
| Graduate Degree | - | - |
| Total | $24,219 | $21,198 |
Family Income in El Dorado Springs
Family Income Brackets in El Dorado Springs
According to the El Dorado Springs family income data, there are 146 families falling into the $75,000 to $99,999 income range, which is the most common income bracket and makes up 19.7% of all families.
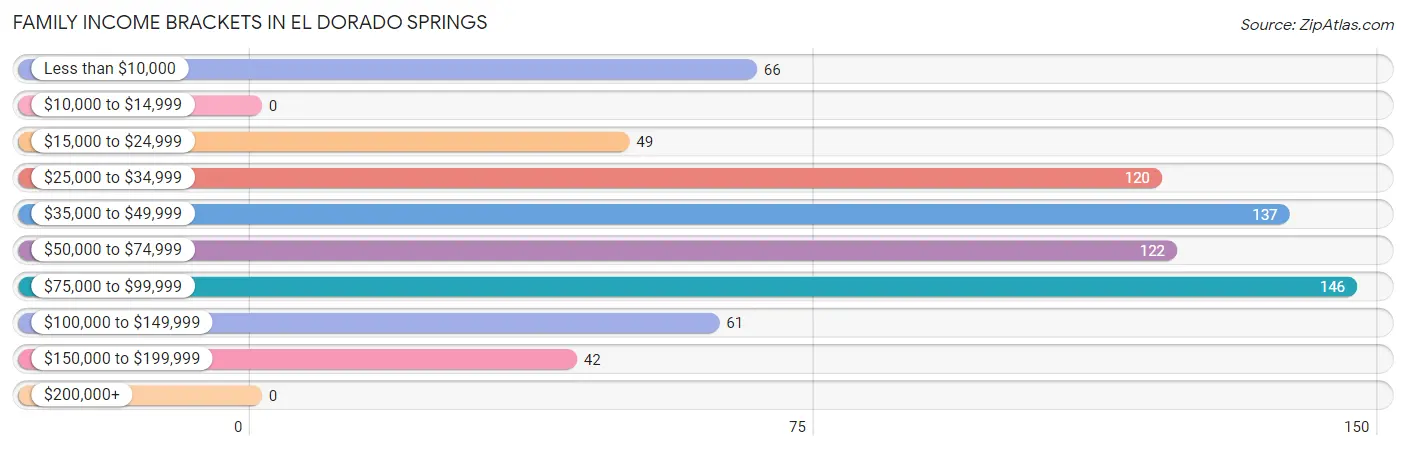
| Income Bracket | # Families | % Families |
| Less than $10,000 | 66 | 8.9% |
| $10,000 to $14,999 | 0 | 0.0% |
| $15,000 to $24,999 | 49 | 6.6% |
| $25,000 to $34,999 | 120 | 16.2% |
| $35,000 to $49,999 | 137 | 18.4% |
| $50,000 to $74,999 | 122 | 16.4% |
| $75,000 to $99,999 | 146 | 19.7% |
| $100,000 to $149,999 | 61 | 8.2% |
| $150,000 to $199,999 | 42 | 5.7% |
| $200,000+ | 0 | 0.0% |
Family Income by Famaliy Size in El Dorado Springs
5-person families (122 | 16.4%) account for the highest median family income in El Dorado Springs with $83,396 per family, while 2-person families (360 | 48.4%) have the highest median income of $28,125 per family member.
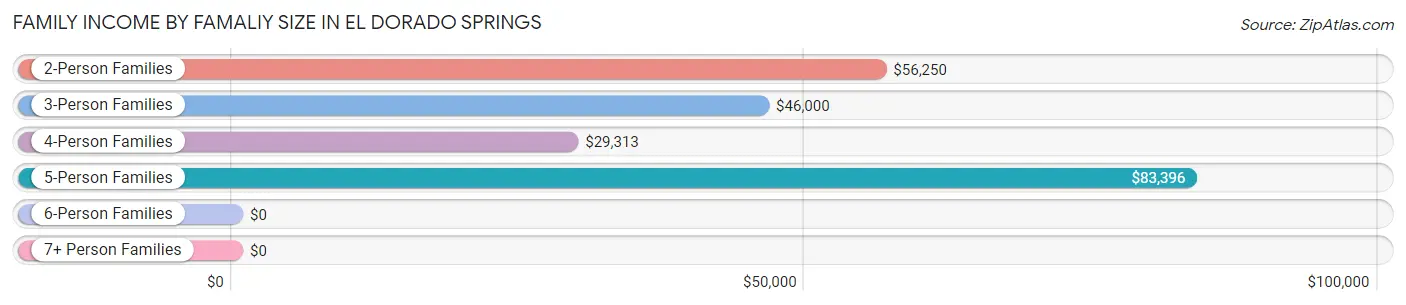
| Income Bracket | # Families | Median Income |
| 2-Person Families | 360 (48.4%) | $56,250 |
| 3-Person Families | 134 (18.0%) | $46,000 |
| 4-Person Families | 127 (17.1%) | $29,313 |
| 5-Person Families | 122 (16.4%) | $83,396 |
| 6-Person Families | 0 (0.0%) | $0 |
| 7+ Person Families | 0 (0.0%) | $0 |
| Total | 743 (100.0%) | $49,904 |
Family Income by Number of Earners in El Dorado Springs
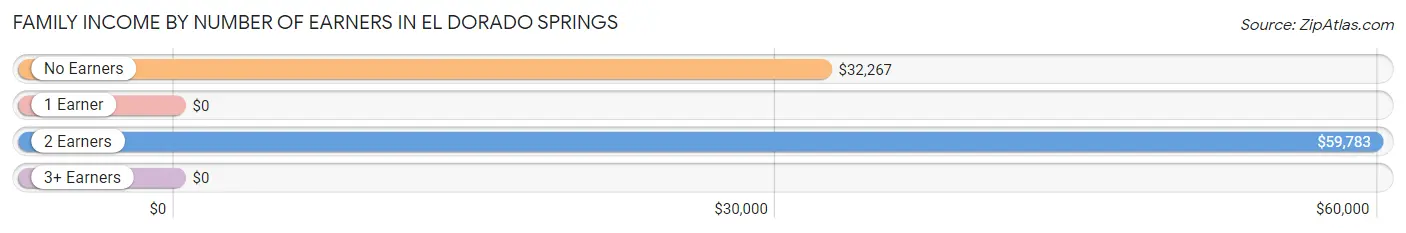
| Number of Earners | # Families | Median Income |
| No Earners | 140 (18.8%) | $32,267 |
| 1 Earner | 133 (17.9%) | $0 |
| 2 Earners | 470 (63.3%) | $59,783 |
| 3+ Earners | 0 (0.0%) | $0 |
| Total | 743 (100.0%) | $49,904 |
Household Income in El Dorado Springs
Household Income Brackets in El Dorado Springs
With 272 households falling in the category, the $15,000 to $24,999 income range is the most frequent in El Dorado Springs, accounting for 18.3% of all households.
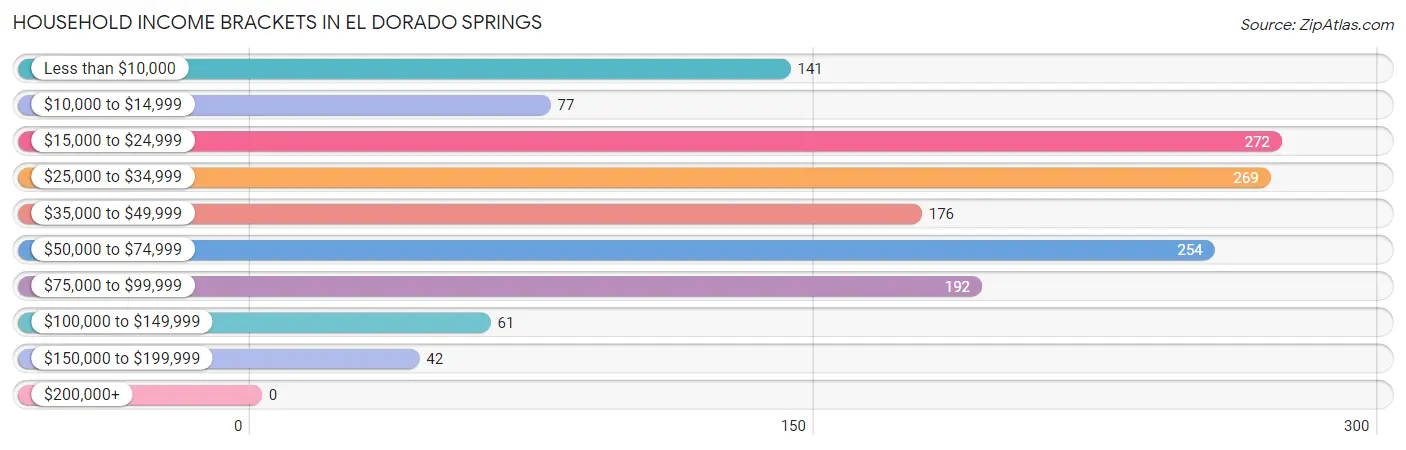
| Income Bracket | # Households | % Households |
| Less than $10,000 | 141 | 9.5% |
| $10,000 to $14,999 | 77 | 5.2% |
| $15,000 to $24,999 | 272 | 18.3% |
| $25,000 to $34,999 | 269 | 18.1% |
| $35,000 to $49,999 | 176 | 11.8% |
| $50,000 to $74,999 | 254 | 17.1% |
| $75,000 to $99,999 | 192 | 12.9% |
| $100,000 to $149,999 | 61 | 4.1% |
| $150,000 to $199,999 | 42 | 2.8% |
| $200,000+ | 0 | 0.0% |
Household Income by Householder Age in El Dorado Springs
The median household income in El Dorado Springs is $33,173, with the highest median household income of $35,919 found in the 65+ years age bracket for the primary householder. A total of 507 households (34.1%) fall into this category. Meanwhile, the 15 to 24 years age bracket for the primary householder has the lowest median household income of $0, with 70 households (4.7%) in this group.
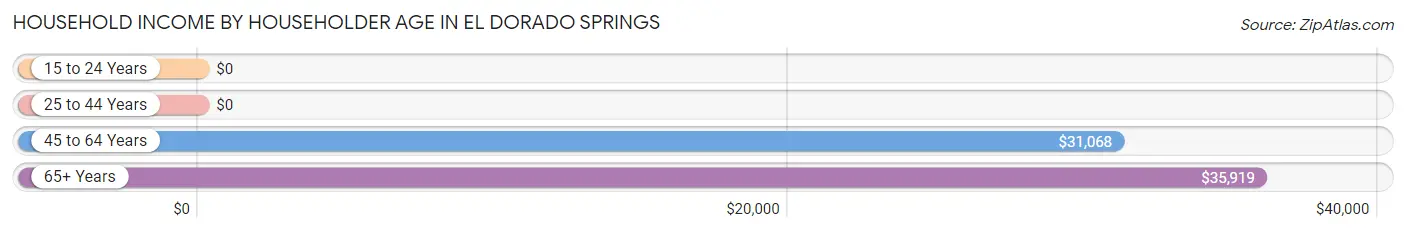
| Income Bracket | # Households | Median Income |
| 15 to 24 Years | 70 (4.7%) | $0 |
| 25 to 44 Years | 414 (27.8%) | $0 |
| 45 to 64 Years | 497 (33.4%) | $31,068 |
| 65+ Years | 507 (34.1%) | $35,919 |
| Total | 1,488 (100.0%) | $33,173 |
Poverty in El Dorado Springs
Income Below Poverty by Sex and Age in El Dorado Springs
With 34.6% poverty level for males and 27.9% for females among the residents of El Dorado Springs, 16 and 17 year old males and under 5 year old females are the most vulnerable to poverty, with 60 males (100.0%) and 41 females (64.1%) in their respective age groups living below the poverty level.
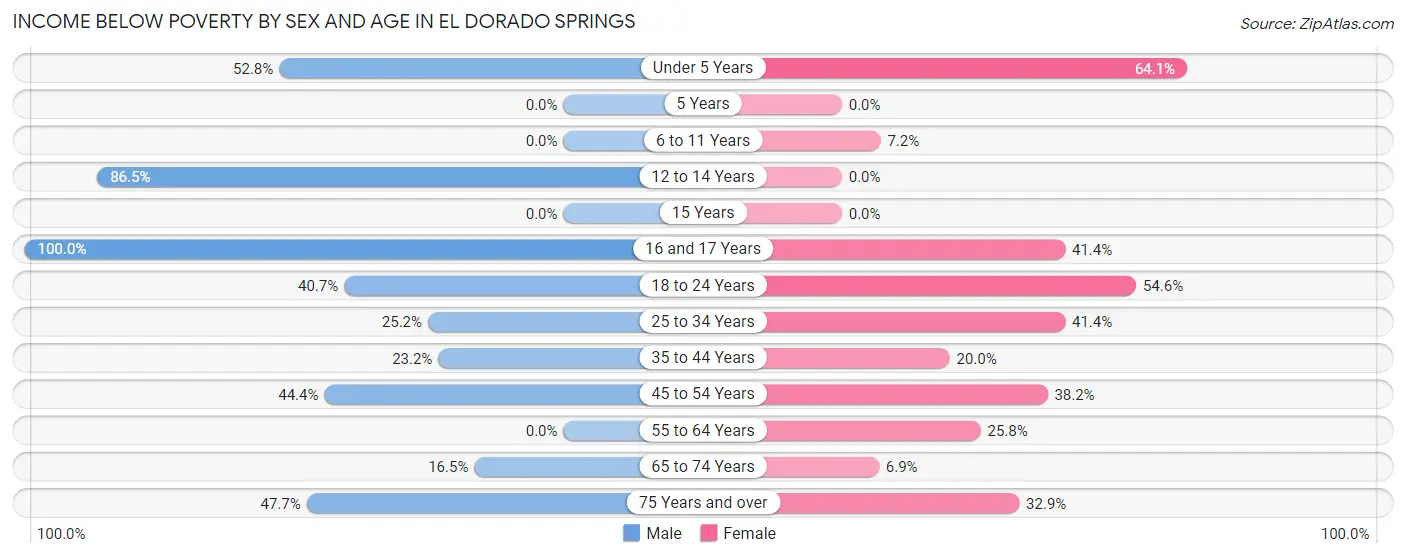
| Age Bracket | Male | Female |
| Under 5 Years | 86 (52.8%) | 41 (64.1%) |
| 5 Years | 0 (0.0%) | 0 (0.0%) |
| 6 to 11 Years | 0 (0.0%) | 13 (7.2%) |
| 12 to 14 Years | 77 (86.5%) | 0 (0.0%) |
| 15 Years | 0 (0.0%) | 0 (0.0%) |
| 16 and 17 Years | 60 (100.0%) | 29 (41.4%) |
| 18 to 24 Years | 70 (40.7%) | 83 (54.6%) |
| 25 to 34 Years | 41 (25.2%) | 75 (41.4%) |
| 35 to 44 Years | 46 (23.2%) | 52 (20.0%) |
| 45 to 54 Years | 79 (44.4%) | 71 (38.2%) |
| 55 to 64 Years | 0 (0.0%) | 60 (25.8%) |
| 65 to 74 Years | 44 (16.5%) | 15 (6.9%) |
| 75 Years and over | 61 (47.7%) | 53 (32.9%) |
| Total | 564 (34.6%) | 492 (27.9%) |
Income Above Poverty by Sex and Age in El Dorado Springs
According to the poverty statistics in El Dorado Springs, males aged 5 years and females aged 5 years are the age groups that are most secure financially, with 100.0% of males and 100.0% of females in these age groups living above the poverty line.
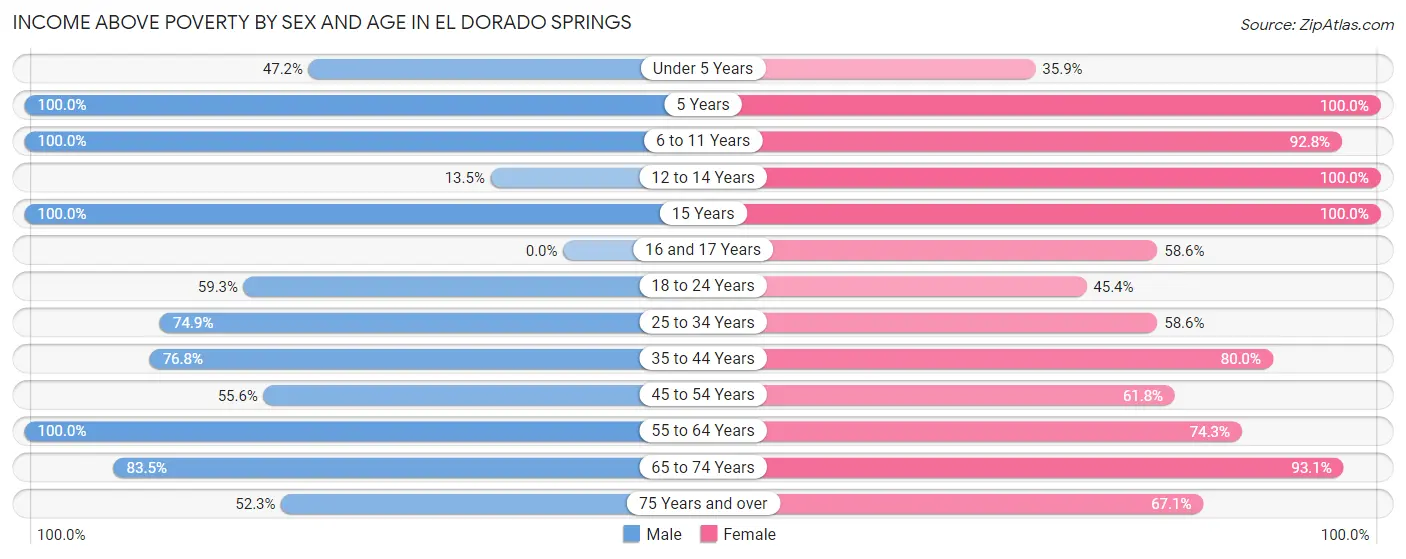
| Age Bracket | Male | Female |
| Under 5 Years | 77 (47.2%) | 23 (35.9%) |
| 5 Years | 33 (100.0%) | 12 (100.0%) |
| 6 to 11 Years | 28 (100.0%) | 168 (92.8%) |
| 12 to 14 Years | 12 (13.5%) | 23 (100.0%) |
| 15 Years | 33 (100.0%) | 24 (100.0%) |
| 16 and 17 Years | 0 (0.0%) | 41 (58.6%) |
| 18 to 24 Years | 102 (59.3%) | 69 (45.4%) |
| 25 to 34 Years | 122 (74.9%) | 106 (58.6%) |
| 35 to 44 Years | 152 (76.8%) | 208 (80.0%) |
| 45 to 54 Years | 99 (55.6%) | 115 (61.8%) |
| 55 to 64 Years | 118 (100.0%) | 173 (74.3%) |
| 65 to 74 Years | 222 (83.5%) | 203 (93.1%) |
| 75 Years and over | 67 (52.3%) | 108 (67.1%) |
| Total | 1,065 (65.4%) | 1,273 (72.1%) |
Income Below Poverty Among Married-Couple Families in El Dorado Springs
The poverty statistics for married-couple families in El Dorado Springs show that 5.7% or 33 of the total 575 families live below the poverty line. Families with 1 or 2 children have the highest poverty rate of 27.1%, comprising of 33 families. On the other hand, families with no children have the lowest poverty rate of 0.0%, which includes 0 families.
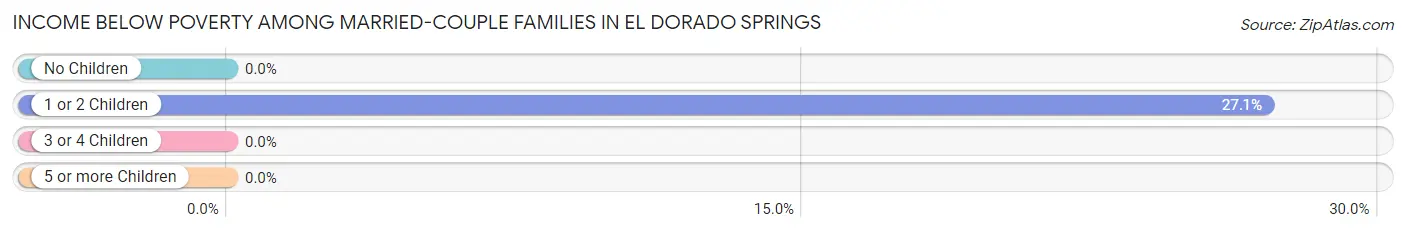
| Children | Above Poverty | Below Poverty |
| No Children | 353 (100.0%) | 0 (0.0%) |
| 1 or 2 Children | 89 (73.0%) | 33 (27.1%) |
| 3 or 4 Children | 100 (100.0%) | 0 (0.0%) |
| 5 or more Children | 0 (0.0%) | 0 (0.0%) |
| Total | 542 (94.3%) | 33 (5.7%) |
Income Below Poverty Among Single-Parent Households in El Dorado Springs
According to the poverty data in El Dorado Springs, 100.0% or 20 single-father households and 55.4% or 82 single-mother households are living below the poverty line. Among single-father households, those with 1 or 2 children have the highest poverty rate, with 20 households (100.0%) experiencing poverty. Likewise, among single-mother households, those with no children have the highest poverty rate, with 14 households (100.0%) falling below the poverty line.
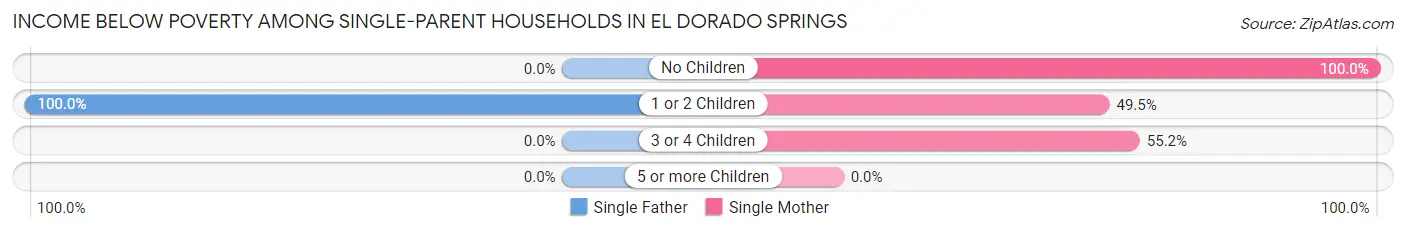
| Children | Single Father | Single Mother |
| No Children | 0 (0.0%) | 14 (100.0%) |
| 1 or 2 Children | 20 (100.0%) | 52 (49.5%) |
| 3 or 4 Children | 0 (0.0%) | 16 (55.2%) |
| 5 or more Children | 0 (0.0%) | 0 (0.0%) |
| Total | 20 (100.0%) | 82 (55.4%) |
Income Below Poverty Among Married-Couple vs Single-Parent Households in El Dorado Springs
The poverty data for El Dorado Springs shows that 33 of the married-couple family households (5.7%) and 102 of the single-parent households (60.7%) are living below the poverty level. Within the married-couple family households, those with 1 or 2 children have the highest poverty rate, with 33 households (27.1%) falling below the poverty line. Among the single-parent households, those with no children have the highest poverty rate, with 14 household (100.0%) living below poverty.
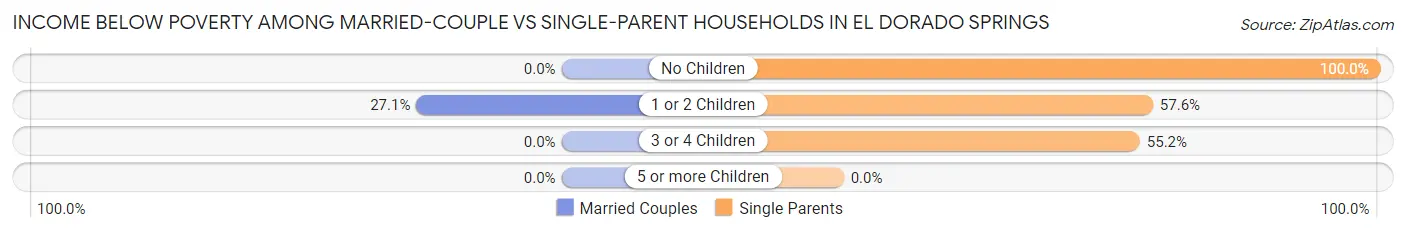
| Children | Married-Couple Families | Single-Parent Households |
| No Children | 0 (0.0%) | 14 (100.0%) |
| 1 or 2 Children | 33 (27.1%) | 72 (57.6%) |
| 3 or 4 Children | 0 (0.0%) | 16 (55.2%) |
| 5 or more Children | 0 (0.0%) | 0 (0.0%) |
| Total | 33 (5.7%) | 102 (60.7%) |
Race in El Dorado Springs
The most populous races in El Dorado Springs are White / Caucasian (3,314 | 93.9%), Two or more Races (172 | 4.9%), and Hispanic or Latino (34 | 1.0%).
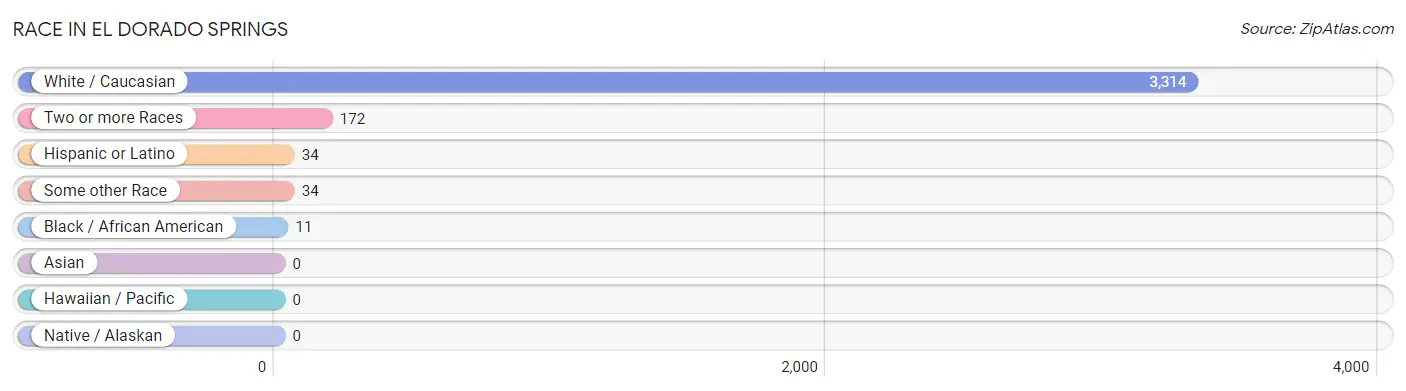
| Race | # Population | % Population |
| Asian | 0 | 0.0% |
| Black / African American | 11 | 0.3% |
| Hawaiian / Pacific | 0 | 0.0% |
| Hispanic or Latino | 34 | 1.0% |
| Native / Alaskan | 0 | 0.0% |
| White / Caucasian | 3,314 | 93.9% |
| Two or more Races | 172 | 4.9% |
| Some other Race | 34 | 1.0% |
| Total | 3,531 | 100.0% |
Ancestry in El Dorado Springs
The most populous ancestries reported in El Dorado Springs are American (565 | 16.0%), English (538 | 15.2%), Irish (507 | 14.4%), German (411 | 11.6%), and Italian (64 | 1.8%), together accounting for 59.1% of all El Dorado Springs residents.
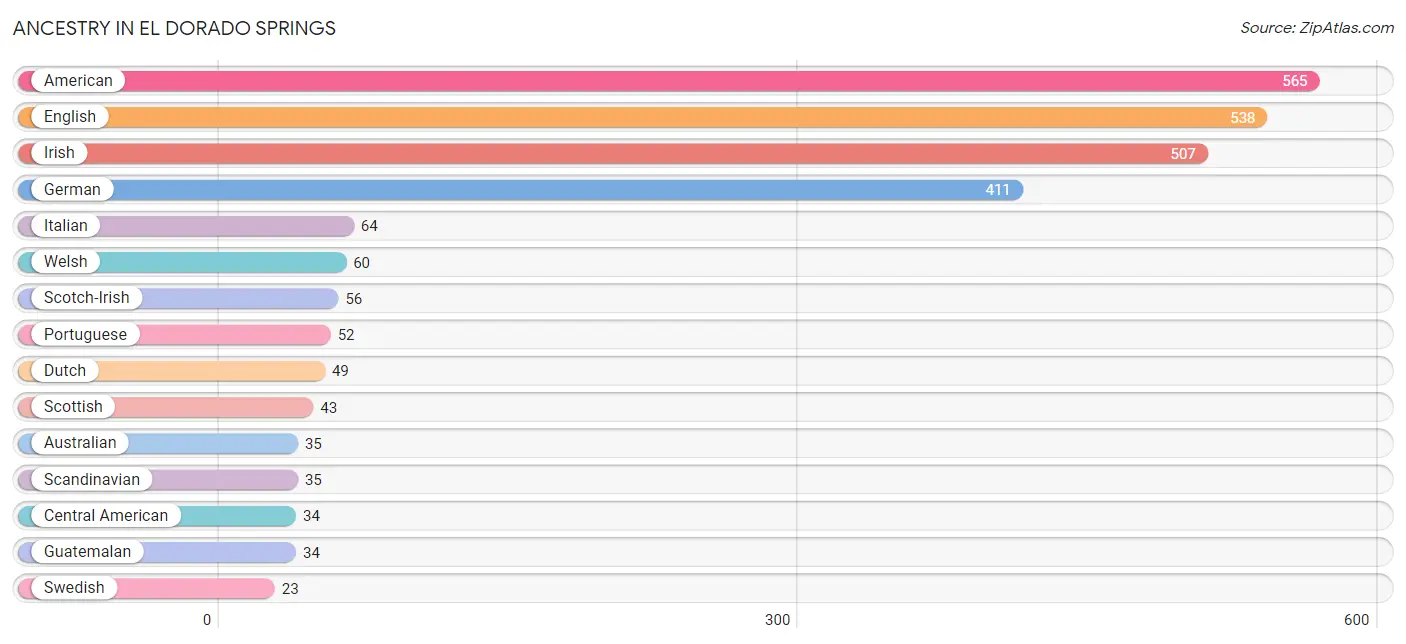
| Ancestry | # Population | % Population |
| American | 565 | 16.0% |
| Australian | 35 | 1.0% |
| Central American | 34 | 1.0% |
| Dutch | 49 | 1.4% |
| English | 538 | 15.2% |
| French | 11 | 0.3% |
| German | 411 | 11.6% |
| Guatemalan | 34 | 1.0% |
| Irish | 507 | 14.4% |
| Italian | 64 | 1.8% |
| Portuguese | 52 | 1.5% |
| Scandinavian | 35 | 1.0% |
| Scotch-Irish | 56 | 1.6% |
| Scottish | 43 | 1.2% |
| Swedish | 23 | 0.6% |
| Welsh | 60 | 1.7% | View All 16 Rows |
Immigrants in El Dorado Springs
The most numerous immigrant groups reported in El Dorado Springs came from Central America (34 | 1.0%), Guatemala (34 | 1.0%), Latin America (34 | 1.0%), Europe (15 | 0.4%), and Germany (14 | 0.4%), together accounting for 3.7% of all El Dorado Springs residents.
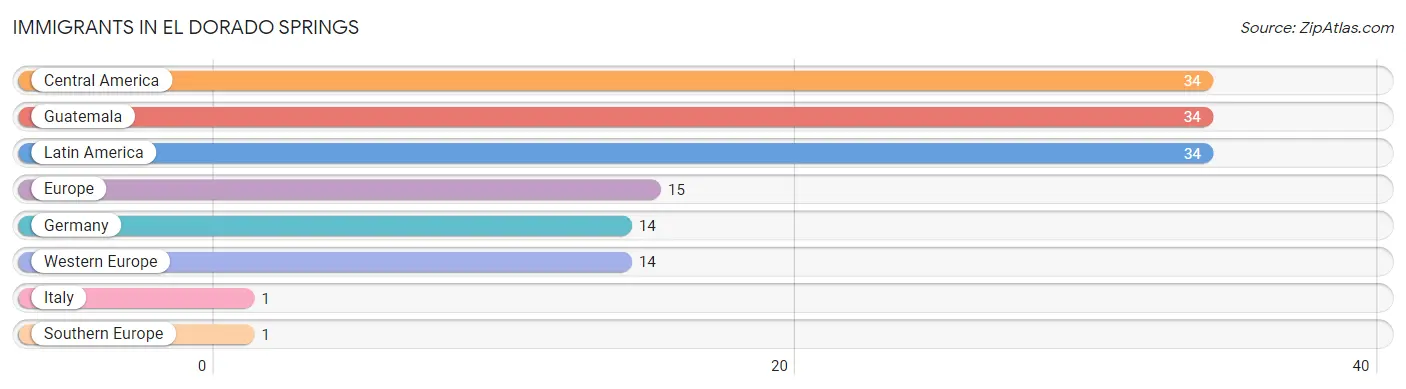
| Immigration Origin | # Population | % Population |
| Central America | 34 | 1.0% |
| Europe | 15 | 0.4% |
| Germany | 14 | 0.4% |
| Guatemala | 34 | 1.0% |
| Italy | 1 | 0.0% |
| Latin America | 34 | 1.0% |
| Southern Europe | 1 | 0.0% |
| Western Europe | 14 | 0.4% | View All 8 Rows |
Sex and Age in El Dorado Springs
Sex and Age in El Dorado Springs
The most populous age groups in El Dorado Springs are 50 to 54 Years (178 | 10.5%) for men and 5 to 9 Years (170 | 9.2%) for women.
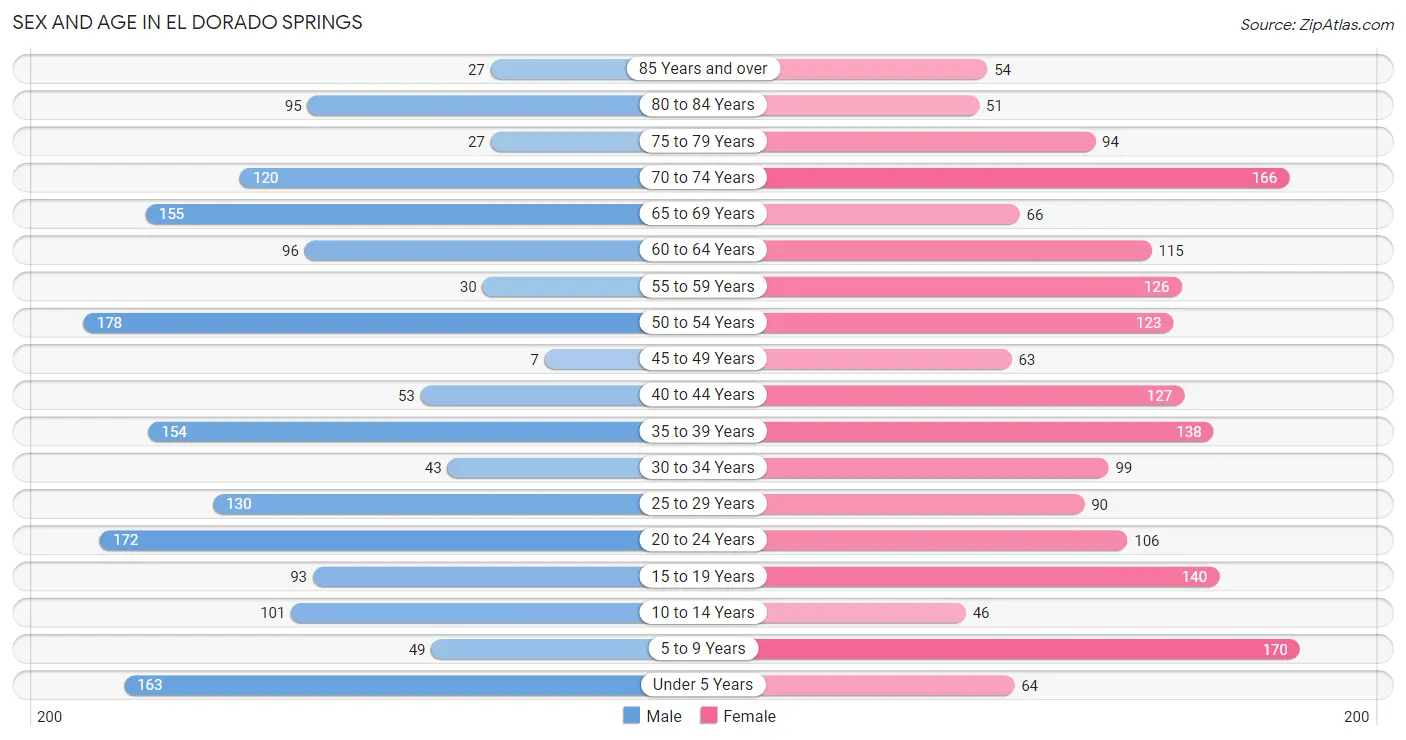
| Age Bracket | Male | Female |
| Under 5 Years | 163 (9.6%) | 64 (3.5%) |
| 5 to 9 Years | 49 (2.9%) | 170 (9.2%) |
| 10 to 14 Years | 101 (6.0%) | 46 (2.5%) |
| 15 to 19 Years | 93 (5.5%) | 140 (7.6%) |
| 20 to 24 Years | 172 (10.2%) | 106 (5.8%) |
| 25 to 29 Years | 130 (7.7%) | 90 (4.9%) |
| 30 to 34 Years | 43 (2.5%) | 99 (5.4%) |
| 35 to 39 Years | 154 (9.1%) | 138 (7.5%) |
| 40 to 44 Years | 53 (3.1%) | 127 (6.9%) |
| 45 to 49 Years | 7 (0.4%) | 63 (3.4%) |
| 50 to 54 Years | 178 (10.5%) | 123 (6.7%) |
| 55 to 59 Years | 30 (1.8%) | 126 (6.9%) |
| 60 to 64 Years | 96 (5.7%) | 115 (6.3%) |
| 65 to 69 Years | 155 (9.2%) | 66 (3.6%) |
| 70 to 74 Years | 120 (7.1%) | 166 (9.0%) |
| 75 to 79 Years | 27 (1.6%) | 94 (5.1%) |
| 80 to 84 Years | 95 (5.6%) | 51 (2.8%) |
| 85 Years and over | 27 (1.6%) | 54 (2.9%) |
| Total | 1,693 (100.0%) | 1,838 (100.0%) |
Families and Households in El Dorado Springs
Median Family Size in El Dorado Springs
The median family size in El Dorado Springs is 3.09 persons per family, with single male/father families (20 | 2.7%) accounting for the largest median family size of 6.05 persons per family. On the other hand, married-couple families (575 | 77.4%) represent the smallest median family size with 2.89 persons per family.
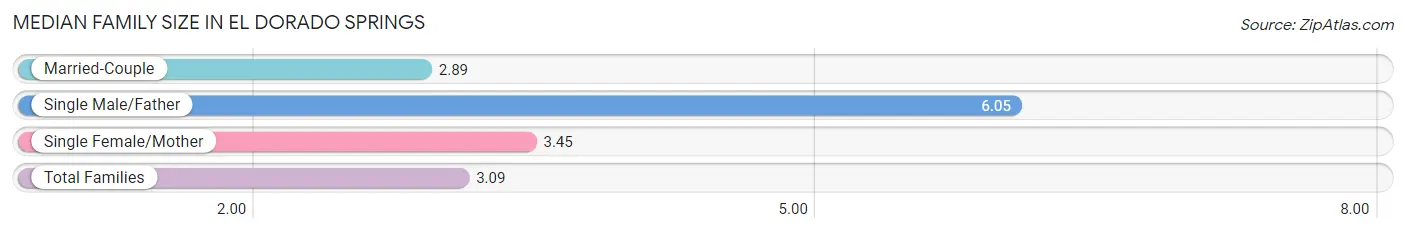
| Family Type | # Families | Family Size |
| Married-Couple | 575 (77.4%) | 2.89 |
| Single Male/Father | 20 (2.7%) | 6.05 |
| Single Female/Mother | 148 (19.9%) | 3.45 |
| Total Families | 743 (100.0%) | 3.09 |
Median Household Size in El Dorado Springs
The median household size in El Dorado Springs is 2.28 persons per household, with single male/father households (20 | 1.3%) accounting for the largest median household size of 6.05 persons per household. non-family households (745 | 50.1%) represent the smallest median household size with 1.39 persons per household.
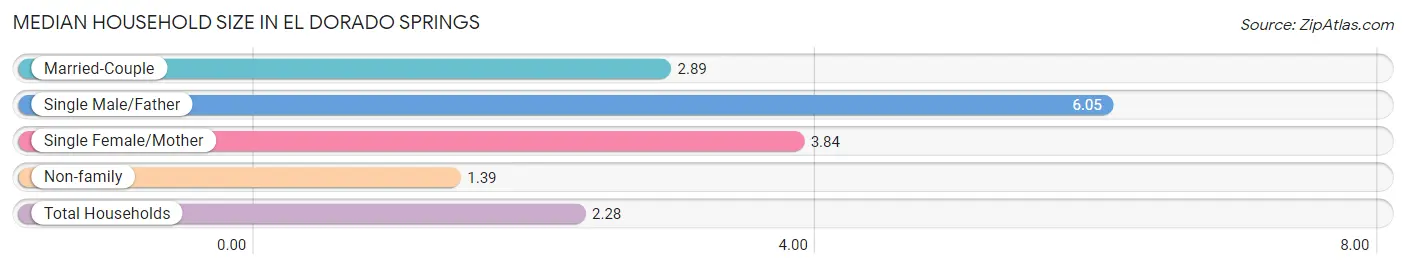
| Household Type | # Households | Household Size |
| Married-Couple | 575 (38.6%) | 2.89 |
| Single Male/Father | 20 (1.3%) | 6.05 |
| Single Female/Mother | 148 (10.0%) | 3.84 |
| Non-family | 745 (50.1%) | 1.39 |
| Total Households | 1,488 (100.0%) | 2.28 |
Household Size by Marriage Status in El Dorado Springs
Out of a total of 1,488 households in El Dorado Springs, 743 (49.9%) are family households, while 745 (50.1%) are nonfamily households. The most numerous type of family households are 2-person households, comprising 360, and the most common type of nonfamily households are 1-person households, comprising 522.
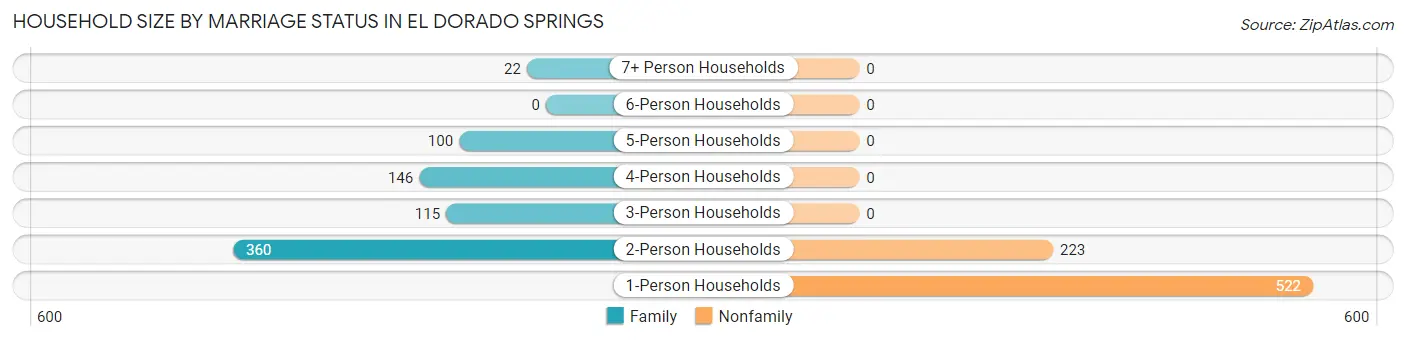
| Household Size | Family Households | Nonfamily Households |
| 1-Person Households | - | 522 (35.1%) |
| 2-Person Households | 360 (24.2%) | 223 (15.0%) |
| 3-Person Households | 115 (7.7%) | 0 (0.0%) |
| 4-Person Households | 146 (9.8%) | 0 (0.0%) |
| 5-Person Households | 100 (6.7%) | 0 (0.0%) |
| 6-Person Households | 0 (0.0%) | 0 (0.0%) |
| 7+ Person Households | 22 (1.5%) | 0 (0.0%) |
| Total | 743 (49.9%) | 745 (50.1%) |
Female Fertility in El Dorado Springs
Fertility by Age in El Dorado Springs
Average fertility rate in El Dorado Springs is 61.0 births per 1,000 women. Women in the age bracket of 15 to 19 years have the highest fertility rate with 343.0 births per 1,000 women. Women in the age bracket of 15 to 19 years acount for 100.0% of all women with births.
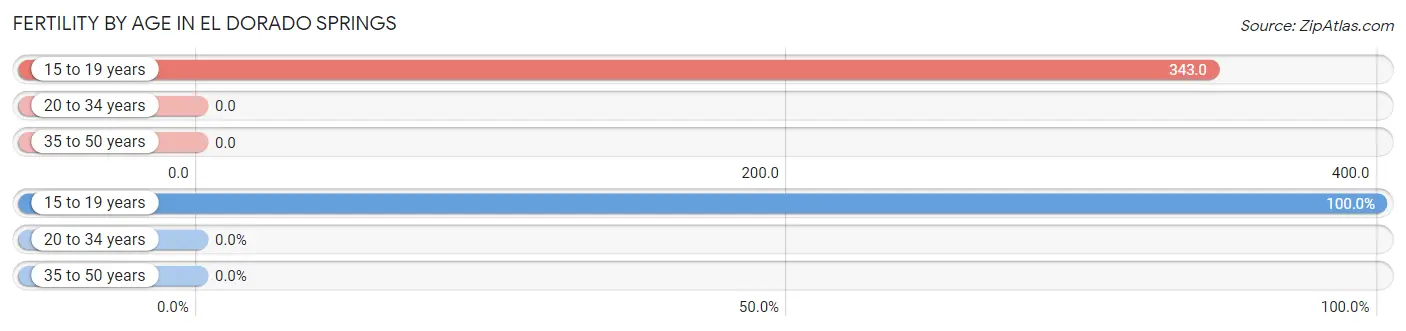
| Age Bracket | Women with Births | Births / 1,000 Women |
| 15 to 19 years | 48 (100.0%) | 343.0 |
| 20 to 34 years | 0 (0.0%) | 0.0 |
| 35 to 50 years | 0 (0.0%) | 0.0 |
| Total | 48 (100.0%) | 61.0 |
Fertility by Age by Marriage Status in El Dorado Springs
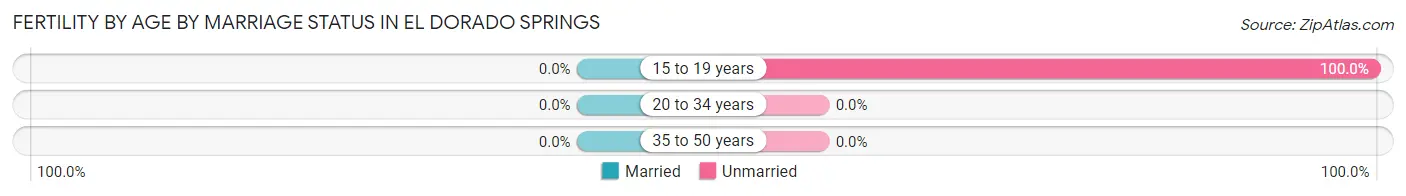
| Age Bracket | Married | Unmarried |
| 15 to 19 years | 0 (0.0%) | 48 (100.0%) |
| 20 to 34 years | 0 (0.0%) | 0 (0.0%) |
| 35 to 50 years | 0 (0.0%) | 0 (0.0%) |
| Total | 0 (0.0%) | 48 (100.0%) |
Fertility by Education in El Dorado Springs
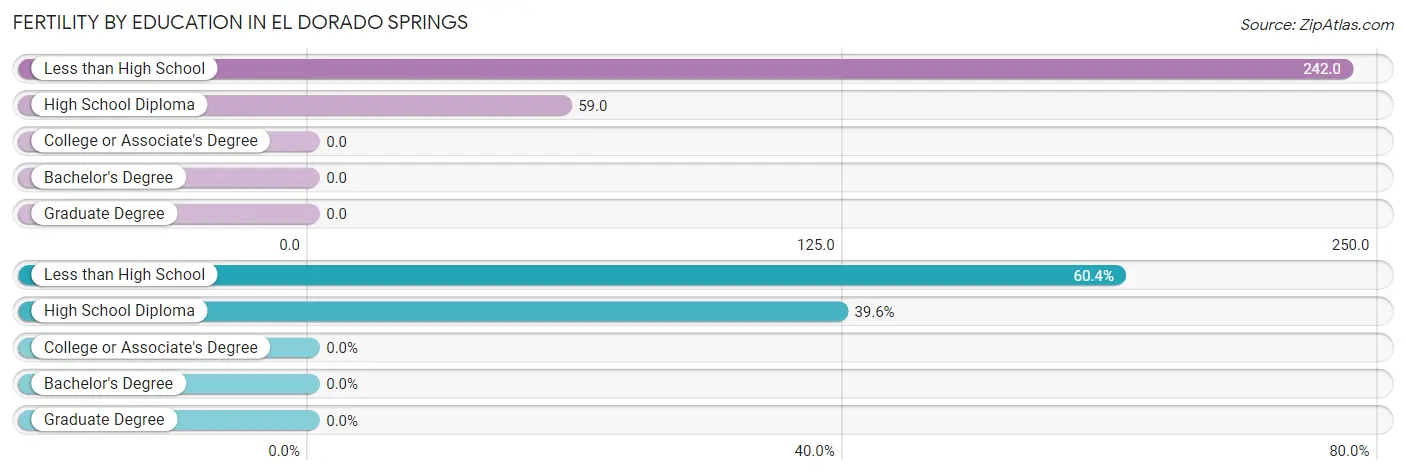
| Educational Attainment | Women with Births | Births / 1,000 Women |
| Less than High School | 29 (60.4%) | 242.0 |
| High School Diploma | 19 (39.6%) | 59.0 |
| College or Associate's Degree | 0 (0.0%) | 0.0 |
| Bachelor's Degree | 0 (0.0%) | 0.0 |
| Graduate Degree | 0 (0.0%) | 0.0 |
| Total | 48 (100.0%) | 61.0 |
Fertility by Education by Marriage Status in El Dorado Springs
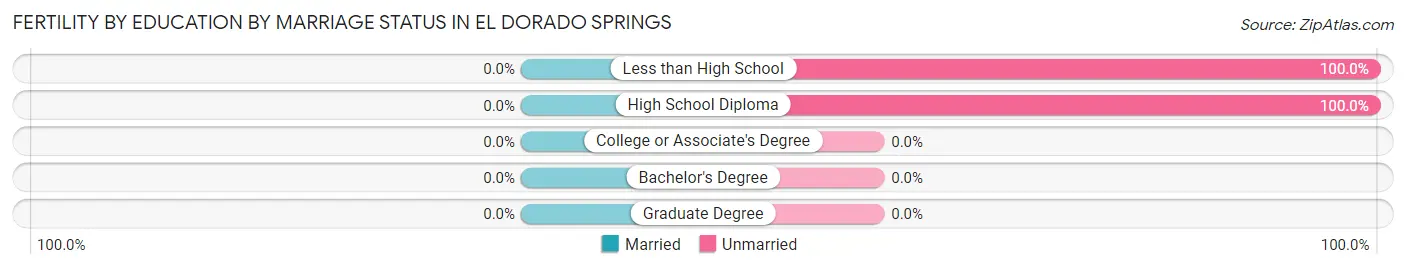
| Educational Attainment | Married | Unmarried |
| Less than High School | 0 (0.0%) | 29 (100.0%) |
| High School Diploma | 0 (0.0%) | 19 (100.0%) |
| College or Associate's Degree | 0 (0.0%) | 0 (0.0%) |
| Bachelor's Degree | 0 (0.0%) | 0 (0.0%) |
| Graduate Degree | 0 (0.0%) | 0 (0.0%) |
| Total | 0 (0.0%) | 48 (100.0%) |
Employment Characteristics in El Dorado Springs
Employment by Class of Employer in El Dorado Springs
Among the 1,441 employed individuals in El Dorado Springs, private company employees (684 | 47.5%), not-for-profit organizations (256 | 17.8%), and self-employed (not incorporated) (241 | 16.7%) make up the most common classes of employment.
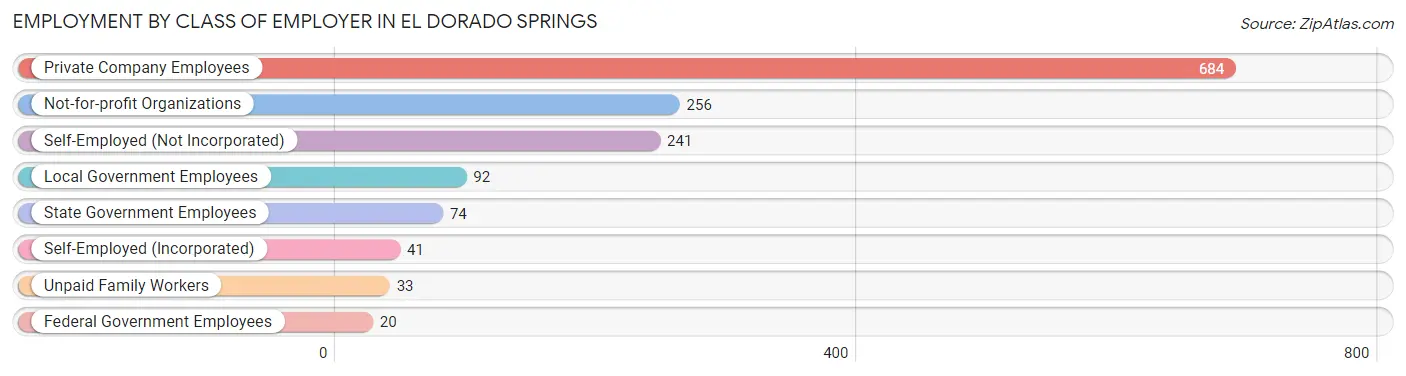
| Employer Class | # Employees | % Employees |
| Private Company Employees | 684 | 47.5% |
| Self-Employed (Incorporated) | 41 | 2.9% |
| Self-Employed (Not Incorporated) | 241 | 16.7% |
| Not-for-profit Organizations | 256 | 17.8% |
| Local Government Employees | 92 | 6.4% |
| State Government Employees | 74 | 5.1% |
| Federal Government Employees | 20 | 1.4% |
| Unpaid Family Workers | 33 | 2.3% |
| Total | 1,441 | 100.0% |
Employment Status by Age in El Dorado Springs
According to the labor force statistics for El Dorado Springs, out of the total population over 16 years of age (2,881), 52.0% or 1,498 individuals are in the labor force, with 3.7% or 55 of them unemployed. The age group with the highest labor force participation rate is 25 to 29 years, with 100.0% or 220 individuals in the labor force. Within the labor force, the 20 to 24 years age range has the highest percentage of unemployed individuals, with 17.4% or 37 of them being unemployed.
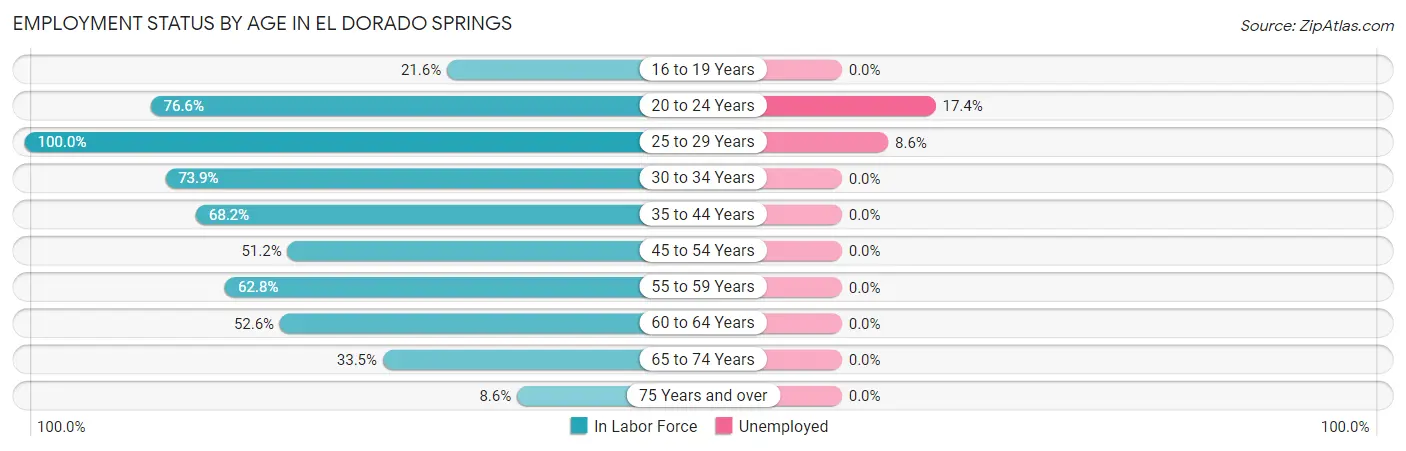
| Age Bracket | In Labor Force | Unemployed |
| 16 to 19 Years | 38 (21.6%) | 0 (0.0%) |
| 20 to 24 Years | 213 (76.6%) | 37 (17.4%) |
| 25 to 29 Years | 220 (100.0%) | 19 (8.6%) |
| 30 to 34 Years | 105 (73.9%) | 0 (0.0%) |
| 35 to 44 Years | 322 (68.2%) | 0 (0.0%) |
| 45 to 54 Years | 190 (51.2%) | 0 (0.0%) |
| 55 to 59 Years | 98 (62.8%) | 0 (0.0%) |
| 60 to 64 Years | 111 (52.6%) | 0 (0.0%) |
| 65 to 74 Years | 170 (33.5%) | 0 (0.0%) |
| 75 Years and over | 30 (8.6%) | 0 (0.0%) |
| Total | 1,498 (52.0%) | 55 (3.7%) |
Employment Status by Educational Attainment in El Dorado Springs
According to labor force statistics for El Dorado Springs, 66.5% of individuals (1,045) out of the total population between 25 and 64 years of age (1,572) are in the labor force, with 1.8% or 19 of them being unemployed. The group with the highest labor force participation rate are those with the educational attainment of bachelor's degree or higher, with 96.3% or 154 individuals in the labor force. Within the labor force, individuals with less than high school education have the highest percentage of unemployment, with 30.6% or 11 of them being unemployed.
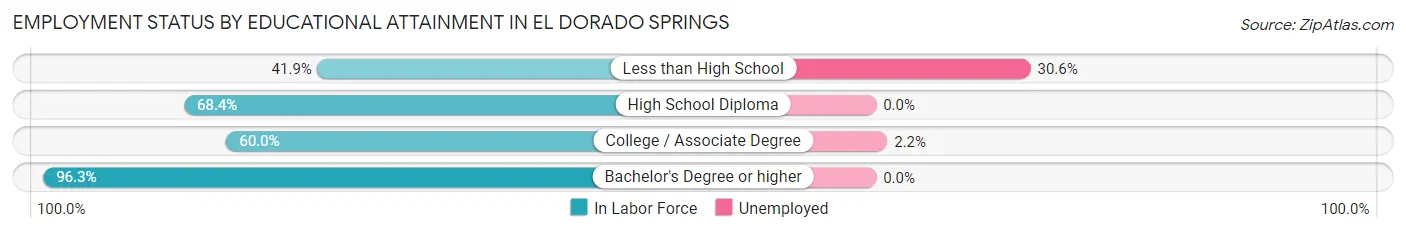
| Educational Attainment | In Labor Force | Unemployed |
| Less than High School | 36 (41.9%) | 26 (30.6%) |
| High School Diploma | 490 (68.4%) | 0 (0.0%) |
| College / Associate Degree | 366 (60.0%) | 13 (2.2%) |
| Bachelor's Degree or higher | 154 (96.3%) | 0 (0.0%) |
| Total | 1,045 (66.5%) | 28 (1.8%) |
Employment Occupations by Sex in El Dorado Springs
Management, Business, Science and Arts Occupations
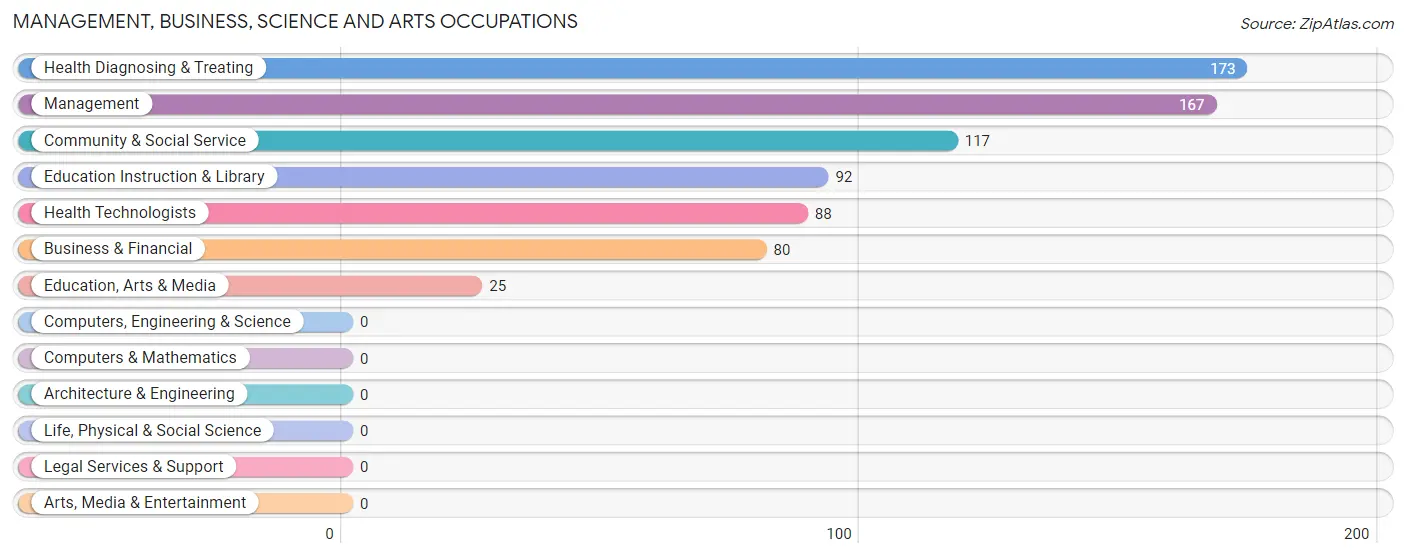
The most common Management, Business, Science and Arts occupations in El Dorado Springs are Health Diagnosing & Treating (173 | 12.0%), Management (167 | 11.6%), Community & Social Service (117 | 8.1%), Education Instruction & Library (92 | 6.4%), and Health Technologists (88 | 6.1%).
Management, Business, Science and Arts Occupations by Sex
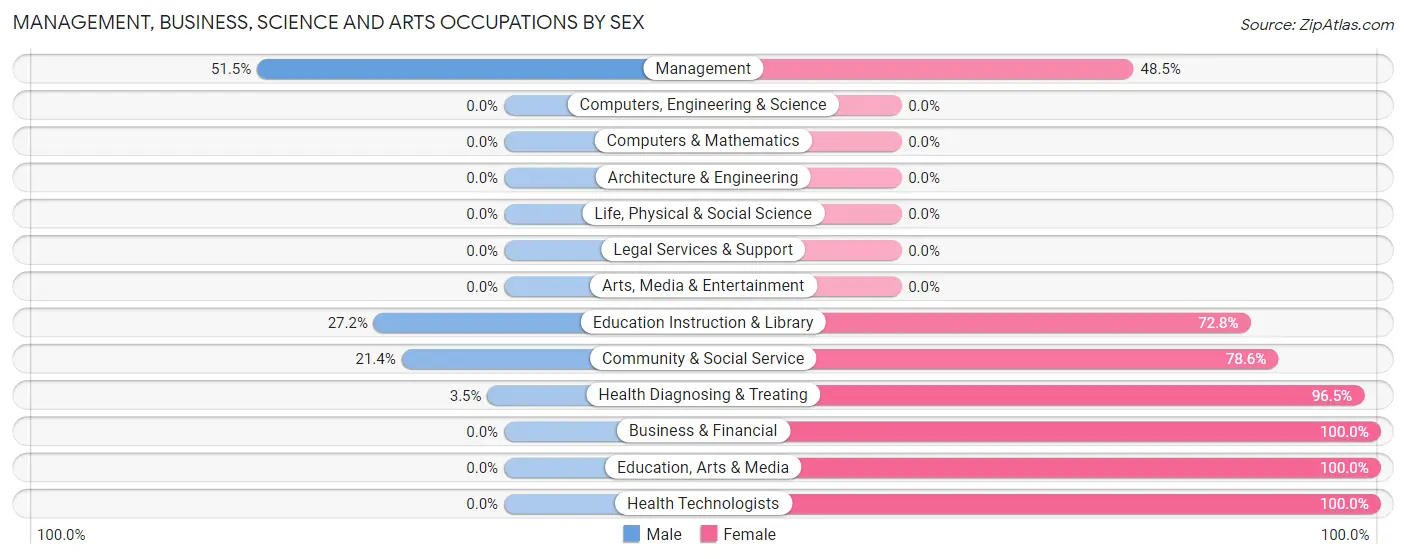
Within the Management, Business, Science and Arts occupations in El Dorado Springs, the most male-oriented occupations are Management (51.5%), Education Instruction & Library (27.2%), and Community & Social Service (21.4%), while the most female-oriented occupations are Business & Financial (100.0%), Education, Arts & Media (100.0%), and Health Technologists (100.0%).
| Occupation | Male | Female |
| Management | 86 (51.5%) | 81 (48.5%) |
| Business & Financial | 0 (0.0%) | 80 (100.0%) |
| Computers, Engineering & Science | 0 (0.0%) | 0 (0.0%) |
| Computers & Mathematics | 0 (0.0%) | 0 (0.0%) |
| Architecture & Engineering | 0 (0.0%) | 0 (0.0%) |
| Life, Physical & Social Science | 0 (0.0%) | 0 (0.0%) |
| Community & Social Service | 25 (21.4%) | 92 (78.6%) |
| Education, Arts & Media | 0 (0.0%) | 25 (100.0%) |
| Legal Services & Support | 0 (0.0%) | 0 (0.0%) |
| Education Instruction & Library | 25 (27.2%) | 67 (72.8%) |
| Arts, Media & Entertainment | 0 (0.0%) | 0 (0.0%) |
| Health Diagnosing & Treating | 6 (3.5%) | 167 (96.5%) |
| Health Technologists | 0 (0.0%) | 88 (100.0%) |
| Total (Category) | 117 (21.8%) | 420 (78.2%) |
| Total (Overall) | 611 (42.4%) | 830 (57.6%) |
Services Occupations
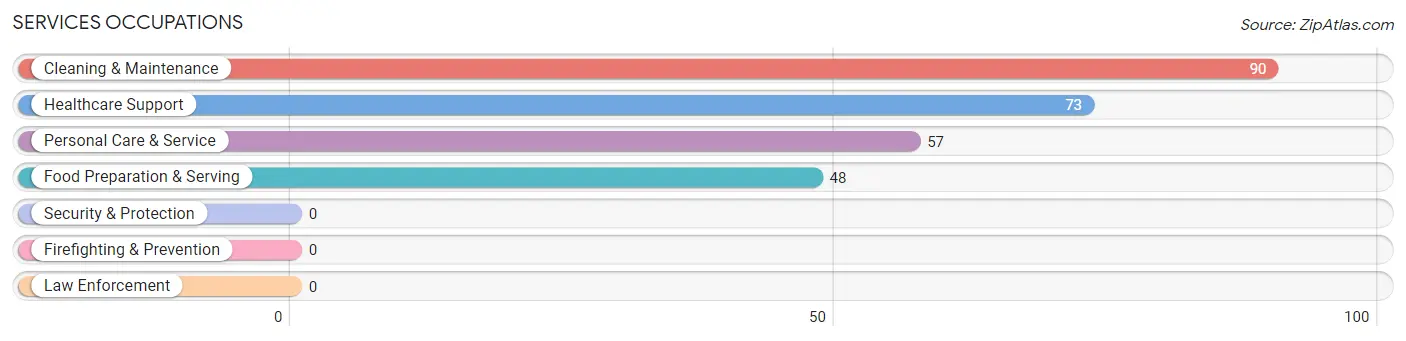
The most common Services occupations in El Dorado Springs are Cleaning & Maintenance (90 | 6.2%), Healthcare Support (73 | 5.1%), Personal Care & Service (57 | 4.0%), and Food Preparation & Serving (48 | 3.3%).
Services Occupations by Sex
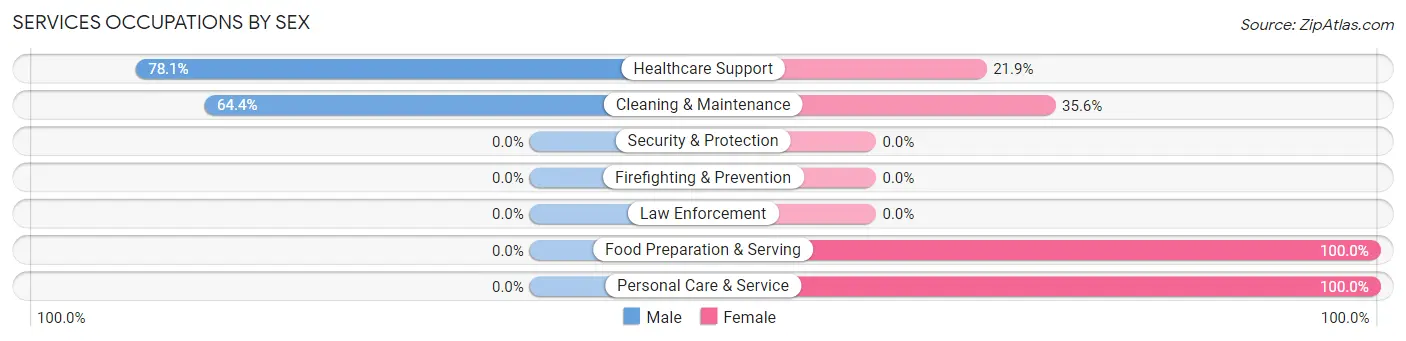
Within the Services occupations in El Dorado Springs, the most male-oriented occupations are Healthcare Support (78.1%), and Cleaning & Maintenance (64.4%), while the most female-oriented occupations are Food Preparation & Serving (100.0%), Personal Care & Service (100.0%), and Cleaning & Maintenance (35.6%).
| Occupation | Male | Female |
| Healthcare Support | 57 (78.1%) | 16 (21.9%) |
| Security & Protection | 0 (0.0%) | 0 (0.0%) |
| Firefighting & Prevention | 0 (0.0%) | 0 (0.0%) |
| Law Enforcement | 0 (0.0%) | 0 (0.0%) |
| Food Preparation & Serving | 0 (0.0%) | 48 (100.0%) |
| Cleaning & Maintenance | 58 (64.4%) | 32 (35.6%) |
| Personal Care & Service | 0 (0.0%) | 57 (100.0%) |
| Total (Category) | 115 (42.9%) | 153 (57.1%) |
| Total (Overall) | 611 (42.4%) | 830 (57.6%) |
Sales and Office Occupations
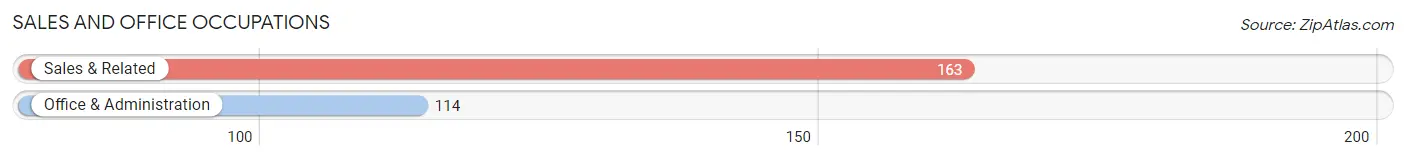
The most common Sales and Office occupations in El Dorado Springs are Sales & Related (163 | 11.3%), and Office & Administration (114 | 7.9%).
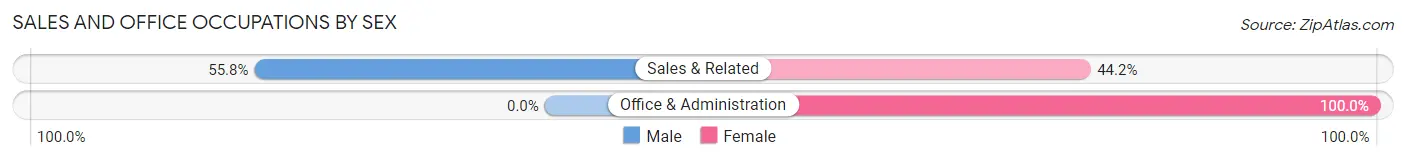
Sales and Office Occupations by Sex
| Occupation | Male | Female |
| Sales & Related | 91 (55.8%) | 72 (44.2%) |
| Office & Administration | 0 (0.0%) | 114 (100.0%) |
| Total (Category) | 91 (32.9%) | 186 (67.1%) |
| Total (Overall) | 611 (42.4%) | 830 (57.6%) |
Natural Resources, Construction and Maintenance Occupations
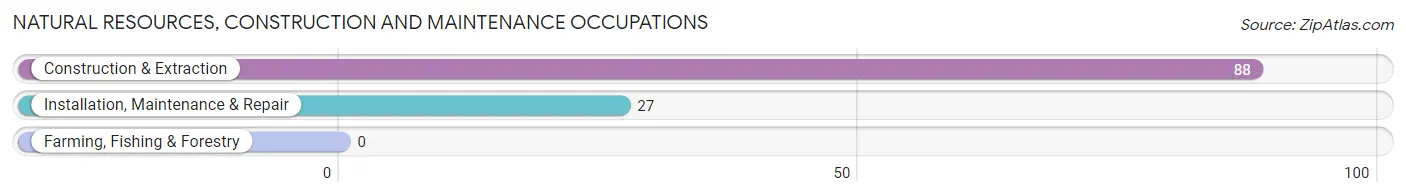
The most common Natural Resources, Construction and Maintenance occupations in El Dorado Springs are Construction & Extraction (88 | 6.1%), and Installation, Maintenance & Repair (27 | 1.9%).
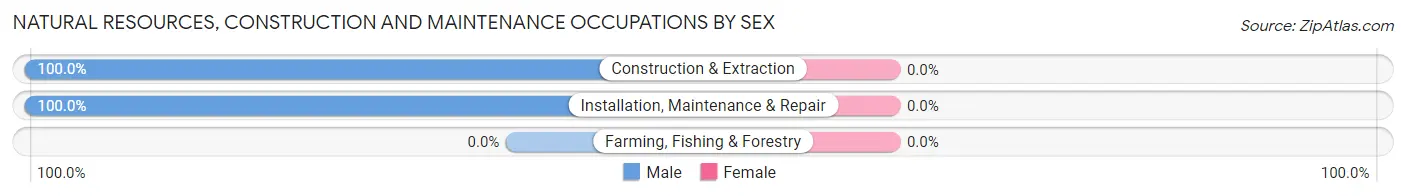
Natural Resources, Construction and Maintenance Occupations by Sex
| Occupation | Male | Female |
| Farming, Fishing & Forestry | 0 (0.0%) | 0 (0.0%) |
| Construction & Extraction | 88 (100.0%) | 0 (0.0%) |
| Installation, Maintenance & Repair | 27 (100.0%) | 0 (0.0%) |
| Total (Category) | 115 (100.0%) | 0 (0.0%) |
| Total (Overall) | 611 (42.4%) | 830 (57.6%) |
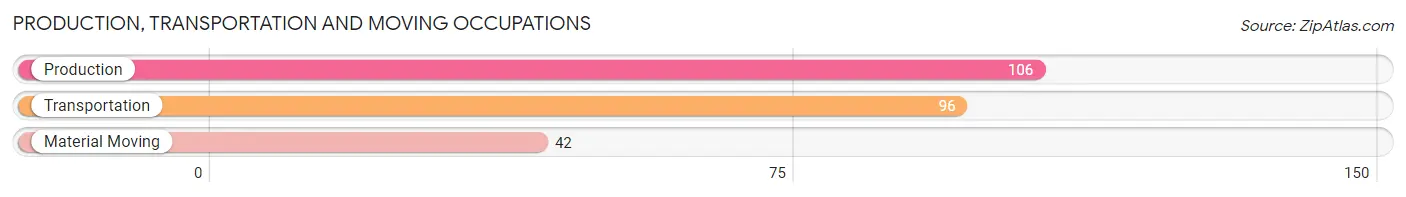
Production, Transportation and Moving Occupations
The most common Production, Transportation and Moving occupations in El Dorado Springs are Production (106 | 7.4%), Transportation (96 | 6.7%), and Material Moving (42 | 2.9%).
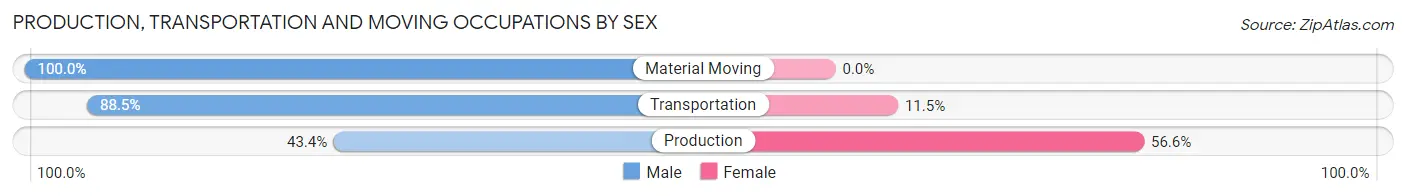
Production, Transportation and Moving Occupations by Sex
| Occupation | Male | Female |
| Production | 46 (43.4%) | 60 (56.6%) |
| Transportation | 85 (88.5%) | 11 (11.5%) |
| Material Moving | 42 (100.0%) | 0 (0.0%) |
| Total (Category) | 173 (70.9%) | 71 (29.1%) |
| Total (Overall) | 611 (42.4%) | 830 (57.6%) |
Employment Industries by Sex in El Dorado Springs
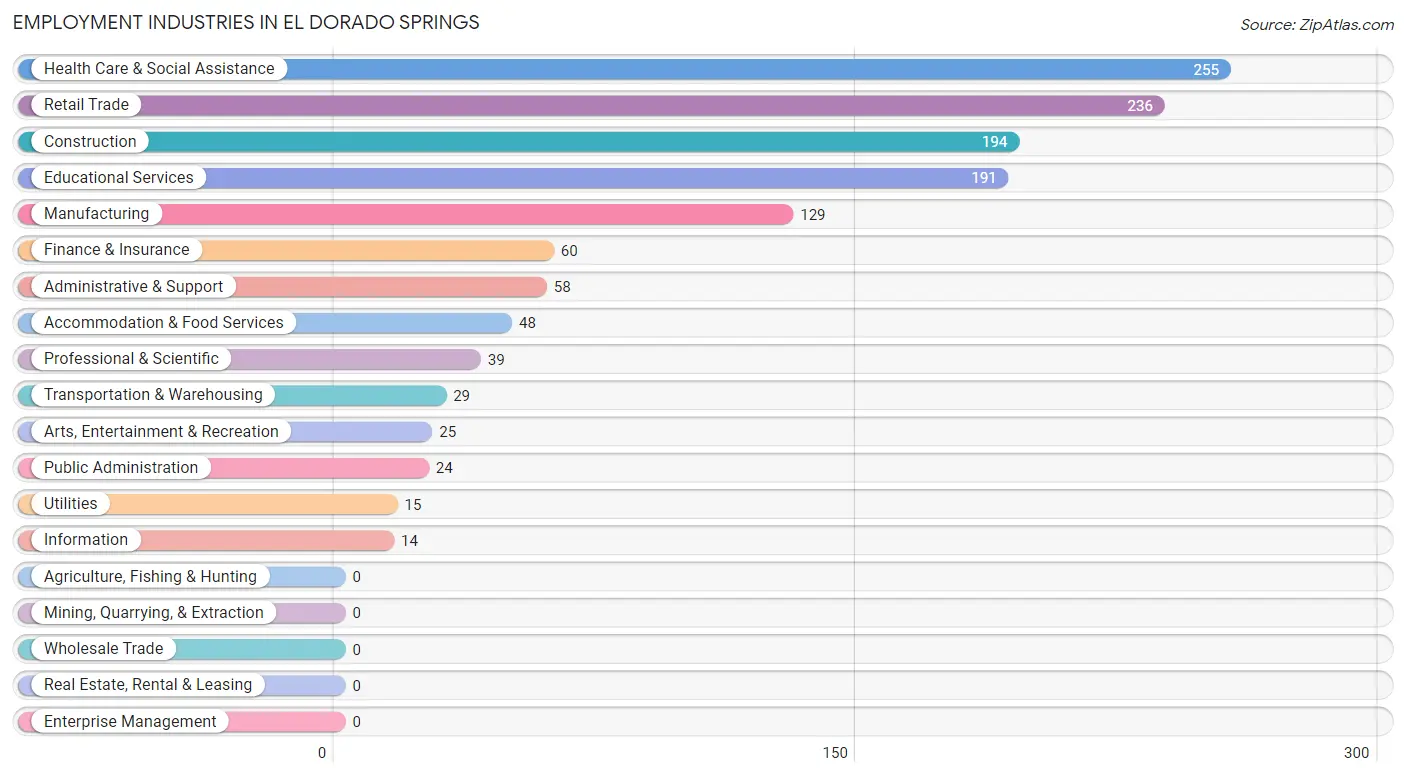
Employment Industries in El Dorado Springs
The major employment industries in El Dorado Springs include Health Care & Social Assistance (255 | 17.7%), Retail Trade (236 | 16.4%), Construction (194 | 13.5%), Educational Services (191 | 13.3%), and Manufacturing (129 | 8.9%).
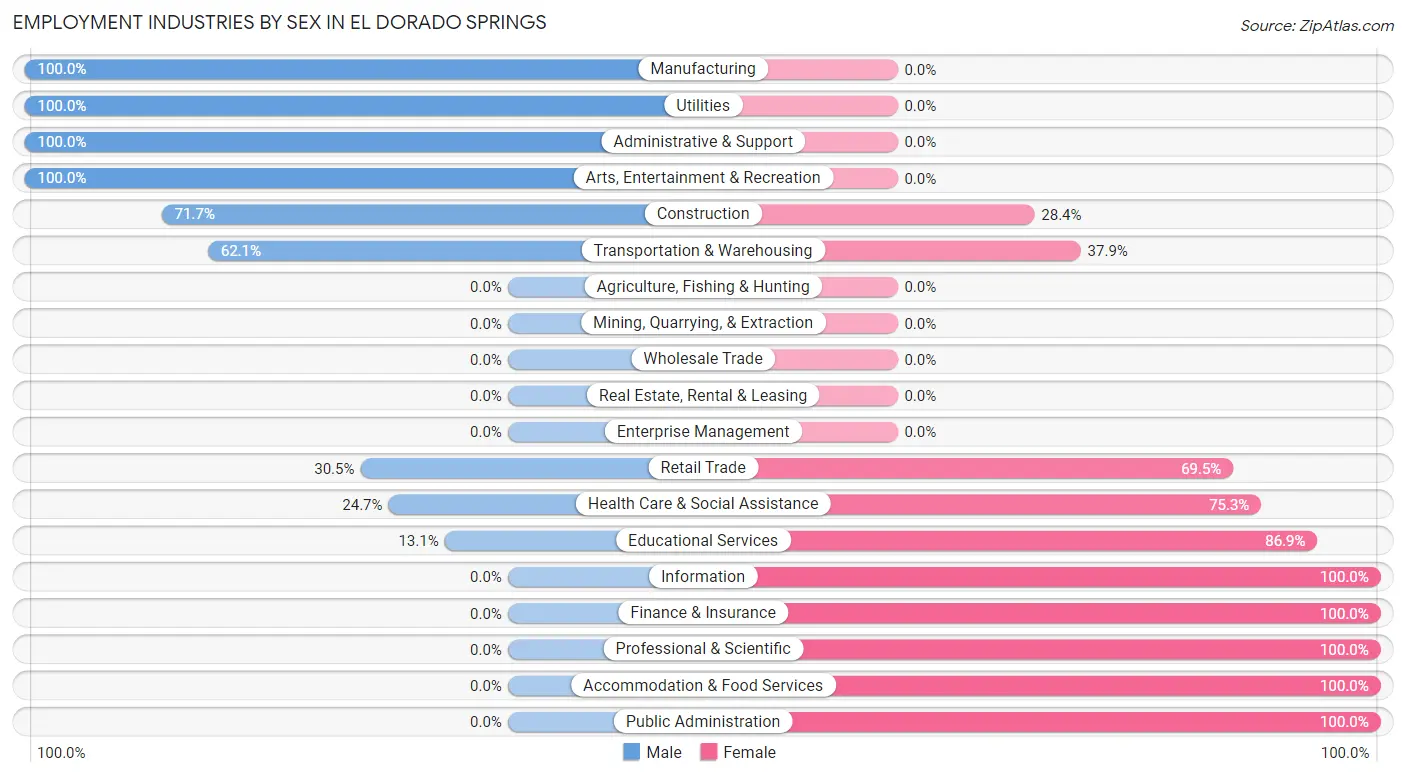
Employment Industries by Sex in El Dorado Springs
The El Dorado Springs industries that see more men than women are Manufacturing (100.0%), Utilities (100.0%), and Administrative & Support (100.0%), whereas the industries that tend to have a higher number of women are Information (100.0%), Finance & Insurance (100.0%), and Professional & Scientific (100.0%).
| Industry | Male | Female |
| Agriculture, Fishing & Hunting | 0 (0.0%) | 0 (0.0%) |
| Mining, Quarrying, & Extraction | 0 (0.0%) | 0 (0.0%) |
| Construction | 139 (71.7%) | 55 (28.3%) |
| Manufacturing | 129 (100.0%) | 0 (0.0%) |
| Wholesale Trade | 0 (0.0%) | 0 (0.0%) |
| Retail Trade | 72 (30.5%) | 164 (69.5%) |
| Transportation & Warehousing | 18 (62.1%) | 11 (37.9%) |
| Utilities | 15 (100.0%) | 0 (0.0%) |
| Information | 0 (0.0%) | 14 (100.0%) |
| Finance & Insurance | 0 (0.0%) | 60 (100.0%) |
| Real Estate, Rental & Leasing | 0 (0.0%) | 0 (0.0%) |
| Professional & Scientific | 0 (0.0%) | 39 (100.0%) |
| Enterprise Management | 0 (0.0%) | 0 (0.0%) |
| Administrative & Support | 58 (100.0%) | 0 (0.0%) |
| Educational Services | 25 (13.1%) | 166 (86.9%) |
| Health Care & Social Assistance | 63 (24.7%) | 192 (75.3%) |
| Arts, Entertainment & Recreation | 25 (100.0%) | 0 (0.0%) |
| Accommodation & Food Services | 0 (0.0%) | 48 (100.0%) |
| Public Administration | 0 (0.0%) | 24 (100.0%) |
| Total | 611 (42.4%) | 830 (57.6%) |
Education in El Dorado Springs
School Enrollment in El Dorado Springs
The most common levels of schooling among the 712 students in El Dorado Springs are elementary school (170 | 23.9%), high school (144 | 20.2%), and middle school (123 | 17.3%).
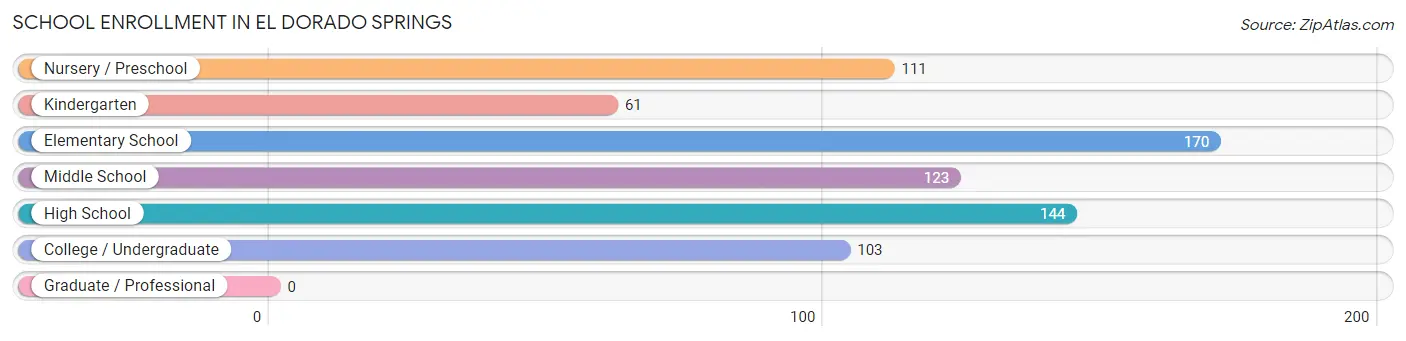
| School Level | # Students | % Students |
| Nursery / Preschool | 111 | 15.6% |
| Kindergarten | 61 | 8.6% |
| Elementary School | 170 | 23.9% |
| Middle School | 123 | 17.3% |
| High School | 144 | 20.2% |
| College / Undergraduate | 103 | 14.5% |
| Graduate / Professional | 0 | 0.0% |
| Total | 712 | 100.0% |
School Enrollment by Age by Funding Source in El Dorado Springs
Out of a total of 712 students who are enrolled in schools in El Dorado Springs, 178 (25.0%) attend a private institution, while the remaining 534 (75.0%) are enrolled in public schools. The age group of 3 to 4 year olds has the highest likelihood of being enrolled in private schools, with 58 (58.6% in the age bracket) enrolled. Conversely, the age group of 10 to 14 year olds has the lowest likelihood of being enrolled in a private school, with 147 (100.0% in the age bracket) attending a public institution.
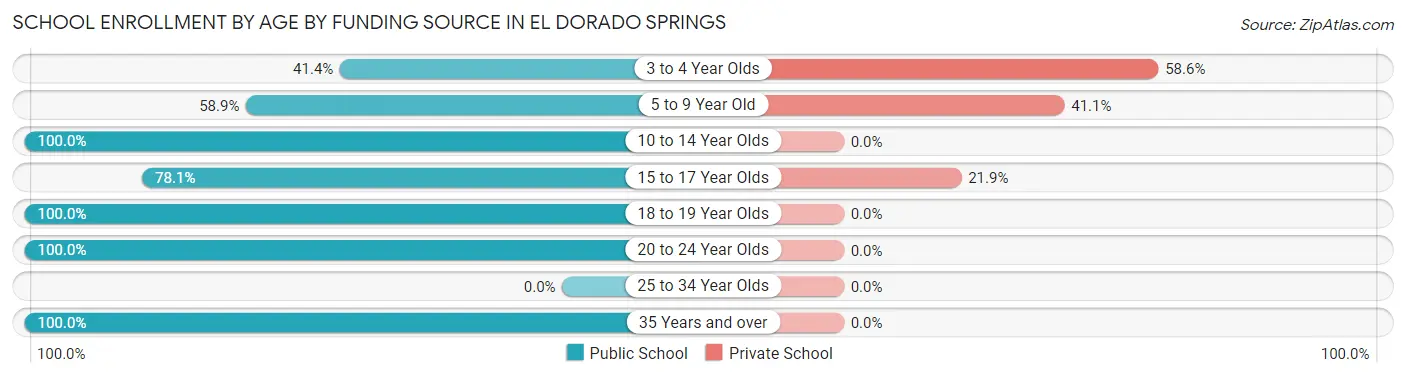
| Age Bracket | Public School | Private School |
| 3 to 4 Year Olds | 41 (41.4%) | 58 (58.6%) |
| 5 to 9 Year Old | 129 (58.9%) | 90 (41.1%) |
| 10 to 14 Year Olds | 147 (100.0%) | 0 (0.0%) |
| 15 to 17 Year Olds | 107 (78.1%) | 30 (21.9%) |
| 18 to 19 Year Olds | 7 (100.0%) | 0 (0.0%) |
| 20 to 24 Year Olds | 47 (100.0%) | 0 (0.0%) |
| 25 to 34 Year Olds | 0 (0.0%) | 0 (0.0%) |
| 35 Years and over | 56 (100.0%) | 0 (0.0%) |
| Total | 534 (75.0%) | 178 (25.0%) |
Educational Attainment by Field of Study in El Dorado Springs
Education (151 | 49.0%), literature & languages (39 | 12.7%), social sciences (36 | 11.7%), science & technology (34 | 11.0%), and visual & performing arts (21 | 6.8%) are the most common fields of study among 308 individuals in El Dorado Springs who have obtained a bachelor's degree or higher.
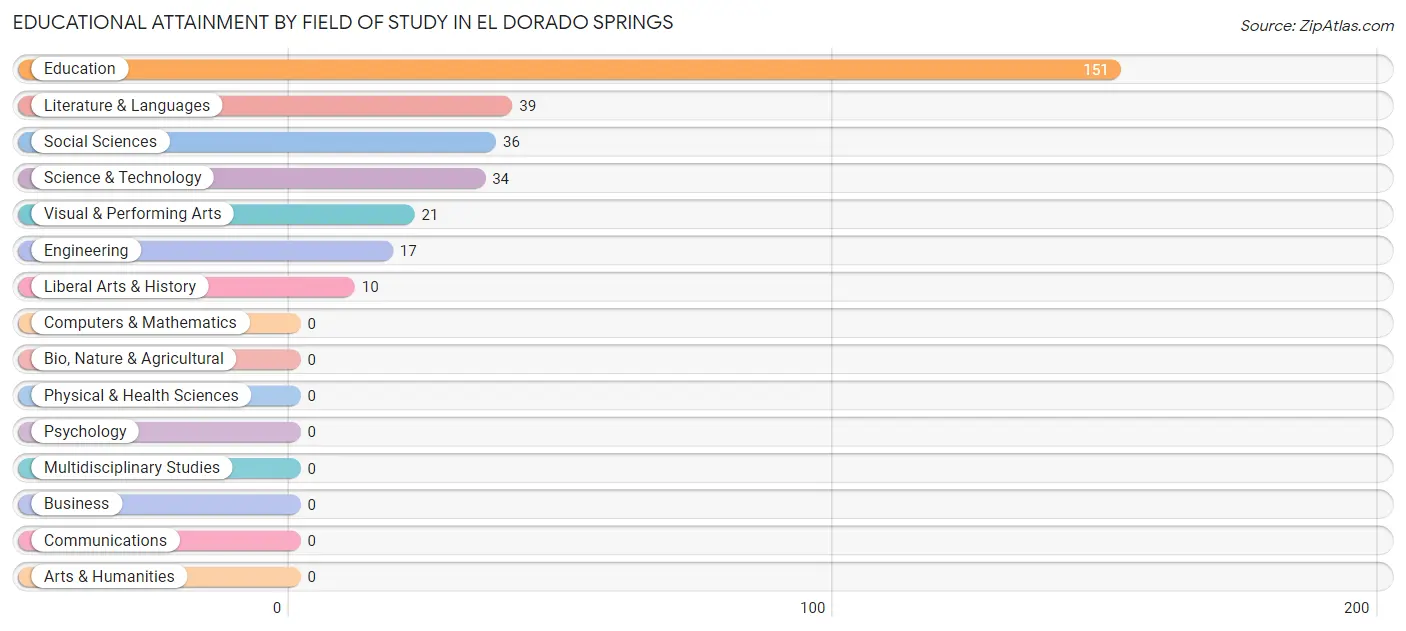
| Field of Study | # Graduates | % Graduates |
| Computers & Mathematics | 0 | 0.0% |
| Bio, Nature & Agricultural | 0 | 0.0% |
| Physical & Health Sciences | 0 | 0.0% |
| Psychology | 0 | 0.0% |
| Social Sciences | 36 | 11.7% |
| Engineering | 17 | 5.5% |
| Multidisciplinary Studies | 0 | 0.0% |
| Science & Technology | 34 | 11.0% |
| Business | 0 | 0.0% |
| Education | 151 | 49.0% |
| Literature & Languages | 39 | 12.7% |
| Liberal Arts & History | 10 | 3.3% |
| Visual & Performing Arts | 21 | 6.8% |
| Communications | 0 | 0.0% |
| Arts & Humanities | 0 | 0.0% |
| Total | 308 | 100.0% |
Transportation & Commute in El Dorado Springs
Vehicle Availability by Sex in El Dorado Springs
The most prevalent vehicle ownership categories in El Dorado Springs are males with 2 vehicles (264, accounting for 43.2%) and females with 2 vehicles (311, making up 31.8%).
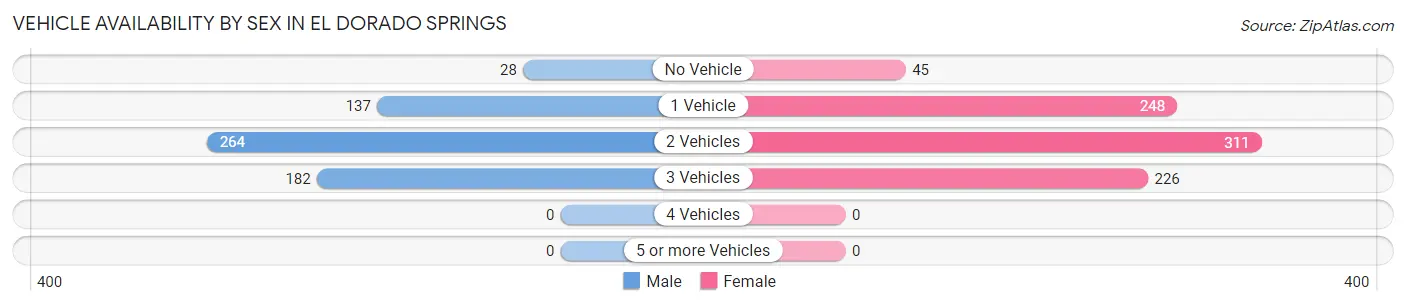
| Vehicles Available | Male | Female |
| No Vehicle | 28 (4.6%) | 45 (5.4%) |
| 1 Vehicle | 137 (22.4%) | 248 (29.9%) |
| 2 Vehicles | 264 (43.2%) | 311 (37.5%) |
| 3 Vehicles | 182 (29.8%) | 226 (27.2%) |
| 4 Vehicles | 0 (0.0%) | 0 (0.0%) |
| 5 or more Vehicles | 0 (0.0%) | 0 (0.0%) |
| Total | 611 (100.0%) | 830 (100.0%) |
Commute Time in El Dorado Springs
The most frequently occuring commute durations in El Dorado Springs are 5 to 9 minutes (501 commuters, 35.7%), less than 5 minutes (274 commuters, 19.5%), and 45 to 59 minutes (173 commuters, 12.3%).
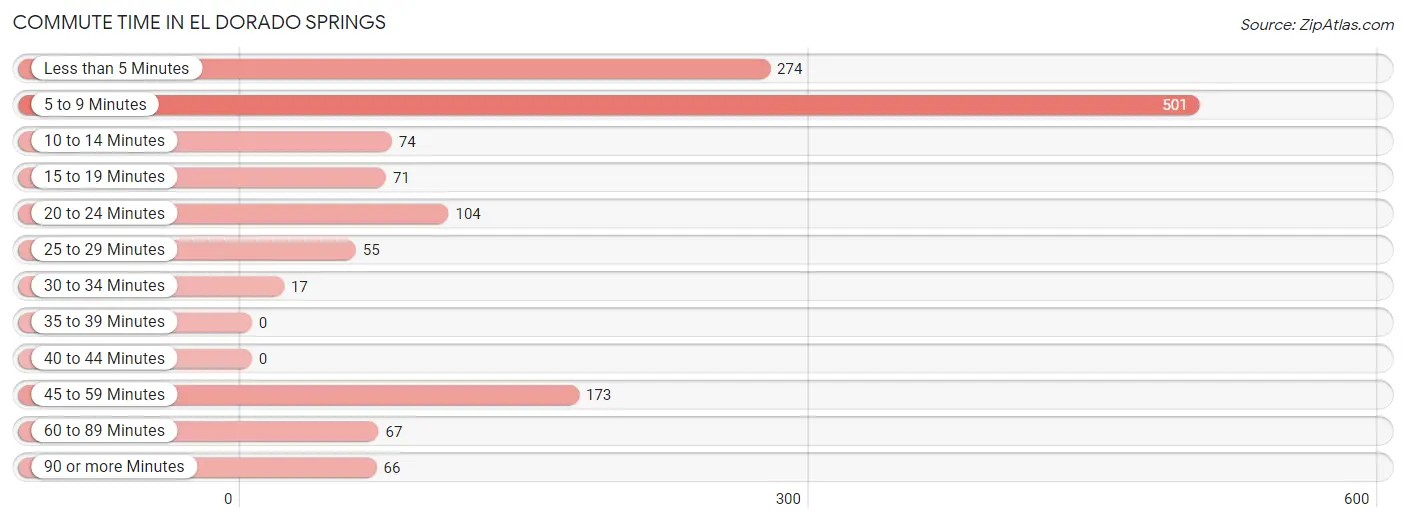
| Commute Time | # Commuters | % Commuters |
| Less than 5 Minutes | 274 | 19.5% |
| 5 to 9 Minutes | 501 | 35.7% |
| 10 to 14 Minutes | 74 | 5.3% |
| 15 to 19 Minutes | 71 | 5.1% |
| 20 to 24 Minutes | 104 | 7.4% |
| 25 to 29 Minutes | 55 | 3.9% |
| 30 to 34 Minutes | 17 | 1.2% |
| 35 to 39 Minutes | 0 | 0.0% |
| 40 to 44 Minutes | 0 | 0.0% |
| 45 to 59 Minutes | 173 | 12.3% |
| 60 to 89 Minutes | 67 | 4.8% |
| 90 or more Minutes | 66 | 4.7% |
Commute Time by Sex in El Dorado Springs
The most common commute times in El Dorado Springs are 5 to 9 minutes (208 commuters, 34.0%) for males and 5 to 9 minutes (293 commuters, 37.0%) for females.
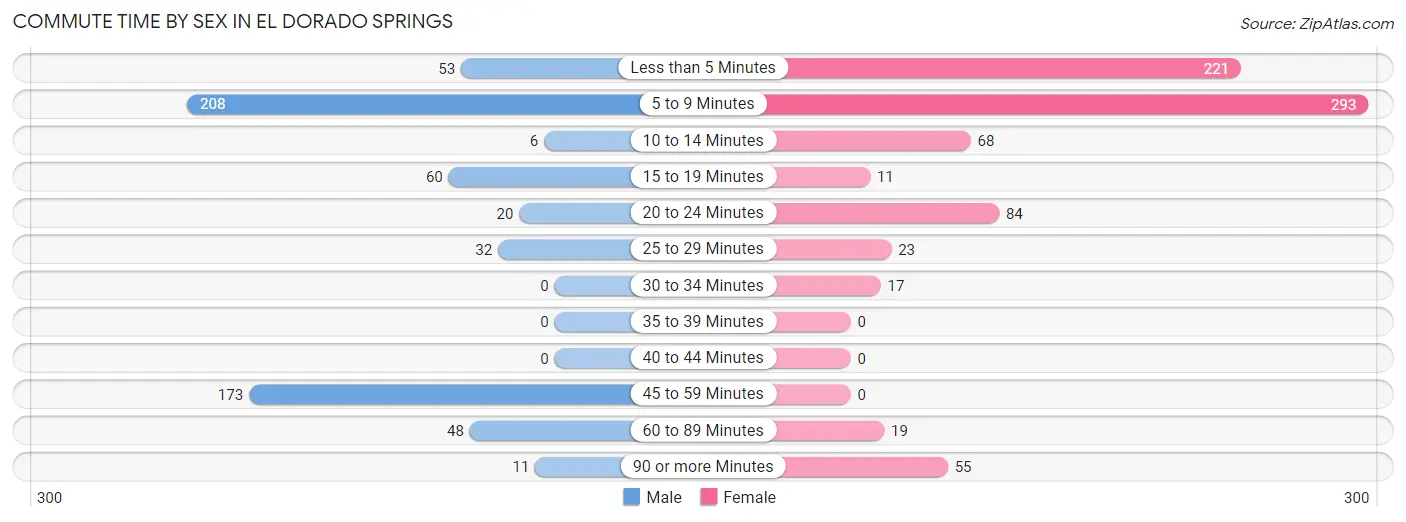
| Commute Time | Male | Female |
| Less than 5 Minutes | 53 (8.7%) | 221 (27.9%) |
| 5 to 9 Minutes | 208 (34.0%) | 293 (37.0%) |
| 10 to 14 Minutes | 6 (1.0%) | 68 (8.6%) |
| 15 to 19 Minutes | 60 (9.8%) | 11 (1.4%) |
| 20 to 24 Minutes | 20 (3.3%) | 84 (10.6%) |
| 25 to 29 Minutes | 32 (5.2%) | 23 (2.9%) |
| 30 to 34 Minutes | 0 (0.0%) | 17 (2.1%) |
| 35 to 39 Minutes | 0 (0.0%) | 0 (0.0%) |
| 40 to 44 Minutes | 0 (0.0%) | 0 (0.0%) |
| 45 to 59 Minutes | 173 (28.3%) | 0 (0.0%) |
| 60 to 89 Minutes | 48 (7.9%) | 19 (2.4%) |
| 90 or more Minutes | 11 (1.8%) | 55 (7.0%) |
Time of Departure to Work by Sex in El Dorado Springs
The most frequent times of departure to work in El Dorado Springs are 7:00 AM to 7:29 AM (143, 23.4%) for males and 6:00 AM to 6:29 AM (120, 15.2%) for females.
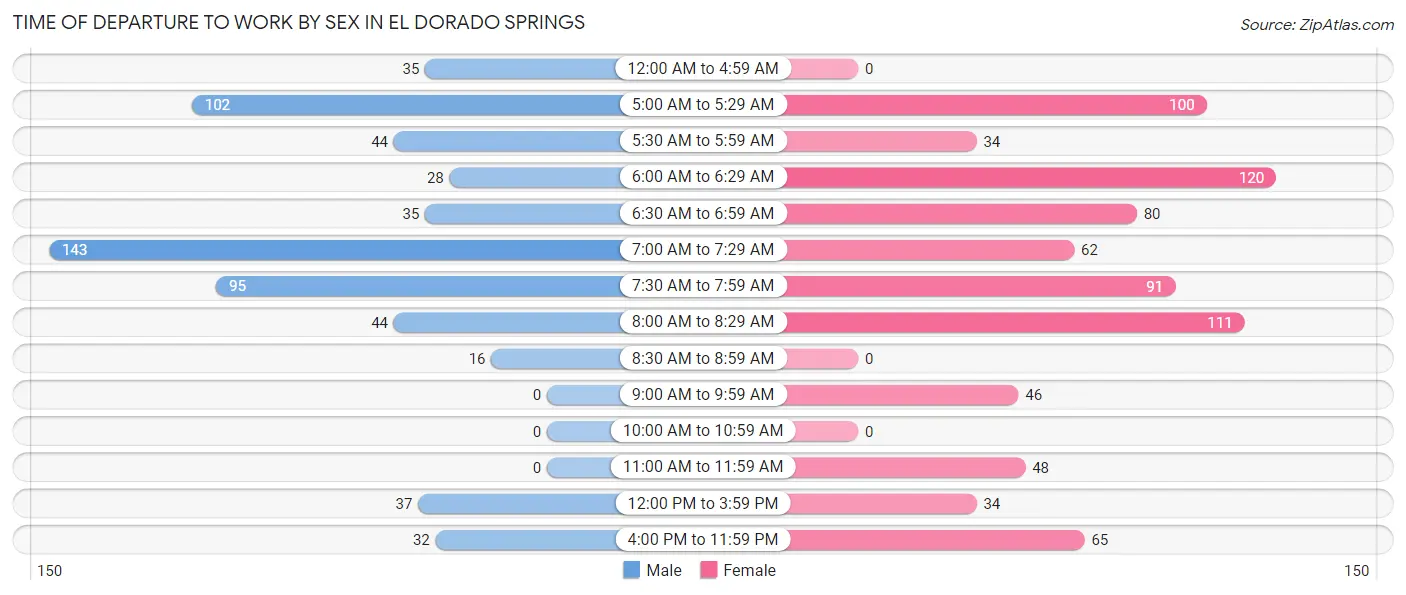
| Time of Departure | Male | Female |
| 12:00 AM to 4:59 AM | 35 (5.7%) | 0 (0.0%) |
| 5:00 AM to 5:29 AM | 102 (16.7%) | 100 (12.6%) |
| 5:30 AM to 5:59 AM | 44 (7.2%) | 34 (4.3%) |
| 6:00 AM to 6:29 AM | 28 (4.6%) | 120 (15.2%) |
| 6:30 AM to 6:59 AM | 35 (5.7%) | 80 (10.1%) |
| 7:00 AM to 7:29 AM | 143 (23.4%) | 62 (7.8%) |
| 7:30 AM to 7:59 AM | 95 (15.5%) | 91 (11.5%) |
| 8:00 AM to 8:29 AM | 44 (7.2%) | 111 (14.0%) |
| 8:30 AM to 8:59 AM | 16 (2.6%) | 0 (0.0%) |
| 9:00 AM to 9:59 AM | 0 (0.0%) | 46 (5.8%) |
| 10:00 AM to 10:59 AM | 0 (0.0%) | 0 (0.0%) |
| 11:00 AM to 11:59 AM | 0 (0.0%) | 48 (6.1%) |
| 12:00 PM to 3:59 PM | 37 (6.1%) | 34 (4.3%) |
| 4:00 PM to 11:59 PM | 32 (5.2%) | 65 (8.2%) |
| Total | 611 (100.0%) | 791 (100.0%) |
Housing Occupancy in El Dorado Springs
Occupancy by Ownership in El Dorado Springs
Of the total 1,488 dwellings in El Dorado Springs, owner-occupied units account for 724 (48.7%), while renter-occupied units make up 764 (51.3%).
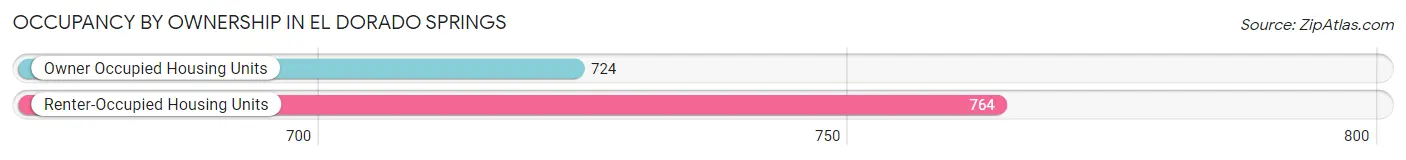
| Occupancy | # Housing Units | % Housing Units |
| Owner Occupied Housing Units | 724 | 48.7% |
| Renter-Occupied Housing Units | 764 | 51.3% |
| Total Occupied Housing Units | 1,488 | 100.0% |
Occupancy by Household Size in El Dorado Springs
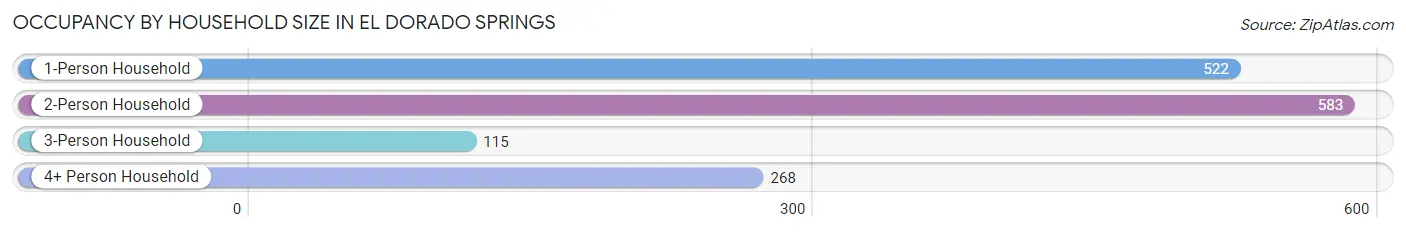
| Household Size | # Housing Units | % Housing Units |
| 1-Person Household | 522 | 35.1% |
| 2-Person Household | 583 | 39.2% |
| 3-Person Household | 115 | 7.7% |
| 4+ Person Household | 268 | 18.0% |
| Total Housing Units | 1,488 | 100.0% |
Occupancy by Ownership by Household Size in El Dorado Springs
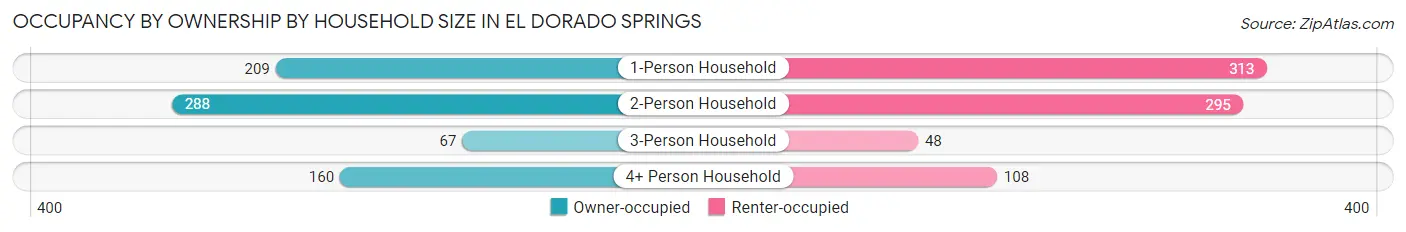
| Household Size | Owner-occupied | Renter-occupied |
| 1-Person Household | 209 (40.0%) | 313 (60.0%) |
| 2-Person Household | 288 (49.4%) | 295 (50.6%) |
| 3-Person Household | 67 (58.3%) | 48 (41.7%) |
| 4+ Person Household | 160 (59.7%) | 108 (40.3%) |
| Total Housing Units | 724 (48.7%) | 764 (51.3%) |
Occupancy by Educational Attainment in El Dorado Springs
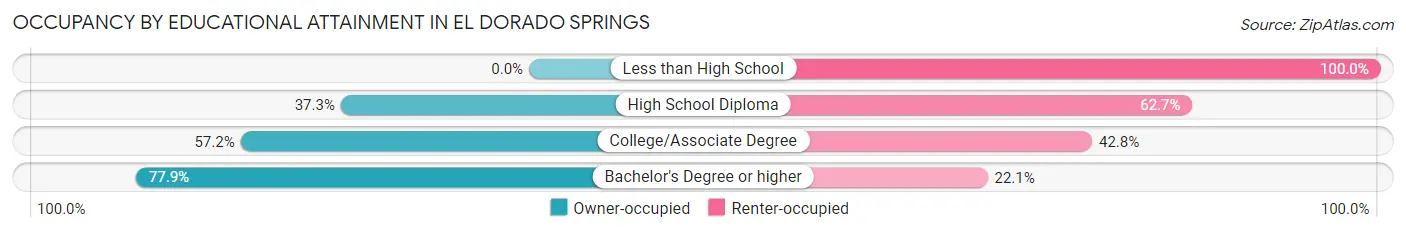
| Household Size | Owner-occupied | Renter-occupied |
| Less than High School | 0 (0.0%) | 88 (100.0%) |
| High School Diploma | 234 (37.3%) | 393 (62.7%) |
| College/Associate Degree | 310 (57.2%) | 232 (42.8%) |
| Bachelor's Degree or higher | 180 (77.9%) | 51 (22.1%) |
Occupancy by Age of Householder in El Dorado Springs
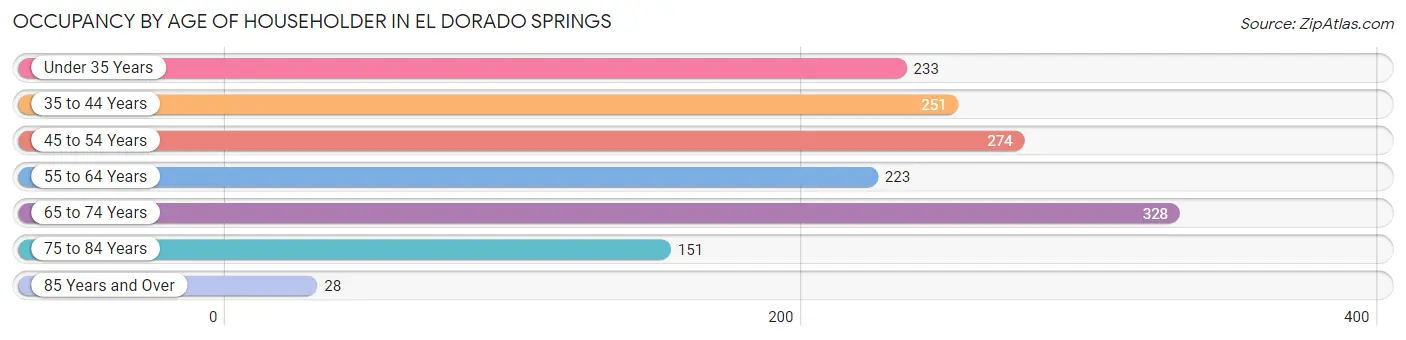
| Age Bracket | # Households | % Households |
| Under 35 Years | 233 | 15.7% |
| 35 to 44 Years | 251 | 16.9% |
| 45 to 54 Years | 274 | 18.4% |
| 55 to 64 Years | 223 | 15.0% |
| 65 to 74 Years | 328 | 22.0% |
| 75 to 84 Years | 151 | 10.2% |
| 85 Years and Over | 28 | 1.9% |
| Total | 1,488 | 100.0% |
Housing Finances in El Dorado Springs
Median Income by Occupancy in El Dorado Springs
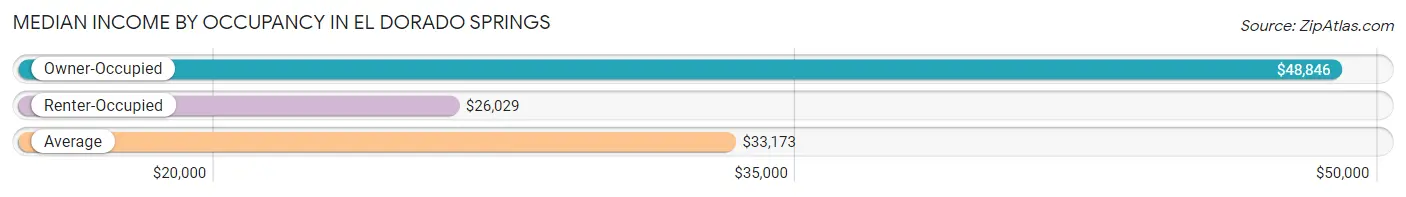
| Occupancy Type | # Households | Median Income |
| Owner-Occupied | 724 (48.7%) | $48,846 |
| Renter-Occupied | 764 (51.3%) | $26,029 |
| Average | 1,488 (100.0%) | $33,173 |
Occupancy by Householder Income Bracket in El Dorado Springs
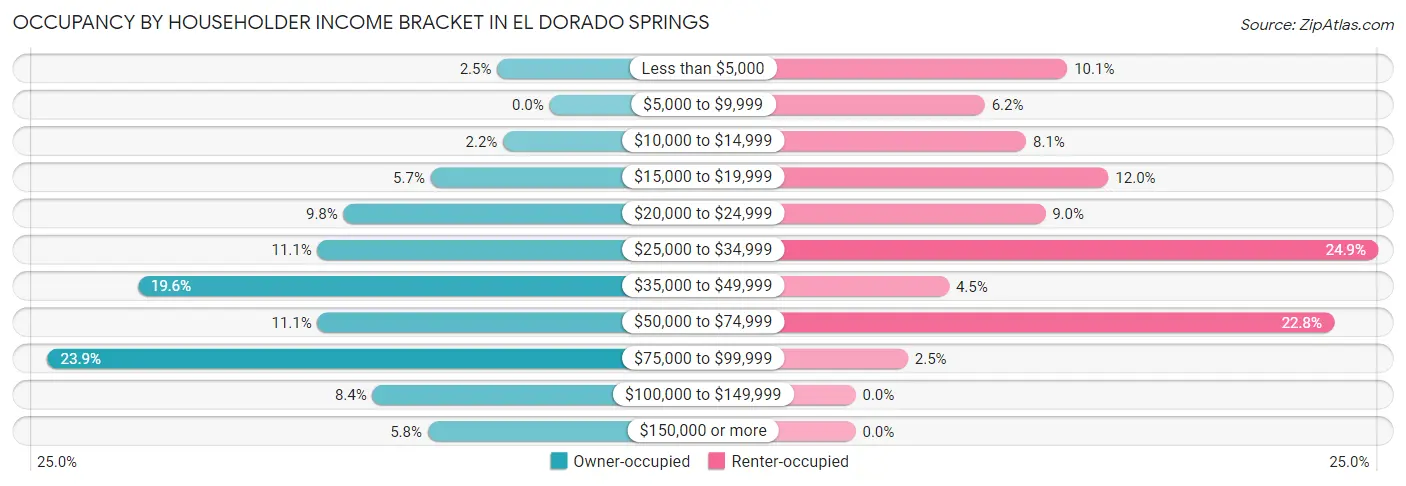
| Income Bracket | Owner-occupied | Renter-occupied |
| Less than $5,000 | 18 (2.5%) | 77 (10.1%) |
| $5,000 to $9,999 | 0 (0.0%) | 47 (6.1%) |
| $10,000 to $14,999 | 16 (2.2%) | 62 (8.1%) |
| $15,000 to $19,999 | 41 (5.7%) | 92 (12.0%) |
| $20,000 to $24,999 | 71 (9.8%) | 69 (9.0%) |
| $25,000 to $34,999 | 80 (11.1%) | 190 (24.9%) |
| $35,000 to $49,999 | 142 (19.6%) | 34 (4.4%) |
| $50,000 to $74,999 | 80 (11.1%) | 174 (22.8%) |
| $75,000 to $99,999 | 173 (23.9%) | 19 (2.5%) |
| $100,000 to $149,999 | 61 (8.4%) | 0 (0.0%) |
| $150,000 or more | 42 (5.8%) | 0 (0.0%) |
| Total | 724 (100.0%) | 764 (100.0%) |
Monthly Housing Cost Tiers in El Dorado Springs
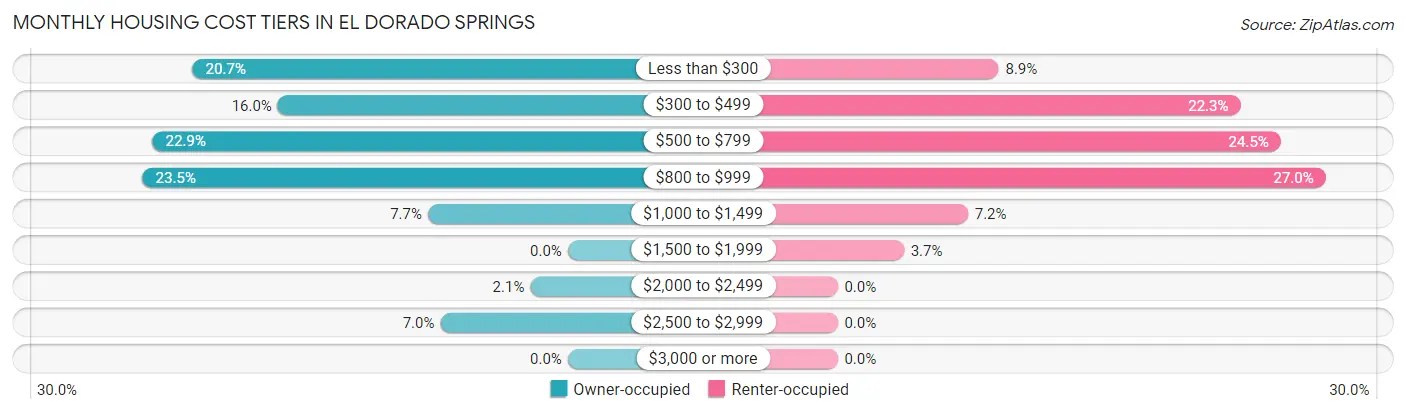
| Monthly Cost | Owner-occupied | Renter-occupied |
| Less than $300 | 150 (20.7%) | 68 (8.9%) |
| $300 to $499 | 116 (16.0%) | 170 (22.3%) |
| $500 to $799 | 166 (22.9%) | 187 (24.5%) |
| $800 to $999 | 170 (23.5%) | 206 (27.0%) |
| $1,000 to $1,499 | 56 (7.7%) | 55 (7.2%) |
| $1,500 to $1,999 | 0 (0.0%) | 28 (3.7%) |
| $2,000 to $2,499 | 15 (2.1%) | 0 (0.0%) |
| $2,500 to $2,999 | 51 (7.0%) | 0 (0.0%) |
| $3,000 or more | 0 (0.0%) | 0 (0.0%) |
| Total | 724 (100.0%) | 764 (100.0%) |
Physical Housing Characteristics in El Dorado Springs
Housing Structures in El Dorado Springs
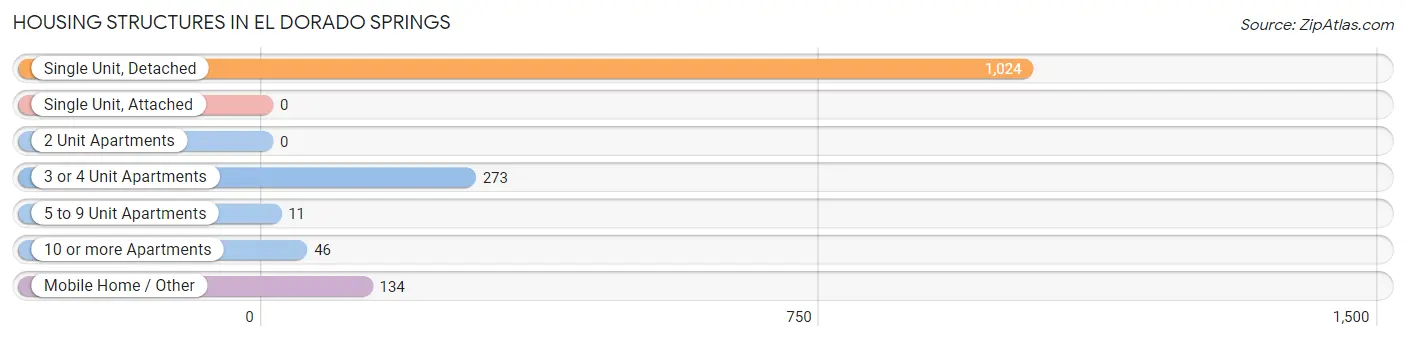
| Structure Type | # Housing Units | % Housing Units |
| Single Unit, Detached | 1,024 | 68.8% |
| Single Unit, Attached | 0 | 0.0% |
| 2 Unit Apartments | 0 | 0.0% |
| 3 or 4 Unit Apartments | 273 | 18.3% |
| 5 to 9 Unit Apartments | 11 | 0.7% |
| 10 or more Apartments | 46 | 3.1% |
| Mobile Home / Other | 134 | 9.0% |
| Total | 1,488 | 100.0% |
Housing Structures by Occupancy in El Dorado Springs
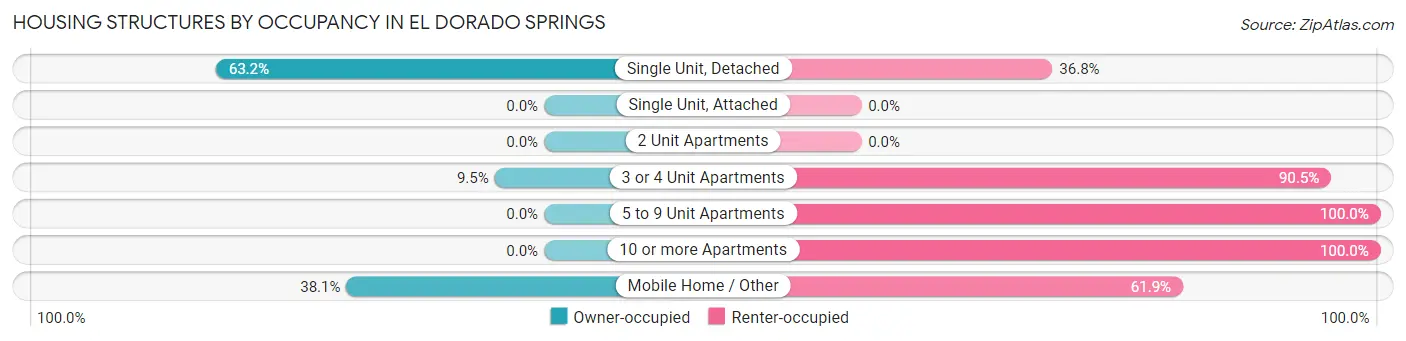
| Structure Type | Owner-occupied | Renter-occupied |
| Single Unit, Detached | 647 (63.2%) | 377 (36.8%) |
| Single Unit, Attached | 0 (0.0%) | 0 (0.0%) |
| 2 Unit Apartments | 0 (0.0%) | 0 (0.0%) |
| 3 or 4 Unit Apartments | 26 (9.5%) | 247 (90.5%) |
| 5 to 9 Unit Apartments | 0 (0.0%) | 11 (100.0%) |
| 10 or more Apartments | 0 (0.0%) | 46 (100.0%) |
| Mobile Home / Other | 51 (38.1%) | 83 (61.9%) |
| Total | 724 (48.7%) | 764 (51.3%) |
Housing Structures by Number of Rooms in El Dorado Springs
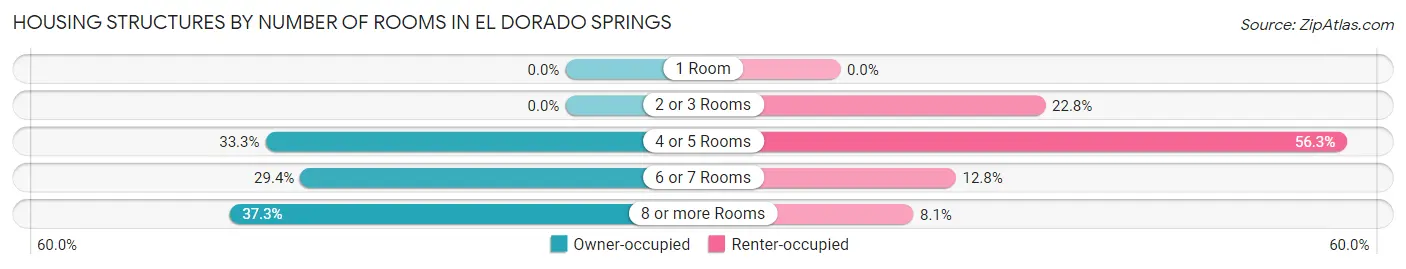
| Number of Rooms | Owner-occupied | Renter-occupied |
| 1 Room | 0 (0.0%) | 0 (0.0%) |
| 2 or 3 Rooms | 0 (0.0%) | 174 (22.8%) |
| 4 or 5 Rooms | 241 (33.3%) | 430 (56.3%) |
| 6 or 7 Rooms | 213 (29.4%) | 98 (12.8%) |
| 8 or more Rooms | 270 (37.3%) | 62 (8.1%) |
| Total | 724 (100.0%) | 764 (100.0%) |
Housing Structure by Heating Type in El Dorado Springs
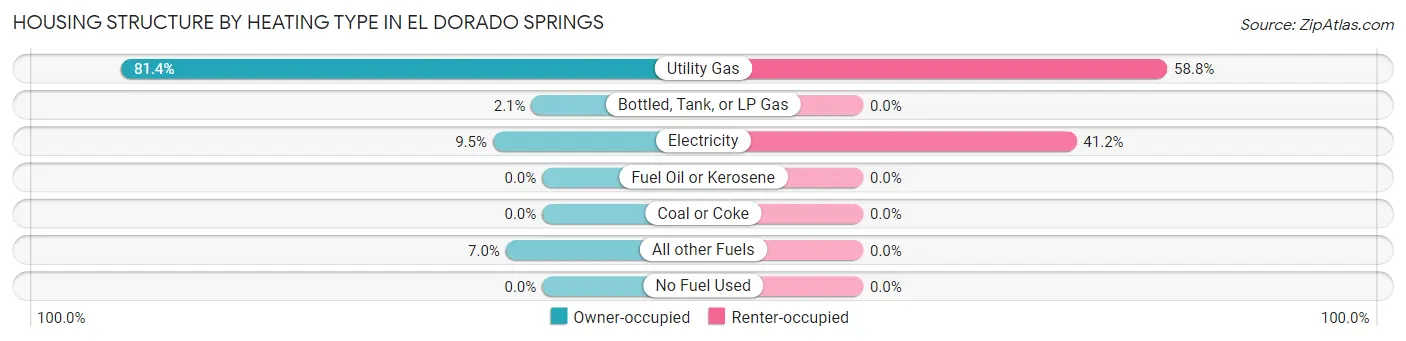
| Heating Type | Owner-occupied | Renter-occupied |
| Utility Gas | 589 (81.4%) | 449 (58.8%) |
| Bottled, Tank, or LP Gas | 15 (2.1%) | 0 (0.0%) |
| Electricity | 69 (9.5%) | 315 (41.2%) |
| Fuel Oil or Kerosene | 0 (0.0%) | 0 (0.0%) |
| Coal or Coke | 0 (0.0%) | 0 (0.0%) |
| All other Fuels | 51 (7.0%) | 0 (0.0%) |
| No Fuel Used | 0 (0.0%) | 0 (0.0%) |
| Total | 724 (100.0%) | 764 (100.0%) |
Household Vehicle Usage in El Dorado Springs
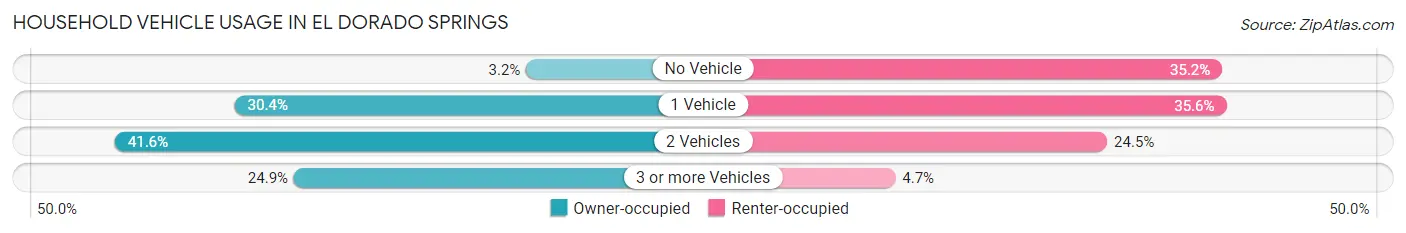
| Vehicles per Household | Owner-occupied | Renter-occupied |
| No Vehicle | 23 (3.2%) | 269 (35.2%) |
| 1 Vehicle | 220 (30.4%) | 272 (35.6%) |
| 2 Vehicles | 301 (41.6%) | 187 (24.5%) |
| 3 or more Vehicles | 180 (24.9%) | 36 (4.7%) |
| Total | 724 (100.0%) | 764 (100.0%) |
Real Estate & Mortgages in El Dorado Springs
Real Estate and Mortgage Overview in El Dorado Springs
| Characteristic | Without Mortgage | With Mortgage |
| Housing Units | 357 | 367 |
| Median Property Value | - | - |
| Median Household Income | $39,609 | $0 |
| Monthly Housing Costs | $339 | $0 |
| Real Estate Taxes | $593 | $18 |
Property Value by Mortgage Status in El Dorado Springs
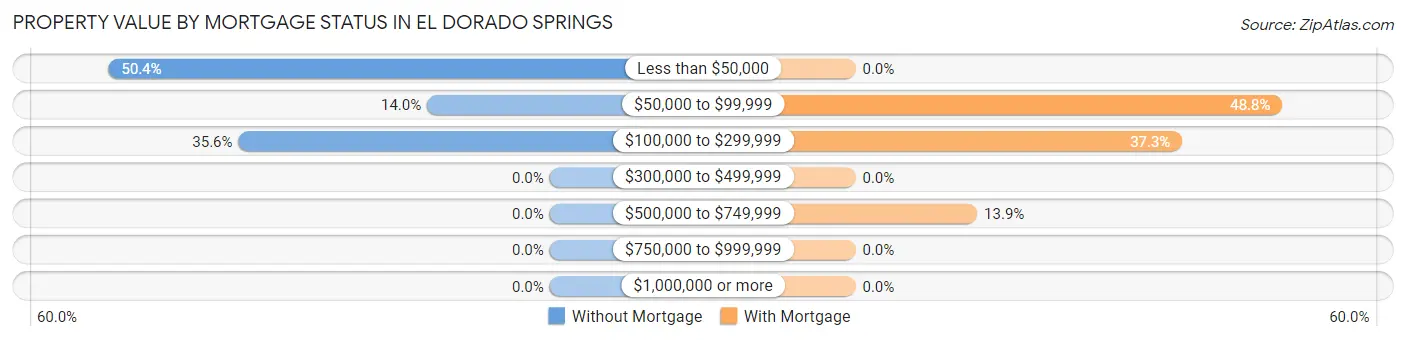
| Property Value | Without Mortgage | With Mortgage |
| Less than $50,000 | 180 (50.4%) | 0 (0.0%) |
| $50,000 to $99,999 | 50 (14.0%) | 179 (48.8%) |
| $100,000 to $299,999 | 127 (35.6%) | 137 (37.3%) |
| $300,000 to $499,999 | 0 (0.0%) | 0 (0.0%) |
| $500,000 to $749,999 | 0 (0.0%) | 51 (13.9%) |
| $750,000 to $999,999 | 0 (0.0%) | 0 (0.0%) |
| $1,000,000 or more | 0 (0.0%) | 0 (0.0%) |
| Total | 357 (100.0%) | 367 (100.0%) |
Household Income by Mortgage Status in El Dorado Springs
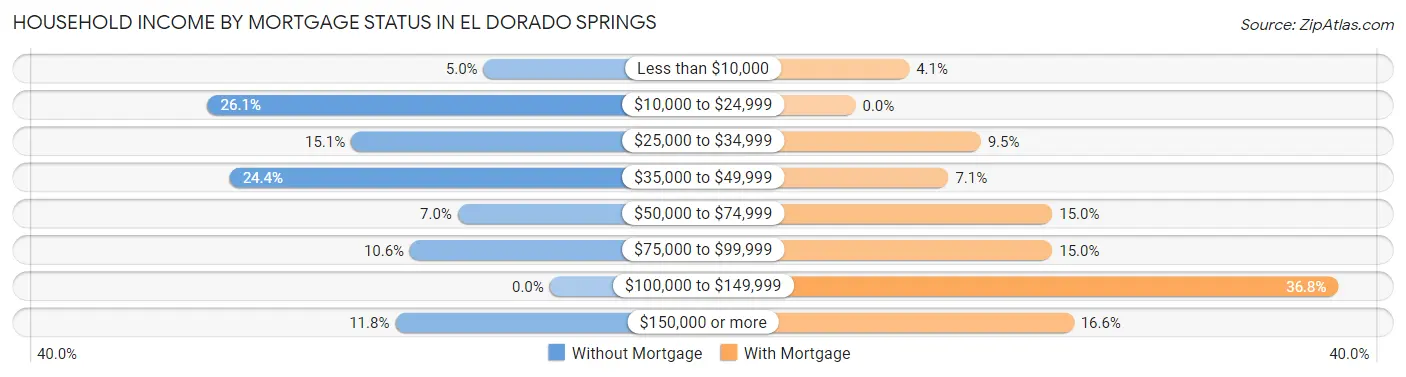
| Household Income | Without Mortgage | With Mortgage |
| Less than $10,000 | 18 (5.0%) | 15 (4.1%) |
| $10,000 to $24,999 | 93 (26.1%) | 0 (0.0%) |
| $25,000 to $34,999 | 54 (15.1%) | 35 (9.5%) |
| $35,000 to $49,999 | 87 (24.4%) | 26 (7.1%) |
| $50,000 to $74,999 | 25 (7.0%) | 55 (15.0%) |
| $75,000 to $99,999 | 38 (10.6%) | 55 (15.0%) |
| $100,000 to $149,999 | 0 (0.0%) | 135 (36.8%) |
| $150,000 or more | 42 (11.8%) | 61 (16.6%) |
| Total | 357 (100.0%) | 367 (100.0%) |
Property Value to Household Income Ratio in El Dorado Springs
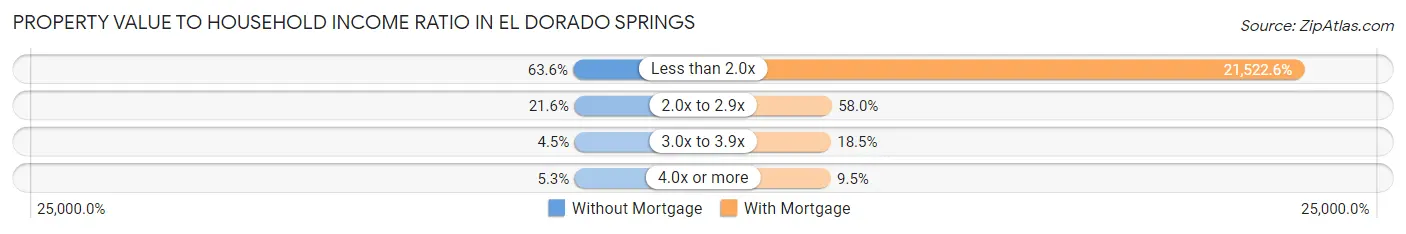
| Value-to-Income Ratio | Without Mortgage | With Mortgage |
| Less than 2.0x | 227 (63.6%) | 78,988 (21,522.6%) |
| 2.0x to 2.9x | 77 (21.6%) | 213 (58.0%) |
| 3.0x to 3.9x | 16 (4.5%) | 68 (18.5%) |
| 4.0x or more | 19 (5.3%) | 35 (9.5%) |
| Total | 357 (100.0%) | 367 (100.0%) |
Real Estate Taxes by Mortgage Status in El Dorado Springs
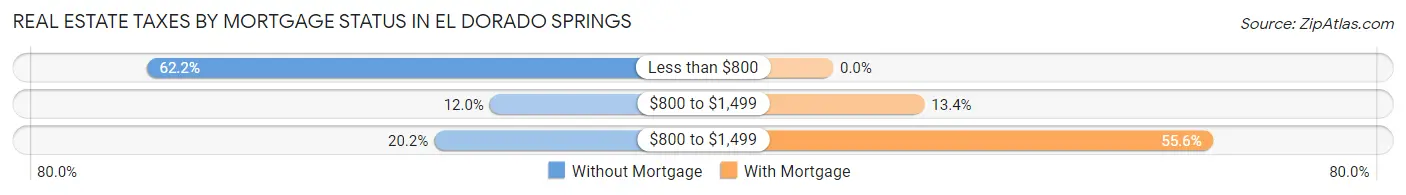
| Property Taxes | Without Mortgage | With Mortgage |
| Less than $800 | 222 (62.2%) | 0 (0.0%) |
| $800 to $1,499 | 43 (12.0%) | 49 (13.4%) |
| $800 to $1,499 | 72 (20.2%) | 204 (55.6%) |
| Total | 357 (100.0%) | 367 (100.0%) |
Health & Disability in El Dorado Springs
Health Insurance Coverage by Age in El Dorado Springs
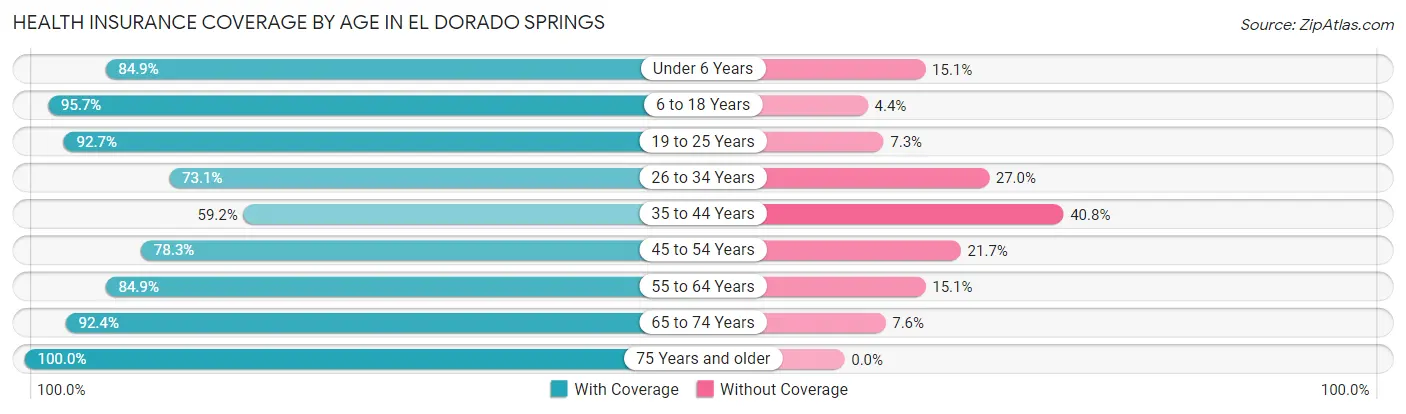
| Age Bracket | With Coverage | Without Coverage |
| Under 6 Years | 231 (84.9%) | 41 (15.1%) |
| 6 to 18 Years | 528 (95.7%) | 24 (4.3%) |
| 19 to 25 Years | 293 (92.7%) | 23 (7.3%) |
| 26 to 34 Years | 225 (73.1%) | 83 (27.0%) |
| 35 to 44 Years | 271 (59.2%) | 187 (40.8%) |
| 45 to 54 Years | 285 (78.3%) | 79 (21.7%) |
| 55 to 64 Years | 298 (84.9%) | 53 (15.1%) |
| 65 to 74 Years | 447 (92.4%) | 37 (7.6%) |
| 75 Years and older | 289 (100.0%) | 0 (0.0%) |
| Total | 2,867 (84.5%) | 527 (15.5%) |
Health Insurance Coverage by Citizenship Status in El Dorado Springs
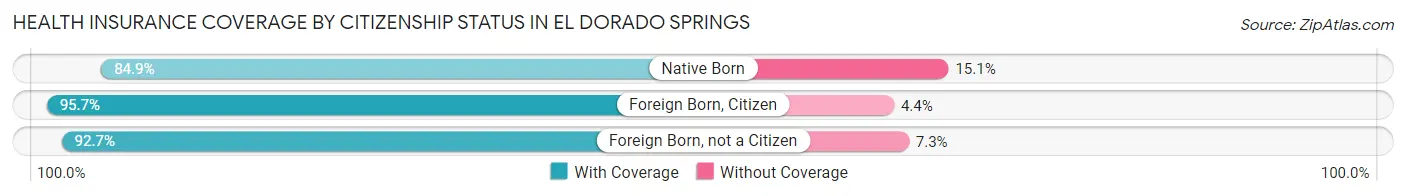
| Citizenship Status | With Coverage | Without Coverage |
| Native Born | 231 (84.9%) | 41 (15.1%) |
| Foreign Born, Citizen | 528 (95.7%) | 24 (4.3%) |
| Foreign Born, not a Citizen | 293 (92.7%) | 23 (7.3%) |
Health Insurance Coverage by Household Income in El Dorado Springs
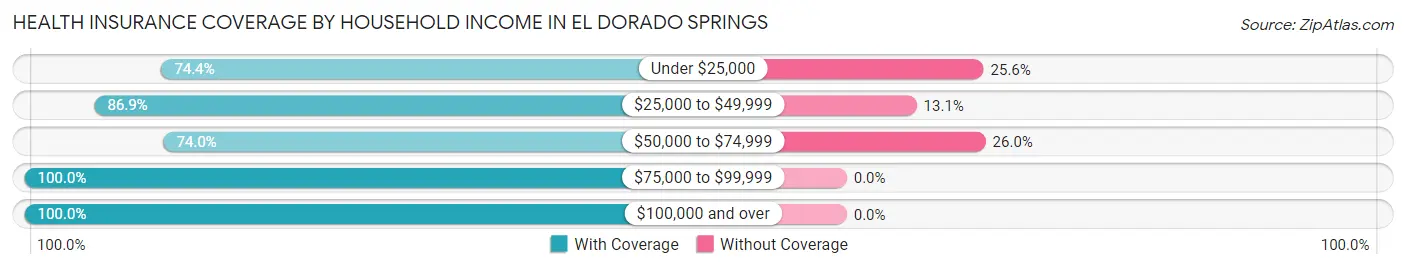
| Household Income | With Coverage | Without Coverage |
| Under $25,000 | 653 (74.4%) | 225 (25.6%) |
| $25,000 to $49,999 | 903 (86.9%) | 136 (13.1%) |
| $50,000 to $74,999 | 472 (74.0%) | 166 (26.0%) |
| $75,000 to $99,999 | 593 (100.0%) | 0 (0.0%) |
| $100,000 and over | 239 (100.0%) | 0 (0.0%) |
Public vs Private Health Insurance Coverage by Age in El Dorado Springs
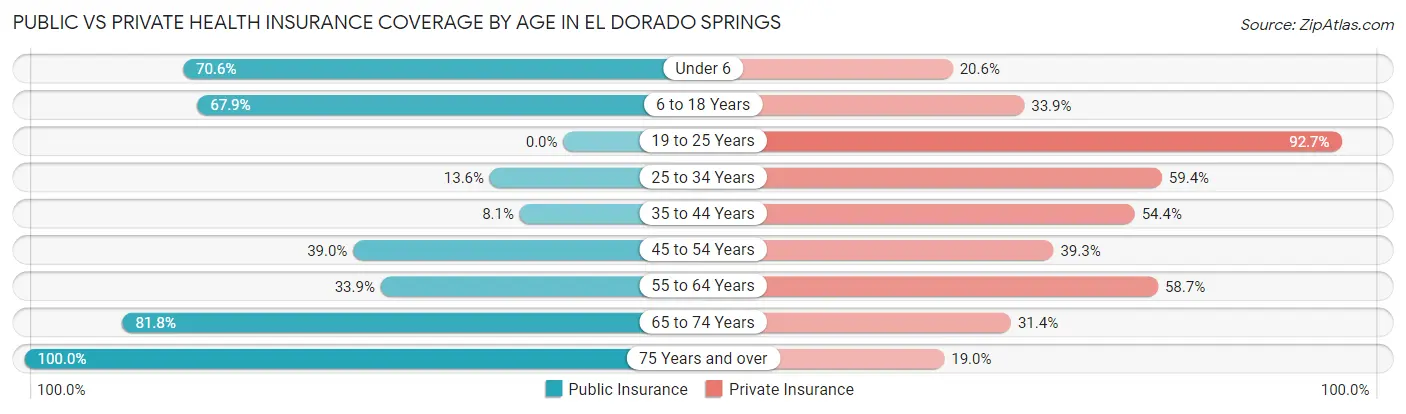
| Age Bracket | Public Insurance | Private Insurance |
| Under 6 | 192 (70.6%) | 56 (20.6%) |
| 6 to 18 Years | 375 (67.9%) | 187 (33.9%) |
| 19 to 25 Years | 0 (0.0%) | 293 (92.7%) |
| 25 to 34 Years | 42 (13.6%) | 183 (59.4%) |
| 35 to 44 Years | 37 (8.1%) | 249 (54.4%) |
| 45 to 54 Years | 142 (39.0%) | 143 (39.3%) |
| 55 to 64 Years | 119 (33.9%) | 206 (58.7%) |
| 65 to 74 Years | 396 (81.8%) | 152 (31.4%) |
| 75 Years and over | 289 (100.0%) | 55 (19.0%) |
| Total | 1,592 (46.9%) | 1,524 (44.9%) |
Disability Status by Sex by Age in El Dorado Springs
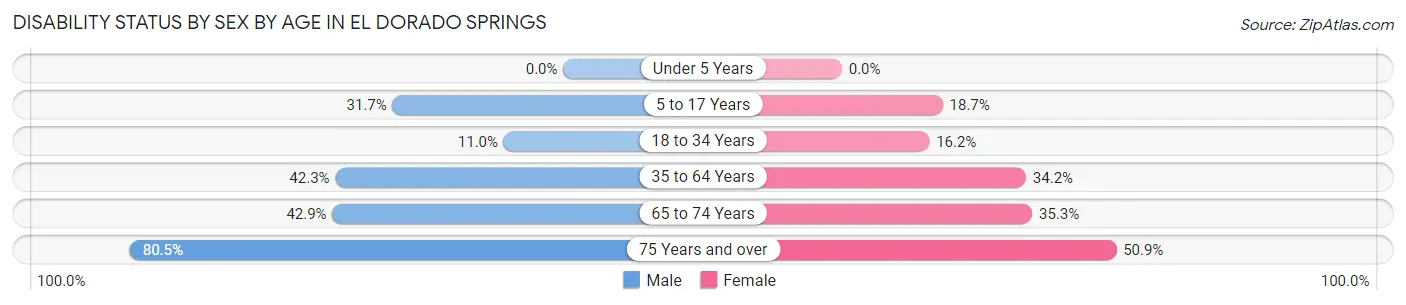
| Age Bracket | Male | Female |
| Under 5 Years | 0 (0.0%) | 0 (0.0%) |
| 5 to 17 Years | 77 (31.7%) | 58 (18.7%) |
| 18 to 34 Years | 37 (11.0%) | 54 (16.2%) |
| 35 to 64 Years | 209 (42.3%) | 232 (34.2%) |
| 65 to 74 Years | 114 (42.9%) | 77 (35.3%) |
| 75 Years and over | 103 (80.5%) | 82 (50.9%) |
Disability Class by Sex by Age in El Dorado Springs
Disability Class: Hearing Difficulty
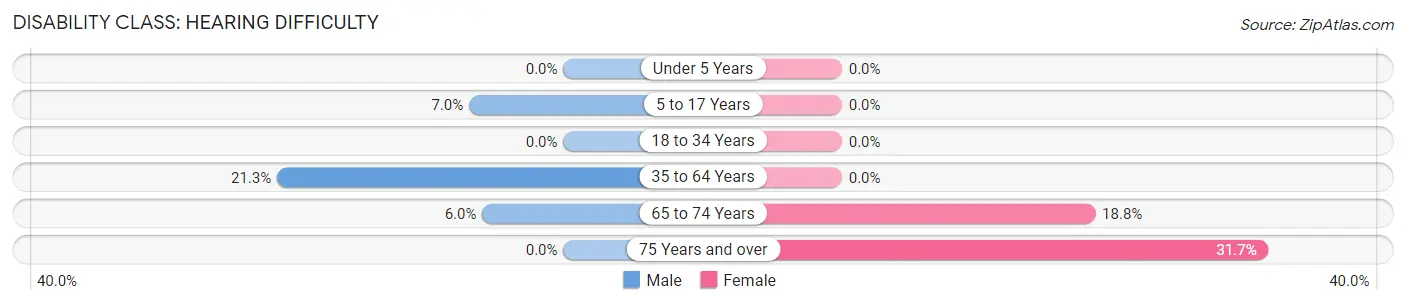
| Age Bracket | Male | Female |
| Under 5 Years | 0 (0.0%) | 0 (0.0%) |
| 5 to 17 Years | 17 (7.0%) | 0 (0.0%) |
| 18 to 34 Years | 0 (0.0%) | 0 (0.0%) |
| 35 to 64 Years | 105 (21.3%) | 0 (0.0%) |
| 65 to 74 Years | 16 (6.0%) | 41 (18.8%) |
| 75 Years and over | 0 (0.0%) | 51 (31.7%) |
Disability Class: Vision Difficulty
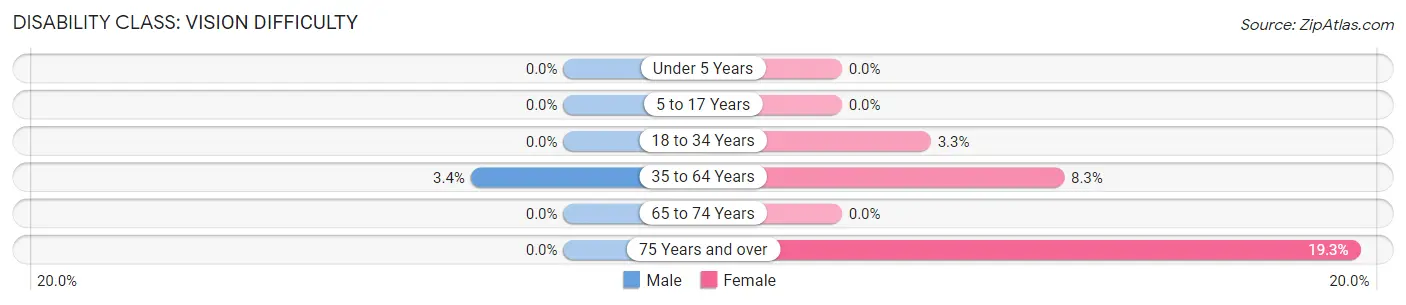
| Age Bracket | Male | Female |
| Under 5 Years | 0 (0.0%) | 0 (0.0%) |
| 5 to 17 Years | 0 (0.0%) | 0 (0.0%) |
| 18 to 34 Years | 0 (0.0%) | 11 (3.3%) |
| 35 to 64 Years | 17 (3.4%) | 56 (8.3%) |
| 65 to 74 Years | 0 (0.0%) | 0 (0.0%) |
| 75 Years and over | 0 (0.0%) | 31 (19.3%) |
Disability Class: Cognitive Difficulty
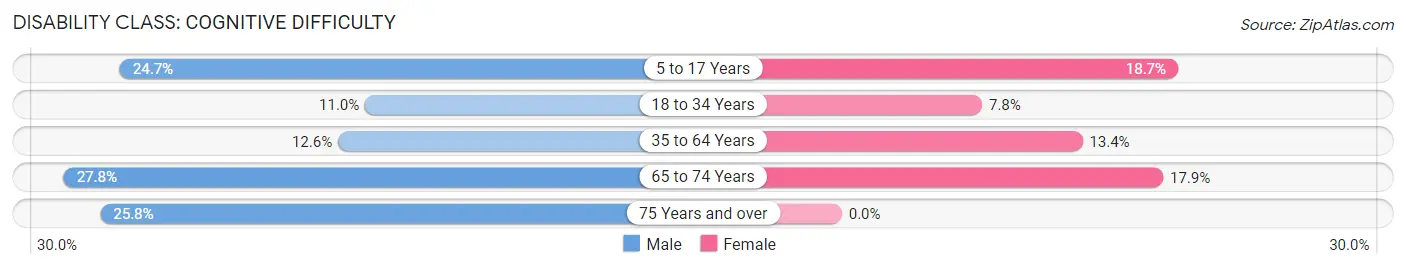
| Age Bracket | Male | Female |
| 5 to 17 Years | 60 (24.7%) | 58 (18.7%) |
| 18 to 34 Years | 37 (11.0%) | 26 (7.8%) |
| 35 to 64 Years | 62 (12.6%) | 91 (13.4%) |
| 65 to 74 Years | 74 (27.8%) | 39 (17.9%) |
| 75 Years and over | 33 (25.8%) | 0 (0.0%) |
Disability Class: Ambulatory Difficulty
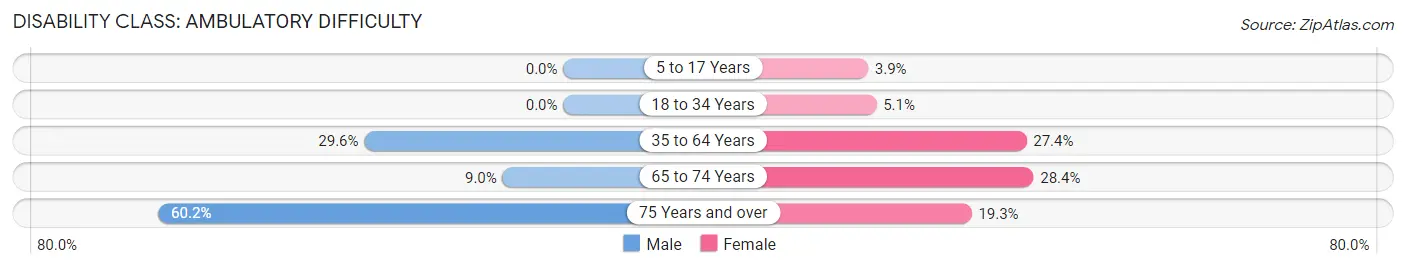
| Age Bracket | Male | Female |
| 5 to 17 Years | 0 (0.0%) | 12 (3.9%) |
| 18 to 34 Years | 0 (0.0%) | 17 (5.1%) |
| 35 to 64 Years | 146 (29.5%) | 186 (27.4%) |
| 65 to 74 Years | 24 (9.0%) | 62 (28.4%) |
| 75 Years and over | 77 (60.2%) | 31 (19.3%) |
Disability Class: Self-Care Difficulty
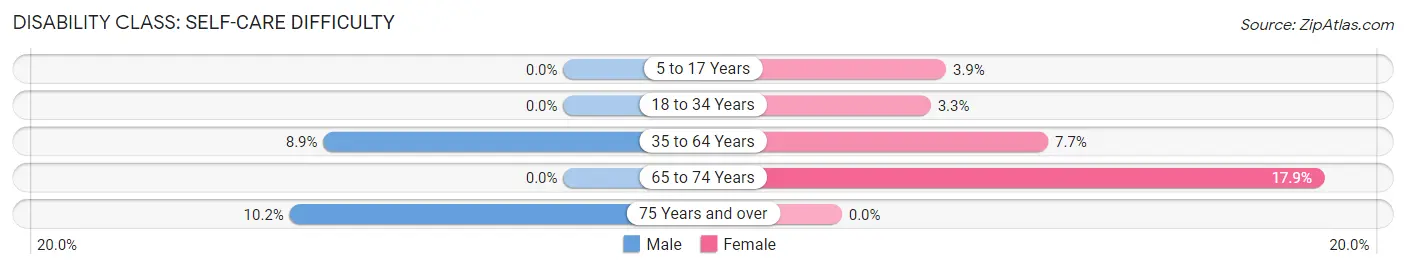
| Age Bracket | Male | Female |
| 5 to 17 Years | 0 (0.0%) | 12 (3.9%) |
| 18 to 34 Years | 0 (0.0%) | 11 (3.3%) |
| 35 to 64 Years | 44 (8.9%) | 52 (7.7%) |
| 65 to 74 Years | 0 (0.0%) | 39 (17.9%) |
| 75 Years and over | 13 (10.2%) | 0 (0.0%) |
Technology Access in El Dorado Springs
Computing Device Access in El Dorado Springs
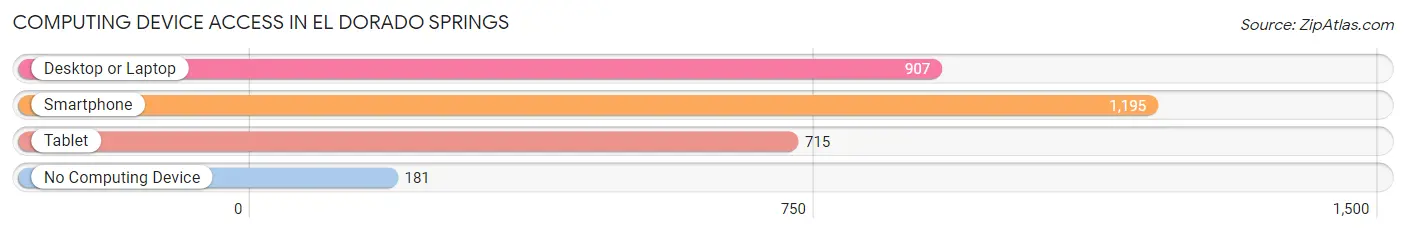
| Device Type | # Households | % Households |
| Desktop or Laptop | 907 | 61.0% |
| Smartphone | 1,195 | 80.3% |
| Tablet | 715 | 48.0% |
| No Computing Device | 181 | 12.2% |
| Total | 1,488 | 100.0% |
Internet Access in El Dorado Springs
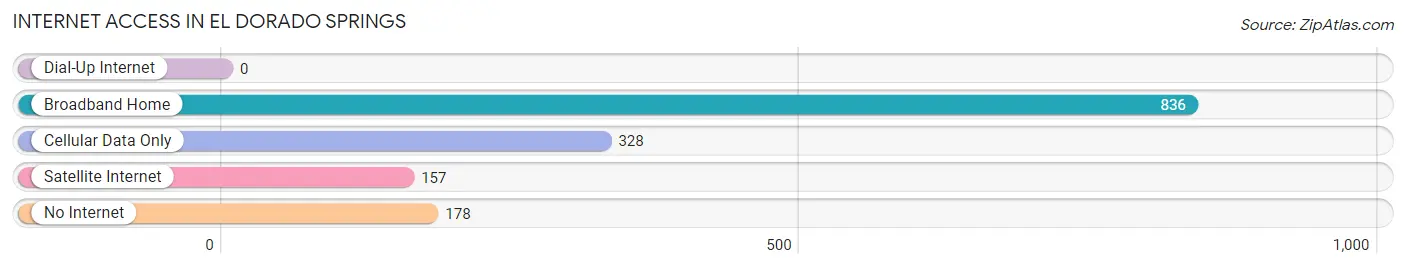
| Internet Type | # Households | % Households |
| Dial-Up Internet | 0 | 0.0% |
| Broadband Home | 836 | 56.2% |
| Cellular Data Only | 328 | 22.0% |
| Satellite Internet | 157 | 10.5% |
| No Internet | 178 | 12.0% |
| Total | 1,488 | 100.0% |
El Dorado Springs Summary
Eldorado Springs, Missouri is a small town located in Cedar County, Missouri. It is situated in the southwestern corner of the state, approximately 30 miles from the state capital of Jefferson City. The town was founded in 1881 and has a population of approximately 1,500 people.
History
Eldorado Springs was founded in 1881 by a group of settlers from the nearby town of Stockton. The settlers were looking for a place to settle and start a new life. They chose the area because of its natural springs, which were believed to have healing properties. The town was named after the mythical city of El Dorado, which was said to be a city of gold.
The town quickly grew and by the early 1900s, it had become a popular tourist destination. People from all over the country would come to visit the springs and take advantage of the healing properties of the water. The town also became known for its mineral springs, which were believed to have healing properties.
In the early 1900s, the town was also home to a number of businesses, including a hotel, a general store, a bank, and a post office. The town also had a school, a library, and a number of churches.
Geography
Eldorado Springs is located in the southwestern corner of Cedar County, Missouri. It is situated in the Ozark Mountains, which are part of the larger Ozark Plateau. The town is located at an elevation of 890 feet above sea level.
The town is surrounded by rolling hills and is home to a number of creeks and streams. The town is also home to a number of springs, which are believed to have healing properties.
Economy
The economy of Eldorado Springs is largely based on tourism. The town is home to a number of tourist attractions, including the mineral springs, which are believed to have healing properties. The town is also home to a number of businesses, including a hotel, a general store, a bank, and a post office.
The town is also home to a number of small businesses, including a number of restaurants, bars, and shops. The town is also home to a number of farms, which produce a variety of crops, including corn, soybeans, and wheat.
Demographics
As of the 2010 census, the population of Eldorado Springs was 1,500. The town is predominantly white, with approximately 95% of the population being white. The town is also home to a small Hispanic population, with approximately 4% of the population being Hispanic. The town is also home to a small African American population, with approximately 1% of the population being African American.
The median household income in Eldorado Springs is approximately $35,000. The median home value is approximately $90,000. The town has a poverty rate of approximately 15%.
Conclusion
Eldorado Springs is a small town located in Cedar County, Missouri. It was founded in 1881 and has a population of approximately 1,500 people. The town is largely based on tourism, with a number of attractions, businesses, and farms. The town is predominantly white, with a small Hispanic and African American population. The median household income is approximately $35,000 and the median home value is approximately $90,000. The town has a poverty rate of approximately 15%.
Common Questions
What is Per Capita Income in El Dorado Springs?
Per Capita income in El Dorado Springs is $20,209.
What is the Median Family Income in El Dorado Springs?
Median Family Income in El Dorado Springs is $49,904.
What is the Median Household income in El Dorado Springs?
Median Household Income in El Dorado Springs is $33,173.
What is Income or Wage Gap in El Dorado Springs?
Income or Wage Gap in El Dorado Springs is 5.4%.
Women in El Dorado Springs earn 94.6 cents for every dollar earned by a man.
What is Inequality or Gini Index in El Dorado Springs?
Inequality or Gini Index in El Dorado Springs is 0.42.
What is the Total Population of El Dorado Springs?
Total Population of El Dorado Springs is 3,531.
What is the Total Male Population of El Dorado Springs?
Total Male Population of El Dorado Springs is 1,693.
What is the Total Female Population of El Dorado Springs?
Total Female Population of El Dorado Springs is 1,838.
What is the Ratio of Males per 100 Females in El Dorado Springs?
There are 92.11 Males per 100 Females in El Dorado Springs.
What is the Ratio of Females per 100 Males in El Dorado Springs?
There are 108.56 Females per 100 Males in El Dorado Springs.
What is the Median Population Age in El Dorado Springs?
Median Population Age in El Dorado Springs is 40.8 Years.
What is the Average Family Size in El Dorado Springs
Average Family Size in El Dorado Springs is 3.1 People.
What is the Average Household Size in El Dorado Springs
Average Household Size in El Dorado Springs is 2.3 People.
How Large is the Labor Force in El Dorado Springs?
There are 1,498 People in the Labor Forcein in El Dorado Springs.
What is the Percentage of People in the Labor Force in El Dorado Springs?
52.0% of People are in the Labor Force in El Dorado Springs.
What is the Unemployment Rate in El Dorado Springs?
Unemployment Rate in El Dorado Springs is 3.7%.