Norwood, MO Map & Demographics
Norwood Map
Norwood Overview
$23,406
PER CAPITA INCOME
$43,375
AVG FAMILY INCOME
$37,614
AVG HOUSEHOLD INCOME
73.8%
WAGE / INCOME GAP [ % ]
26.2¢/ $1
WAGE / INCOME GAP [ $ ]
$13,006
FAMILY INCOME DEFICIT
0.62
INEQUALITY / GINI INDEX
862
TOTAL POPULATION
394
MALE POPULATION
468
FEMALE POPULATION
84.19
MALES / 100 FEMALES
118.78
FEMALES / 100 MALES
29.8
MEDIAN AGE
3.6
AVG FAMILY SIZE
3.2
AVG HOUSEHOLD SIZE
332
LABOR FORCE [ PEOPLE ]
55.9%
PERCENT IN LABOR FORCE
10.5%
UNEMPLOYMENT RATE
Norwood Zip Codes
Norwood Area Codes
Income in Norwood
Income Overview in Norwood
Per Capita Income in Norwood is $23,406, while median incomes of families and households are $43,375 and $37,614 respectively.
| Characteristic | Number | Measure |
| Per Capita Income | 862 | $23,406 |
| Median Family Income | 211 | $43,375 |
| Mean Family Income | 211 | $85,234 |
| Median Household Income | 265 | $37,614 |
| Mean Household Income | 265 | $73,827 |
| Income Deficit | 211 | $13,006 |
| Wage / Income Gap (%) | 862 | 73.81% |
| Wage / Income Gap ($) | 862 | 26.19¢ per $1 |
| Gini / Inequality Index | 862 | 0.62 |
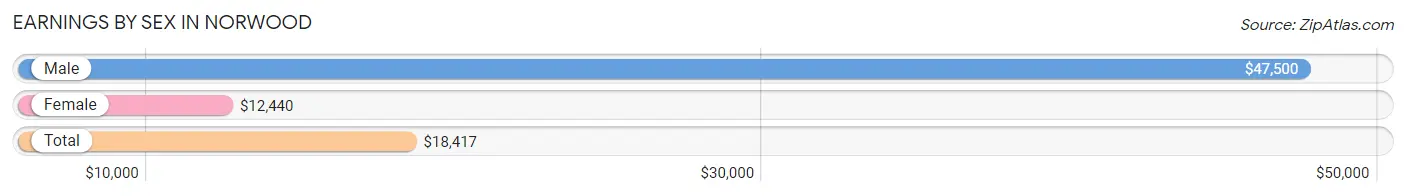
Earnings by Sex in Norwood
Average Earnings in Norwood are $18,417, $47,500 for men and $12,440 for women, a difference of 73.8%.
| Sex | Number | Average Earnings |
| Male | 118 (34.9%) | $47,500 |
| Female | 220 (65.1%) | $12,440 |
| Total | 338 (100.0%) | $18,417 |
Earnings by Sex by Income Bracket in Norwood
The most common earnings brackets in Norwood are $55,000 to $64,999 for men (21 | 17.8%) and $10,000 to $12,499 for women (42 | 19.1%).

| Income | Male | Female |
| $2,499 or less | 0 (0.0%) | 16 (7.3%) |
| $2,500 to $4,999 | 0 (0.0%) | 39 (17.7%) |
| $5,000 to $7,499 | 3 (2.5%) | 3 (1.4%) |
| $7,500 to $9,999 | 11 (9.3%) | 11 (5.0%) |
| $10,000 to $12,499 | 2 (1.7%) | 42 (19.1%) |
| $12,500 to $14,999 | 0 (0.0%) | 5 (2.3%) |
| $15,000 to $17,499 | 4 (3.4%) | 22 (10.0%) |
| $17,500 to $19,999 | 7 (5.9%) | 23 (10.4%) |
| $20,000 to $22,499 | 10 (8.5%) | 7 (3.2%) |
| $22,500 to $24,999 | 4 (3.4%) | 3 (1.4%) |
| $25,000 to $29,999 | 9 (7.6%) | 9 (4.1%) |
| $30,000 to $34,999 | 0 (0.0%) | 9 (4.1%) |
| $35,000 to $39,999 | 0 (0.0%) | 8 (3.6%) |
| $40,000 to $44,999 | 7 (5.9%) | 4 (1.8%) |
| $45,000 to $49,999 | 12 (10.2%) | 0 (0.0%) |
| $50,000 to $54,999 | 6 (5.1%) | 3 (1.4%) |
| $55,000 to $64,999 | 21 (17.8%) | 13 (5.9%) |
| $65,000 to $74,999 | 17 (14.4%) | 0 (0.0%) |
| $75,000 to $99,999 | 2 (1.7%) | 0 (0.0%) |
| $100,000+ | 3 (2.5%) | 3 (1.4%) |
| Total | 118 (100.0%) | 220 (100.0%) |
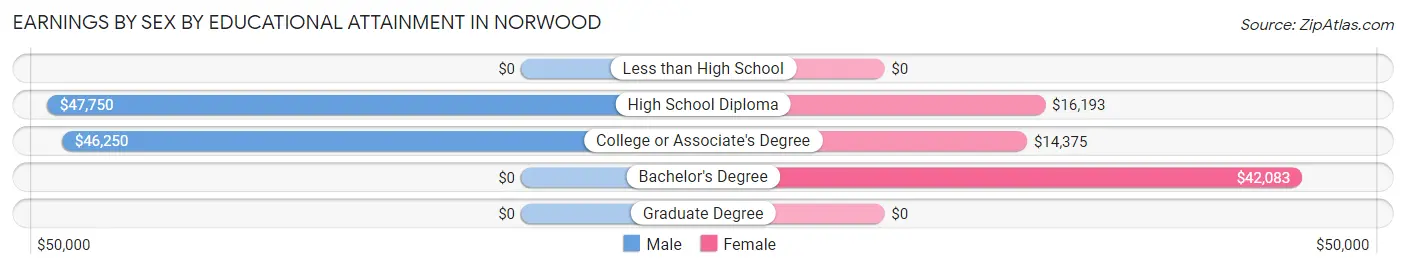
Earnings by Sex by Educational Attainment in Norwood
Average earnings in Norwood are $47,625 for men and $16,818 for women, a difference of 64.7%. Men with an educational attainment of high school diploma enjoy the highest average annual earnings of $47,750, while those with college or associate's degree education earn the least with $46,250. Women with an educational attainment of bachelor's degree earn the most with the average annual earnings of $42,083, while those with college or associate's degree education have the smallest earnings of $14,375.
| Educational Attainment | Male Income | Female Income |
| Less than High School | - | - |
| High School Diploma | $47,750 | $16,193 |
| College or Associate's Degree | $46,250 | $14,375 |
| Bachelor's Degree | - | - |
| Graduate Degree | - | - |
| Total | $47,625 | $16,818 |
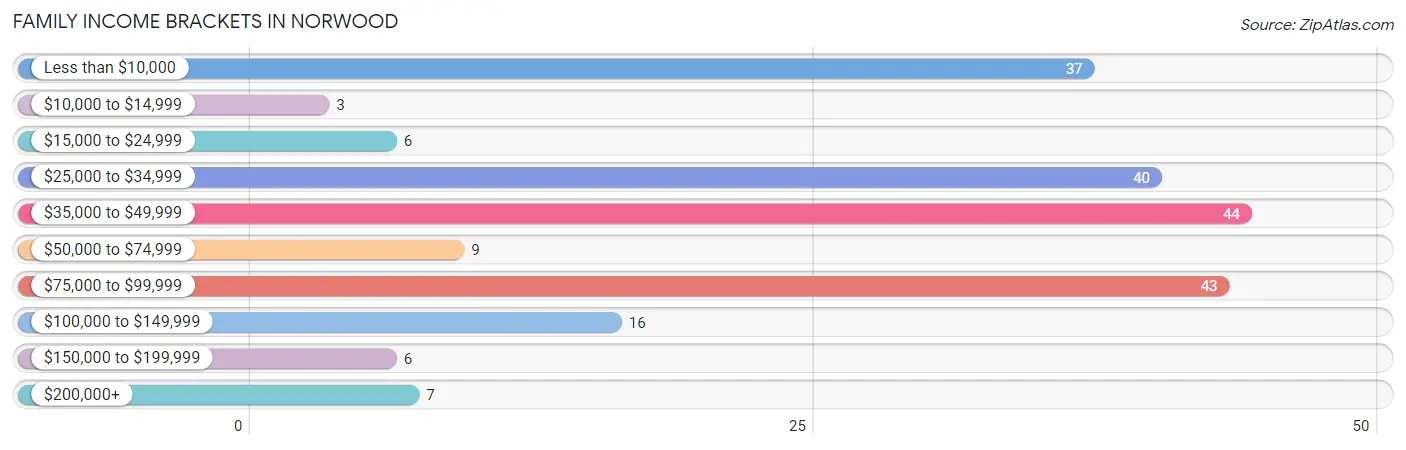
Family Income in Norwood
Family Income Brackets in Norwood
According to the Norwood family income data, there are 44 families falling into the $35,000 to $49,999 income range, which is the most common income bracket and makes up 20.8% of all families. Conversely, the $10,000 to $14,999 income bracket is the least frequent group with only 3 families (1.4%) belonging to this category.
| Income Bracket | # Families | % Families |
| Less than $10,000 | 37 | 17.5% |
| $10,000 to $14,999 | 3 | 1.4% |
| $15,000 to $24,999 | 6 | 2.8% |
| $25,000 to $34,999 | 40 | 19.0% |
| $35,000 to $49,999 | 44 | 20.9% |
| $50,000 to $74,999 | 9 | 4.3% |
| $75,000 to $99,999 | 43 | 20.4% |
| $100,000 to $149,999 | 16 | 7.6% |
| $150,000 to $199,999 | 6 | 2.8% |
| $200,000+ | 7 | 3.3% |
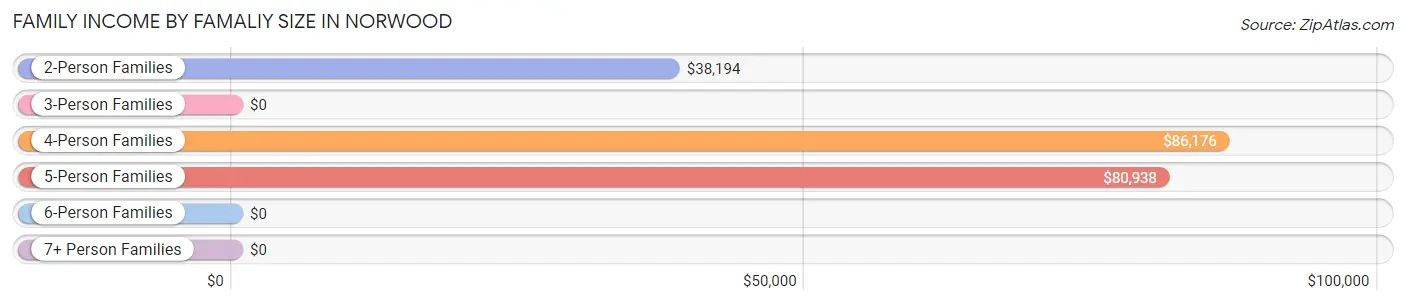
Family Income by Famaliy Size in Norwood
4-person families (34 | 16.1%) account for the highest median family income in Norwood with $86,176 per family, while 4-person families (34 | 16.1%) have the highest median income of $21,544 per family member.
| Income Bracket | # Families | Median Income |
| 2-Person Families | 95 (45.0%) | $38,194 |
| 3-Person Families | 57 (27.0%) | $0 |
| 4-Person Families | 34 (16.1%) | $86,176 |
| 5-Person Families | 9 (4.3%) | $80,938 |
| 6-Person Families | 3 (1.4%) | $0 |
| 7+ Person Families | 13 (6.2%) | $0 |
| Total | 211 (100.0%) | $43,375 |
Family Income by Number of Earners in Norwood
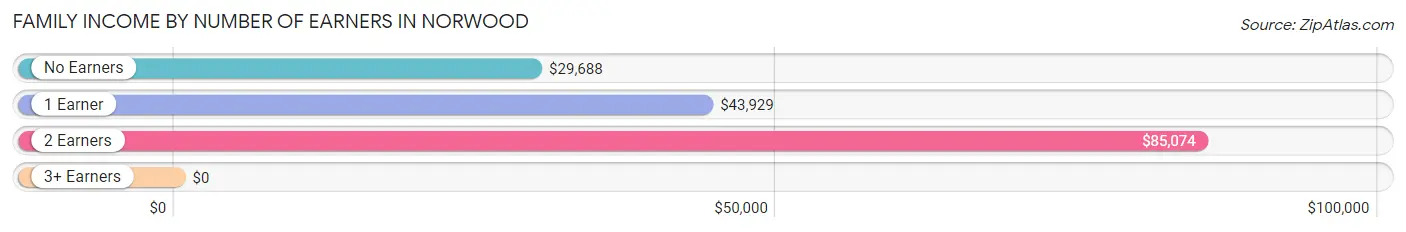
| Number of Earners | # Families | Median Income |
| No Earners | 44 (20.8%) | $29,688 |
| 1 Earner | 92 (43.6%) | $43,929 |
| 2 Earners | 67 (31.8%) | $85,074 |
| 3+ Earners | 8 (3.8%) | $0 |
| Total | 211 (100.0%) | $43,375 |
Household Income in Norwood
Household Income Brackets in Norwood
With 54 households falling in the category, the $25,000 to $34,999 income range is the most frequent in Norwood, accounting for 20.4% of all households. In contrast, only 6 households (2.3%) fall into the $150,000 to $199,999 income bracket, making it the least populous group.
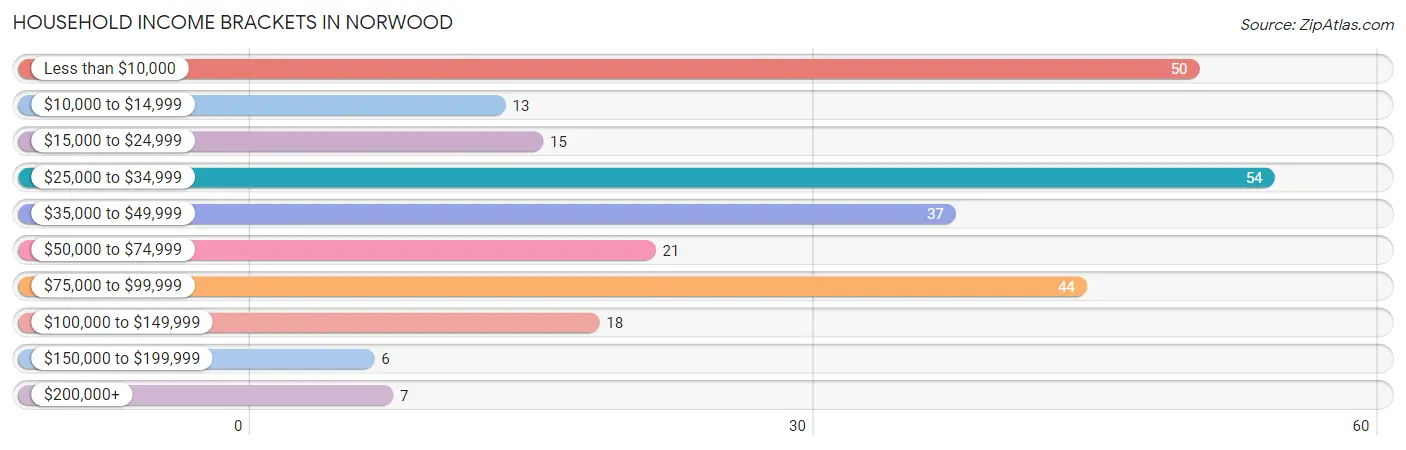
| Income Bracket | # Households | % Households |
| Less than $10,000 | 50 | 18.9% |
| $10,000 to $14,999 | 13 | 4.9% |
| $15,000 to $24,999 | 15 | 5.7% |
| $25,000 to $34,999 | 54 | 20.4% |
| $35,000 to $49,999 | 37 | 14.0% |
| $50,000 to $74,999 | 21 | 7.9% |
| $75,000 to $99,999 | 44 | 16.6% |
| $100,000 to $149,999 | 18 | 6.8% |
| $150,000 to $199,999 | 6 | 2.3% |
| $200,000+ | 7 | 2.6% |
Household Income by Householder Age in Norwood
The median household income in Norwood is $37,614, with the highest median household income of $36,250 found in the 25 to 44 years age bracket for the primary householder. A total of 90 households (34.0%) fall into this category. Meanwhile, the 15 to 24 years age bracket for the primary householder has the lowest median household income of $0, with 16 households (6.0%) in this group.
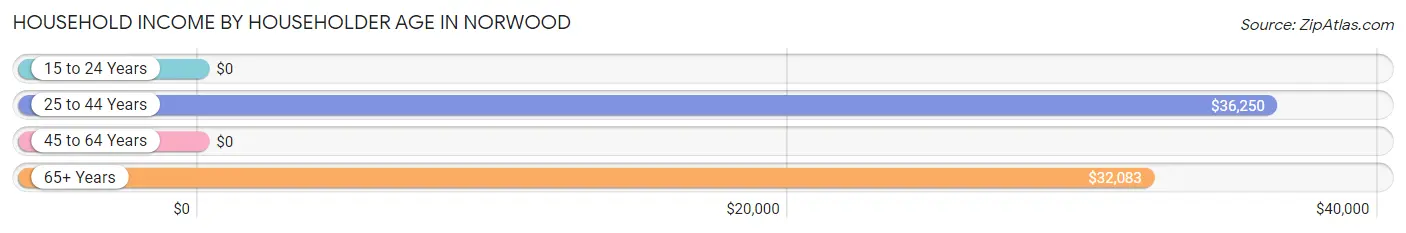
| Income Bracket | # Households | Median Income |
| 15 to 24 Years | 16 (6.0%) | $0 |
| 25 to 44 Years | 90 (34.0%) | $36,250 |
| 45 to 64 Years | 95 (35.8%) | $0 |
| 65+ Years | 64 (24.1%) | $32,083 |
| Total | 265 (100.0%) | $37,614 |
Poverty in Norwood
Income Below Poverty by Sex and Age in Norwood
With 35.2% poverty level for males and 33.5% for females among the residents of Norwood, 16 and 17 year old males and 25 to 34 year old females are the most vulnerable to poverty, with 8 males (100.0%) and 36 females (66.7%) in their respective age groups living below the poverty level.
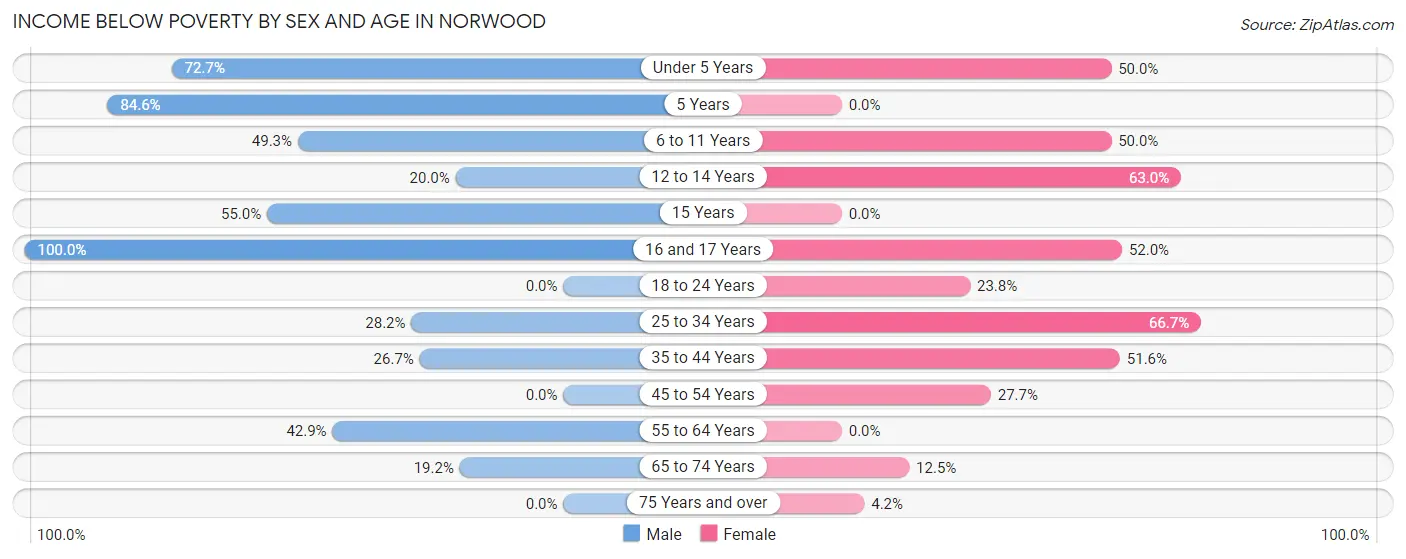
| Age Bracket | Male | Female |
| Under 5 Years | 24 (72.7%) | 6 (50.0%) |
| 5 Years | 11 (84.6%) | 0 (0.0%) |
| 6 to 11 Years | 34 (49.3%) | 30 (50.0%) |
| 12 to 14 Years | 4 (20.0%) | 17 (63.0%) |
| 15 Years | 11 (55.0%) | 0 (0.0%) |
| 16 and 17 Years | 8 (100.0%) | 13 (52.0%) |
| 18 to 24 Years | 0 (0.0%) | 20 (23.8%) |
| 25 to 34 Years | 11 (28.2%) | 36 (66.7%) |
| 35 to 44 Years | 12 (26.7%) | 16 (51.6%) |
| 45 to 54 Years | 0 (0.0%) | 13 (27.7%) |
| 55 to 64 Years | 18 (42.9%) | 0 (0.0%) |
| 65 to 74 Years | 5 (19.2%) | 4 (12.5%) |
| 75 Years and over | 0 (0.0%) | 1 (4.2%) |
| Total | 138 (35.2%) | 156 (33.5%) |
Income Above Poverty by Sex and Age in Norwood
According to the poverty statistics in Norwood, males aged 18 to 24 years and females aged 5 years are the age groups that are most secure financially, with 100.0% of males and 100.0% of females in these age groups living above the poverty line.
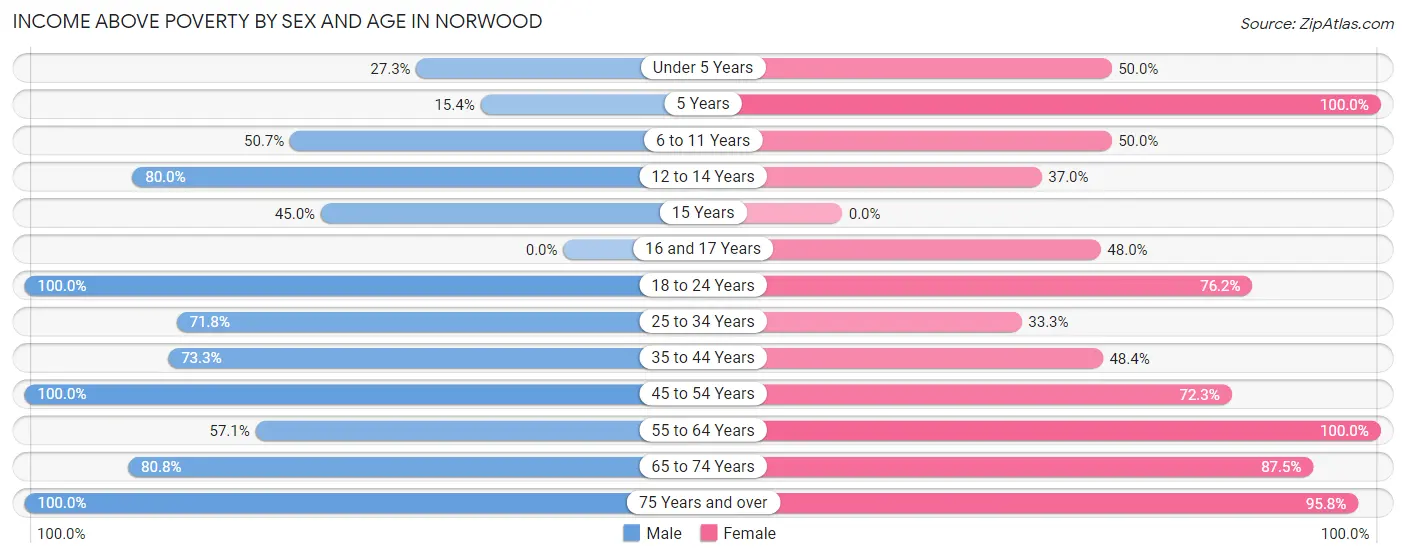
| Age Bracket | Male | Female |
| Under 5 Years | 9 (27.3%) | 6 (50.0%) |
| 5 Years | 2 (15.4%) | 11 (100.0%) |
| 6 to 11 Years | 35 (50.7%) | 30 (50.0%) |
| 12 to 14 Years | 16 (80.0%) | 10 (37.0%) |
| 15 Years | 9 (45.0%) | 0 (0.0%) |
| 16 and 17 Years | 0 (0.0%) | 12 (48.0%) |
| 18 to 24 Years | 10 (100.0%) | 64 (76.2%) |
| 25 to 34 Years | 28 (71.8%) | 18 (33.3%) |
| 35 to 44 Years | 33 (73.3%) | 15 (48.4%) |
| 45 to 54 Years | 41 (100.0%) | 34 (72.3%) |
| 55 to 64 Years | 24 (57.1%) | 59 (100.0%) |
| 65 to 74 Years | 21 (80.8%) | 28 (87.5%) |
| 75 Years and over | 26 (100.0%) | 23 (95.8%) |
| Total | 254 (64.8%) | 310 (66.5%) |
Income Below Poverty Among Married-Couple Families in Norwood
The poverty statistics for married-couple families in Norwood show that 9.4% or 11 of the total 117 families live below the poverty line. Families with 5 or more children have the highest poverty rate of 100.0%, comprising of 9 families. On the other hand, families with no children have the lowest poverty rate of 0.0%, which includes 0 families.
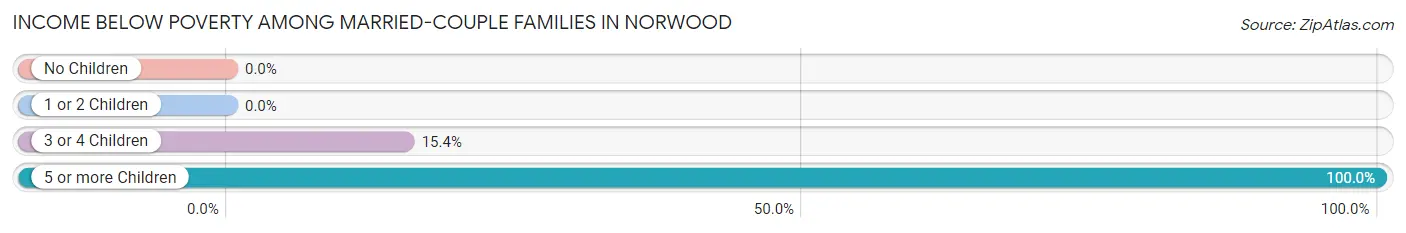
| Children | Above Poverty | Below Poverty |
| No Children | 70 (100.0%) | 0 (0.0%) |
| 1 or 2 Children | 25 (100.0%) | 0 (0.0%) |
| 3 or 4 Children | 11 (84.6%) | 2 (15.4%) |
| 5 or more Children | 0 (0.0%) | 9 (100.0%) |
| Total | 106 (90.6%) | 11 (9.4%) |
Income Below Poverty Among Single-Parent Households in Norwood
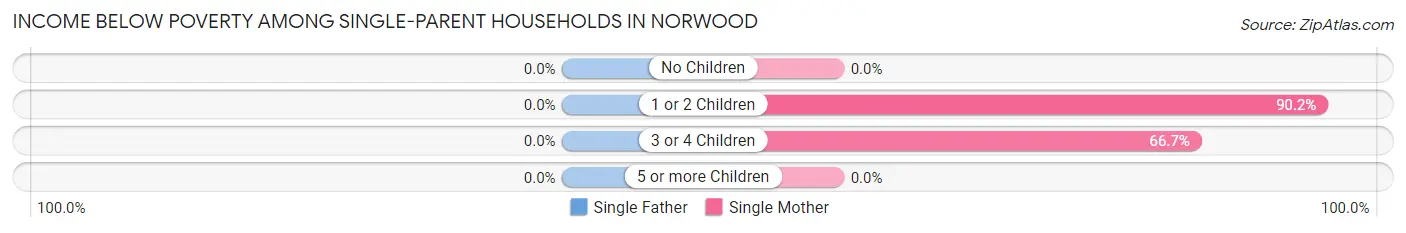
| Children | Single Father | Single Mother |
| No Children | 0 (0.0%) | 0 (0.0%) |
| 1 or 2 Children | 0 (0.0%) | 37 (90.2%) |
| 3 or 4 Children | 0 (0.0%) | 6 (66.7%) |
| 5 or more Children | 0 (0.0%) | 0 (0.0%) |
| Total | 0 (0.0%) | 43 (52.4%) |
Income Below Poverty Among Married-Couple vs Single-Parent Households in Norwood
The poverty data for Norwood shows that 11 of the married-couple family households (9.4%) and 43 of the single-parent households (45.7%) are living below the poverty level. Within the married-couple family households, those with 5 or more children have the highest poverty rate, with 9 households (100.0%) falling below the poverty line. Among the single-parent households, those with 1 or 2 children have the highest poverty rate, with 37 household (69.8%) living below poverty.
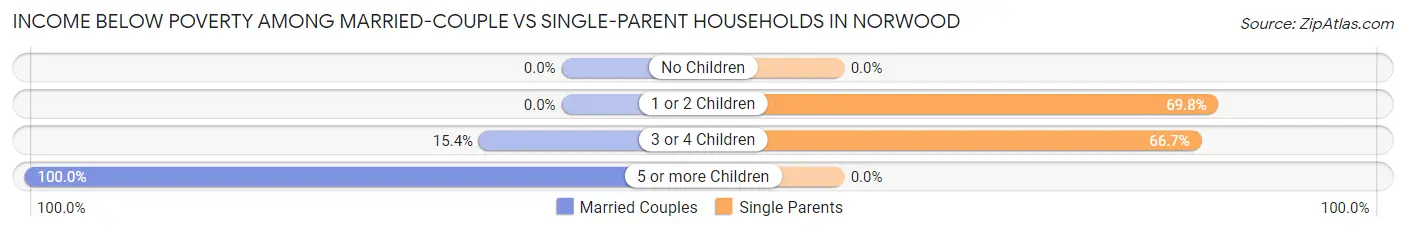
| Children | Married-Couple Families | Single-Parent Households |
| No Children | 0 (0.0%) | 0 (0.0%) |
| 1 or 2 Children | 0 (0.0%) | 37 (69.8%) |
| 3 or 4 Children | 2 (15.4%) | 6 (66.7%) |
| 5 or more Children | 9 (100.0%) | 0 (0.0%) |
| Total | 11 (9.4%) | 43 (45.7%) |
Race in Norwood
The most populous races in Norwood are White / Caucasian (793 | 92.0%), Hispanic or Latino (54 | 6.3%), and Two or more Races (50 | 5.8%).
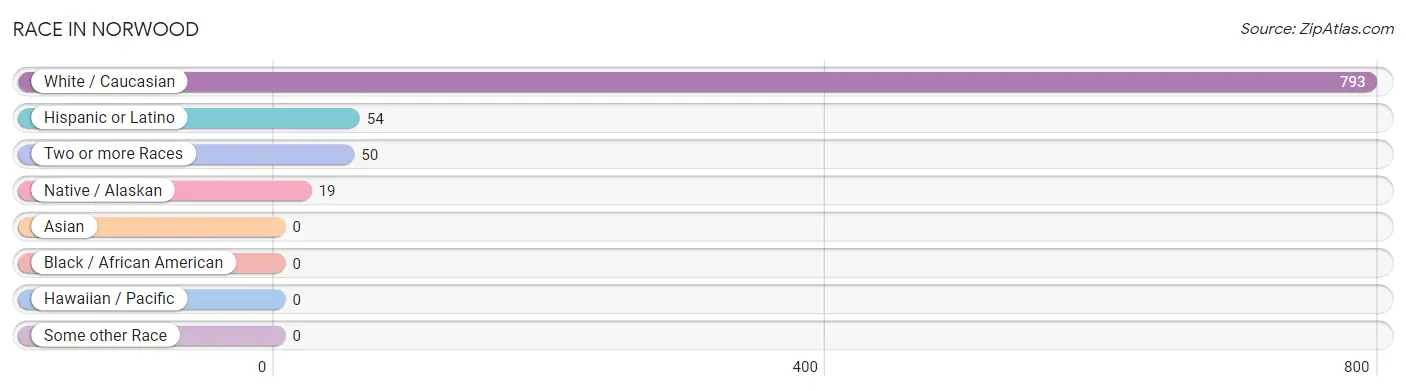
| Race | # Population | % Population |
| Asian | 0 | 0.0% |
| Black / African American | 0 | 0.0% |
| Hawaiian / Pacific | 0 | 0.0% |
| Hispanic or Latino | 54 | 6.3% |
| Native / Alaskan | 19 | 2.2% |
| White / Caucasian | 793 | 92.0% |
| Two or more Races | 50 | 5.8% |
| Some other Race | 0 | 0.0% |
| Total | 862 | 100.0% |
Ancestry in Norwood
The most populous ancestries reported in Norwood are American (118 | 13.7%), Irish (100 | 11.6%), English (72 | 8.4%), Spaniard (54 | 6.3%), and German (53 | 6.1%), together accounting for 46.1% of all Norwood residents.
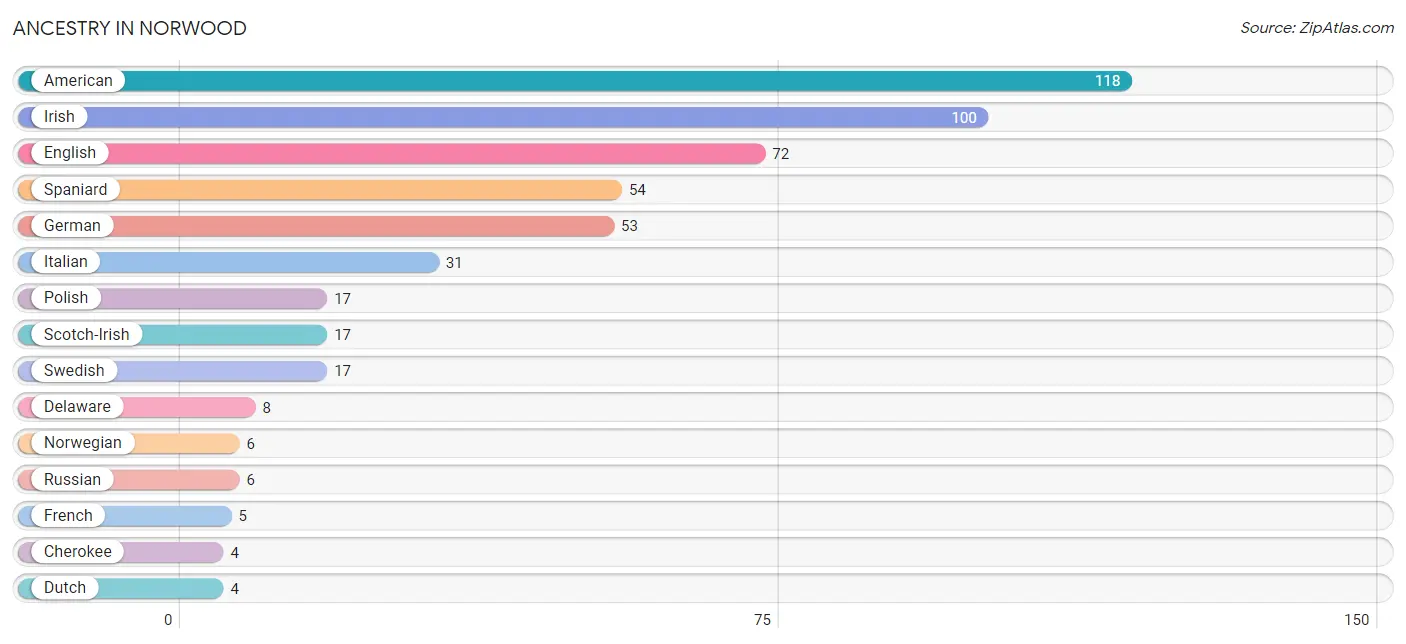
| Ancestry | # Population | % Population |
| American | 118 | 13.7% |
| Blackfeet | 1 | 0.1% |
| Cherokee | 4 | 0.5% |
| Delaware | 8 | 0.9% |
| Dutch | 4 | 0.5% |
| English | 72 | 8.4% |
| French | 5 | 0.6% |
| German | 53 | 6.1% |
| Irish | 100 | 11.6% |
| Italian | 31 | 3.6% |
| Norwegian | 6 | 0.7% |
| Polish | 17 | 2.0% |
| Russian | 6 | 0.7% |
| Scotch-Irish | 17 | 2.0% |
| Scottish | 4 | 0.5% |
| Spaniard | 54 | 6.3% |
| Swedish | 17 | 2.0% | View All 17 Rows |
Immigrants in Norwood

| Immigration Origin | # Population | % Population | View All 0 Rows |
Sex and Age in Norwood
Sex and Age in Norwood
The most populous age groups in Norwood are 10 to 14 Years (52 | 13.2%) for men and 20 to 24 Years (83 | 17.7%) for women.
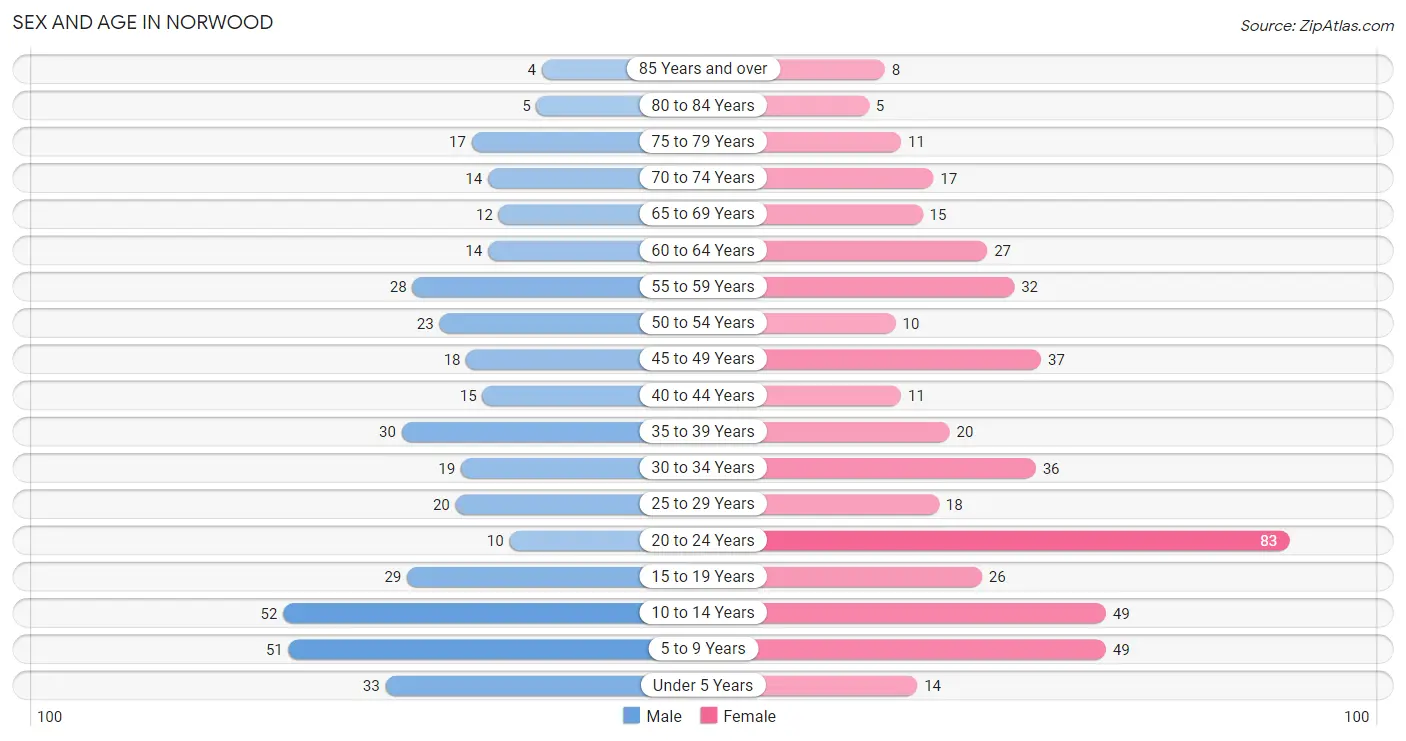
| Age Bracket | Male | Female |
| Under 5 Years | 33 (8.4%) | 14 (3.0%) |
| 5 to 9 Years | 51 (12.9%) | 49 (10.5%) |
| 10 to 14 Years | 52 (13.2%) | 49 (10.5%) |
| 15 to 19 Years | 29 (7.4%) | 26 (5.6%) |
| 20 to 24 Years | 10 (2.5%) | 83 (17.7%) |
| 25 to 29 Years | 20 (5.1%) | 18 (3.8%) |
| 30 to 34 Years | 19 (4.8%) | 36 (7.7%) |
| 35 to 39 Years | 30 (7.6%) | 20 (4.3%) |
| 40 to 44 Years | 15 (3.8%) | 11 (2.4%) |
| 45 to 49 Years | 18 (4.6%) | 37 (7.9%) |
| 50 to 54 Years | 23 (5.8%) | 10 (2.1%) |
| 55 to 59 Years | 28 (7.1%) | 32 (6.8%) |
| 60 to 64 Years | 14 (3.5%) | 27 (5.8%) |
| 65 to 69 Years | 12 (3.0%) | 15 (3.2%) |
| 70 to 74 Years | 14 (3.5%) | 17 (3.6%) |
| 75 to 79 Years | 17 (4.3%) | 11 (2.4%) |
| 80 to 84 Years | 5 (1.3%) | 5 (1.1%) |
| 85 Years and over | 4 (1.0%) | 8 (1.7%) |
| Total | 394 (100.0%) | 468 (100.0%) |
Families and Households in Norwood
Median Family Size in Norwood
The median family size in Norwood is 3.64 persons per family, with married-couple families (117 | 55.4%) accounting for the largest median family size of 3.88 persons per family. On the other hand, single male/father families (12 | 5.7%) represent the smallest median family size with 3.17 persons per family.
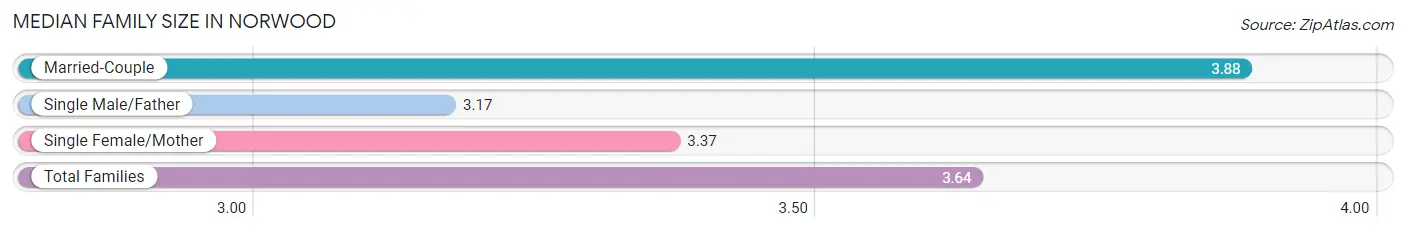
| Family Type | # Families | Family Size |
| Married-Couple | 117 (55.4%) | 3.88 |
| Single Male/Father | 12 (5.7%) | 3.17 |
| Single Female/Mother | 82 (38.9%) | 3.37 |
| Total Families | 211 (100.0%) | 3.64 |
Median Household Size in Norwood
The median household size in Norwood is 3.25 persons per household, with single male/father households (12 | 4.5%) accounting for the largest median household size of 4.08 persons per household. non-family households (54 | 20.4%) represent the smallest median household size with 1.09 persons per household.
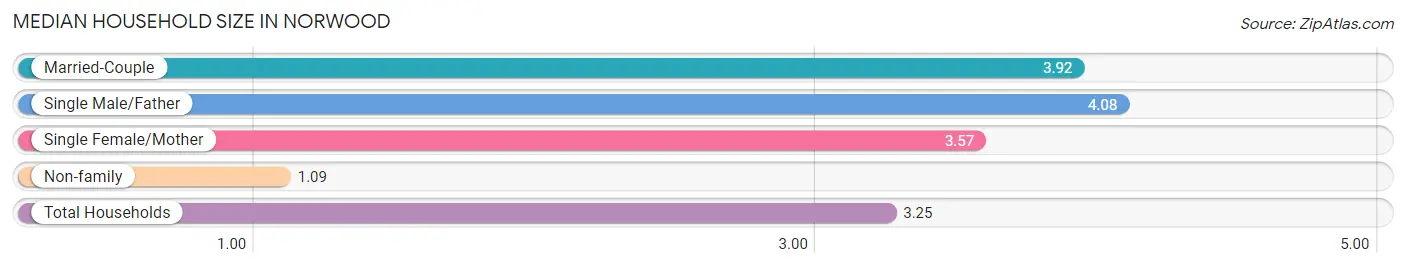
| Household Type | # Households | Household Size |
| Married-Couple | 117 (44.2%) | 3.92 |
| Single Male/Father | 12 (4.5%) | 4.08 |
| Single Female/Mother | 82 (30.9%) | 3.57 |
| Non-family | 54 (20.4%) | 1.09 |
| Total Households | 265 (100.0%) | 3.25 |
Household Size by Marriage Status in Norwood
Out of a total of 265 households in Norwood, 211 (79.6%) are family households, while 54 (20.4%) are nonfamily households. The most numerous type of family households are 2-person households, comprising 84, and the most common type of nonfamily households are 1-person households, comprising 47.
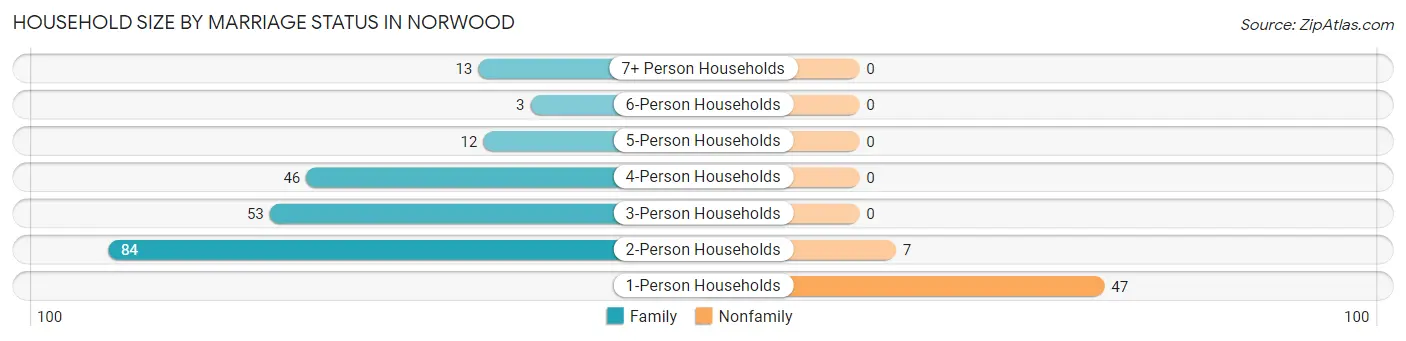
| Household Size | Family Households | Nonfamily Households |
| 1-Person Households | - | 47 (17.7%) |
| 2-Person Households | 84 (31.7%) | 7 (2.6%) |
| 3-Person Households | 53 (20.0%) | 0 (0.0%) |
| 4-Person Households | 46 (17.4%) | 0 (0.0%) |
| 5-Person Households | 12 (4.5%) | 0 (0.0%) |
| 6-Person Households | 3 (1.1%) | 0 (0.0%) |
| 7+ Person Households | 13 (4.9%) | 0 (0.0%) |
| Total | 211 (79.6%) | 54 (20.4%) |
Female Fertility in Norwood
Fertility by Age in Norwood
Average fertility rate in Norwood is 47.0 births per 1,000 women. Women in the age bracket of 20 to 34 years have the highest fertility rate with 66.0 births per 1,000 women. Women in the age bracket of 20 to 34 years acount for 81.8% of all women with births.
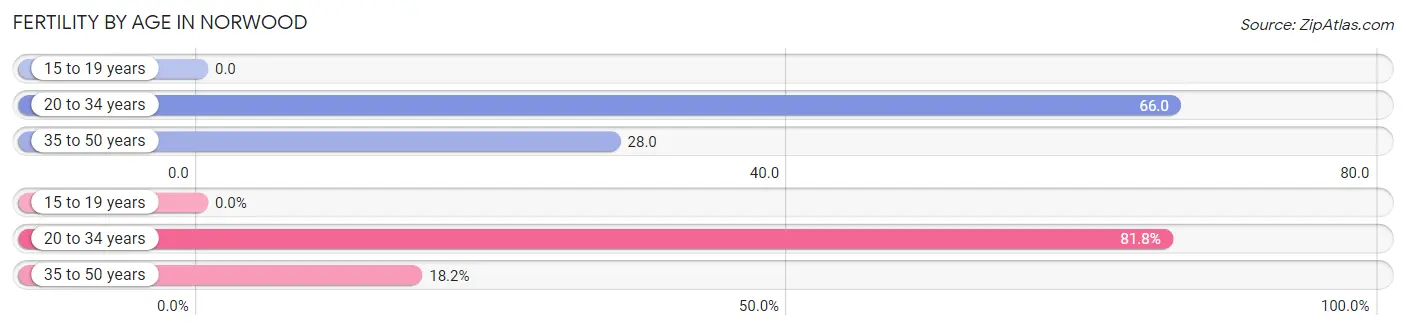
| Age Bracket | Women with Births | Births / 1,000 Women |
| 15 to 19 years | 0 (0.0%) | 0.0 |
| 20 to 34 years | 9 (81.8%) | 66.0 |
| 35 to 50 years | 2 (18.2%) | 28.0 |
| Total | 11 (100.0%) | 47.0 |
Fertility by Age by Marriage Status in Norwood
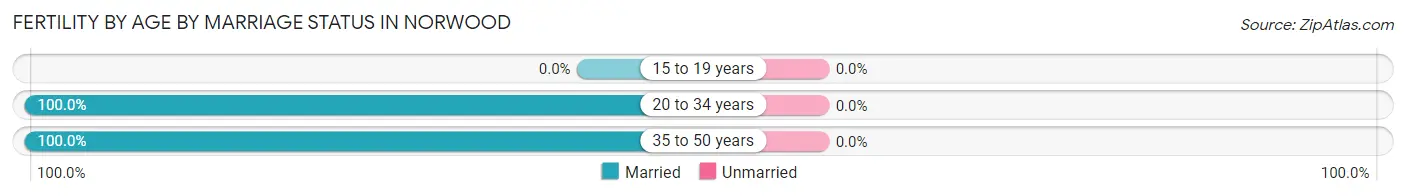
| Age Bracket | Married | Unmarried |
| 15 to 19 years | 0 (0.0%) | 0 (0.0%) |
| 20 to 34 years | 9 (100.0%) | 0 (0.0%) |
| 35 to 50 years | 2 (100.0%) | 0 (0.0%) |
| Total | 11 (100.0%) | 0 (0.0%) |
Fertility by Education in Norwood
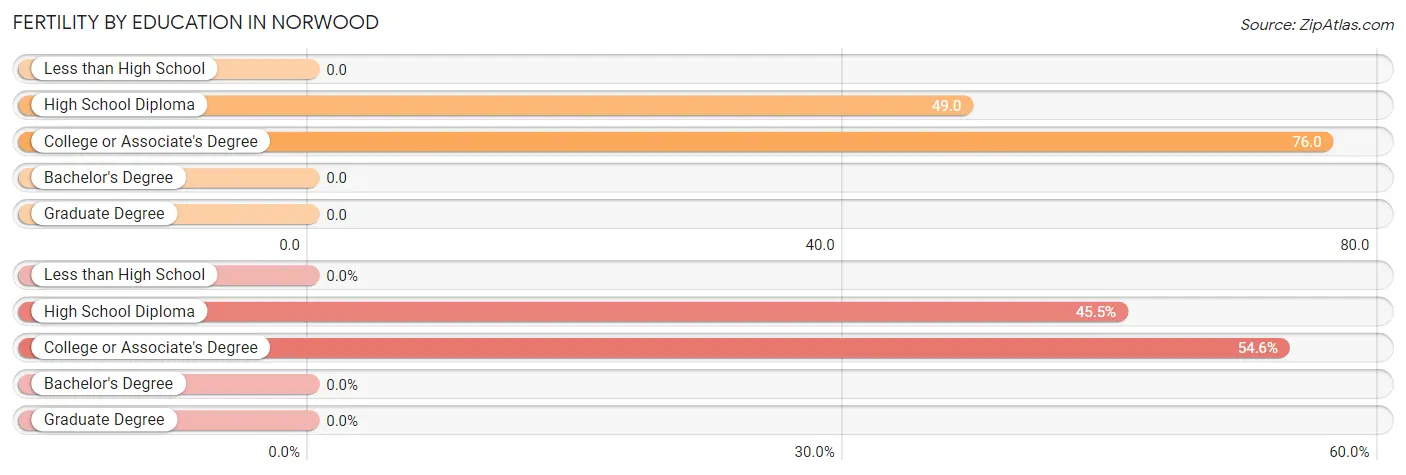
| Educational Attainment | Women with Births | Births / 1,000 Women |
| Less than High School | 0 (0.0%) | 0.0 |
| High School Diploma | 5 (45.5%) | 49.0 |
| College or Associate's Degree | 6 (54.5%) | 76.0 |
| Bachelor's Degree | 0 (0.0%) | 0.0 |
| Graduate Degree | 0 (0.0%) | 0.0 |
| Total | 11 (100.0%) | 47.0 |
Fertility by Education by Marriage Status in Norwood
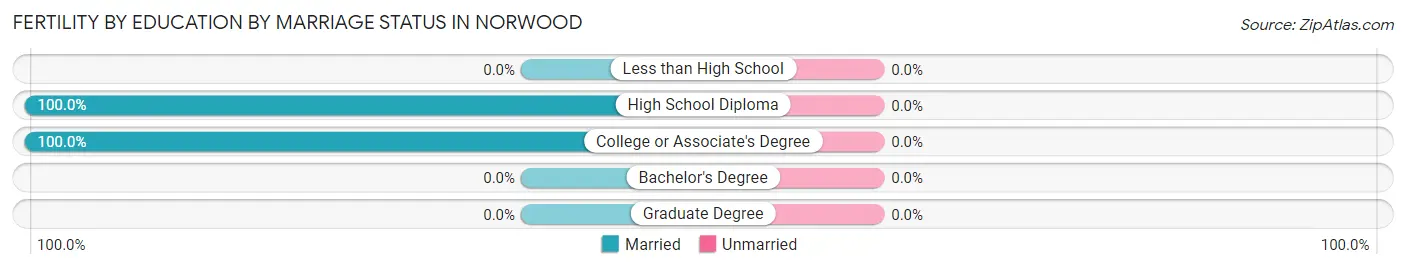
| Educational Attainment | Married | Unmarried |
| Less than High School | 0 (0.0%) | 0 (0.0%) |
| High School Diploma | 5 (100.0%) | 0 (0.0%) |
| College or Associate's Degree | 6 (100.0%) | 0 (0.0%) |
| Bachelor's Degree | 0 (0.0%) | 0 (0.0%) |
| Graduate Degree | 0 (0.0%) | 0 (0.0%) |
| Total | 11 (100.0%) | 0 (0.0%) |
Employment Characteristics in Norwood
Employment by Class of Employer in Norwood
Among the 297 employed individuals in Norwood, private company employees (191 | 64.3%), local government employees (41 | 13.8%), and self-employed (not incorporated) (31 | 10.4%) make up the most common classes of employment.
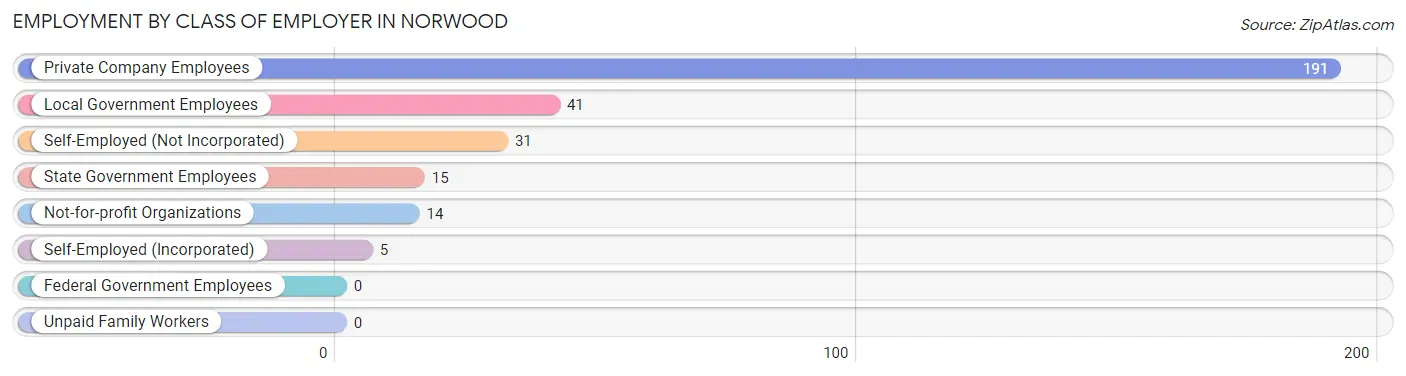
| Employer Class | # Employees | % Employees |
| Private Company Employees | 191 | 64.3% |
| Self-Employed (Incorporated) | 5 | 1.7% |
| Self-Employed (Not Incorporated) | 31 | 10.4% |
| Not-for-profit Organizations | 14 | 4.7% |
| Local Government Employees | 41 | 13.8% |
| State Government Employees | 15 | 5.1% |
| Federal Government Employees | 0 | 0.0% |
| Unpaid Family Workers | 0 | 0.0% |
| Total | 297 | 100.0% |
Employment Status by Age in Norwood
According to the labor force statistics for Norwood, out of the total population over 16 years of age (594), 55.9% or 332 individuals are in the labor force, with 10.5% or 35 of them unemployed. The age group with the highest labor force participation rate is 35 to 44 years, with 93.4% or 71 individuals in the labor force. Within the labor force, the 16 to 19 years age range has the highest percentage of unemployed individuals, with 46.7% or 7 of them being unemployed.
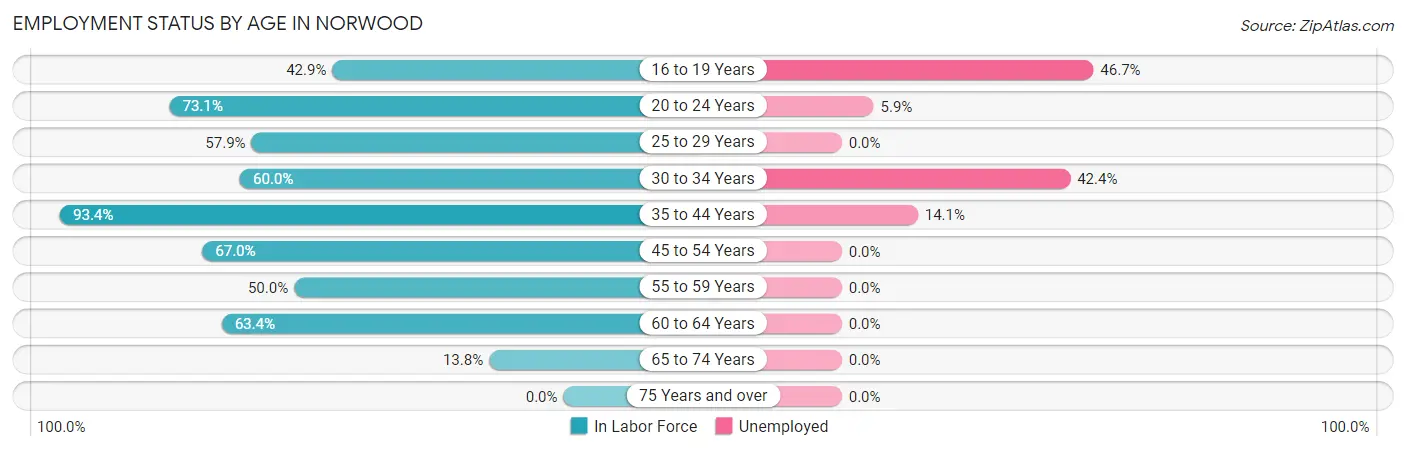
| Age Bracket | In Labor Force | Unemployed |
| 16 to 19 Years | 15 (42.9%) | 7 (46.7%) |
| 20 to 24 Years | 68 (73.1%) | 4 (5.9%) |
| 25 to 29 Years | 22 (57.9%) | 0 (0.0%) |
| 30 to 34 Years | 33 (60.0%) | 14 (42.4%) |
| 35 to 44 Years | 71 (93.4%) | 10 (14.1%) |
| 45 to 54 Years | 59 (67.0%) | 0 (0.0%) |
| 55 to 59 Years | 30 (50.0%) | 0 (0.0%) |
| 60 to 64 Years | 26 (63.4%) | 0 (0.0%) |
| 65 to 74 Years | 8 (13.8%) | 0 (0.0%) |
| 75 Years and over | 0 (0.0%) | 0 (0.0%) |
| Total | 332 (55.9%) | 35 (10.5%) |
Employment Status by Educational Attainment in Norwood
According to labor force statistics for Norwood, 67.3% of individuals (241) out of the total population between 25 and 64 years of age (358) are in the labor force, with 10.0% or 24 of them being unemployed. The group with the highest labor force participation rate are those with the educational attainment of bachelor's degree or higher, with 91.7% or 33 individuals in the labor force. Within the labor force, individuals with less than high school education have the highest percentage of unemployment, with 51.9% or 14 of them being unemployed.
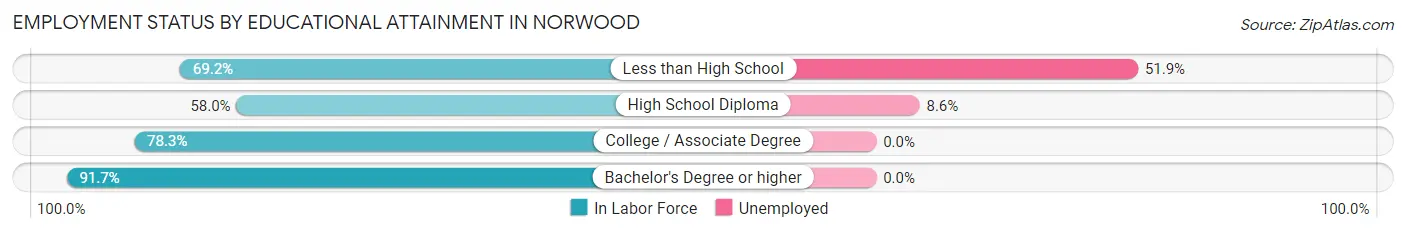
| Educational Attainment | In Labor Force | Unemployed |
| Less than High School | 27 (69.2%) | 20 (51.9%) |
| High School Diploma | 116 (58.0%) | 17 (8.6%) |
| College / Associate Degree | 65 (78.3%) | 0 (0.0%) |
| Bachelor's Degree or higher | 33 (91.7%) | 0 (0.0%) |
| Total | 241 (67.3%) | 36 (10.0%) |
Employment Occupations by Sex in Norwood
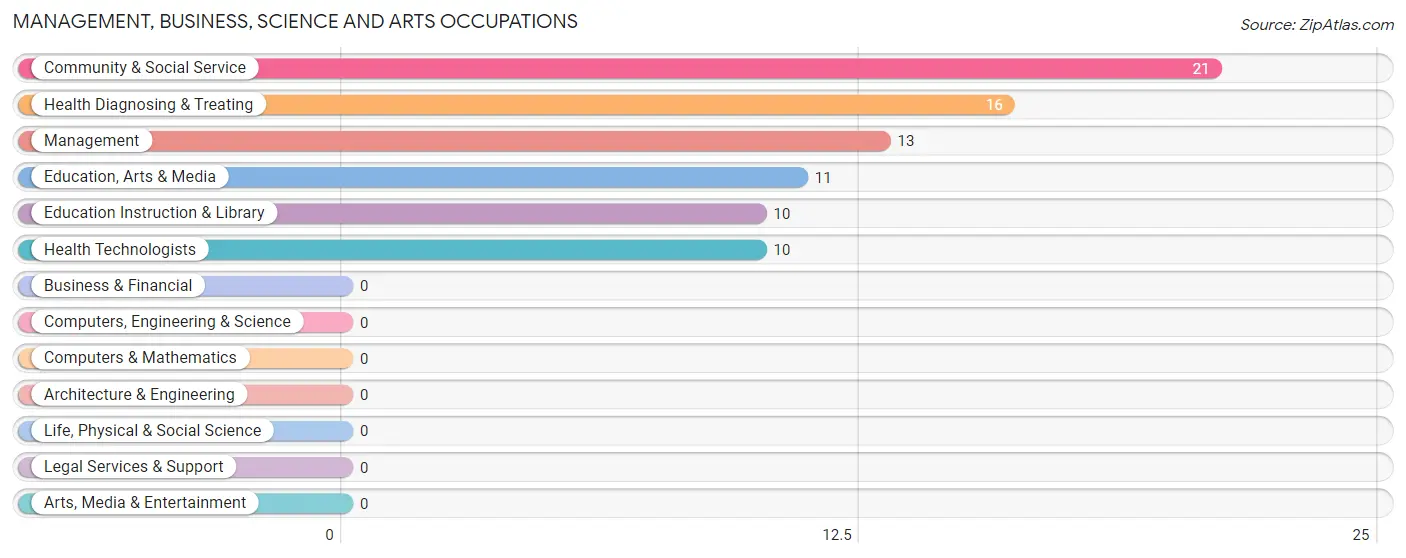
Management, Business, Science and Arts Occupations
The most common Management, Business, Science and Arts occupations in Norwood are Community & Social Service (21 | 7.1%), Health Diagnosing & Treating (16 | 5.4%), Management (13 | 4.4%), Education, Arts & Media (11 | 3.7%), and Education Instruction & Library (10 | 3.4%).
Management, Business, Science and Arts Occupations by Sex
Within the Management, Business, Science and Arts occupations in Norwood, the most male-oriented occupations are Management (53.8%), Education Instruction & Library (30.0%), and Community & Social Service (28.6%), while the most female-oriented occupations are Health Diagnosing & Treating (100.0%), Health Technologists (100.0%), and Education, Arts & Media (72.7%).
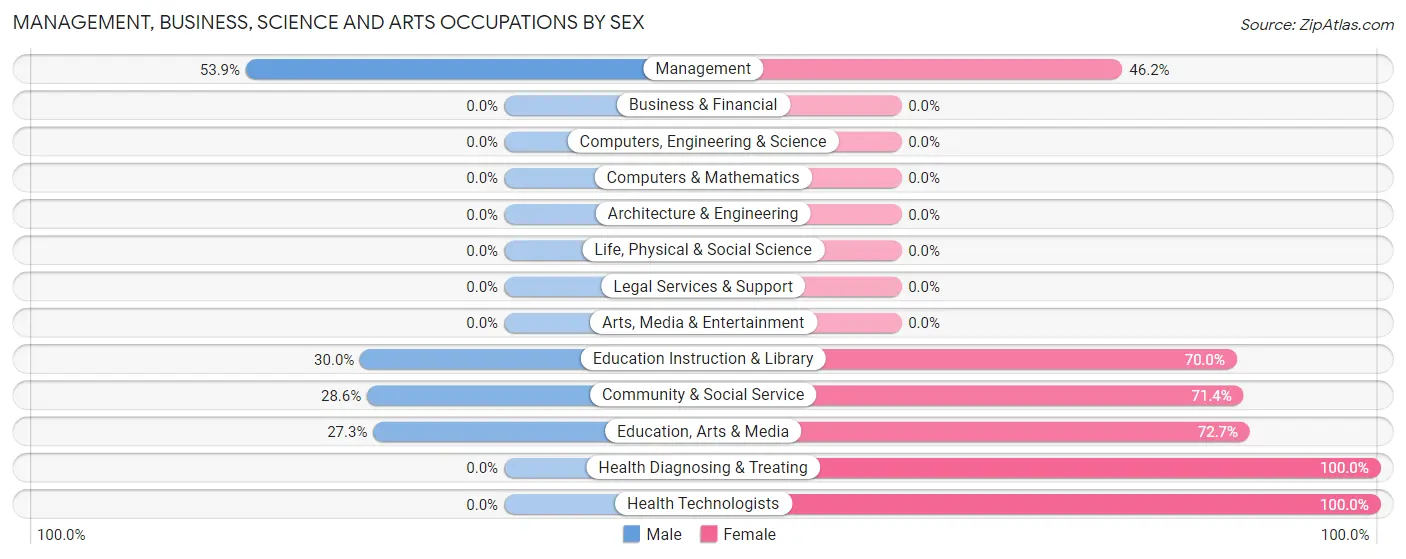
| Occupation | Male | Female |
| Management | 7 (53.8%) | 6 (46.2%) |
| Business & Financial | 0 (0.0%) | 0 (0.0%) |
| Computers, Engineering & Science | 0 (0.0%) | 0 (0.0%) |
| Computers & Mathematics | 0 (0.0%) | 0 (0.0%) |
| Architecture & Engineering | 0 (0.0%) | 0 (0.0%) |
| Life, Physical & Social Science | 0 (0.0%) | 0 (0.0%) |
| Community & Social Service | 6 (28.6%) | 15 (71.4%) |
| Education, Arts & Media | 3 (27.3%) | 8 (72.7%) |
| Legal Services & Support | 0 (0.0%) | 0 (0.0%) |
| Education Instruction & Library | 3 (30.0%) | 7 (70.0%) |
| Arts, Media & Entertainment | 0 (0.0%) | 0 (0.0%) |
| Health Diagnosing & Treating | 0 (0.0%) | 16 (100.0%) |
| Health Technologists | 0 (0.0%) | 10 (100.0%) |
| Total (Category) | 13 (26.0%) | 37 (74.0%) |
| Total (Overall) | 110 (37.0%) | 187 (63.0%) |
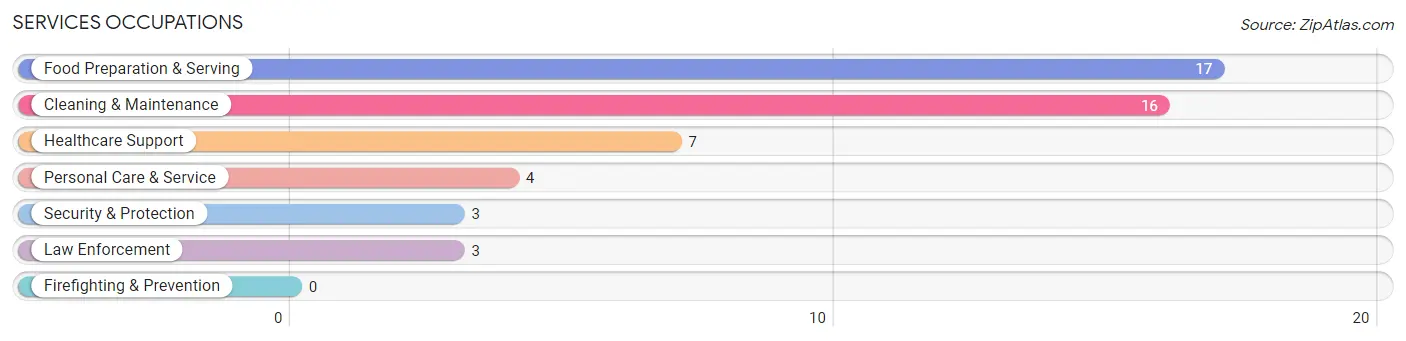
Services Occupations
The most common Services occupations in Norwood are Food Preparation & Serving (17 | 5.7%), Cleaning & Maintenance (16 | 5.4%), Healthcare Support (7 | 2.4%), Personal Care & Service (4 | 1.3%), and Security & Protection (3 | 1.0%).
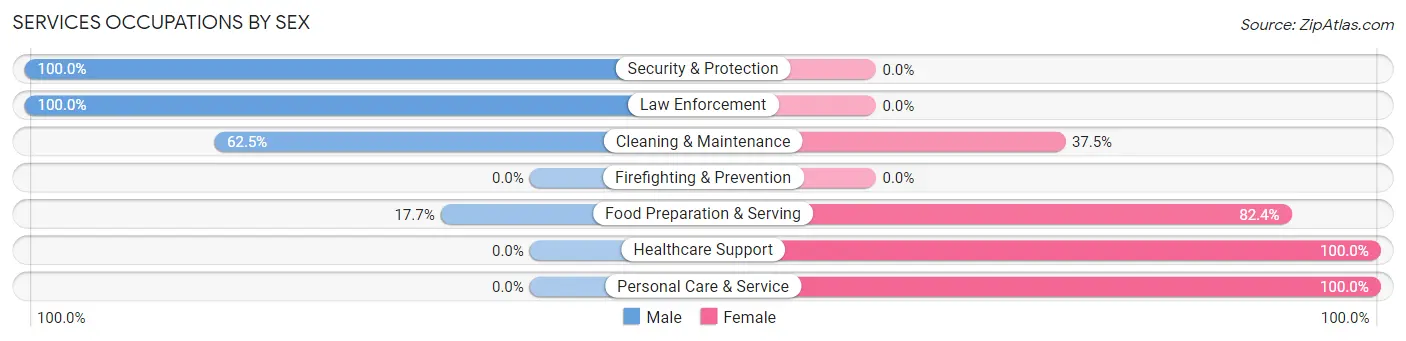
Services Occupations by Sex
Within the Services occupations in Norwood, the most male-oriented occupations are Security & Protection (100.0%), Law Enforcement (100.0%), and Cleaning & Maintenance (62.5%), while the most female-oriented occupations are Healthcare Support (100.0%), Personal Care & Service (100.0%), and Food Preparation & Serving (82.4%).
| Occupation | Male | Female |
| Healthcare Support | 0 (0.0%) | 7 (100.0%) |
| Security & Protection | 3 (100.0%) | 0 (0.0%) |
| Firefighting & Prevention | 0 (0.0%) | 0 (0.0%) |
| Law Enforcement | 3 (100.0%) | 0 (0.0%) |
| Food Preparation & Serving | 3 (17.6%) | 14 (82.4%) |
| Cleaning & Maintenance | 10 (62.5%) | 6 (37.5%) |
| Personal Care & Service | 0 (0.0%) | 4 (100.0%) |
| Total (Category) | 16 (34.0%) | 31 (66.0%) |
| Total (Overall) | 110 (37.0%) | 187 (63.0%) |
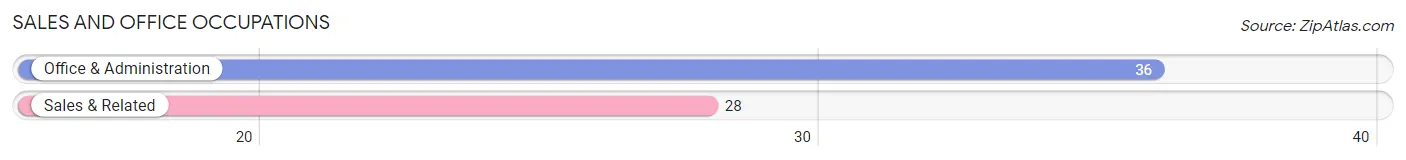
Sales and Office Occupations
The most common Sales and Office occupations in Norwood are Office & Administration (36 | 12.1%), and Sales & Related (28 | 9.4%).
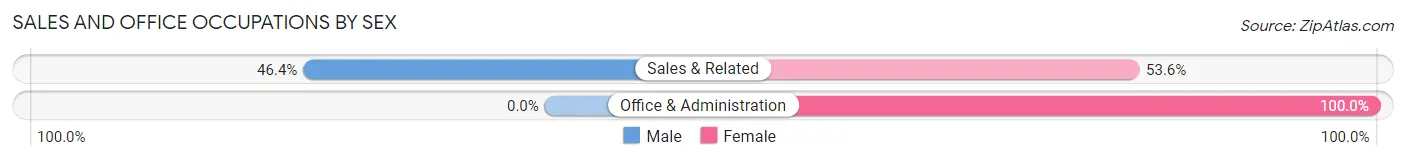
Sales and Office Occupations by Sex
| Occupation | Male | Female |
| Sales & Related | 13 (46.4%) | 15 (53.6%) |
| Office & Administration | 0 (0.0%) | 36 (100.0%) |
| Total (Category) | 13 (20.3%) | 51 (79.7%) |
| Total (Overall) | 110 (37.0%) | 187 (63.0%) |
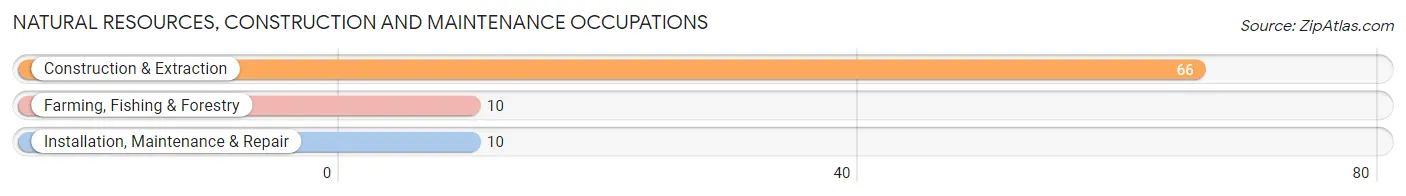
Natural Resources, Construction and Maintenance Occupations
The most common Natural Resources, Construction and Maintenance occupations in Norwood are Construction & Extraction (66 | 22.2%), Farming, Fishing & Forestry (10 | 3.4%), and Installation, Maintenance & Repair (10 | 3.4%).
Natural Resources, Construction and Maintenance Occupations by Sex
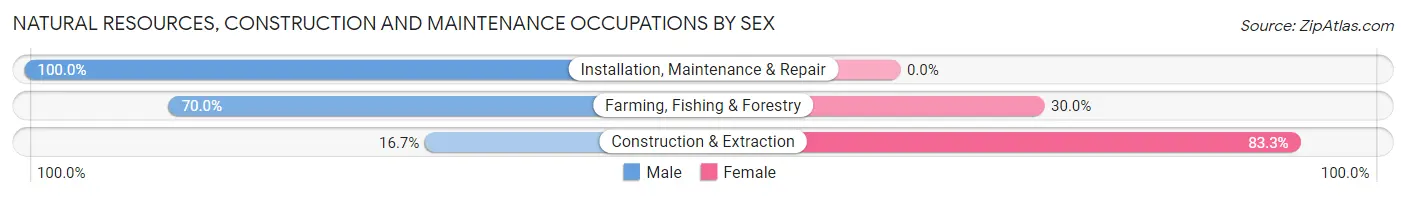
| Occupation | Male | Female |
| Farming, Fishing & Forestry | 7 (70.0%) | 3 (30.0%) |
| Construction & Extraction | 11 (16.7%) | 55 (83.3%) |
| Installation, Maintenance & Repair | 10 (100.0%) | 0 (0.0%) |
| Total (Category) | 28 (32.6%) | 58 (67.4%) |
| Total (Overall) | 110 (37.0%) | 187 (63.0%) |
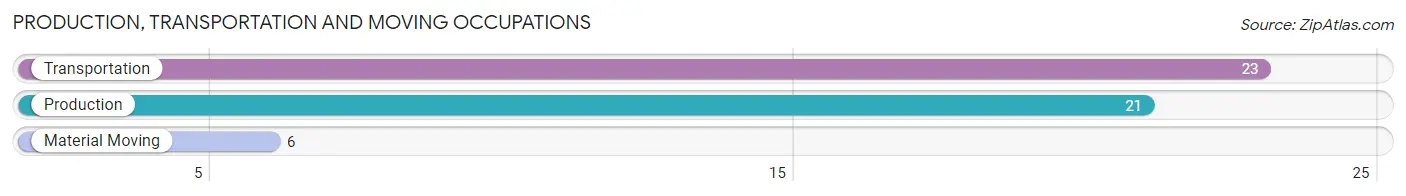
Production, Transportation and Moving Occupations
The most common Production, Transportation and Moving occupations in Norwood are Transportation (23 | 7.7%), Production (21 | 7.1%), and Material Moving (6 | 2.0%).
Production, Transportation and Moving Occupations by Sex
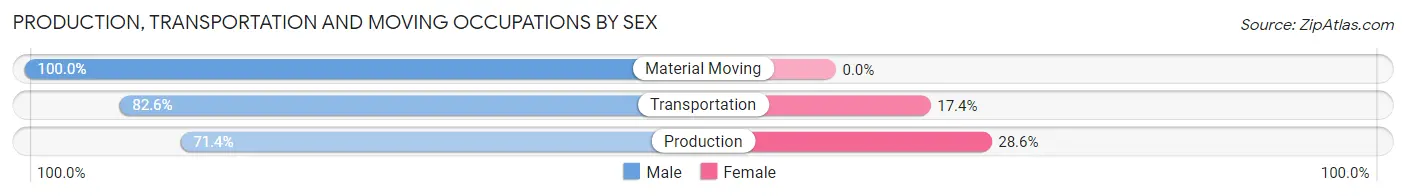
| Occupation | Male | Female |
| Production | 15 (71.4%) | 6 (28.6%) |
| Transportation | 19 (82.6%) | 4 (17.4%) |
| Material Moving | 6 (100.0%) | 0 (0.0%) |
| Total (Category) | 40 (80.0%) | 10 (20.0%) |
| Total (Overall) | 110 (37.0%) | 187 (63.0%) |
Employment Industries by Sex in Norwood
Employment Industries in Norwood
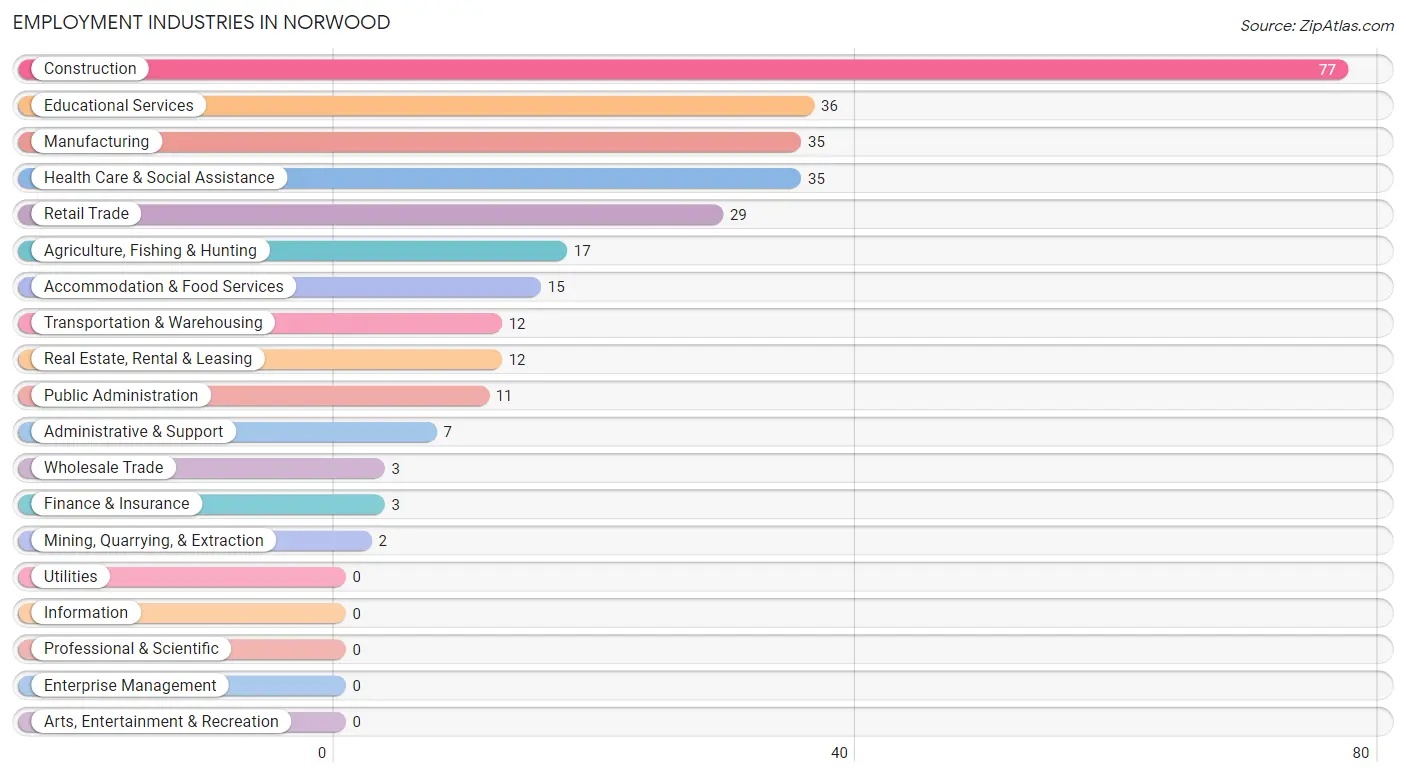
The major employment industries in Norwood include Construction (77 | 25.9%), Educational Services (36 | 12.1%), Manufacturing (35 | 11.8%), Health Care & Social Assistance (35 | 11.8%), and Retail Trade (29 | 9.8%).
Employment Industries by Sex in Norwood
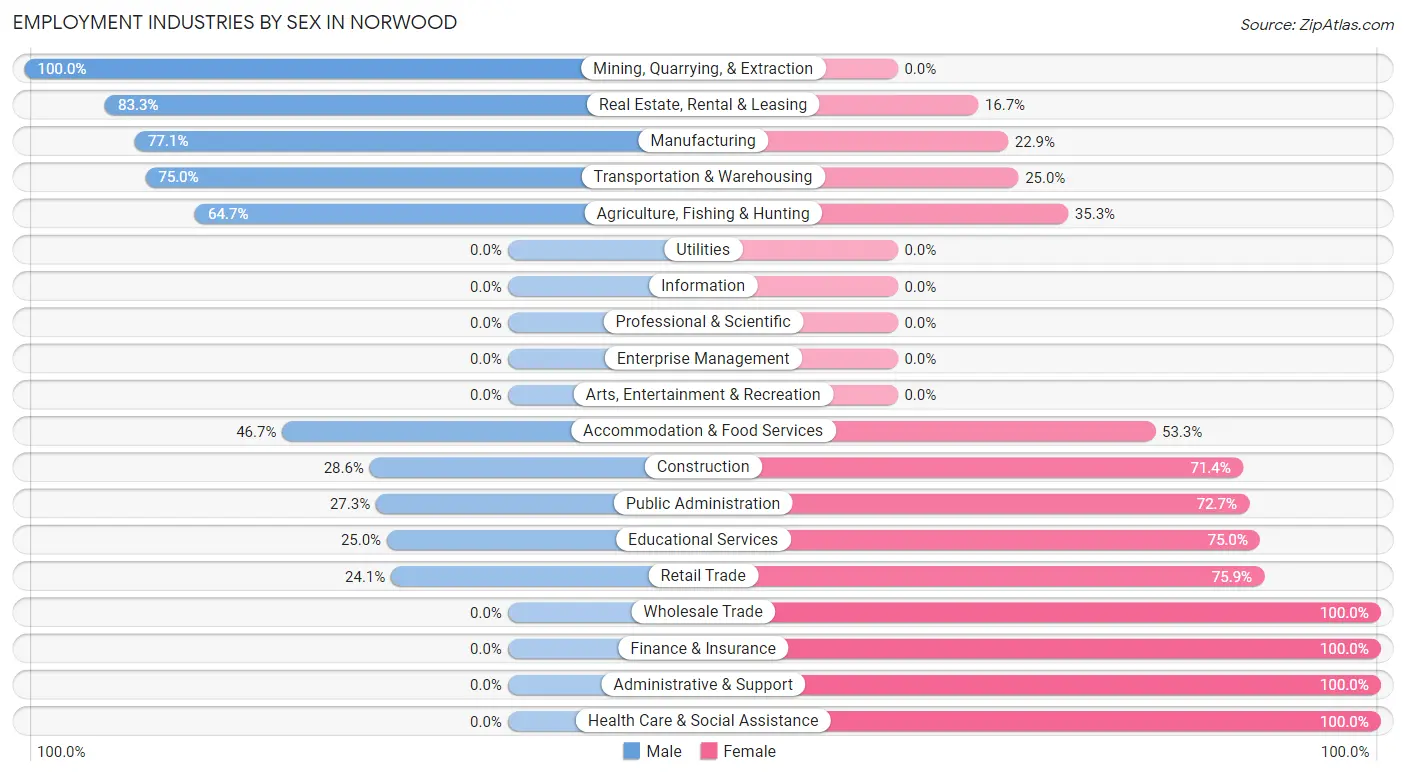
The Norwood industries that see more men than women are Mining, Quarrying, & Extraction (100.0%), Real Estate, Rental & Leasing (83.3%), and Manufacturing (77.1%), whereas the industries that tend to have a higher number of women are Wholesale Trade (100.0%), Finance & Insurance (100.0%), and Administrative & Support (100.0%).
| Industry | Male | Female |
| Agriculture, Fishing & Hunting | 11 (64.7%) | 6 (35.3%) |
| Mining, Quarrying, & Extraction | 2 (100.0%) | 0 (0.0%) |
| Construction | 22 (28.6%) | 55 (71.4%) |
| Manufacturing | 27 (77.1%) | 8 (22.9%) |
| Wholesale Trade | 0 (0.0%) | 3 (100.0%) |
| Retail Trade | 7 (24.1%) | 22 (75.9%) |
| Transportation & Warehousing | 9 (75.0%) | 3 (25.0%) |
| Utilities | 0 (0.0%) | 0 (0.0%) |
| Information | 0 (0.0%) | 0 (0.0%) |
| Finance & Insurance | 0 (0.0%) | 3 (100.0%) |
| Real Estate, Rental & Leasing | 10 (83.3%) | 2 (16.7%) |
| Professional & Scientific | 0 (0.0%) | 0 (0.0%) |
| Enterprise Management | 0 (0.0%) | 0 (0.0%) |
| Administrative & Support | 0 (0.0%) | 7 (100.0%) |
| Educational Services | 9 (25.0%) | 27 (75.0%) |
| Health Care & Social Assistance | 0 (0.0%) | 35 (100.0%) |
| Arts, Entertainment & Recreation | 0 (0.0%) | 0 (0.0%) |
| Accommodation & Food Services | 7 (46.7%) | 8 (53.3%) |
| Public Administration | 3 (27.3%) | 8 (72.7%) |
| Total | 110 (37.0%) | 187 (63.0%) |
Education in Norwood
School Enrollment in Norwood
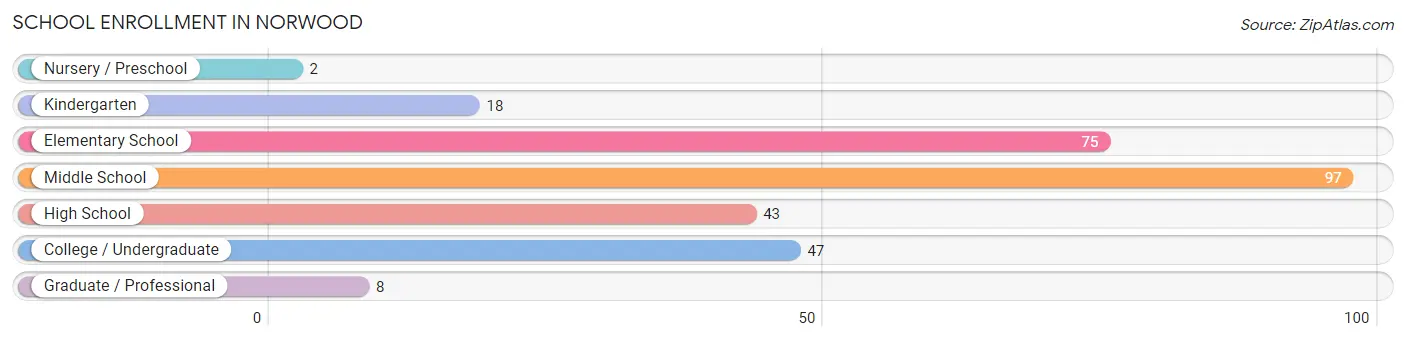
The most common levels of schooling among the 290 students in Norwood are middle school (97 | 33.5%), elementary school (75 | 25.9%), and college / undergraduate (47 | 16.2%).
| School Level | # Students | % Students |
| Nursery / Preschool | 2 | 0.7% |
| Kindergarten | 18 | 6.2% |
| Elementary School | 75 | 25.9% |
| Middle School | 97 | 33.5% |
| High School | 43 | 14.8% |
| College / Undergraduate | 47 | 16.2% |
| Graduate / Professional | 8 | 2.8% |
| Total | 290 | 100.0% |
School Enrollment by Age by Funding Source in Norwood
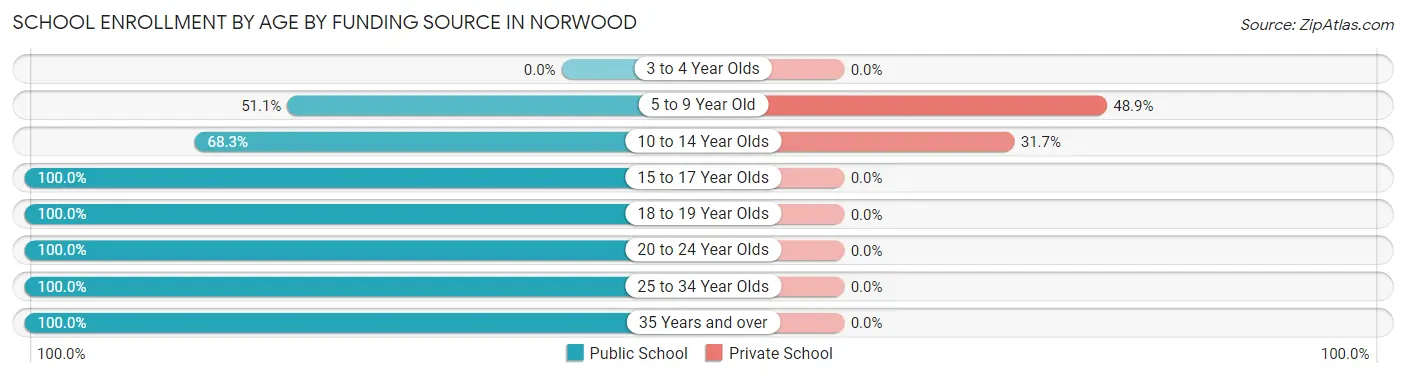
Out of a total of 290 students who are enrolled in schools in Norwood, 77 (26.6%) attend a private institution, while the remaining 213 (73.4%) are enrolled in public schools. The age group of 5 to 9 year old has the highest likelihood of being enrolled in private schools, with 45 (48.9% in the age bracket) enrolled. Conversely, the age group of 15 to 17 year olds has the lowest likelihood of being enrolled in a private school, with 41 (100.0% in the age bracket) attending a public institution.
| Age Bracket | Public School | Private School |
| 3 to 4 Year Olds | 0 (0.0%) | 0 (0.0%) |
| 5 to 9 Year Old | 47 (51.1%) | 45 (48.9%) |
| 10 to 14 Year Olds | 69 (68.3%) | 32 (31.7%) |
| 15 to 17 Year Olds | 41 (100.0%) | 0 (0.0%) |
| 18 to 19 Year Olds | 1 (100.0%) | 0 (0.0%) |
| 20 to 24 Year Olds | 38 (100.0%) | 0 (0.0%) |
| 25 to 34 Year Olds | 7 (100.0%) | 0 (0.0%) |
| 35 Years and over | 10 (100.0%) | 0 (0.0%) |
| Total | 213 (73.4%) | 77 (26.6%) |
Educational Attainment by Field of Study in Norwood
Education (28 | 36.4%), science & technology (12 | 15.6%), arts & humanities (8 | 10.4%), engineering (7 | 9.1%), and bio, nature & agricultural (6 | 7.8%) are the most common fields of study among 77 individuals in Norwood who have obtained a bachelor's degree or higher.
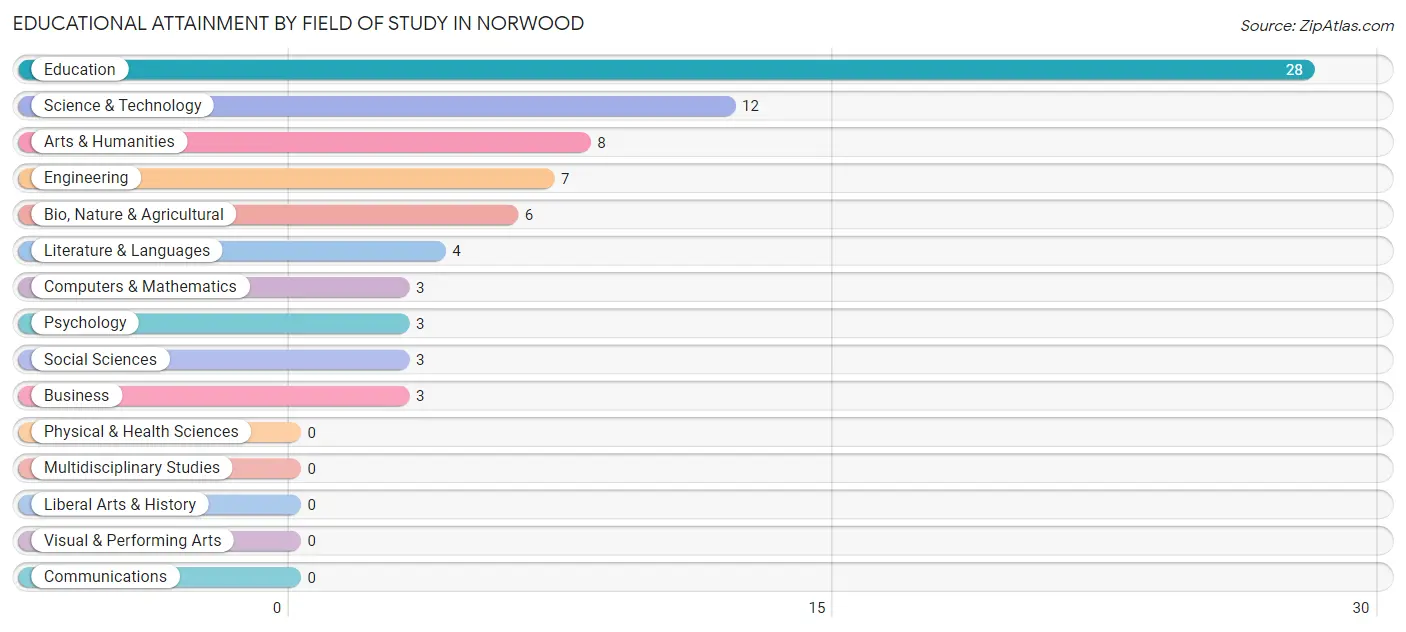
| Field of Study | # Graduates | % Graduates |
| Computers & Mathematics | 3 | 3.9% |
| Bio, Nature & Agricultural | 6 | 7.8% |
| Physical & Health Sciences | 0 | 0.0% |
| Psychology | 3 | 3.9% |
| Social Sciences | 3 | 3.9% |
| Engineering | 7 | 9.1% |
| Multidisciplinary Studies | 0 | 0.0% |
| Science & Technology | 12 | 15.6% |
| Business | 3 | 3.9% |
| Education | 28 | 36.4% |
| Literature & Languages | 4 | 5.2% |
| Liberal Arts & History | 0 | 0.0% |
| Visual & Performing Arts | 0 | 0.0% |
| Communications | 0 | 0.0% |
| Arts & Humanities | 8 | 10.4% |
| Total | 77 | 100.0% |
Transportation & Commute in Norwood
Vehicle Availability by Sex in Norwood
The most prevalent vehicle ownership categories in Norwood are males with 3 vehicles (41, accounting for 37.3%) and females with 3 vehicles (45, making up 21.9%).
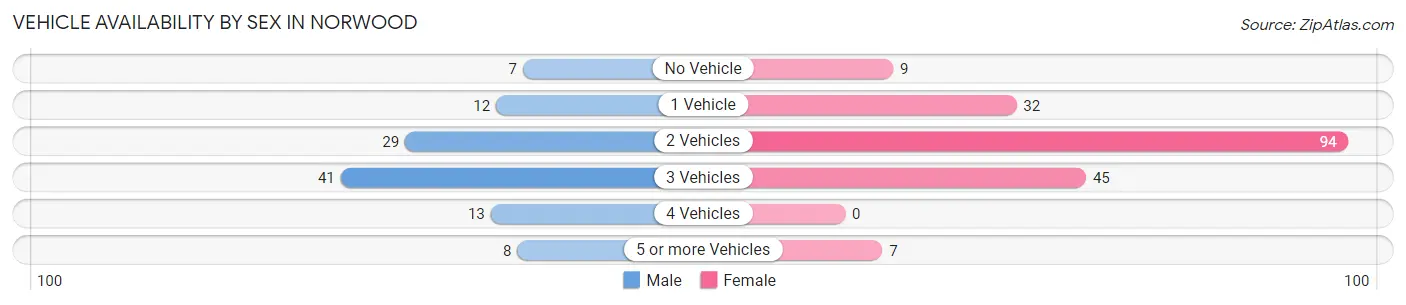
| Vehicles Available | Male | Female |
| No Vehicle | 7 (6.4%) | 9 (4.8%) |
| 1 Vehicle | 12 (10.9%) | 32 (17.1%) |
| 2 Vehicles | 29 (26.4%) | 94 (50.3%) |
| 3 Vehicles | 41 (37.3%) | 45 (24.1%) |
| 4 Vehicles | 13 (11.8%) | 0 (0.0%) |
| 5 or more Vehicles | 8 (7.3%) | 7 (3.7%) |
| Total | 110 (100.0%) | 187 (100.0%) |
Commute Time in Norwood
The most frequently occuring commute durations in Norwood are 60 to 89 minutes (58 commuters, 20.0%), 15 to 19 minutes (57 commuters, 19.7%), and 10 to 14 minutes (41 commuters, 14.1%).
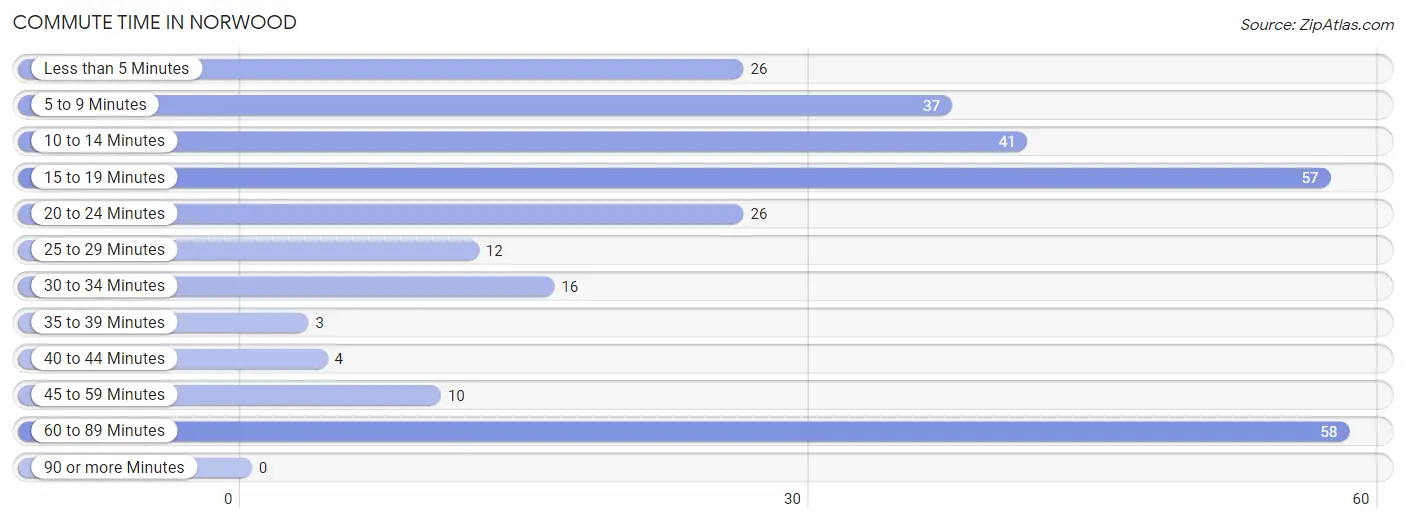
| Commute Time | # Commuters | % Commuters |
| Less than 5 Minutes | 26 | 9.0% |
| 5 to 9 Minutes | 37 | 12.8% |
| 10 to 14 Minutes | 41 | 14.1% |
| 15 to 19 Minutes | 57 | 19.7% |
| 20 to 24 Minutes | 26 | 9.0% |
| 25 to 29 Minutes | 12 | 4.1% |
| 30 to 34 Minutes | 16 | 5.5% |
| 35 to 39 Minutes | 3 | 1.0% |
| 40 to 44 Minutes | 4 | 1.4% |
| 45 to 59 Minutes | 10 | 3.5% |
| 60 to 89 Minutes | 58 | 20.0% |
| 90 or more Minutes | 0 | 0.0% |
Commute Time by Sex in Norwood
The most common commute times in Norwood are 20 to 24 minutes (18 commuters, 16.4%) for males and 60 to 89 minutes (47 commuters, 26.1%) for females.
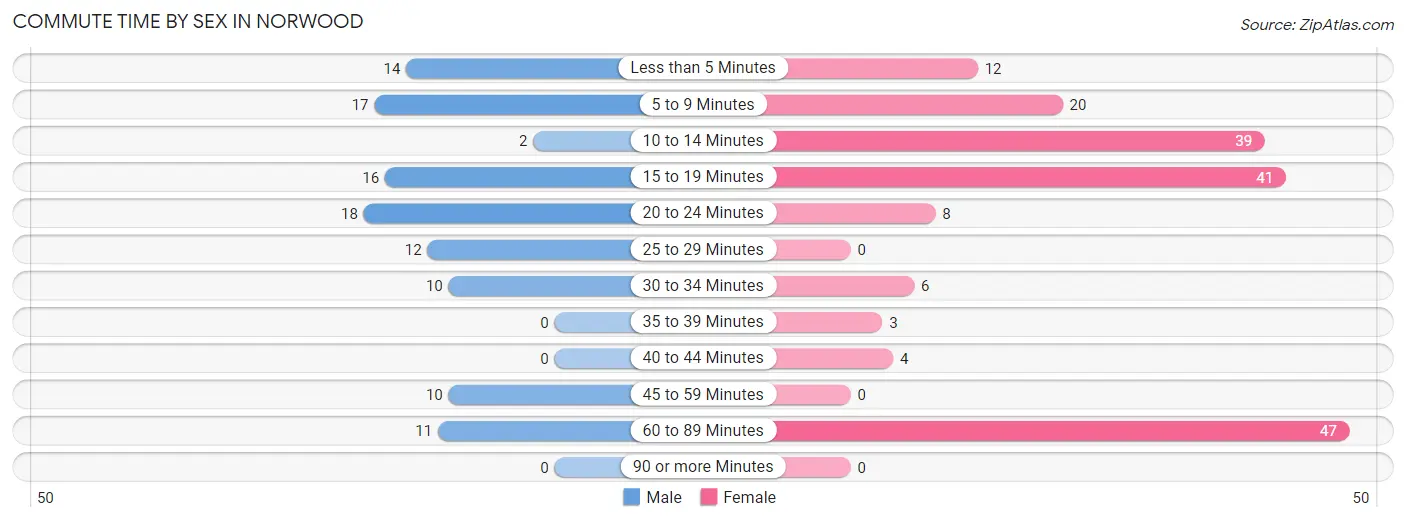
| Commute Time | Male | Female |
| Less than 5 Minutes | 14 (12.7%) | 12 (6.7%) |
| 5 to 9 Minutes | 17 (15.4%) | 20 (11.1%) |
| 10 to 14 Minutes | 2 (1.8%) | 39 (21.7%) |
| 15 to 19 Minutes | 16 (14.5%) | 41 (22.8%) |
| 20 to 24 Minutes | 18 (16.4%) | 8 (4.4%) |
| 25 to 29 Minutes | 12 (10.9%) | 0 (0.0%) |
| 30 to 34 Minutes | 10 (9.1%) | 6 (3.3%) |
| 35 to 39 Minutes | 0 (0.0%) | 3 (1.7%) |
| 40 to 44 Minutes | 0 (0.0%) | 4 (2.2%) |
| 45 to 59 Minutes | 10 (9.1%) | 0 (0.0%) |
| 60 to 89 Minutes | 11 (10.0%) | 47 (26.1%) |
| 90 or more Minutes | 0 (0.0%) | 0 (0.0%) |
Time of Departure to Work by Sex in Norwood
The most frequent times of departure to work in Norwood are 5:30 AM to 5:59 AM (21, 19.1%) for males and 12:00 PM to 3:59 PM (47, 26.1%) for females.
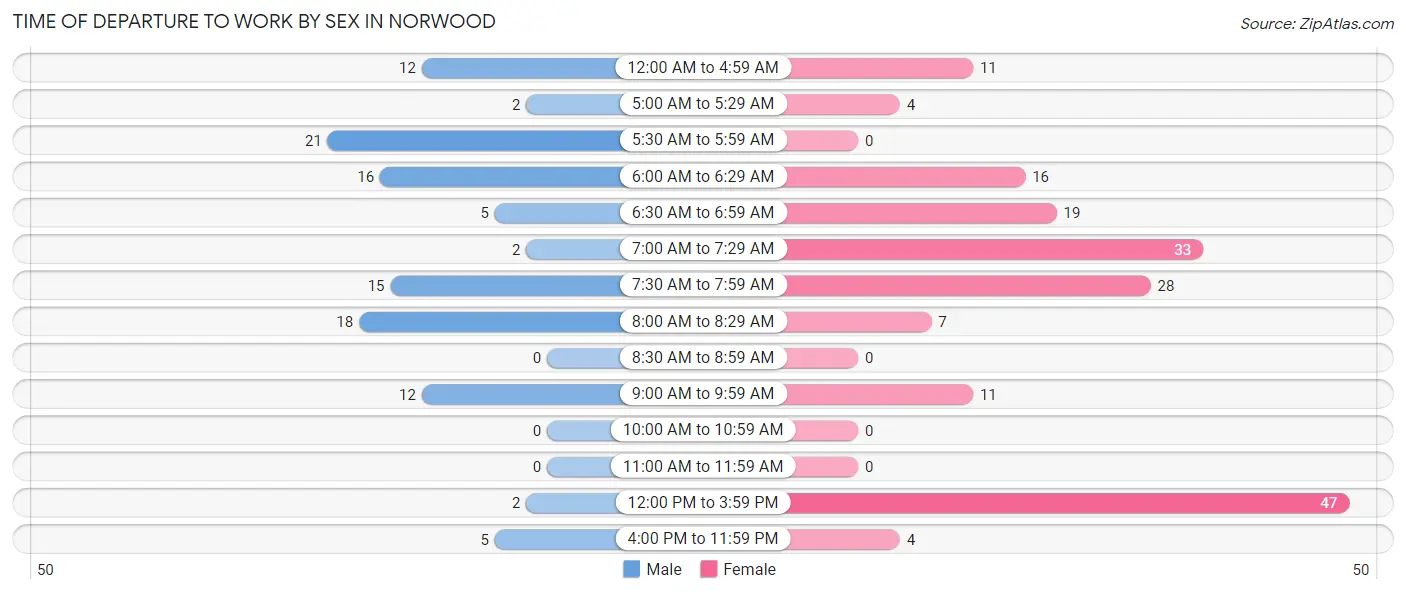
| Time of Departure | Male | Female |
| 12:00 AM to 4:59 AM | 12 (10.9%) | 11 (6.1%) |
| 5:00 AM to 5:29 AM | 2 (1.8%) | 4 (2.2%) |
| 5:30 AM to 5:59 AM | 21 (19.1%) | 0 (0.0%) |
| 6:00 AM to 6:29 AM | 16 (14.5%) | 16 (8.9%) |
| 6:30 AM to 6:59 AM | 5 (4.5%) | 19 (10.6%) |
| 7:00 AM to 7:29 AM | 2 (1.8%) | 33 (18.3%) |
| 7:30 AM to 7:59 AM | 15 (13.6%) | 28 (15.6%) |
| 8:00 AM to 8:29 AM | 18 (16.4%) | 7 (3.9%) |
| 8:30 AM to 8:59 AM | 0 (0.0%) | 0 (0.0%) |
| 9:00 AM to 9:59 AM | 12 (10.9%) | 11 (6.1%) |
| 10:00 AM to 10:59 AM | 0 (0.0%) | 0 (0.0%) |
| 11:00 AM to 11:59 AM | 0 (0.0%) | 0 (0.0%) |
| 12:00 PM to 3:59 PM | 2 (1.8%) | 47 (26.1%) |
| 4:00 PM to 11:59 PM | 5 (4.5%) | 4 (2.2%) |
| Total | 110 (100.0%) | 180 (100.0%) |
Housing Occupancy in Norwood
Occupancy by Ownership in Norwood
Of the total 265 dwellings in Norwood, owner-occupied units account for 173 (65.3%), while renter-occupied units make up 92 (34.7%).
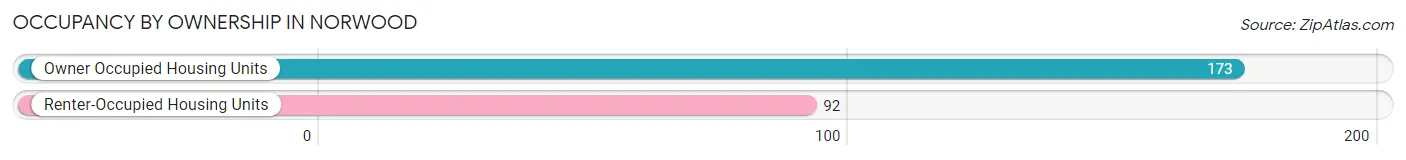
| Occupancy | # Housing Units | % Housing Units |
| Owner Occupied Housing Units | 173 | 65.3% |
| Renter-Occupied Housing Units | 92 | 34.7% |
| Total Occupied Housing Units | 265 | 100.0% |
Occupancy by Household Size in Norwood
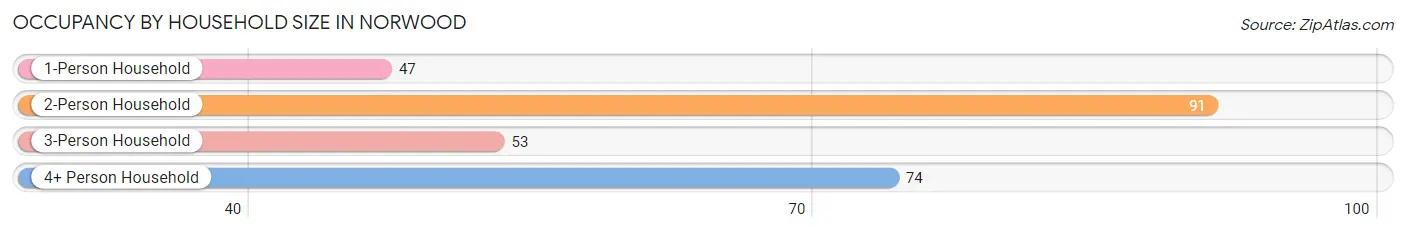
| Household Size | # Housing Units | % Housing Units |
| 1-Person Household | 47 | 17.7% |
| 2-Person Household | 91 | 34.3% |
| 3-Person Household | 53 | 20.0% |
| 4+ Person Household | 74 | 27.9% |
| Total Housing Units | 265 | 100.0% |
Occupancy by Ownership by Household Size in Norwood
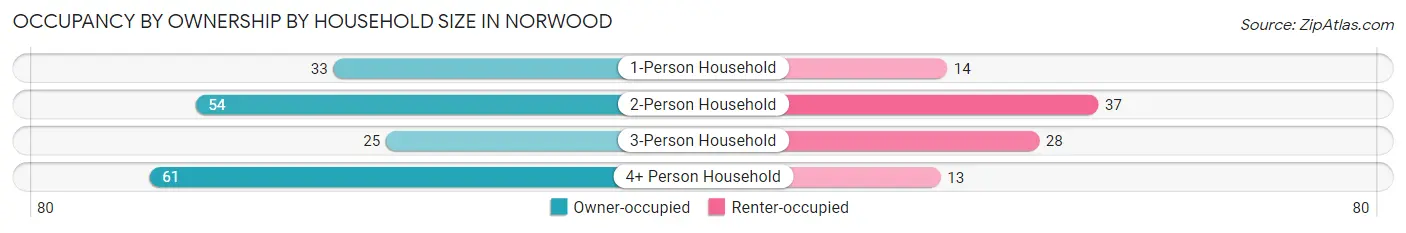
| Household Size | Owner-occupied | Renter-occupied |
| 1-Person Household | 33 (70.2%) | 14 (29.8%) |
| 2-Person Household | 54 (59.3%) | 37 (40.7%) |
| 3-Person Household | 25 (47.2%) | 28 (52.8%) |
| 4+ Person Household | 61 (82.4%) | 13 (17.6%) |
| Total Housing Units | 173 (65.3%) | 92 (34.7%) |
Occupancy by Educational Attainment in Norwood
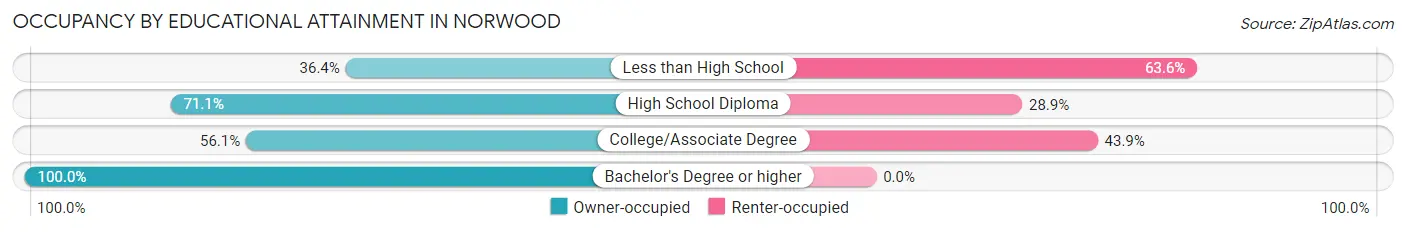
| Household Size | Owner-occupied | Renter-occupied |
| Less than High School | 12 (36.4%) | 21 (63.6%) |
| High School Diploma | 86 (71.1%) | 35 (28.9%) |
| College/Associate Degree | 46 (56.1%) | 36 (43.9%) |
| Bachelor's Degree or higher | 29 (100.0%) | 0 (0.0%) |
Occupancy by Age of Householder in Norwood
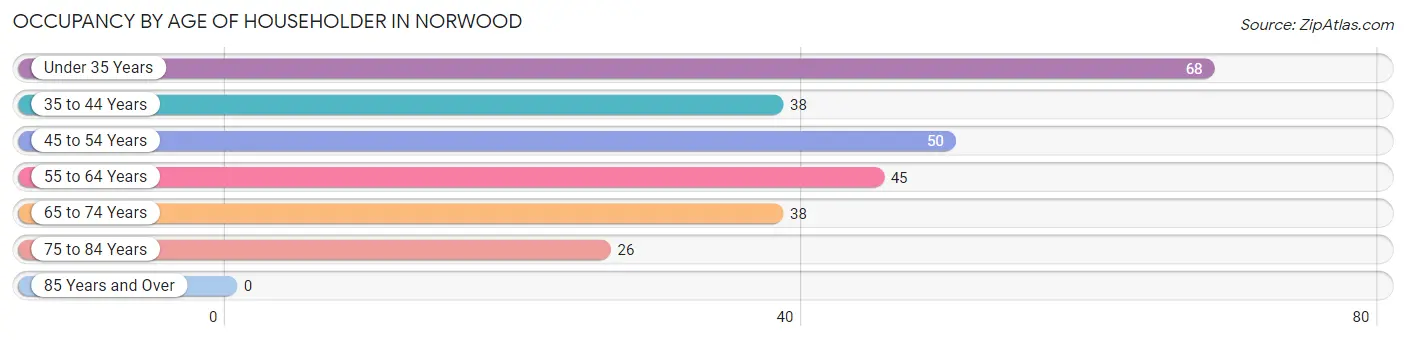
| Age Bracket | # Households | % Households |
| Under 35 Years | 68 | 25.7% |
| 35 to 44 Years | 38 | 14.3% |
| 45 to 54 Years | 50 | 18.9% |
| 55 to 64 Years | 45 | 17.0% |
| 65 to 74 Years | 38 | 14.3% |
| 75 to 84 Years | 26 | 9.8% |
| 85 Years and Over | 0 | 0.0% |
| Total | 265 | 100.0% |
Housing Finances in Norwood
Median Income by Occupancy in Norwood
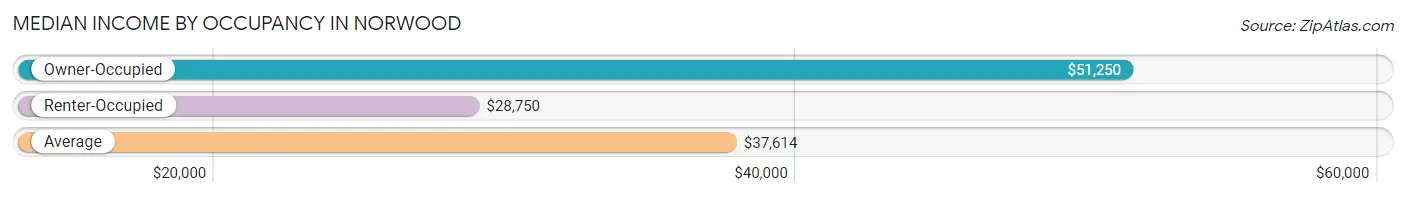
| Occupancy Type | # Households | Median Income |
| Owner-Occupied | 173 (65.3%) | $51,250 |
| Renter-Occupied | 92 (34.7%) | $28,750 |
| Average | 265 (100.0%) | $37,614 |
Occupancy by Householder Income Bracket in Norwood
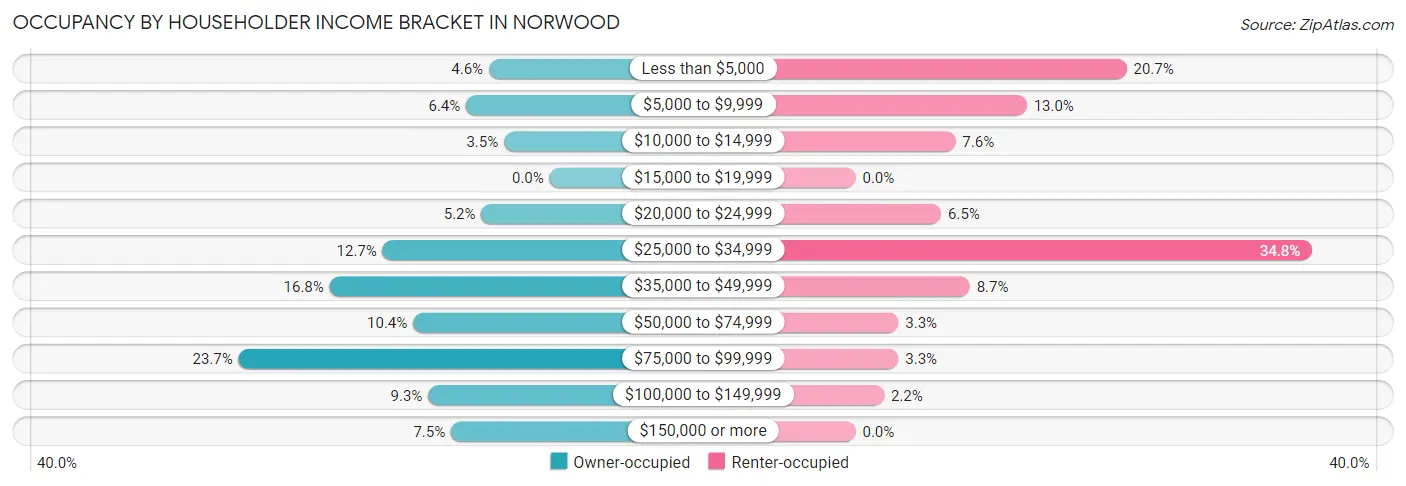
| Income Bracket | Owner-occupied | Renter-occupied |
| Less than $5,000 | 8 (4.6%) | 19 (20.6%) |
| $5,000 to $9,999 | 11 (6.4%) | 12 (13.0%) |
| $10,000 to $14,999 | 6 (3.5%) | 7 (7.6%) |
| $15,000 to $19,999 | 0 (0.0%) | 0 (0.0%) |
| $20,000 to $24,999 | 9 (5.2%) | 6 (6.5%) |
| $25,000 to $34,999 | 22 (12.7%) | 32 (34.8%) |
| $35,000 to $49,999 | 29 (16.8%) | 8 (8.7%) |
| $50,000 to $74,999 | 18 (10.4%) | 3 (3.3%) |
| $75,000 to $99,999 | 41 (23.7%) | 3 (3.3%) |
| $100,000 to $149,999 | 16 (9.2%) | 2 (2.2%) |
| $150,000 or more | 13 (7.5%) | 0 (0.0%) |
| Total | 173 (100.0%) | 92 (100.0%) |
Monthly Housing Cost Tiers in Norwood
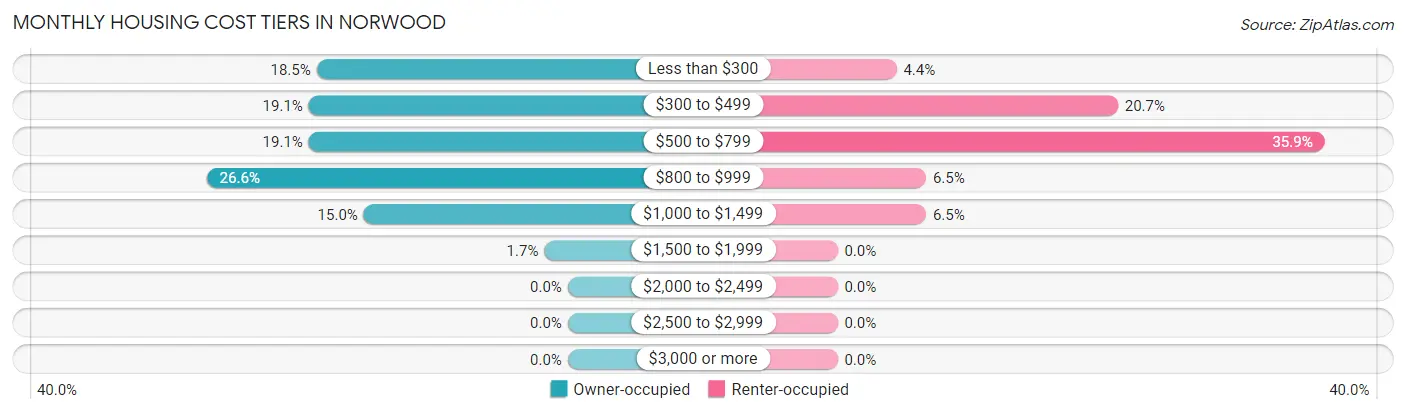
| Monthly Cost | Owner-occupied | Renter-occupied |
| Less than $300 | 32 (18.5%) | 4 (4.3%) |
| $300 to $499 | 33 (19.1%) | 19 (20.6%) |
| $500 to $799 | 33 (19.1%) | 33 (35.9%) |
| $800 to $999 | 46 (26.6%) | 6 (6.5%) |
| $1,000 to $1,499 | 26 (15.0%) | 6 (6.5%) |
| $1,500 to $1,999 | 3 (1.7%) | 0 (0.0%) |
| $2,000 to $2,499 | 0 (0.0%) | 0 (0.0%) |
| $2,500 to $2,999 | 0 (0.0%) | 0 (0.0%) |
| $3,000 or more | 0 (0.0%) | 0 (0.0%) |
| Total | 173 (100.0%) | 92 (100.0%) |
Physical Housing Characteristics in Norwood
Housing Structures in Norwood
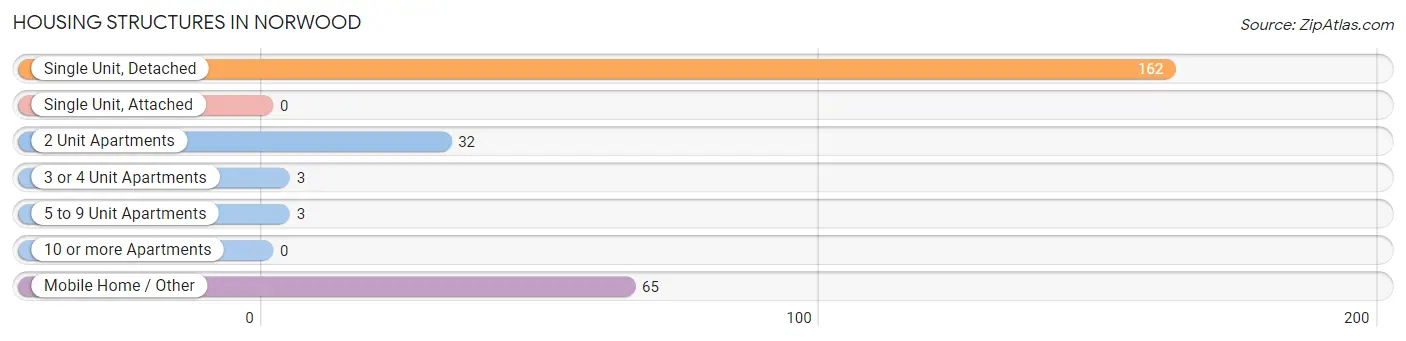
| Structure Type | # Housing Units | % Housing Units |
| Single Unit, Detached | 162 | 61.1% |
| Single Unit, Attached | 0 | 0.0% |
| 2 Unit Apartments | 32 | 12.1% |
| 3 or 4 Unit Apartments | 3 | 1.1% |
| 5 to 9 Unit Apartments | 3 | 1.1% |
| 10 or more Apartments | 0 | 0.0% |
| Mobile Home / Other | 65 | 24.5% |
| Total | 265 | 100.0% |
Housing Structures by Occupancy in Norwood
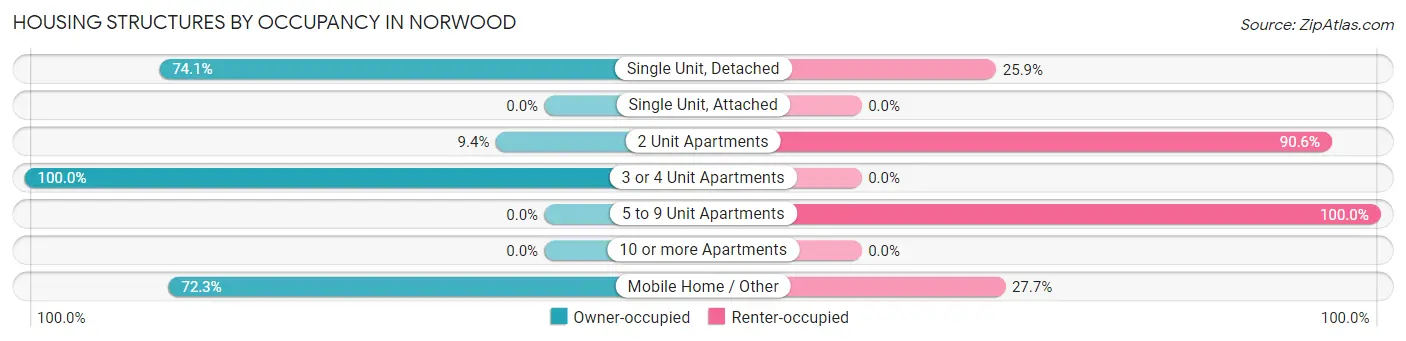
| Structure Type | Owner-occupied | Renter-occupied |
| Single Unit, Detached | 120 (74.1%) | 42 (25.9%) |
| Single Unit, Attached | 0 (0.0%) | 0 (0.0%) |
| 2 Unit Apartments | 3 (9.4%) | 29 (90.6%) |
| 3 or 4 Unit Apartments | 3 (100.0%) | 0 (0.0%) |
| 5 to 9 Unit Apartments | 0 (0.0%) | 3 (100.0%) |
| 10 or more Apartments | 0 (0.0%) | 0 (0.0%) |
| Mobile Home / Other | 47 (72.3%) | 18 (27.7%) |
| Total | 173 (65.3%) | 92 (34.7%) |
Housing Structures by Number of Rooms in Norwood
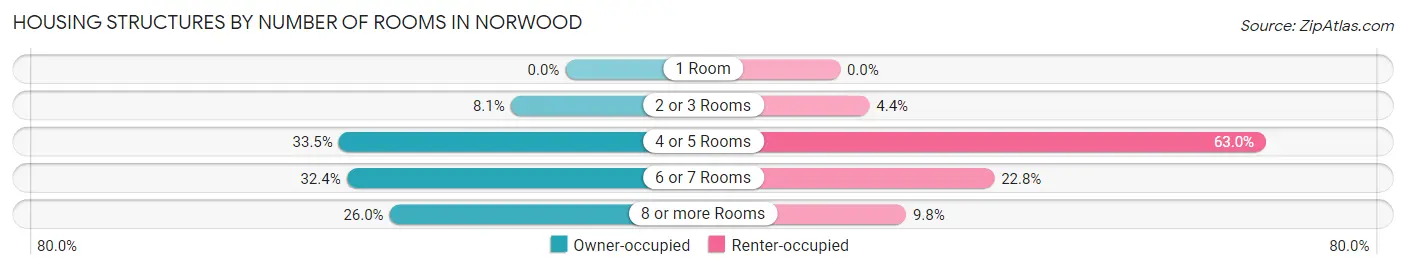
| Number of Rooms | Owner-occupied | Renter-occupied |
| 1 Room | 0 (0.0%) | 0 (0.0%) |
| 2 or 3 Rooms | 14 (8.1%) | 4 (4.3%) |
| 4 or 5 Rooms | 58 (33.5%) | 58 (63.0%) |
| 6 or 7 Rooms | 56 (32.4%) | 21 (22.8%) |
| 8 or more Rooms | 45 (26.0%) | 9 (9.8%) |
| Total | 173 (100.0%) | 92 (100.0%) |
Housing Structure by Heating Type in Norwood
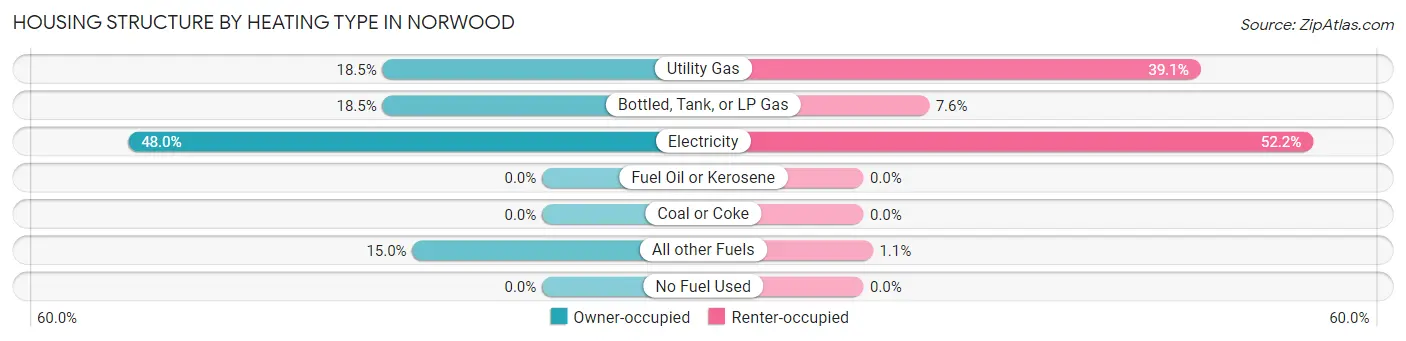
| Heating Type | Owner-occupied | Renter-occupied |
| Utility Gas | 32 (18.5%) | 36 (39.1%) |
| Bottled, Tank, or LP Gas | 32 (18.5%) | 7 (7.6%) |
| Electricity | 83 (48.0%) | 48 (52.2%) |
| Fuel Oil or Kerosene | 0 (0.0%) | 0 (0.0%) |
| Coal or Coke | 0 (0.0%) | 0 (0.0%) |
| All other Fuels | 26 (15.0%) | 1 (1.1%) |
| No Fuel Used | 0 (0.0%) | 0 (0.0%) |
| Total | 173 (100.0%) | 92 (100.0%) |
Household Vehicle Usage in Norwood
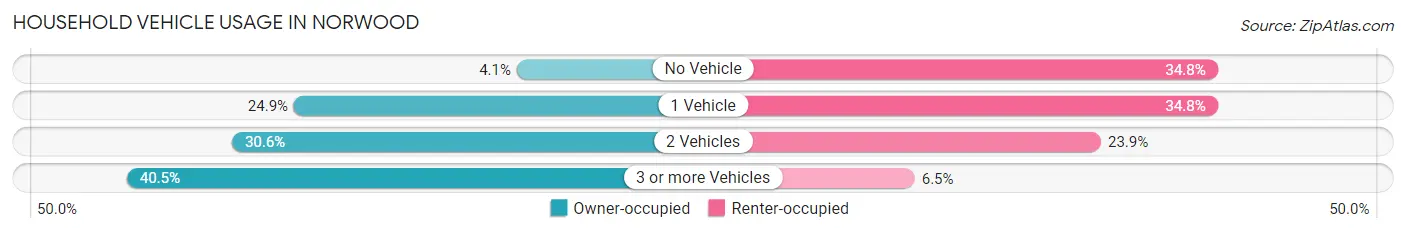
| Vehicles per Household | Owner-occupied | Renter-occupied |
| No Vehicle | 7 (4.1%) | 32 (34.8%) |
| 1 Vehicle | 43 (24.9%) | 32 (34.8%) |
| 2 Vehicles | 53 (30.6%) | 22 (23.9%) |
| 3 or more Vehicles | 70 (40.5%) | 6 (6.5%) |
| Total | 173 (100.0%) | 92 (100.0%) |
Real Estate & Mortgages in Norwood
Real Estate and Mortgage Overview in Norwood
| Characteristic | Without Mortgage | With Mortgage |
| Housing Units | 83 | 90 |
| Median Property Value | $52,500 | $97,100 |
| Median Household Income | $34,375 | $3 |
| Monthly Housing Costs | $332 | $0 |
| Real Estate Taxes | $394 | $0 |
Property Value by Mortgage Status in Norwood
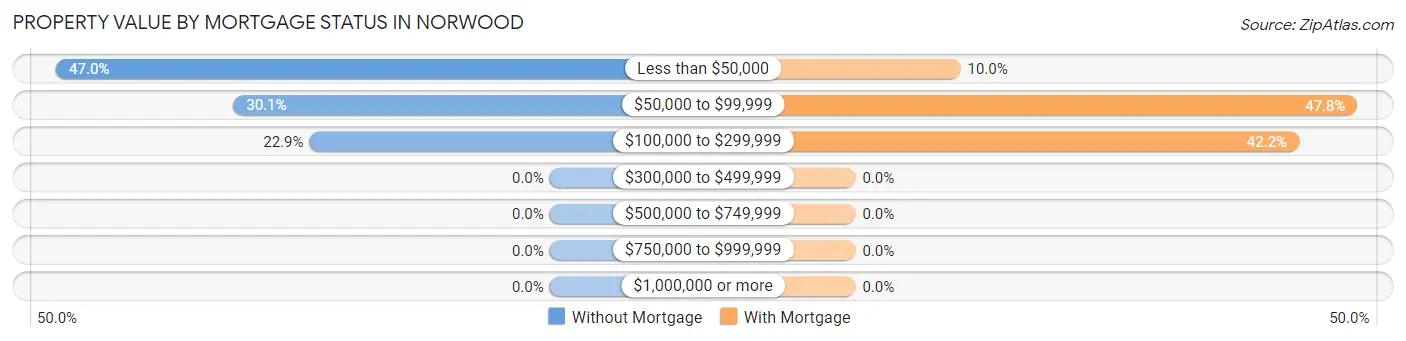
| Property Value | Without Mortgage | With Mortgage |
| Less than $50,000 | 39 (47.0%) | 9 (10.0%) |
| $50,000 to $99,999 | 25 (30.1%) | 43 (47.8%) |
| $100,000 to $299,999 | 19 (22.9%) | 38 (42.2%) |
| $300,000 to $499,999 | 0 (0.0%) | 0 (0.0%) |
| $500,000 to $749,999 | 0 (0.0%) | 0 (0.0%) |
| $750,000 to $999,999 | 0 (0.0%) | 0 (0.0%) |
| $1,000,000 or more | 0 (0.0%) | 0 (0.0%) |
| Total | 83 (100.0%) | 90 (100.0%) |
Household Income by Mortgage Status in Norwood
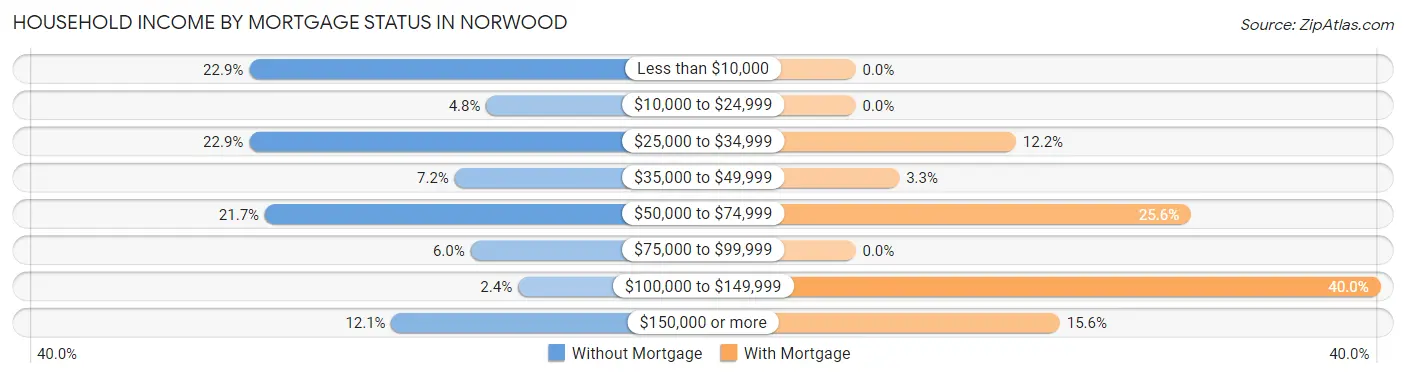
| Household Income | Without Mortgage | With Mortgage |
| Less than $10,000 | 19 (22.9%) | 0 (0.0%) |
| $10,000 to $24,999 | 4 (4.8%) | 0 (0.0%) |
| $25,000 to $34,999 | 19 (22.9%) | 11 (12.2%) |
| $35,000 to $49,999 | 6 (7.2%) | 3 (3.3%) |
| $50,000 to $74,999 | 18 (21.7%) | 23 (25.6%) |
| $75,000 to $99,999 | 5 (6.0%) | 0 (0.0%) |
| $100,000 to $149,999 | 2 (2.4%) | 36 (40.0%) |
| $150,000 or more | 10 (12.0%) | 14 (15.6%) |
| Total | 83 (100.0%) | 90 (100.0%) |
Property Value to Household Income Ratio in Norwood
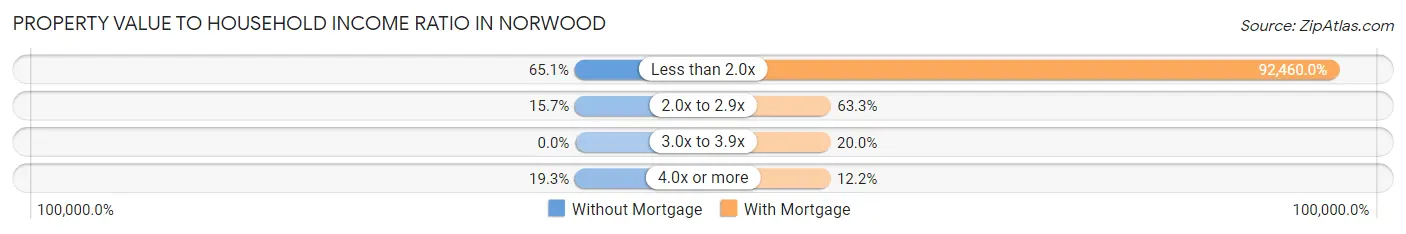
| Value-to-Income Ratio | Without Mortgage | With Mortgage |
| Less than 2.0x | 54 (65.1%) | 83,214 (92,460.0%) |
| 2.0x to 2.9x | 13 (15.7%) | 57 (63.3%) |
| 3.0x to 3.9x | 0 (0.0%) | 18 (20.0%) |
| 4.0x or more | 16 (19.3%) | 11 (12.2%) |
| Total | 83 (100.0%) | 90 (100.0%) |
Real Estate Taxes by Mortgage Status in Norwood
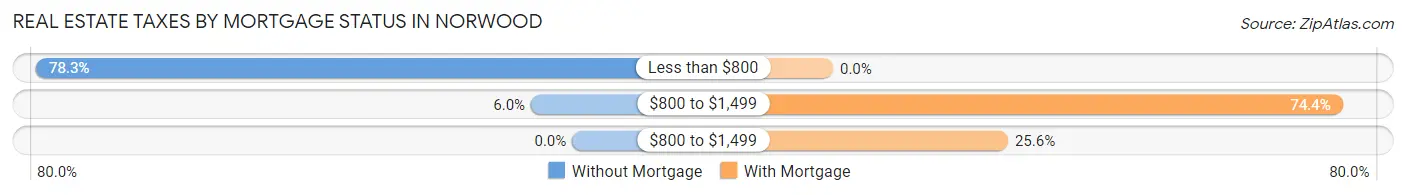
| Property Taxes | Without Mortgage | With Mortgage |
| Less than $800 | 65 (78.3%) | 0 (0.0%) |
| $800 to $1,499 | 5 (6.0%) | 67 (74.4%) |
| $800 to $1,499 | 0 (0.0%) | 23 (25.6%) |
| Total | 83 (100.0%) | 90 (100.0%) |
Health & Disability in Norwood
Health Insurance Coverage by Age in Norwood
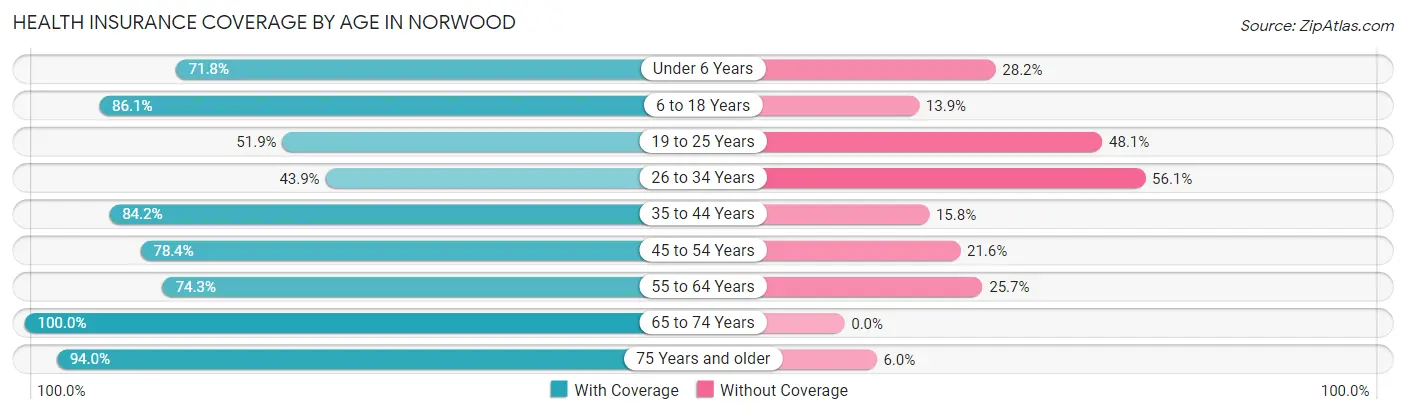
| Age Bracket | With Coverage | Without Coverage |
| Under 6 Years | 51 (71.8%) | 20 (28.2%) |
| 6 to 18 Years | 198 (86.1%) | 32 (13.9%) |
| 19 to 25 Years | 54 (51.9%) | 50 (48.1%) |
| 26 to 34 Years | 36 (43.9%) | 46 (56.1%) |
| 35 to 44 Years | 64 (84.2%) | 12 (15.8%) |
| 45 to 54 Years | 69 (78.4%) | 19 (21.6%) |
| 55 to 64 Years | 75 (74.3%) | 26 (25.7%) |
| 65 to 74 Years | 58 (100.0%) | 0 (0.0%) |
| 75 Years and older | 47 (94.0%) | 3 (6.0%) |
| Total | 652 (75.8%) | 208 (24.2%) |
Health Insurance Coverage by Citizenship Status in Norwood
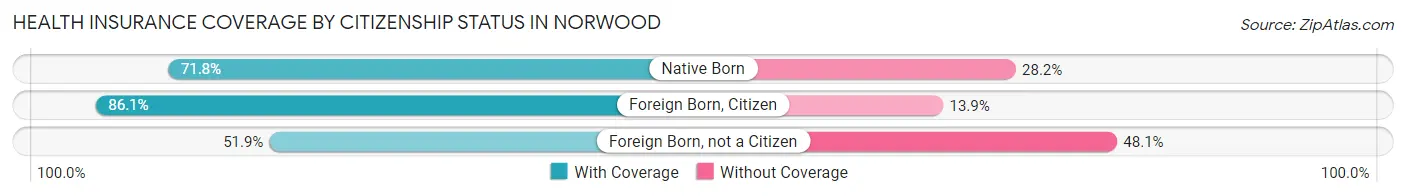
| Citizenship Status | With Coverage | Without Coverage |
| Native Born | 51 (71.8%) | 20 (28.2%) |
| Foreign Born, Citizen | 198 (86.1%) | 32 (13.9%) |
| Foreign Born, not a Citizen | 54 (51.9%) | 50 (48.1%) |
Health Insurance Coverage by Household Income in Norwood
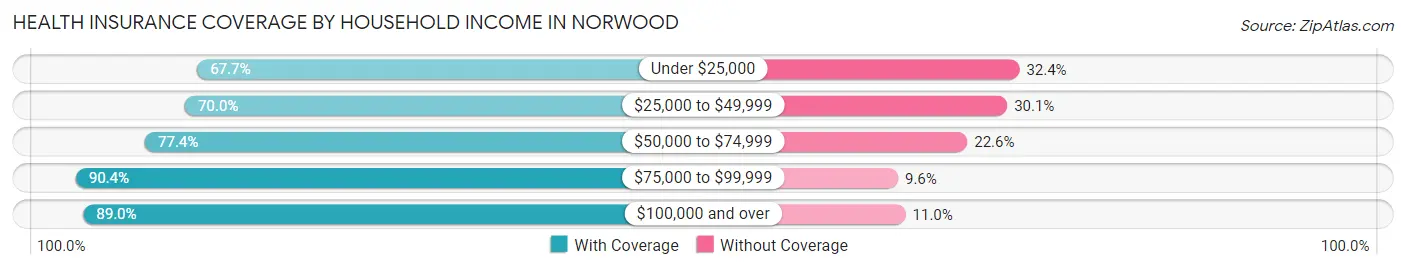
| Household Income | With Coverage | Without Coverage |
| Under $25,000 | 115 (67.6%) | 55 (32.4%) |
| $25,000 to $49,999 | 263 (70.0%) | 113 (30.0%) |
| $50,000 to $74,999 | 48 (77.4%) | 14 (22.6%) |
| $75,000 to $99,999 | 113 (90.4%) | 12 (9.6%) |
| $100,000 and over | 113 (89.0%) | 14 (11.0%) |
Public vs Private Health Insurance Coverage by Age in Norwood
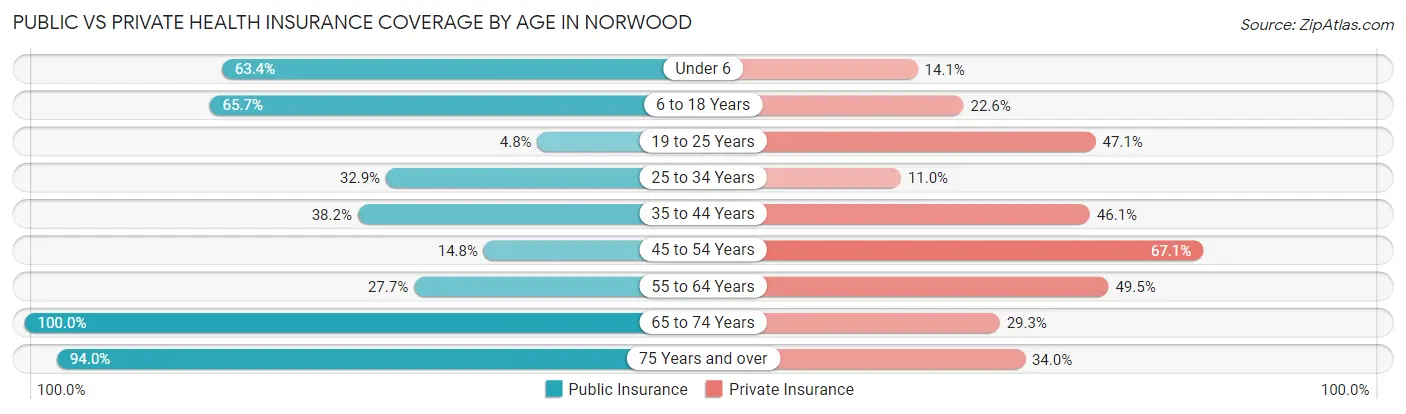
| Age Bracket | Public Insurance | Private Insurance |
| Under 6 | 45 (63.4%) | 10 (14.1%) |
| 6 to 18 Years | 151 (65.6%) | 52 (22.6%) |
| 19 to 25 Years | 5 (4.8%) | 49 (47.1%) |
| 25 to 34 Years | 27 (32.9%) | 9 (11.0%) |
| 35 to 44 Years | 29 (38.2%) | 35 (46.1%) |
| 45 to 54 Years | 13 (14.8%) | 59 (67.0%) |
| 55 to 64 Years | 28 (27.7%) | 50 (49.5%) |
| 65 to 74 Years | 58 (100.0%) | 17 (29.3%) |
| 75 Years and over | 47 (94.0%) | 17 (34.0%) |
| Total | 403 (46.9%) | 298 (34.6%) |
Disability Status by Sex by Age in Norwood
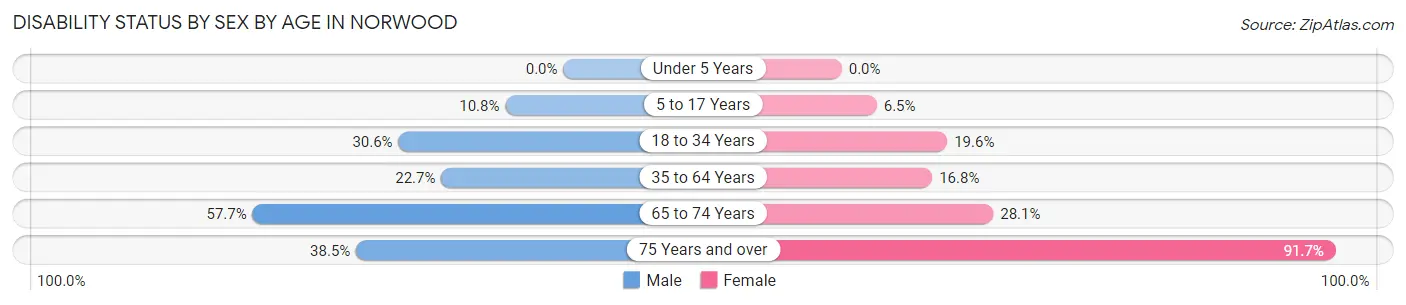
| Age Bracket | Male | Female |
| Under 5 Years | 0 (0.0%) | 0 (0.0%) |
| 5 to 17 Years | 14 (10.8%) | 8 (6.5%) |
| 18 to 34 Years | 15 (30.6%) | 27 (19.6%) |
| 35 to 64 Years | 29 (22.7%) | 23 (16.8%) |
| 65 to 74 Years | 15 (57.7%) | 9 (28.1%) |
| 75 Years and over | 10 (38.5%) | 22 (91.7%) |
Disability Class by Sex by Age in Norwood
Disability Class: Hearing Difficulty
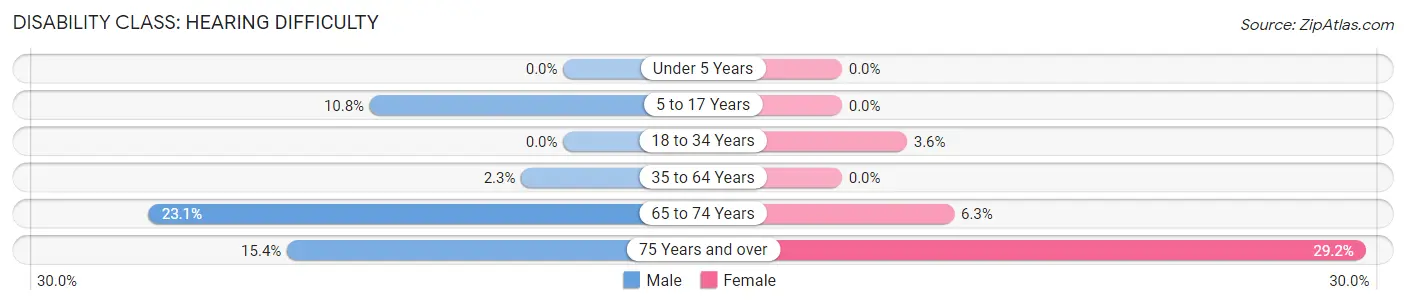
| Age Bracket | Male | Female |
| Under 5 Years | 0 (0.0%) | 0 (0.0%) |
| 5 to 17 Years | 14 (10.8%) | 0 (0.0%) |
| 18 to 34 Years | 0 (0.0%) | 5 (3.6%) |
| 35 to 64 Years | 3 (2.3%) | 0 (0.0%) |
| 65 to 74 Years | 6 (23.1%) | 2 (6.2%) |
| 75 Years and over | 4 (15.4%) | 7 (29.2%) |
Disability Class: Vision Difficulty
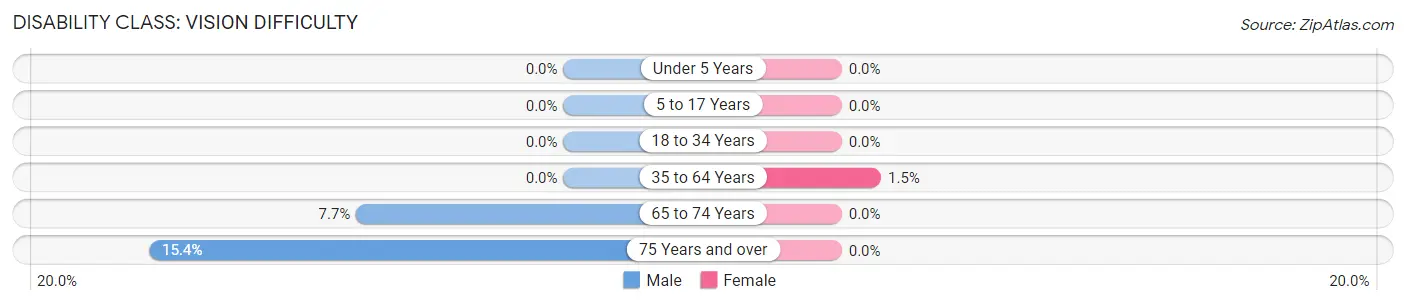
| Age Bracket | Male | Female |
| Under 5 Years | 0 (0.0%) | 0 (0.0%) |
| 5 to 17 Years | 0 (0.0%) | 0 (0.0%) |
| 18 to 34 Years | 0 (0.0%) | 0 (0.0%) |
| 35 to 64 Years | 0 (0.0%) | 2 (1.5%) |
| 65 to 74 Years | 2 (7.7%) | 0 (0.0%) |
| 75 Years and over | 4 (15.4%) | 0 (0.0%) |
Disability Class: Cognitive Difficulty
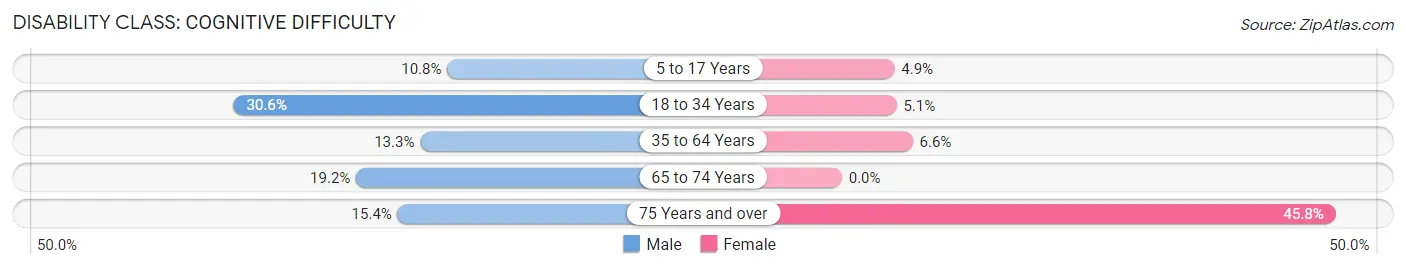
| Age Bracket | Male | Female |
| 5 to 17 Years | 14 (10.8%) | 6 (4.9%) |
| 18 to 34 Years | 15 (30.6%) | 7 (5.1%) |
| 35 to 64 Years | 17 (13.3%) | 9 (6.6%) |
| 65 to 74 Years | 5 (19.2%) | 0 (0.0%) |
| 75 Years and over | 4 (15.4%) | 11 (45.8%) |
Disability Class: Ambulatory Difficulty
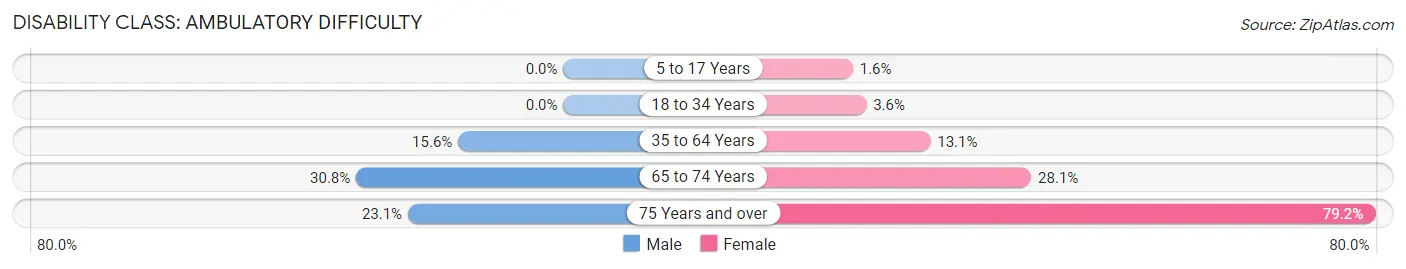
| Age Bracket | Male | Female |
| 5 to 17 Years | 0 (0.0%) | 2 (1.6%) |
| 18 to 34 Years | 0 (0.0%) | 5 (3.6%) |
| 35 to 64 Years | 20 (15.6%) | 18 (13.1%) |
| 65 to 74 Years | 8 (30.8%) | 9 (28.1%) |
| 75 Years and over | 6 (23.1%) | 19 (79.2%) |
Disability Class: Self-Care Difficulty
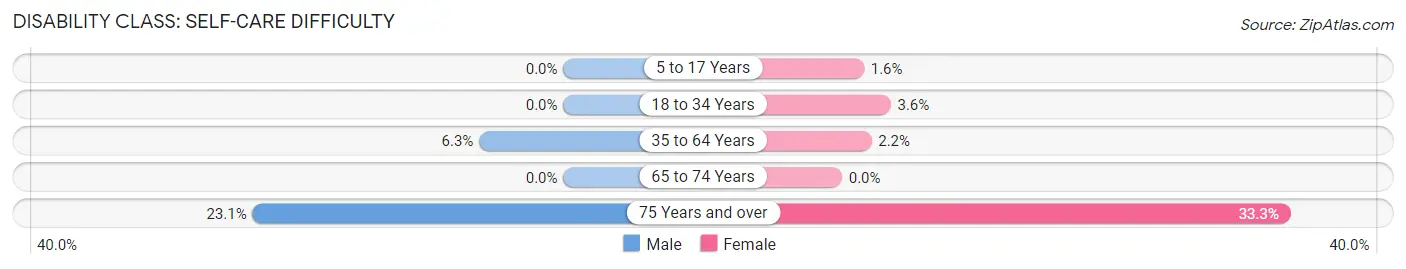
| Age Bracket | Male | Female |
| 5 to 17 Years | 0 (0.0%) | 2 (1.6%) |
| 18 to 34 Years | 0 (0.0%) | 5 (3.6%) |
| 35 to 64 Years | 8 (6.2%) | 3 (2.2%) |
| 65 to 74 Years | 0 (0.0%) | 0 (0.0%) |
| 75 Years and over | 6 (23.1%) | 8 (33.3%) |
Technology Access in Norwood
Computing Device Access in Norwood
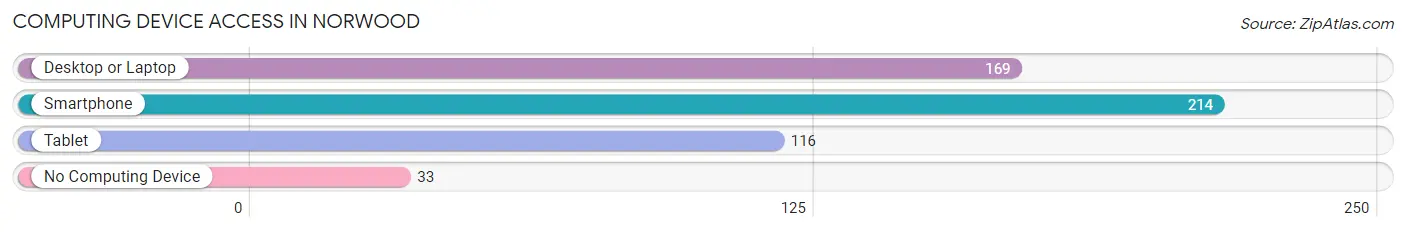
| Device Type | # Households | % Households |
| Desktop or Laptop | 169 | 63.8% |
| Smartphone | 214 | 80.7% |
| Tablet | 116 | 43.8% |
| No Computing Device | 33 | 12.4% |
| Total | 265 | 100.0% |
Internet Access in Norwood
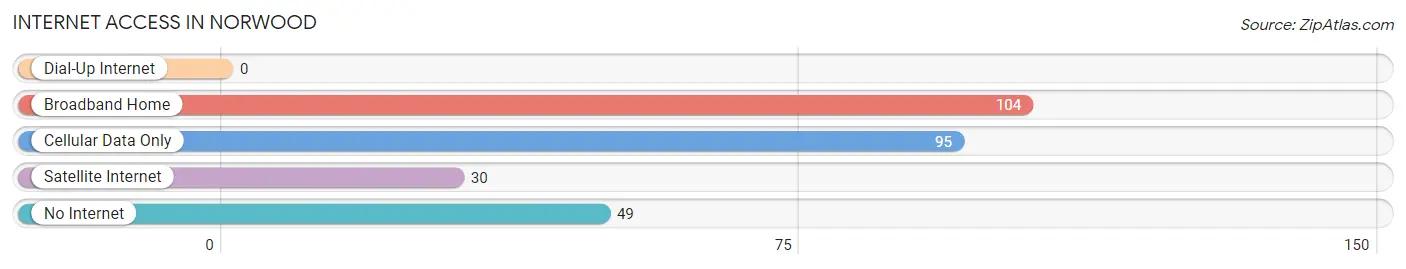
| Internet Type | # Households | % Households |
| Dial-Up Internet | 0 | 0.0% |
| Broadband Home | 104 | 39.3% |
| Cellular Data Only | 95 | 35.8% |
| Satellite Internet | 30 | 11.3% |
| No Internet | 49 | 18.5% |
| Total | 265 | 100.0% |
Norwood Summary
Norwood, Missouri is a small city located in Wright County, Missouri. It is situated in the Ozark Mountains, approximately 30 miles east of Springfield. The city has a population of approximately 1,500 people and is the county seat of Wright County.
History
Norwood was founded in 1871 by a group of settlers from the nearby town of Hartville. The town was named after Norwood, Ohio, the hometown of one of the settlers. The town was incorporated in 1876 and was the first town in Wright County to be incorporated.
The town was originally a farming community, but in the early 1900s, the town began to grow and develop. The first bank was established in 1906, and the first newspaper was established in 1907. The town also had a post office, a hotel, a blacksmith shop, and a general store.
In the 1920s, the town began to experience a period of growth and development. The first school was built in 1921, and the first hospital was built in 1923. The town also had a movie theater, a library, and a number of churches.
In the 1950s, the town began to experience a period of decline. The population began to decline, and many businesses began to close. The town was also affected by the Great Depression and World War II.
In the 1970s, the town began to experience a period of revitalization. The population began to increase, and new businesses began to open. The town also began to attract new residents, and the economy began to improve.
Geography
Norwood is located in the Ozark Mountains in Wright County, Missouri. The city is situated at the intersection of US Highway 60 and Missouri Highway 5. The city is located approximately 30 miles east of Springfield and approximately 50 miles west of St. Louis.
The city is located in a hilly area, and the terrain is mostly wooded. The city is located in a valley, and the surrounding area is mostly farmland. The city is located near several rivers, including the Gasconade River, the Big Piney River, and the Little Piney River.
Economy
The economy of Norwood is largely based on agriculture and tourism. The city is home to several farms, and the surrounding area is mostly farmland. The city is also home to several tourist attractions, including the Ozark National Scenic Riverways, the Mark Twain National Forest, and the Big Piney River.
The city is also home to several businesses, including restaurants, retail stores, and service businesses. The city is also home to several manufacturing companies, including a furniture factory and a plastics factory.
Demographics
As of the 2010 census, the population of Norwood was 1,500. The racial makeup of the city was 97.3% White, 0.7% African American, 0.3% Native American, 0.3% Asian, 0.3% from other races, and 1.3% from two or more races. Hispanic or Latino of any race were 1.3% of the population.
The median income for a household in the city was $35,000, and the median income for a family was $41,000. The per capita income for the city was $17,000. About 15.3% of families and 17.3% of the population were below the poverty line, including 25.3% of those under age 18 and 8.3% of those age 65 or over.
Common Questions
What is Per Capita Income in Norwood?
Per Capita income in Norwood is $23,406.
What is the Median Family Income in Norwood?
Median Family Income in Norwood is $43,375.
What is the Median Household income in Norwood?
Median Household Income in Norwood is $37,614.
What is Income or Wage Gap in Norwood?
Income or Wage Gap in Norwood is 73.8%.
Women in Norwood earn 26.2 cents for every dollar earned by a man.
What is Family Income Deficit in Norwood?
Family Income Deficit in Norwood is $13,006.
Families that are below poverty line in Norwood earn $13,006 less on average than the poverty threshold level.
What is Inequality or Gini Index in Norwood?
Inequality or Gini Index in Norwood is 0.62.
What is the Total Population of Norwood?
Total Population of Norwood is 862.
What is the Total Male Population of Norwood?
Total Male Population of Norwood is 394.
What is the Total Female Population of Norwood?
Total Female Population of Norwood is 468.
What is the Ratio of Males per 100 Females in Norwood?
There are 84.19 Males per 100 Females in Norwood.
What is the Ratio of Females per 100 Males in Norwood?
There are 118.78 Females per 100 Males in Norwood.
What is the Median Population Age in Norwood?
Median Population Age in Norwood is 29.8 Years.
What is the Average Family Size in Norwood
Average Family Size in Norwood is 3.6 People.
What is the Average Household Size in Norwood
Average Household Size in Norwood is 3.2 People.
How Large is the Labor Force in Norwood?
There are 332 People in the Labor Forcein in Norwood.
What is the Percentage of People in the Labor Force in Norwood?
55.9% of People are in the Labor Force in Norwood.
What is the Unemployment Rate in Norwood?
Unemployment Rate in Norwood is 10.5%.