Steelville, MO Map & Demographics
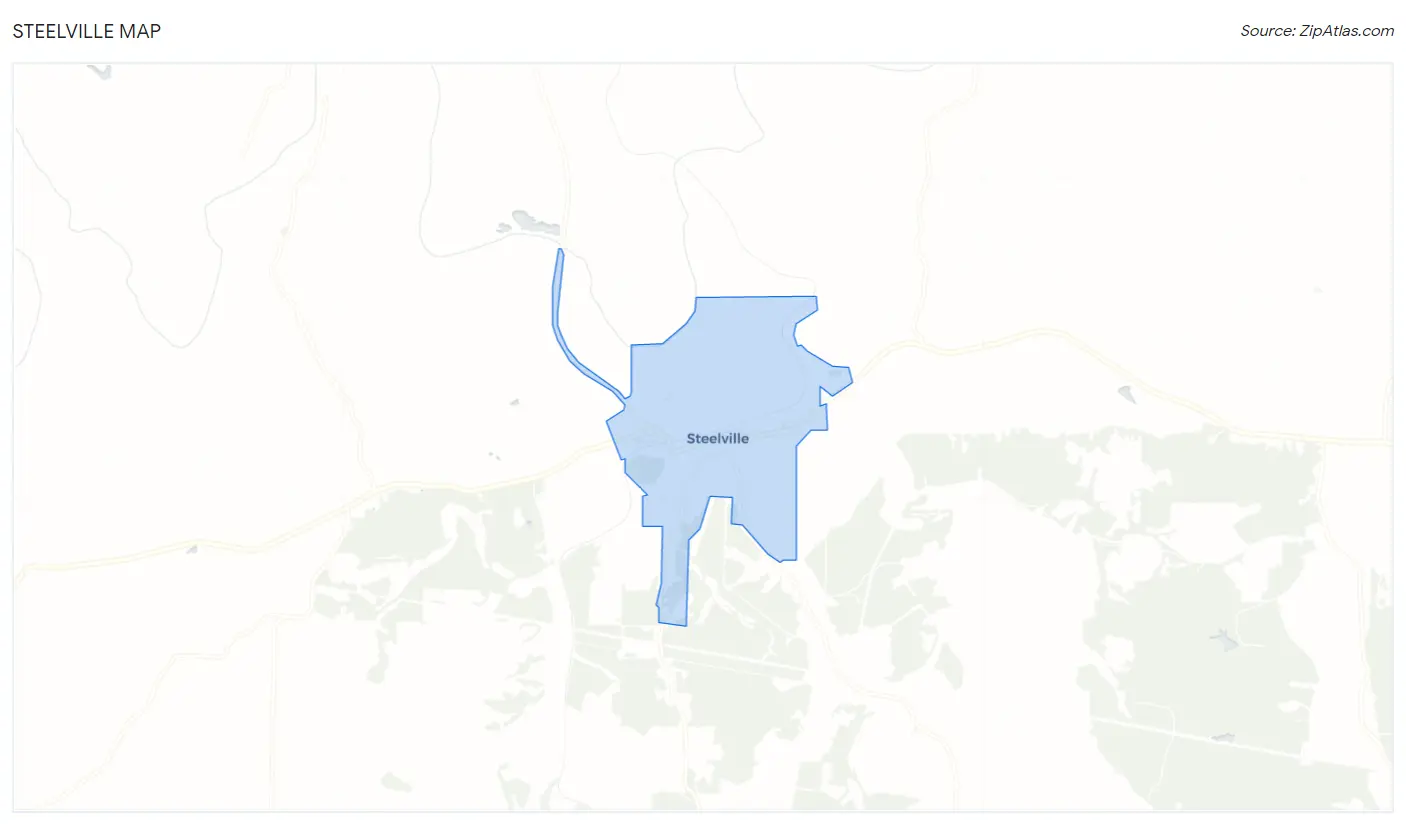
Steelville Map
Steelville Overview
$17,792
PER CAPITA INCOME
$47,396
AVG FAMILY INCOME
$35,000
AVG HOUSEHOLD INCOME
20.0%
WAGE / INCOME GAP [ % ]
80.0¢/ $1
WAGE / INCOME GAP [ $ ]
0.40
INEQUALITY / GINI INDEX
1,515
TOTAL POPULATION
792
MALE POPULATION
723
FEMALE POPULATION
109.54
MALES / 100 FEMALES
91.29
FEMALES / 100 MALES
40.1
MEDIAN AGE
3.3
AVG FAMILY SIZE
2.3
AVG HOUSEHOLD SIZE
558
LABOR FORCE [ PEOPLE ]
44.8%
PERCENT IN LABOR FORCE
9.1%
UNEMPLOYMENT RATE
Steelville Zip Codes
Steelville Area Codes
Income in Steelville
Income Overview in Steelville
Per Capita Income in Steelville is $17,792, while median incomes of families and households are $47,396 and $35,000 respectively.
| Characteristic | Number | Measure |
| Per Capita Income | 1,515 | $17,792 |
| Median Family Income | 300 | $47,396 |
| Mean Family Income | 300 | $52,706 |
| Median Household Income | 592 | $35,000 |
| Mean Household Income | 592 | $43,629 |
| Income Deficit | 300 | $0 |
| Wage / Income Gap (%) | 1,515 | 19.96% |
| Wage / Income Gap ($) | 1,515 | 80.04¢ per $1 |
| Gini / Inequality Index | 1,515 | 0.40 |
Earnings by Sex in Steelville
Average Earnings in Steelville are $29,205, $30,455 for men and $24,375 for women, a difference of 20.0%.
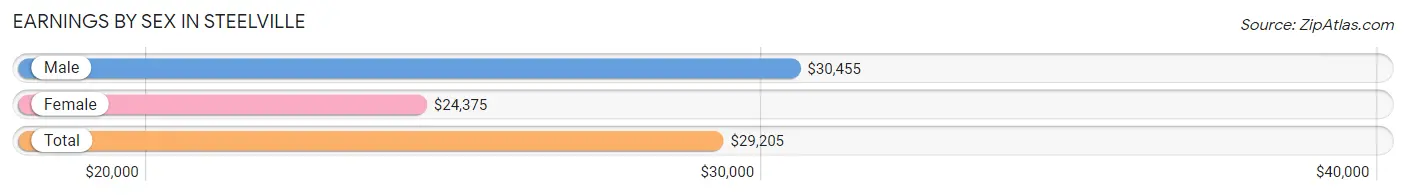
| Sex | Number | Average Earnings |
| Male | 366 (60.5%) | $30,455 |
| Female | 239 (39.5%) | $24,375 |
| Total | 605 (100.0%) | $29,205 |
Earnings by Sex by Income Bracket in Steelville
The most common earnings brackets in Steelville are $35,000 to $39,999 for men (66 | 18.0%) and $35,000 to $39,999 for women (37 | 15.5%).
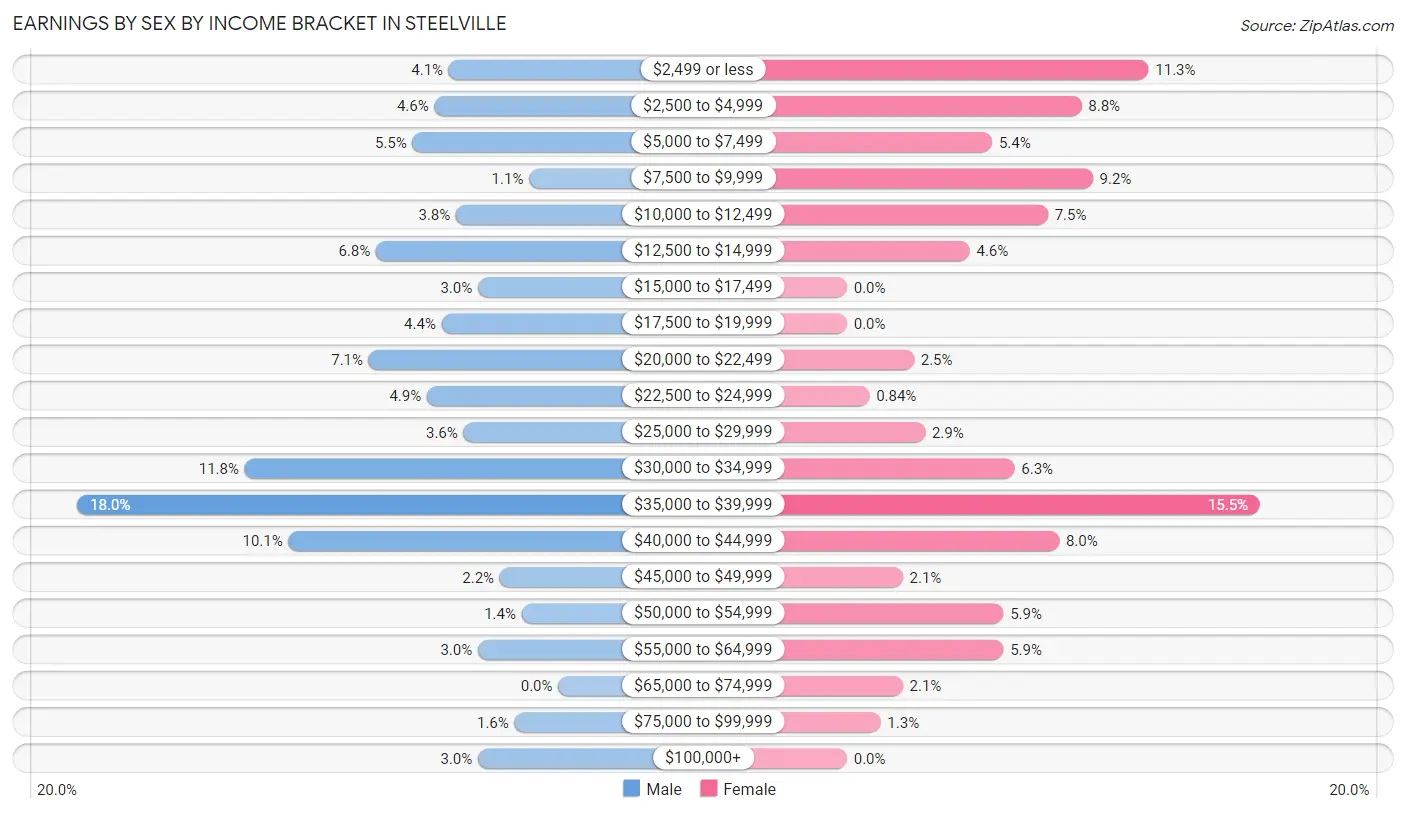
| Income | Male | Female |
| $2,499 or less | 15 (4.1%) | 27 (11.3%) |
| $2,500 to $4,999 | 17 (4.6%) | 21 (8.8%) |
| $5,000 to $7,499 | 20 (5.5%) | 13 (5.4%) |
| $7,500 to $9,999 | 4 (1.1%) | 22 (9.2%) |
| $10,000 to $12,499 | 14 (3.8%) | 18 (7.5%) |
| $12,500 to $14,999 | 25 (6.8%) | 11 (4.6%) |
| $15,000 to $17,499 | 11 (3.0%) | 0 (0.0%) |
| $17,500 to $19,999 | 16 (4.4%) | 0 (0.0%) |
| $20,000 to $22,499 | 26 (7.1%) | 6 (2.5%) |
| $22,500 to $24,999 | 18 (4.9%) | 2 (0.8%) |
| $25,000 to $29,999 | 13 (3.5%) | 7 (2.9%) |
| $30,000 to $34,999 | 43 (11.7%) | 15 (6.3%) |
| $35,000 to $39,999 | 66 (18.0%) | 37 (15.5%) |
| $40,000 to $44,999 | 37 (10.1%) | 19 (8.0%) |
| $45,000 to $49,999 | 8 (2.2%) | 5 (2.1%) |
| $50,000 to $54,999 | 5 (1.4%) | 14 (5.9%) |
| $55,000 to $64,999 | 11 (3.0%) | 14 (5.9%) |
| $65,000 to $74,999 | 0 (0.0%) | 5 (2.1%) |
| $75,000 to $99,999 | 6 (1.6%) | 3 (1.3%) |
| $100,000+ | 11 (3.0%) | 0 (0.0%) |
| Total | 366 (100.0%) | 239 (100.0%) |
Earnings by Sex by Educational Attainment in Steelville
Average earnings in Steelville are $33,333 for men and $35,000 for women, a difference of 4.8%. Men with an educational attainment of less than high school enjoy the highest average annual earnings of $42,778, while those with college or associate's degree education earn the least with $26,250. Women with an educational attainment of graduate degree earn the most with the average annual earnings of $50,795, while those with college or associate's degree education have the smallest earnings of $33,854.
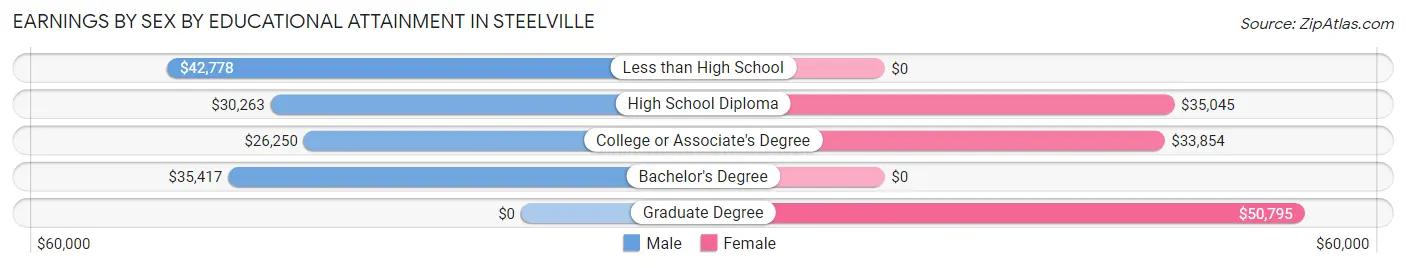
| Educational Attainment | Male Income | Female Income |
| Less than High School | $42,778 | $0 |
| High School Diploma | $30,263 | $35,045 |
| College or Associate's Degree | $26,250 | $33,854 |
| Bachelor's Degree | $35,417 | $0 |
| Graduate Degree | - | - |
| Total | $33,333 | $35,000 |
Family Income in Steelville
Family Income Brackets in Steelville
According to the Steelville family income data, there are 71 families falling into the $50,000 to $74,999 income range, which is the most common income bracket and makes up 23.7% of all families.
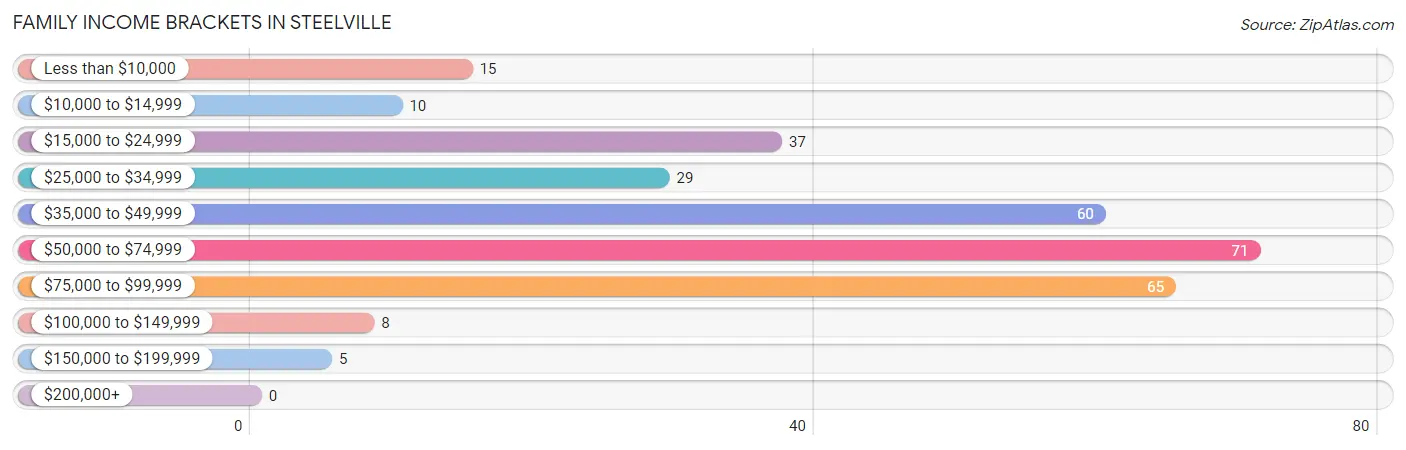
| Income Bracket | # Families | % Families |
| Less than $10,000 | 15 | 5.0% |
| $10,000 to $14,999 | 10 | 3.3% |
| $15,000 to $24,999 | 37 | 12.3% |
| $25,000 to $34,999 | 29 | 9.7% |
| $35,000 to $49,999 | 60 | 20.0% |
| $50,000 to $74,999 | 71 | 23.7% |
| $75,000 to $99,999 | 65 | 21.7% |
| $100,000 to $149,999 | 8 | 2.7% |
| $150,000 to $199,999 | 5 | 1.7% |
| $200,000+ | 0 | 0.0% |
Family Income by Famaliy Size in Steelville
3-person families (119 | 39.7%) account for the highest median family income in Steelville with $56,250 per family, while 2-person families (112 | 37.3%) have the highest median income of $21,172 per family member.
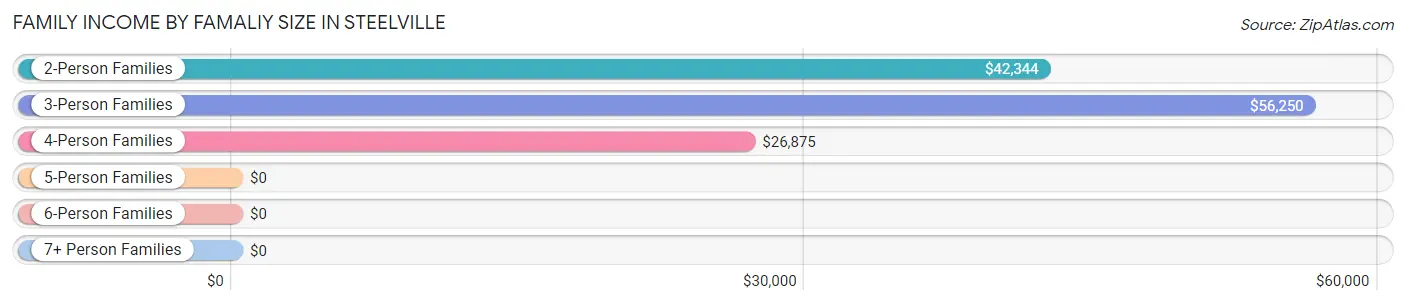
| Income Bracket | # Families | Median Income |
| 2-Person Families | 112 (37.3%) | $42,344 |
| 3-Person Families | 119 (39.7%) | $56,250 |
| 4-Person Families | 54 (18.0%) | $26,875 |
| 5-Person Families | 6 (2.0%) | $0 |
| 6-Person Families | 5 (1.7%) | $0 |
| 7+ Person Families | 4 (1.3%) | $0 |
| Total | 300 (100.0%) | $47,396 |
Family Income by Number of Earners in Steelville
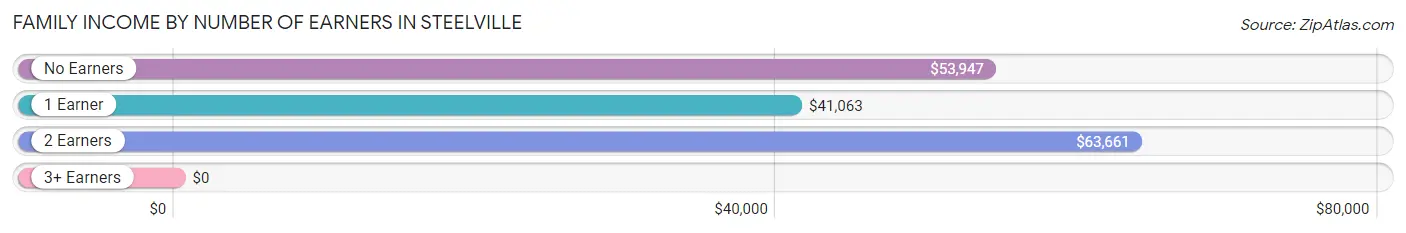
| Number of Earners | # Families | Median Income |
| No Earners | 58 (19.3%) | $53,947 |
| 1 Earner | 109 (36.3%) | $41,063 |
| 2 Earners | 121 (40.3%) | $63,661 |
| 3+ Earners | 12 (4.0%) | $0 |
| Total | 300 (100.0%) | $47,396 |
Household Income in Steelville
Household Income Brackets in Steelville
With 116 households falling in the category, the $50,000 to $74,999 income range is the most frequent in Steelville, accounting for 19.6% of all households.
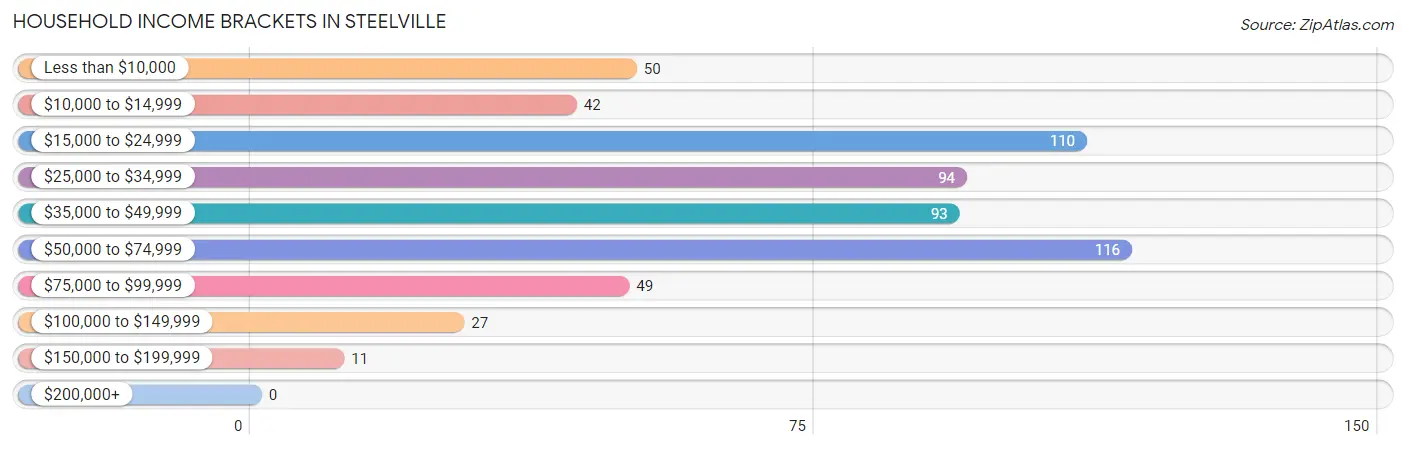
| Income Bracket | # Households | % Households |
| Less than $10,000 | 50 | 8.4% |
| $10,000 to $14,999 | 42 | 7.1% |
| $15,000 to $24,999 | 110 | 18.6% |
| $25,000 to $34,999 | 94 | 15.9% |
| $35,000 to $49,999 | 93 | 15.7% |
| $50,000 to $74,999 | 116 | 19.6% |
| $75,000 to $99,999 | 49 | 8.3% |
| $100,000 to $149,999 | 27 | 4.6% |
| $150,000 to $199,999 | 11 | 1.9% |
| $200,000+ | 0 | 0.0% |
Household Income by Householder Age in Steelville
The median household income in Steelville is $35,000, with the highest median household income of $46,979 found in the 25 to 44 years age bracket for the primary householder. A total of 149 households (25.2%) fall into this category. Meanwhile, the 15 to 24 years age bracket for the primary householder has the lowest median household income of $0, with 35 households (5.9%) in this group.
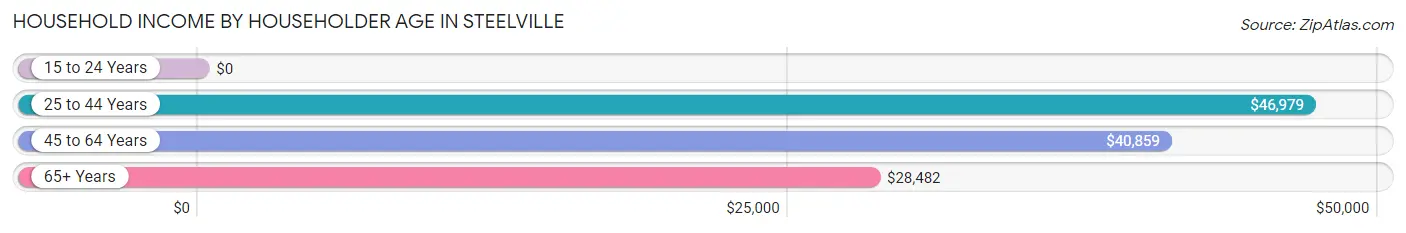
| Income Bracket | # Households | Median Income |
| 15 to 24 Years | 35 (5.9%) | $0 |
| 25 to 44 Years | 149 (25.2%) | $46,979 |
| 45 to 64 Years | 223 (37.7%) | $40,859 |
| 65+ Years | 185 (31.2%) | $28,482 |
| Total | 592 (100.0%) | $35,000 |
Poverty in Steelville
Income Below Poverty by Sex and Age in Steelville
With 21.1% poverty level for males and 26.4% for females among the residents of Steelville, under 5 year old males and 16 and 17 year old females are the most vulnerable to poverty, with 1 males (100.0%) and 11 females (100.0%) in their respective age groups living below the poverty level.
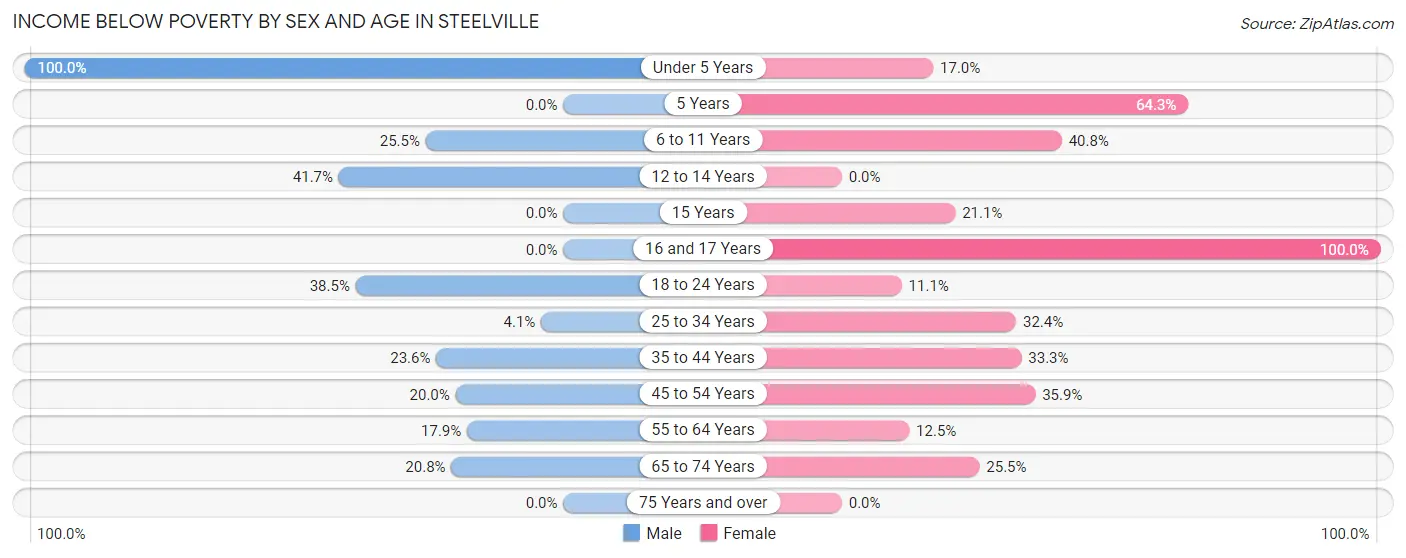
| Age Bracket | Male | Female |
| Under 5 Years | 1 (100.0%) | 10 (17.0%) |
| 5 Years | 0 (0.0%) | 9 (64.3%) |
| 6 to 11 Years | 24 (25.5%) | 20 (40.8%) |
| 12 to 14 Years | 5 (41.7%) | 0 (0.0%) |
| 15 Years | 0 (0.0%) | 4 (21.0%) |
| 16 and 17 Years | 0 (0.0%) | 11 (100.0%) |
| 18 to 24 Years | 37 (38.5%) | 4 (11.1%) |
| 25 to 34 Years | 3 (4.1%) | 22 (32.4%) |
| 35 to 44 Years | 25 (23.6%) | 21 (33.3%) |
| 45 to 54 Years | 22 (20.0%) | 28 (35.9%) |
| 55 to 64 Years | 10 (17.9%) | 10 (12.5%) |
| 65 to 74 Years | 16 (20.8%) | 36 (25.5%) |
| 75 Years and over | 0 (0.0%) | 0 (0.0%) |
| Total | 143 (21.1%) | 175 (26.4%) |
Income Above Poverty by Sex and Age in Steelville
According to the poverty statistics in Steelville, males aged 16 and 17 years and females aged 12 to 14 years are the age groups that are most secure financially, with 100.0% of males and 100.0% of females in these age groups living above the poverty line.
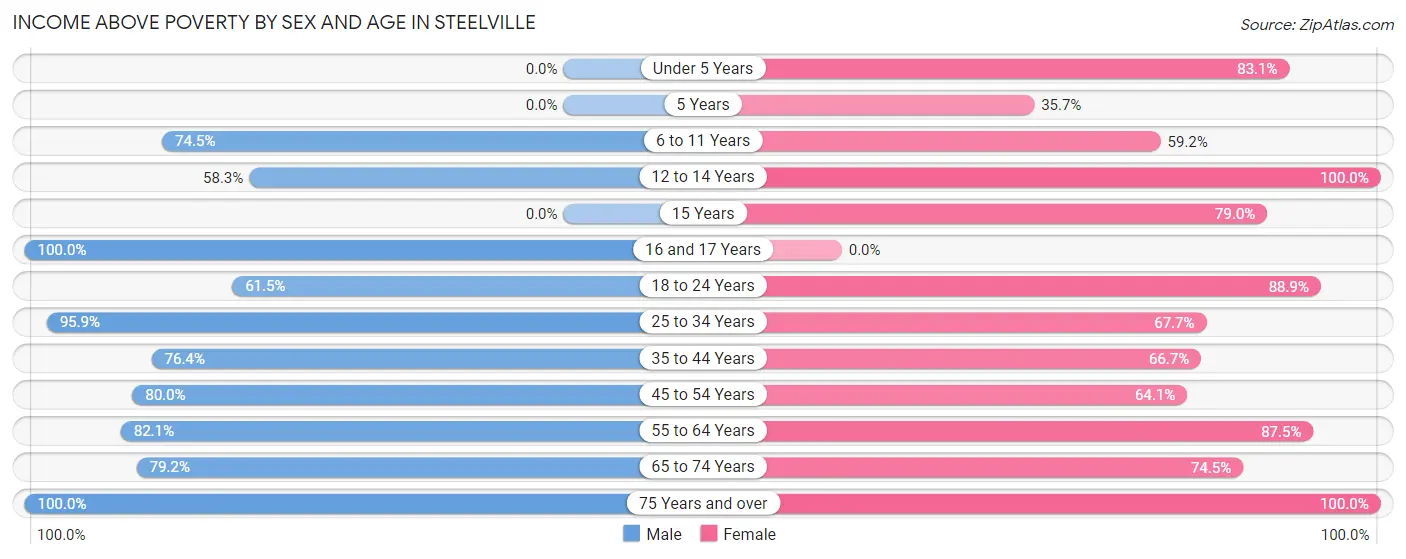
| Age Bracket | Male | Female |
| Under 5 Years | 0 (0.0%) | 49 (83.1%) |
| 5 Years | 0 (0.0%) | 5 (35.7%) |
| 6 to 11 Years | 70 (74.5%) | 29 (59.2%) |
| 12 to 14 Years | 7 (58.3%) | 15 (100.0%) |
| 15 Years | 0 (0.0%) | 15 (78.9%) |
| 16 and 17 Years | 27 (100.0%) | 0 (0.0%) |
| 18 to 24 Years | 59 (61.5%) | 32 (88.9%) |
| 25 to 34 Years | 70 (95.9%) | 46 (67.6%) |
| 35 to 44 Years | 81 (76.4%) | 42 (66.7%) |
| 45 to 54 Years | 88 (80.0%) | 50 (64.1%) |
| 55 to 64 Years | 46 (82.1%) | 70 (87.5%) |
| 65 to 74 Years | 61 (79.2%) | 105 (74.5%) |
| 75 Years and over | 24 (100.0%) | 31 (100.0%) |
| Total | 533 (78.8%) | 489 (73.6%) |
Income Below Poverty Among Married-Couple Families in Steelville
The poverty statistics for married-couple families in Steelville show that 12.6% or 23 of the total 183 families live below the poverty line. Families with 1 or 2 children have the highest poverty rate of 23.4%, comprising of 15 families. On the other hand, families with 3 or 4 children have the lowest poverty rate of 0.0%, which includes 0 families.
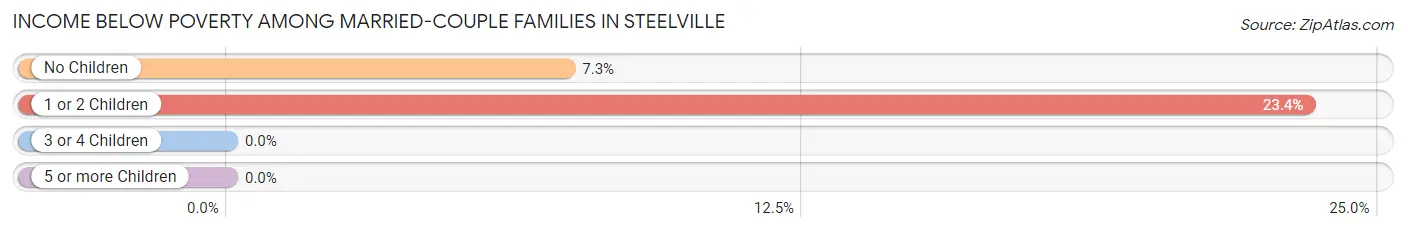
| Children | Above Poverty | Below Poverty |
| No Children | 101 (92.7%) | 8 (7.3%) |
| 1 or 2 Children | 49 (76.6%) | 15 (23.4%) |
| 3 or 4 Children | 10 (100.0%) | 0 (0.0%) |
| 5 or more Children | 0 (0.0%) | 0 (0.0%) |
| Total | 160 (87.4%) | 23 (12.6%) |
Income Below Poverty Among Single-Parent Households in Steelville
According to the poverty data in Steelville, 20.5% or 8 single-father households and 38.5% or 30 single-mother households are living below the poverty line. Among single-father households, those with 3 or 4 children have the highest poverty rate, with 8 households (100.0%) experiencing poverty. Likewise, among single-mother households, those with 1 or 2 children have the highest poverty rate, with 18 households (51.4%) falling below the poverty line.
| Children | Single Father | Single Mother |
| No Children | 0 (0.0%) | 12 (35.3%) |
| 1 or 2 Children | 0 (0.0%) | 18 (51.4%) |
| 3 or 4 Children | 8 (100.0%) | 0 (0.0%) |
| 5 or more Children | 0 (0.0%) | 0 (0.0%) |
| Total | 8 (20.5%) | 30 (38.5%) |
Income Below Poverty Among Married-Couple vs Single-Parent Households in Steelville
The poverty data for Steelville shows that 23 of the married-couple family households (12.6%) and 38 of the single-parent households (32.5%) are living below the poverty level. Within the married-couple family households, those with 1 or 2 children have the highest poverty rate, with 15 households (23.4%) falling below the poverty line. Among the single-parent households, those with 3 or 4 children have the highest poverty rate, with 8 household (47.1%) living below poverty.
| Children | Married-Couple Families | Single-Parent Households |
| No Children | 8 (7.3%) | 12 (19.7%) |
| 1 or 2 Children | 15 (23.4%) | 18 (46.2%) |
| 3 or 4 Children | 0 (0.0%) | 8 (47.1%) |
| 5 or more Children | 0 (0.0%) | 0 (0.0%) |
| Total | 23 (12.6%) | 38 (32.5%) |
Race in Steelville
The most populous races in Steelville are White / Caucasian (1,356 | 89.5%), Two or more Races (97 | 6.4%), and Black / African American (36 | 2.4%).
| Race | # Population | % Population |
| Asian | 3 | 0.2% |
| Black / African American | 36 | 2.4% |
| Hawaiian / Pacific | 0 | 0.0% |
| Hispanic or Latino | 12 | 0.8% |
| Native / Alaskan | 0 | 0.0% |
| White / Caucasian | 1,356 | 89.5% |
| Two or more Races | 97 | 6.4% |
| Some other Race | 23 | 1.5% |
| Total | 1,515 | 100.0% |
Ancestry in Steelville
The most populous ancestries reported in Steelville are American (221 | 14.6%), German (221 | 14.6%), Irish (197 | 13.0%), French (79 | 5.2%), and English (73 | 4.8%), together accounting for 52.2% of all Steelville residents.
| Ancestry | # Population | % Population |
| American | 221 | 14.6% |
| Cajun | 5 | 0.3% |
| Cherokee | 6 | 0.4% |
| Croatian | 3 | 0.2% |
| Dutch | 8 | 0.5% |
| English | 73 | 4.8% |
| European | 21 | 1.4% |
| French | 79 | 5.2% |
| French Canadian | 4 | 0.3% |
| German | 221 | 14.6% |
| Hungarian | 4 | 0.3% |
| Irish | 197 | 13.0% |
| Italian | 15 | 1.0% |
| Korean | 3 | 0.2% |
| Mexican | 12 | 0.8% |
| Scotch-Irish | 38 | 2.5% |
| Scottish | 4 | 0.3% |
| Swedish | 3 | 0.2% |
| Yup'ik | 6 | 0.4% | View All 19 Rows |
Immigrants in Steelville
The most numerous immigrant groups reported in Steelville came from Asia (3 | 0.2%), Philippines (3 | 0.2%), and South Eastern Asia (3 | 0.2%), together accounting for 0.6% of all Steelville residents.
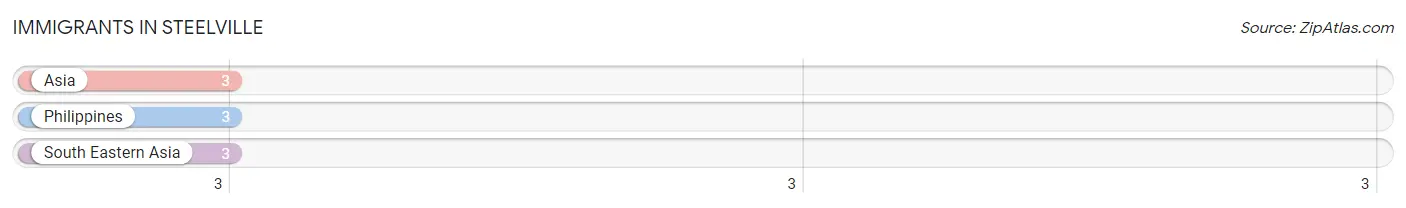
| Immigration Origin | # Population | % Population |
| Asia | 3 | 0.2% |
| Philippines | 3 | 0.2% |
| South Eastern Asia | 3 | 0.2% | View All 3 Rows |
Sex and Age in Steelville
Sex and Age in Steelville
The most populous age groups in Steelville are 20 to 24 Years (100 | 12.6%) for men and 65 to 69 Years (91 | 12.6%) for women.
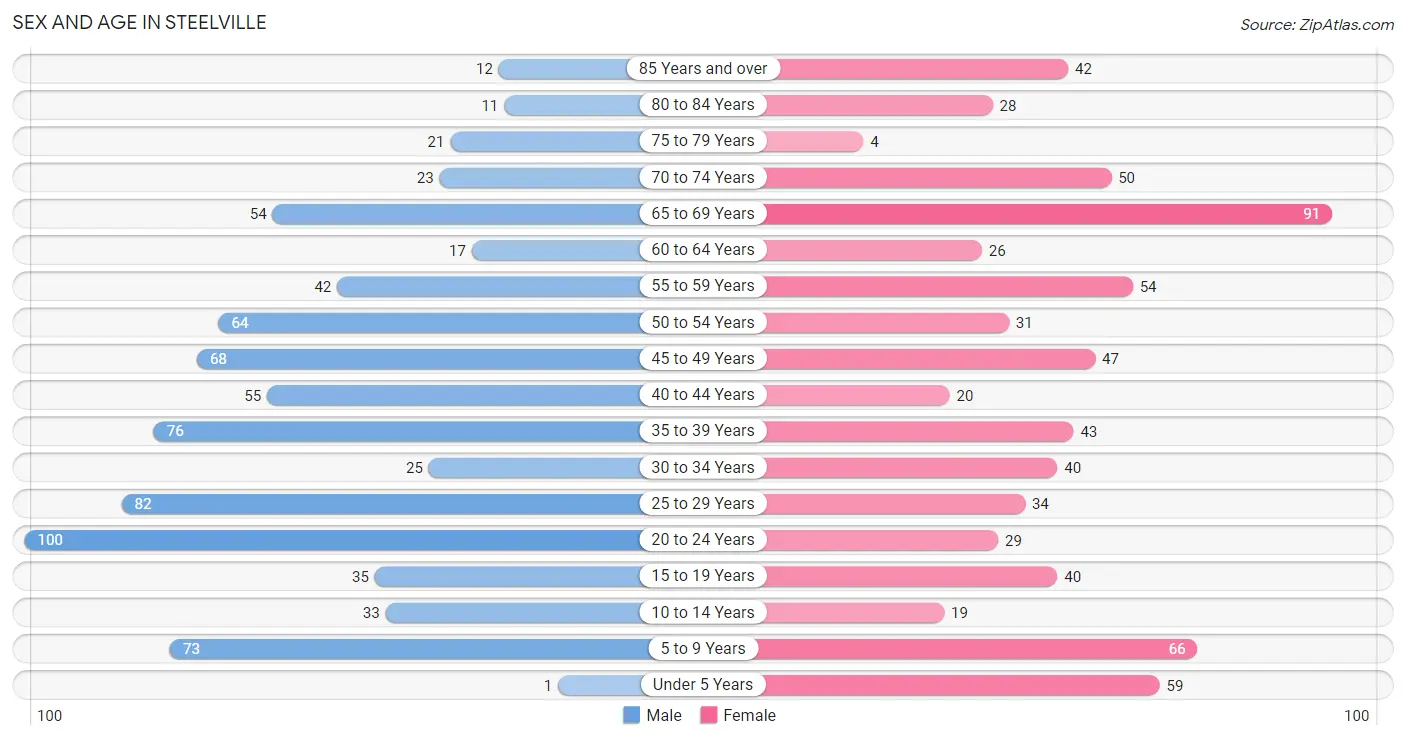
| Age Bracket | Male | Female |
| Under 5 Years | 1 (0.1%) | 59 (8.2%) |
| 5 to 9 Years | 73 (9.2%) | 66 (9.1%) |
| 10 to 14 Years | 33 (4.2%) | 19 (2.6%) |
| 15 to 19 Years | 35 (4.4%) | 40 (5.5%) |
| 20 to 24 Years | 100 (12.6%) | 29 (4.0%) |
| 25 to 29 Years | 82 (10.3%) | 34 (4.7%) |
| 30 to 34 Years | 25 (3.2%) | 40 (5.5%) |
| 35 to 39 Years | 76 (9.6%) | 43 (5.9%) |
| 40 to 44 Years | 55 (6.9%) | 20 (2.8%) |
| 45 to 49 Years | 68 (8.6%) | 47 (6.5%) |
| 50 to 54 Years | 64 (8.1%) | 31 (4.3%) |
| 55 to 59 Years | 42 (5.3%) | 54 (7.5%) |
| 60 to 64 Years | 17 (2.1%) | 26 (3.6%) |
| 65 to 69 Years | 54 (6.8%) | 91 (12.6%) |
| 70 to 74 Years | 23 (2.9%) | 50 (6.9%) |
| 75 to 79 Years | 21 (2.6%) | 4 (0.5%) |
| 80 to 84 Years | 11 (1.4%) | 28 (3.9%) |
| 85 Years and over | 12 (1.5%) | 42 (5.8%) |
| Total | 792 (100.0%) | 723 (100.0%) |
Families and Households in Steelville
Median Family Size in Steelville
The median family size in Steelville is 3.26 persons per family, with single female/mother families (78 | 26.0%) accounting for the largest median family size of 3.73 persons per family. On the other hand, single male/father families (39 | 13.0%) represent the smallest median family size with 2.90 persons per family.
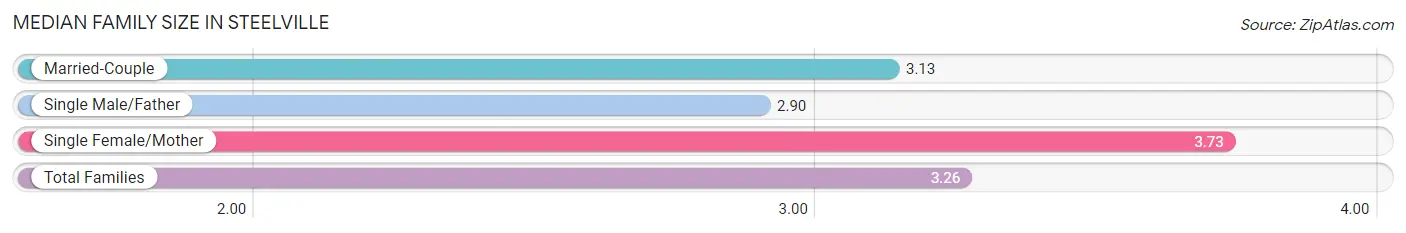
| Family Type | # Families | Family Size |
| Married-Couple | 183 (61.0%) | 3.13 |
| Single Male/Father | 39 (13.0%) | 2.90 |
| Single Female/Mother | 78 (26.0%) | 3.73 |
| Total Families | 300 (100.0%) | 3.26 |
Median Household Size in Steelville
The median household size in Steelville is 2.28 persons per household, with single female/mother households (78 | 13.2%) accounting for the largest median household size of 3.87 persons per household. non-family households (292 | 49.3%) represent the smallest median household size with 1.13 persons per household.
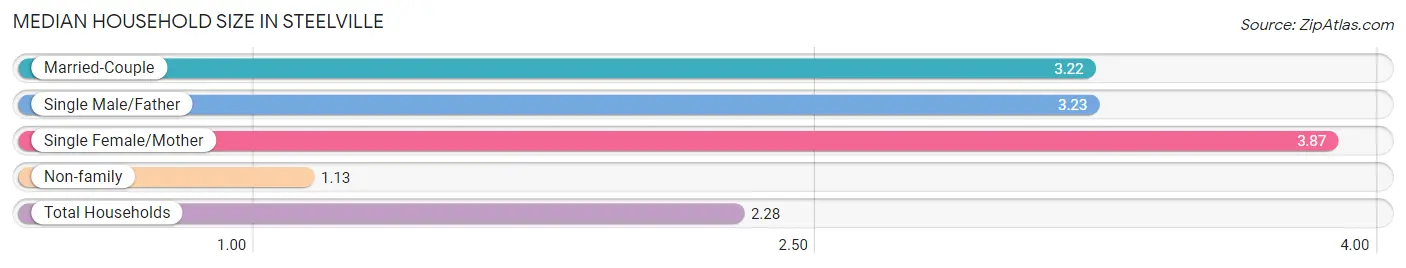
| Household Type | # Households | Household Size |
| Married-Couple | 183 (30.9%) | 3.22 |
| Single Male/Father | 39 (6.6%) | 3.23 |
| Single Female/Mother | 78 (13.2%) | 3.87 |
| Non-family | 292 (49.3%) | 1.13 |
| Total Households | 592 (100.0%) | 2.28 |
Household Size by Marriage Status in Steelville
Out of a total of 592 households in Steelville, 300 (50.7%) are family households, while 292 (49.3%) are nonfamily households. The most numerous type of family households are 2-person households, comprising 112, and the most common type of nonfamily households are 1-person households, comprising 270.
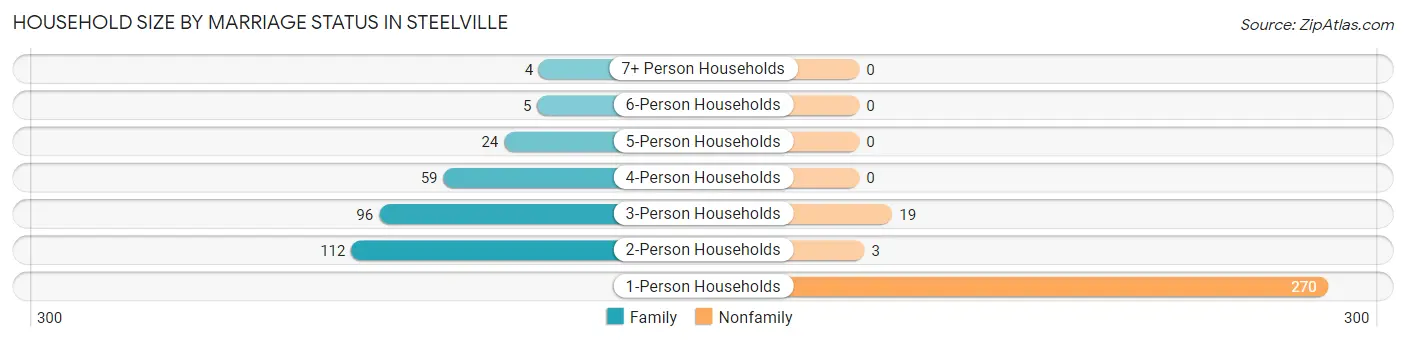
| Household Size | Family Households | Nonfamily Households |
| 1-Person Households | - | 270 (45.6%) |
| 2-Person Households | 112 (18.9%) | 3 (0.5%) |
| 3-Person Households | 96 (16.2%) | 19 (3.2%) |
| 4-Person Households | 59 (10.0%) | 0 (0.0%) |
| 5-Person Households | 24 (4.1%) | 0 (0.0%) |
| 6-Person Households | 5 (0.8%) | 0 (0.0%) |
| 7+ Person Households | 4 (0.7%) | 0 (0.0%) |
| Total | 300 (50.7%) | 292 (49.3%) |
Female Fertility in Steelville
Fertility by Age in Steelville
Average fertility rate in Steelville is 107.0 births per 1,000 women. Women in the age bracket of 35 to 50 years have the highest fertility rate with 136.0 births per 1,000 women. Women in the age bracket of 35 to 50 years acount for 55.6% of all women with births.
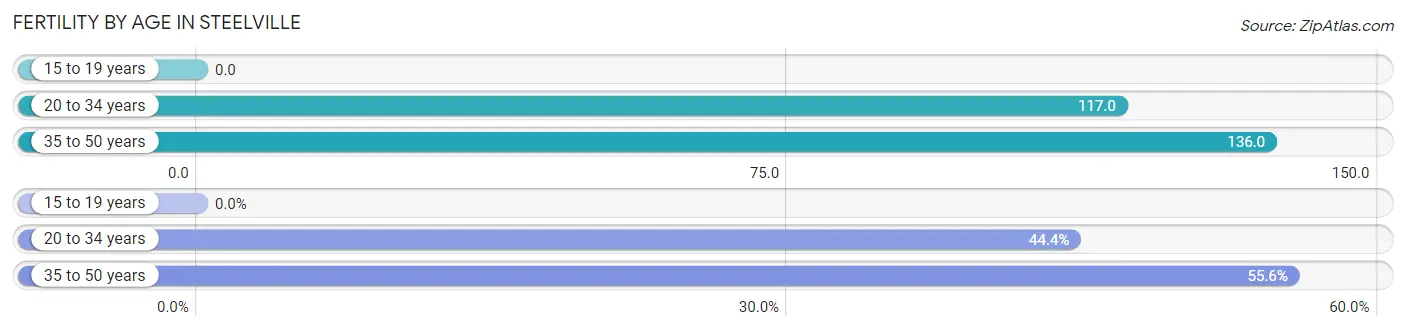
| Age Bracket | Women with Births | Births / 1,000 Women |
| 15 to 19 years | 0 (0.0%) | 0.0 |
| 20 to 34 years | 12 (44.4%) | 117.0 |
| 35 to 50 years | 15 (55.6%) | 136.0 |
| Total | 27 (100.0%) | 107.0 |
Fertility by Age by Marriage Status in Steelville
44.4% of women with births (27) in Steelville are married. The highest percentage of unmarried women with births falls into 35 to 50 years age bracket with 100.0% of them unmarried at the time of birth, while the lowest percentage of unmarried women with births belong to 20 to 34 years age bracket with 0.0% of them unmarried.
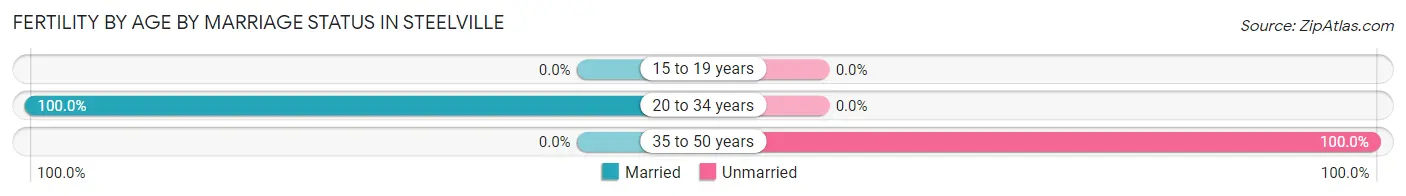
| Age Bracket | Married | Unmarried |
| 15 to 19 years | 0 (0.0%) | 0 (0.0%) |
| 20 to 34 years | 12 (100.0%) | 0 (0.0%) |
| 35 to 50 years | 0 (0.0%) | 15 (100.0%) |
| Total | 12 (44.4%) | 15 (55.6%) |
Fertility by Education in Steelville
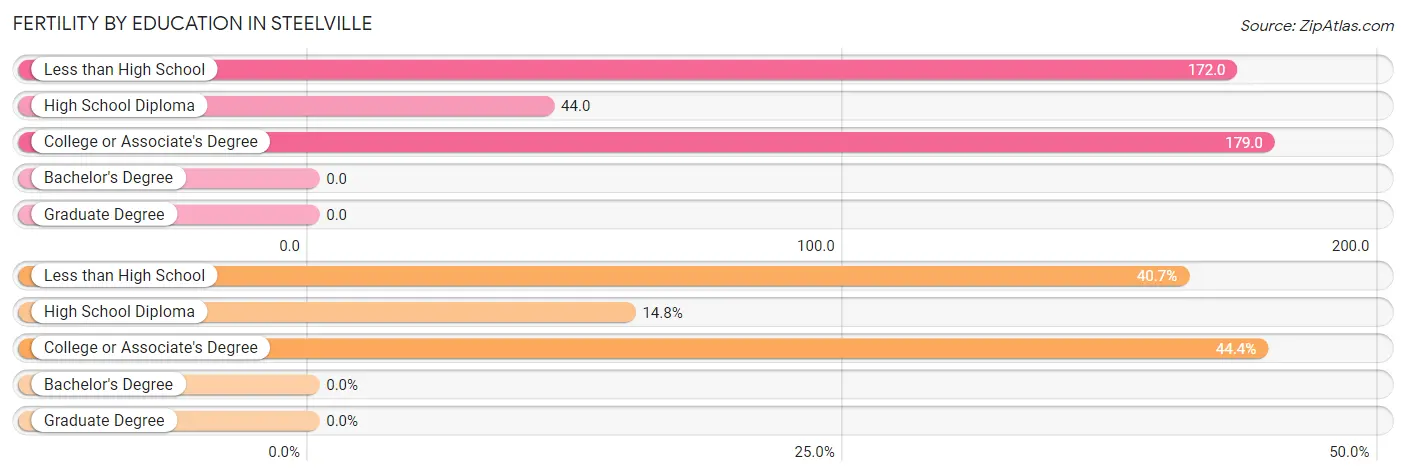
| Educational Attainment | Women with Births | Births / 1,000 Women |
| Less than High School | 11 (40.7%) | 172.0 |
| High School Diploma | 4 (14.8%) | 44.0 |
| College or Associate's Degree | 12 (44.4%) | 179.0 |
| Bachelor's Degree | 0 (0.0%) | 0.0 |
| Graduate Degree | 0 (0.0%) | 0.0 |
| Total | 27 (100.0%) | 107.0 |
Fertility by Education by Marriage Status in Steelville
55.6% of women with births in Steelville are unmarried. Women with the educational attainment of college or associate's degree are most likely to be married with 100.0% of them married at childbirth, while women with the educational attainment of less than high school are least likely to be married with 100.0% of them unmarried at childbirth.
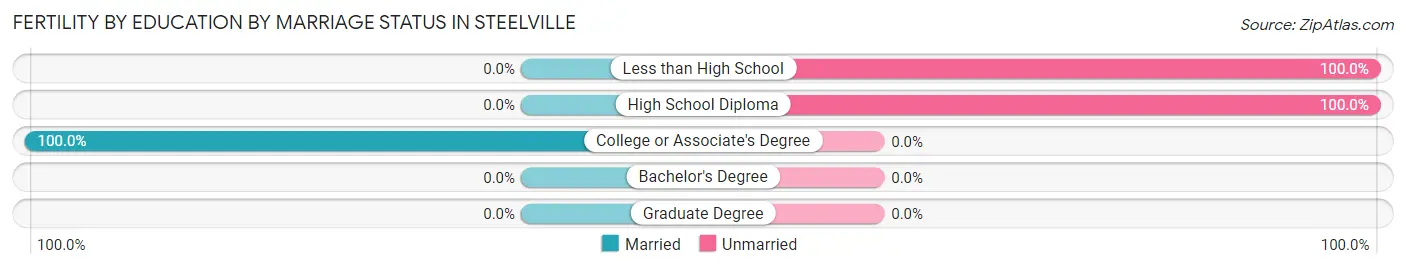
| Educational Attainment | Married | Unmarried |
| Less than High School | 0 (0.0%) | 11 (100.0%) |
| High School Diploma | 0 (0.0%) | 4 (100.0%) |
| College or Associate's Degree | 12 (100.0%) | 0 (0.0%) |
| Bachelor's Degree | 0 (0.0%) | 0 (0.0%) |
| Graduate Degree | 0 (0.0%) | 0 (0.0%) |
| Total | 12 (44.4%) | 15 (55.6%) |
Employment Characteristics in Steelville
Employment by Class of Employer in Steelville
Among the 493 employed individuals in Steelville, private company employees (372 | 75.5%), local government employees (52 | 10.5%), and self-employed (not incorporated) (42 | 8.5%) make up the most common classes of employment.
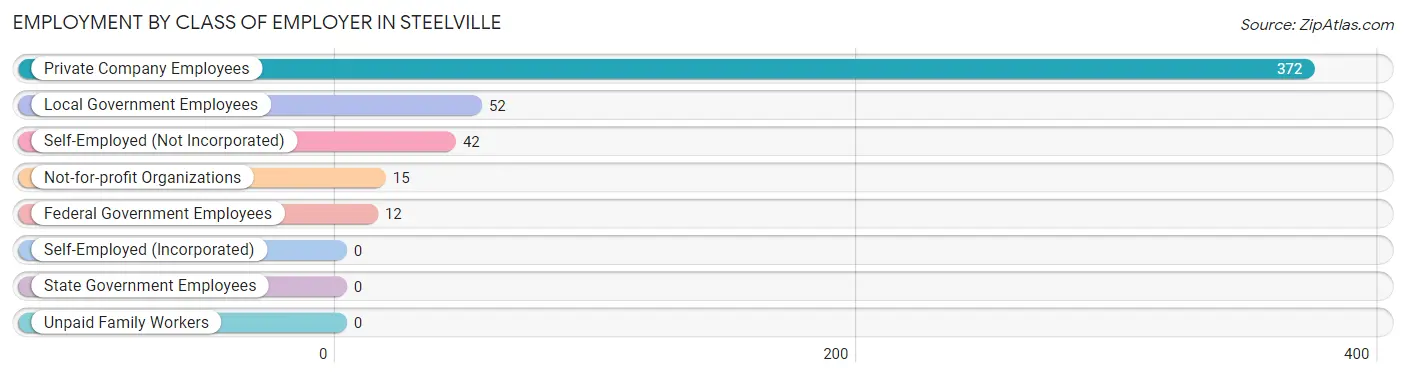
| Employer Class | # Employees | % Employees |
| Private Company Employees | 372 | 75.5% |
| Self-Employed (Incorporated) | 0 | 0.0% |
| Self-Employed (Not Incorporated) | 42 | 8.5% |
| Not-for-profit Organizations | 15 | 3.0% |
| Local Government Employees | 52 | 10.5% |
| State Government Employees | 0 | 0.0% |
| Federal Government Employees | 12 | 2.4% |
| Unpaid Family Workers | 0 | 0.0% |
| Total | 493 | 100.0% |
Employment Status by Age in Steelville
According to the labor force statistics for Steelville, out of the total population over 16 years of age (1,245), 44.8% or 558 individuals are in the labor force, with 9.1% or 51 of them unemployed. The age group with the highest labor force participation rate is 20 to 24 years, with 75.2% or 97 individuals in the labor force. Within the labor force, the 25 to 29 years age range has the highest percentage of unemployed individuals, with 25.7% or 18 of them being unemployed.
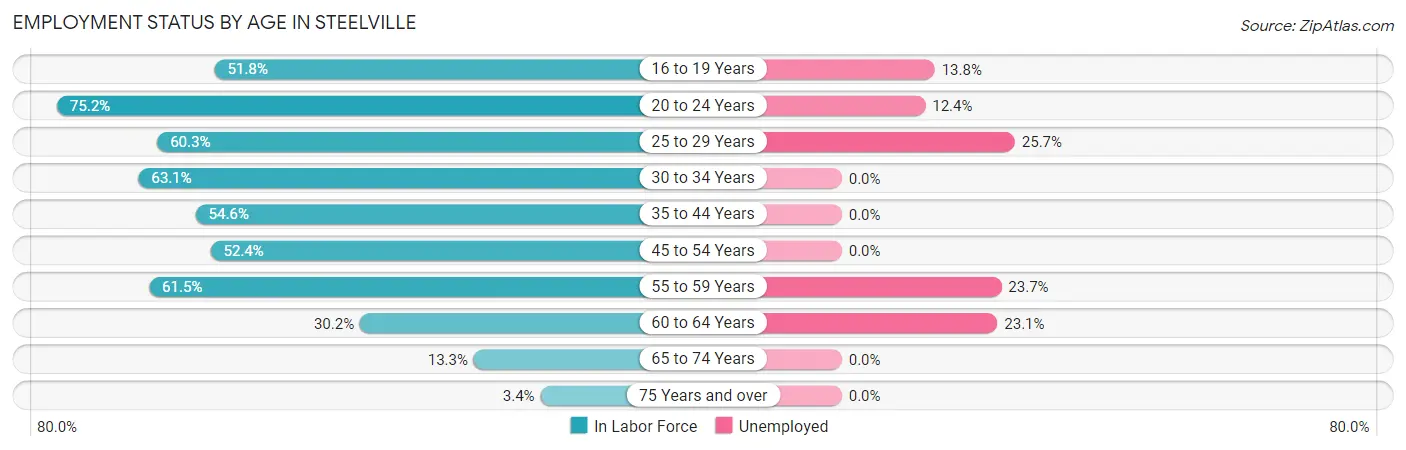
| Age Bracket | In Labor Force | Unemployed |
| 16 to 19 Years | 29 (51.8%) | 4 (13.8%) |
| 20 to 24 Years | 97 (75.2%) | 12 (12.4%) |
| 25 to 29 Years | 70 (60.3%) | 18 (25.7%) |
| 30 to 34 Years | 41 (63.1%) | 0 (0.0%) |
| 35 to 44 Years | 106 (54.6%) | 0 (0.0%) |
| 45 to 54 Years | 110 (52.4%) | 0 (0.0%) |
| 55 to 59 Years | 59 (61.5%) | 14 (23.7%) |
| 60 to 64 Years | 13 (30.2%) | 3 (23.1%) |
| 65 to 74 Years | 29 (13.3%) | 0 (0.0%) |
| 75 Years and over | 4 (3.4%) | 0 (0.0%) |
| Total | 558 (44.8%) | 51 (9.1%) |
Employment Status by Educational Attainment in Steelville
According to labor force statistics for Steelville, 55.1% of individuals (399) out of the total population between 25 and 64 years of age (724) are in the labor force, with 8.8% or 35 of them being unemployed. The group with the highest labor force participation rate are those with the educational attainment of bachelor's degree or higher, with 79.5% or 62 individuals in the labor force. Within the labor force, individuals with college / associate degree education have the highest percentage of unemployment, with 14.9% or 14 of them being unemployed.
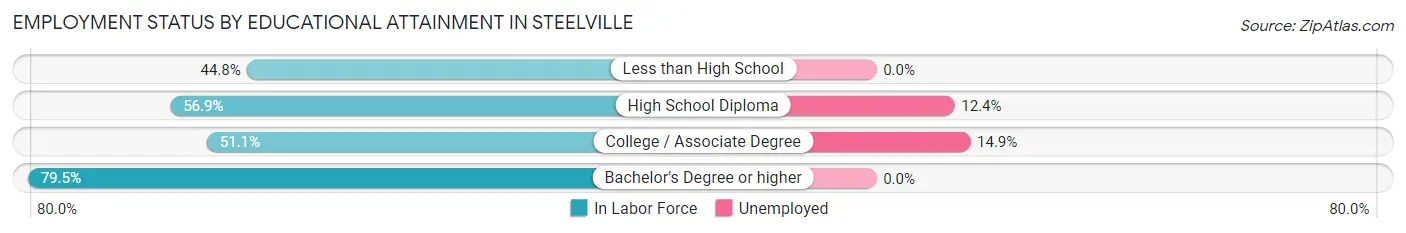
| Educational Attainment | In Labor Force | Unemployed |
| Less than High School | 74 (44.8%) | 0 (0.0%) |
| High School Diploma | 169 (56.9%) | 37 (12.4%) |
| College / Associate Degree | 94 (51.1%) | 27 (14.9%) |
| Bachelor's Degree or higher | 62 (79.5%) | 0 (0.0%) |
| Total | 399 (55.1%) | 64 (8.8%) |
Employment Occupations by Sex in Steelville
Management, Business, Science and Arts Occupations
The most common Management, Business, Science and Arts occupations in Steelville are Community & Social Service (43 | 8.5%), Education Instruction & Library (34 | 6.7%), Management (29 | 5.7%), Business & Financial (13 | 2.6%), and Computers, Engineering & Science (13 | 2.6%).
Management, Business, Science and Arts Occupations by Sex
Within the Management, Business, Science and Arts occupations in Steelville, the most male-oriented occupations are Architecture & Engineering (100.0%), Arts, Media & Entertainment (100.0%), and Computers, Engineering & Science (84.6%), while the most female-oriented occupations are Business & Financial (100.0%), Education, Arts & Media (100.0%), and Health Diagnosing & Treating (100.0%).
| Occupation | Male | Female |
| Management | 15 (51.7%) | 14 (48.3%) |
| Business & Financial | 0 (0.0%) | 13 (100.0%) |
| Computers, Engineering & Science | 11 (84.6%) | 2 (15.4%) |
| Computers & Mathematics | 4 (66.7%) | 2 (33.3%) |
| Architecture & Engineering | 7 (100.0%) | 0 (0.0%) |
| Life, Physical & Social Science | 0 (0.0%) | 0 (0.0%) |
| Community & Social Service | 29 (67.4%) | 14 (32.6%) |
| Education, Arts & Media | 0 (0.0%) | 1 (100.0%) |
| Legal Services & Support | 0 (0.0%) | 0 (0.0%) |
| Education Instruction & Library | 21 (61.8%) | 13 (38.2%) |
| Arts, Media & Entertainment | 8 (100.0%) | 0 (0.0%) |
| Health Diagnosing & Treating | 0 (0.0%) | 4 (100.0%) |
| Health Technologists | 0 (0.0%) | 0 (0.0%) |
| Total (Category) | 55 (53.9%) | 47 (46.1%) |
| Total (Overall) | 290 (57.2%) | 217 (42.8%) |
Services Occupations
The most common Services occupations in Steelville are Cleaning & Maintenance (39 | 7.7%), Security & Protection (10 | 2.0%), Food Preparation & Serving (10 | 2.0%), Personal Care & Service (8 | 1.6%), and Healthcare Support (7 | 1.4%).
Services Occupations by Sex
Within the Services occupations in Steelville, the most male-oriented occupations are Security & Protection (100.0%), Firefighting & Prevention (100.0%), and Law Enforcement (100.0%), while the most female-oriented occupations are Healthcare Support (100.0%), Food Preparation & Serving (100.0%), and Cleaning & Maintenance (17.9%).
| Occupation | Male | Female |
| Healthcare Support | 0 (0.0%) | 7 (100.0%) |
| Security & Protection | 10 (100.0%) | 0 (0.0%) |
| Firefighting & Prevention | 5 (100.0%) | 0 (0.0%) |
| Law Enforcement | 5 (100.0%) | 0 (0.0%) |
| Food Preparation & Serving | 0 (0.0%) | 10 (100.0%) |
| Cleaning & Maintenance | 32 (82.1%) | 7 (17.9%) |
| Personal Care & Service | 8 (100.0%) | 0 (0.0%) |
| Total (Category) | 50 (67.6%) | 24 (32.4%) |
| Total (Overall) | 290 (57.2%) | 217 (42.8%) |
Sales and Office Occupations
The most common Sales and Office occupations in Steelville are Sales & Related (85 | 16.8%), and Office & Administration (45 | 8.9%).
Sales and Office Occupations by Sex
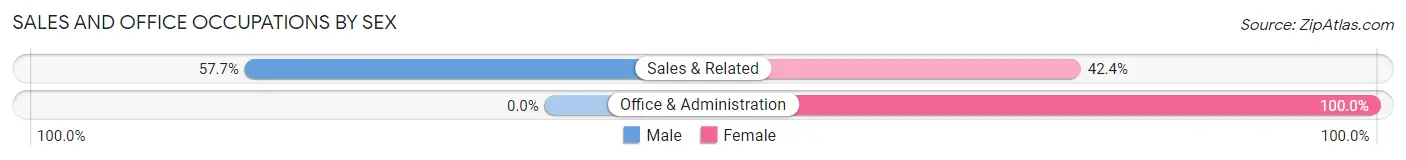
| Occupation | Male | Female |
| Sales & Related | 49 (57.7%) | 36 (42.3%) |
| Office & Administration | 0 (0.0%) | 45 (100.0%) |
| Total (Category) | 49 (37.7%) | 81 (62.3%) |
| Total (Overall) | 290 (57.2%) | 217 (42.8%) |
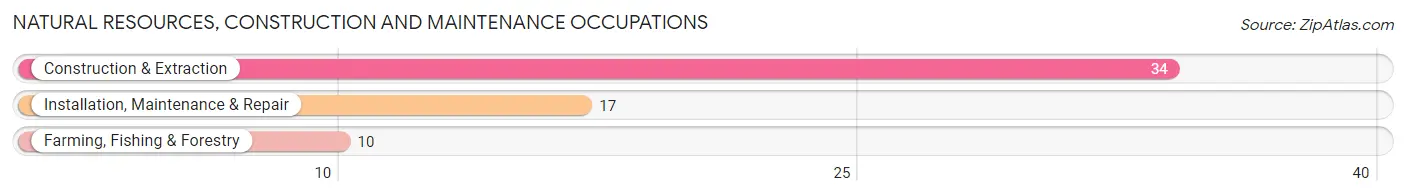
Natural Resources, Construction and Maintenance Occupations
The most common Natural Resources, Construction and Maintenance occupations in Steelville are Construction & Extraction (34 | 6.7%), Installation, Maintenance & Repair (17 | 3.4%), and Farming, Fishing & Forestry (10 | 2.0%).
Natural Resources, Construction and Maintenance Occupations by Sex
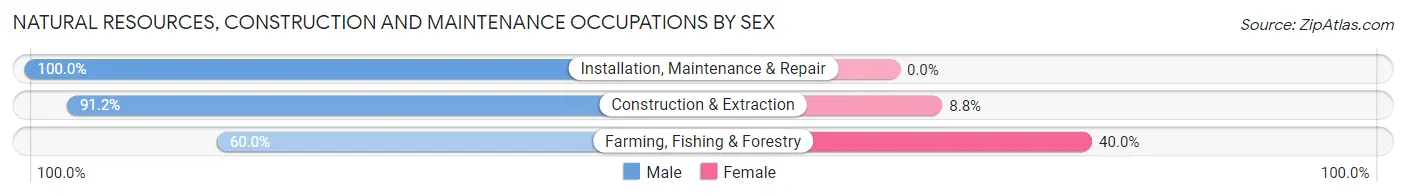
| Occupation | Male | Female |
| Farming, Fishing & Forestry | 6 (60.0%) | 4 (40.0%) |
| Construction & Extraction | 31 (91.2%) | 3 (8.8%) |
| Installation, Maintenance & Repair | 17 (100.0%) | 0 (0.0%) |
| Total (Category) | 54 (88.5%) | 7 (11.5%) |
| Total (Overall) | 290 (57.2%) | 217 (42.8%) |
Production, Transportation and Moving Occupations
The most common Production, Transportation and Moving occupations in Steelville are Production (91 | 17.9%), Transportation (26 | 5.1%), and Material Moving (23 | 4.5%).
Production, Transportation and Moving Occupations by Sex
| Occupation | Male | Female |
| Production | 49 (53.8%) | 42 (46.2%) |
| Transportation | 26 (100.0%) | 0 (0.0%) |
| Material Moving | 7 (30.4%) | 16 (69.6%) |
| Total (Category) | 82 (58.6%) | 58 (41.4%) |
| Total (Overall) | 290 (57.2%) | 217 (42.8%) |
Employment Industries by Sex in Steelville
Employment Industries in Steelville
The major employment industries in Steelville include Manufacturing (129 | 25.4%), Retail Trade (99 | 19.5%), Health Care & Social Assistance (52 | 10.3%), Construction (51 | 10.1%), and Educational Services (45 | 8.9%).
Employment Industries by Sex in Steelville
The Steelville industries that see more men than women are Administrative & Support (100.0%), Public Administration (100.0%), and Construction (94.1%), whereas the industries that tend to have a higher number of women are Information (100.0%), Finance & Insurance (100.0%), and Enterprise Management (100.0%).
| Industry | Male | Female |
| Agriculture, Fishing & Hunting | 6 (60.0%) | 4 (40.0%) |
| Mining, Quarrying, & Extraction | 0 (0.0%) | 0 (0.0%) |
| Construction | 48 (94.1%) | 3 (5.9%) |
| Manufacturing | 79 (61.2%) | 50 (38.8%) |
| Wholesale Trade | 0 (0.0%) | 0 (0.0%) |
| Retail Trade | 54 (54.5%) | 45 (45.5%) |
| Transportation & Warehousing | 36 (81.8%) | 8 (18.2%) |
| Utilities | 0 (0.0%) | 0 (0.0%) |
| Information | 0 (0.0%) | 2 (100.0%) |
| Finance & Insurance | 0 (0.0%) | 6 (100.0%) |
| Real Estate, Rental & Leasing | 0 (0.0%) | 0 (0.0%) |
| Professional & Scientific | 0 (0.0%) | 0 (0.0%) |
| Enterprise Management | 0 (0.0%) | 5 (100.0%) |
| Administrative & Support | 16 (100.0%) | 0 (0.0%) |
| Educational Services | 29 (64.4%) | 16 (35.6%) |
| Health Care & Social Assistance | 0 (0.0%) | 52 (100.0%) |
| Arts, Entertainment & Recreation | 17 (77.3%) | 5 (22.7%) |
| Accommodation & Food Services | 0 (0.0%) | 18 (100.0%) |
| Public Administration | 5 (100.0%) | 0 (0.0%) |
| Total | 290 (57.2%) | 217 (42.8%) |
Education in Steelville
School Enrollment in Steelville
The most common levels of schooling among the 293 students in Steelville are elementary school (119 | 40.6%), high school (61 | 20.8%), and middle school (38 | 13.0%).
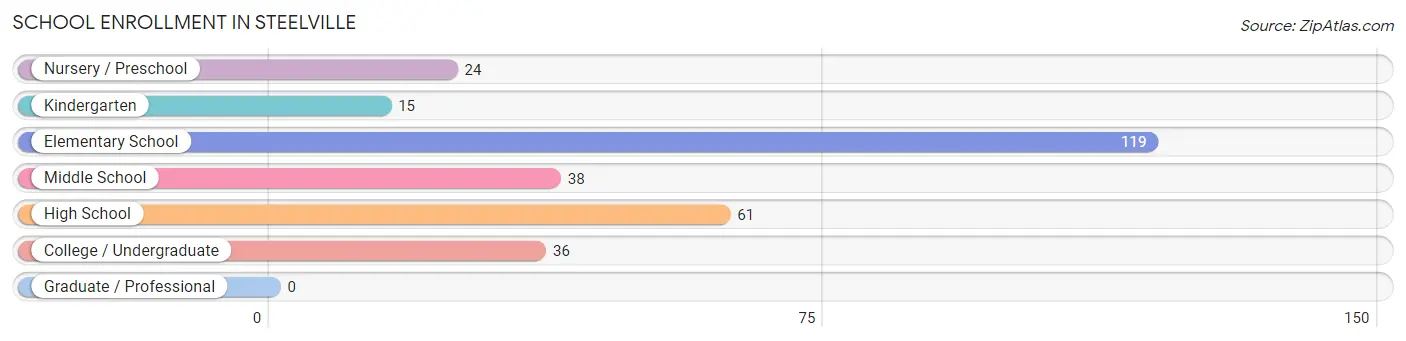
| School Level | # Students | % Students |
| Nursery / Preschool | 24 | 8.2% |
| Kindergarten | 15 | 5.1% |
| Elementary School | 119 | 40.6% |
| Middle School | 38 | 13.0% |
| High School | 61 | 20.8% |
| College / Undergraduate | 36 | 12.3% |
| Graduate / Professional | 0 | 0.0% |
| Total | 293 | 100.0% |
School Enrollment by Age by Funding Source in Steelville
Out of a total of 293 students who are enrolled in schools in Steelville, 36 (12.3%) attend a private institution, while the remaining 257 (87.7%) are enrolled in public schools. The age group of 18 to 19 year olds has the highest likelihood of being enrolled in private schools, with 4 (100.0% in the age bracket) enrolled. Conversely, the age group of 3 to 4 year olds has the lowest likelihood of being enrolled in a private school, with 15 (100.0% in the age bracket) attending a public institution.
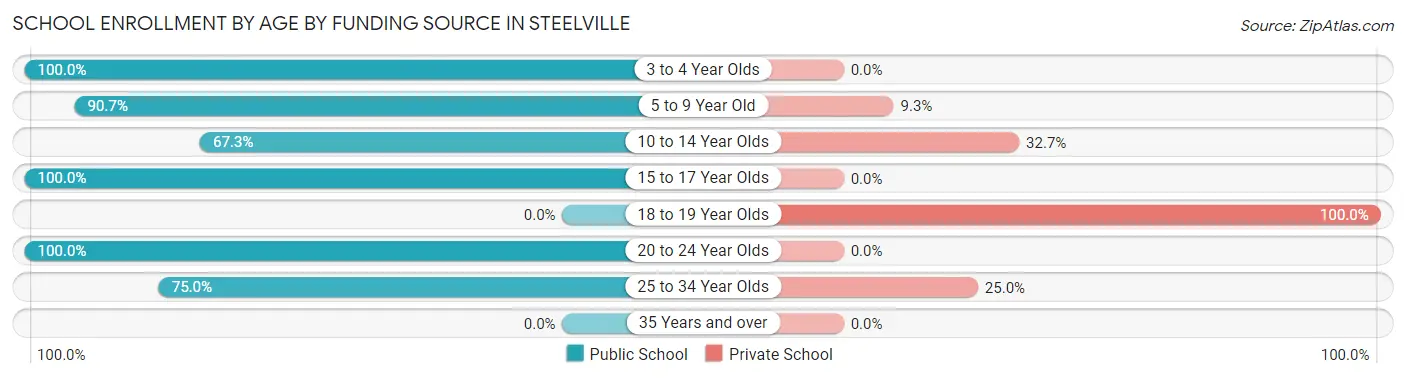
| Age Bracket | Public School | Private School |
| 3 to 4 Year Olds | 15 (100.0%) | 0 (0.0%) |
| 5 to 9 Year Old | 117 (90.7%) | 12 (9.3%) |
| 10 to 14 Year Olds | 35 (67.3%) | 17 (32.7%) |
| 15 to 17 Year Olds | 57 (100.0%) | 0 (0.0%) |
| 18 to 19 Year Olds | 0 (0.0%) | 4 (100.0%) |
| 20 to 24 Year Olds | 24 (100.0%) | 0 (0.0%) |
| 25 to 34 Year Olds | 9 (75.0%) | 3 (25.0%) |
| 35 Years and over | 0 (0.0%) | 0 (0.0%) |
| Total | 257 (87.7%) | 36 (12.3%) |
Educational Attainment by Field of Study in Steelville
Physical & health sciences (33 | 25.6%), education (17 | 13.2%), bio, nature & agricultural (16 | 12.4%), business (16 | 12.4%), and science & technology (15 | 11.6%) are the most common fields of study among 129 individuals in Steelville who have obtained a bachelor's degree or higher.
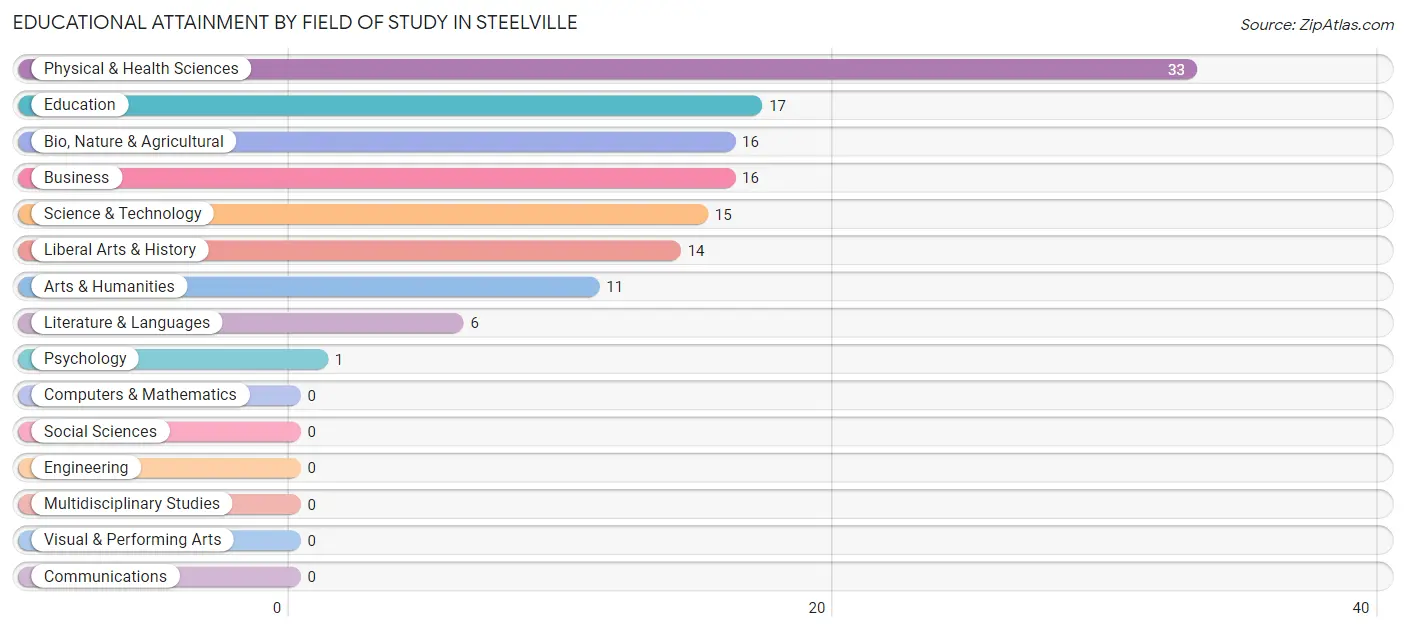
| Field of Study | # Graduates | % Graduates |
| Computers & Mathematics | 0 | 0.0% |
| Bio, Nature & Agricultural | 16 | 12.4% |
| Physical & Health Sciences | 33 | 25.6% |
| Psychology | 1 | 0.8% |
| Social Sciences | 0 | 0.0% |
| Engineering | 0 | 0.0% |
| Multidisciplinary Studies | 0 | 0.0% |
| Science & Technology | 15 | 11.6% |
| Business | 16 | 12.4% |
| Education | 17 | 13.2% |
| Literature & Languages | 6 | 4.6% |
| Liberal Arts & History | 14 | 10.8% |
| Visual & Performing Arts | 0 | 0.0% |
| Communications | 0 | 0.0% |
| Arts & Humanities | 11 | 8.5% |
| Total | 129 | 100.0% |
Transportation & Commute in Steelville
Vehicle Availability by Sex in Steelville
The most prevalent vehicle ownership categories in Steelville are males with 3 vehicles (124, accounting for 44.0%) and females with 3 vehicles (38, making up 58.8%).
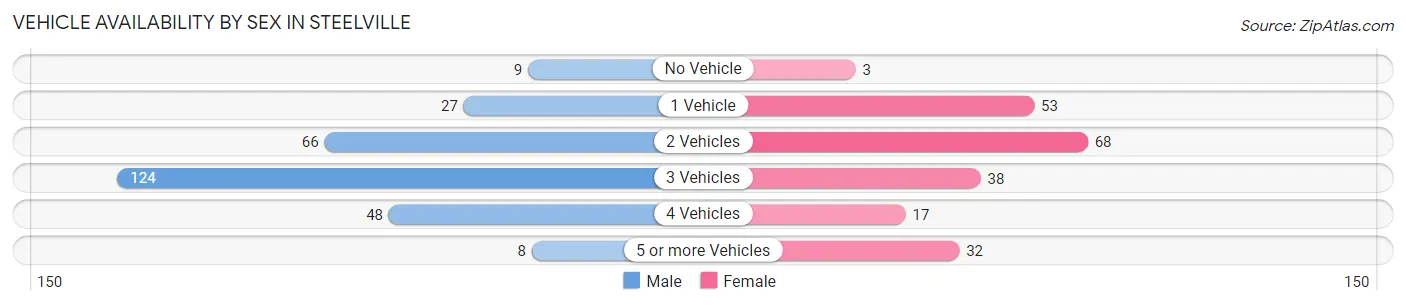
| Vehicles Available | Male | Female |
| No Vehicle | 9 (3.2%) | 3 (1.4%) |
| 1 Vehicle | 27 (9.6%) | 53 (25.1%) |
| 2 Vehicles | 66 (23.4%) | 68 (32.2%) |
| 3 Vehicles | 124 (44.0%) | 38 (18.0%) |
| 4 Vehicles | 48 (17.0%) | 17 (8.1%) |
| 5 or more Vehicles | 8 (2.8%) | 32 (15.2%) |
| Total | 282 (100.0%) | 211 (100.0%) |
Commute Time in Steelville
The most frequently occuring commute durations in Steelville are 5 to 9 minutes (96 commuters, 20.0%), less than 5 minutes (78 commuters, 16.3%), and 10 to 14 minutes (66 commuters, 13.8%).
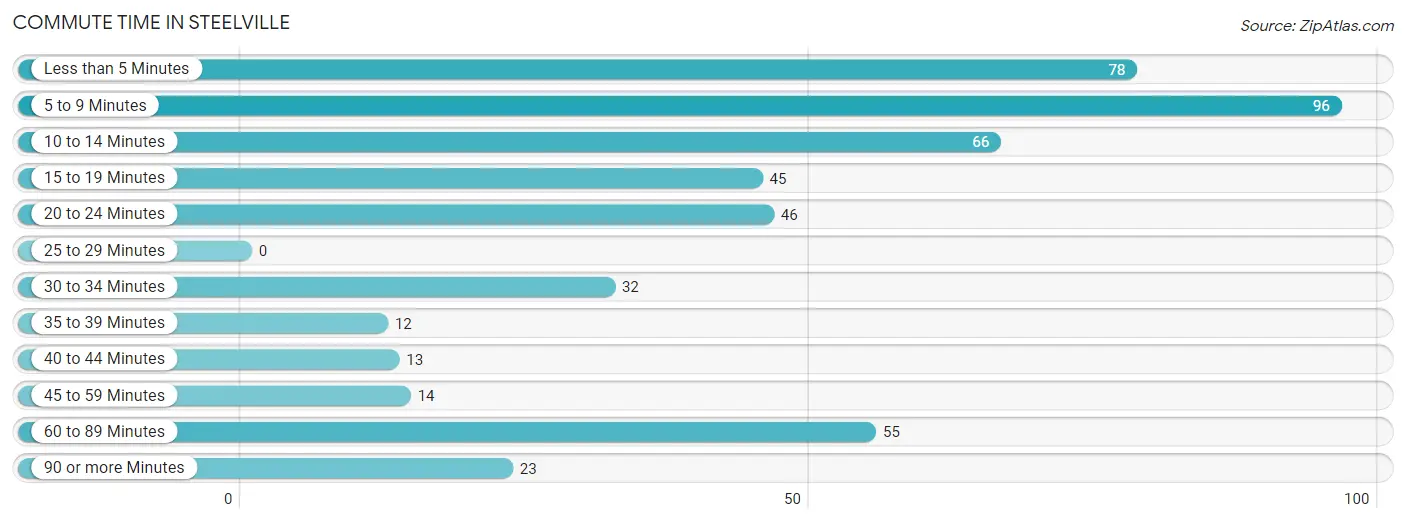
| Commute Time | # Commuters | % Commuters |
| Less than 5 Minutes | 78 | 16.3% |
| 5 to 9 Minutes | 96 | 20.0% |
| 10 to 14 Minutes | 66 | 13.8% |
| 15 to 19 Minutes | 45 | 9.4% |
| 20 to 24 Minutes | 46 | 9.6% |
| 25 to 29 Minutes | 0 | 0.0% |
| 30 to 34 Minutes | 32 | 6.7% |
| 35 to 39 Minutes | 12 | 2.5% |
| 40 to 44 Minutes | 13 | 2.7% |
| 45 to 59 Minutes | 14 | 2.9% |
| 60 to 89 Minutes | 55 | 11.5% |
| 90 or more Minutes | 23 | 4.8% |
Commute Time by Sex in Steelville
The most common commute times in Steelville are 5 to 9 minutes (58 commuters, 21.3%) for males and 10 to 14 minutes (60 commuters, 28.8%) for females.
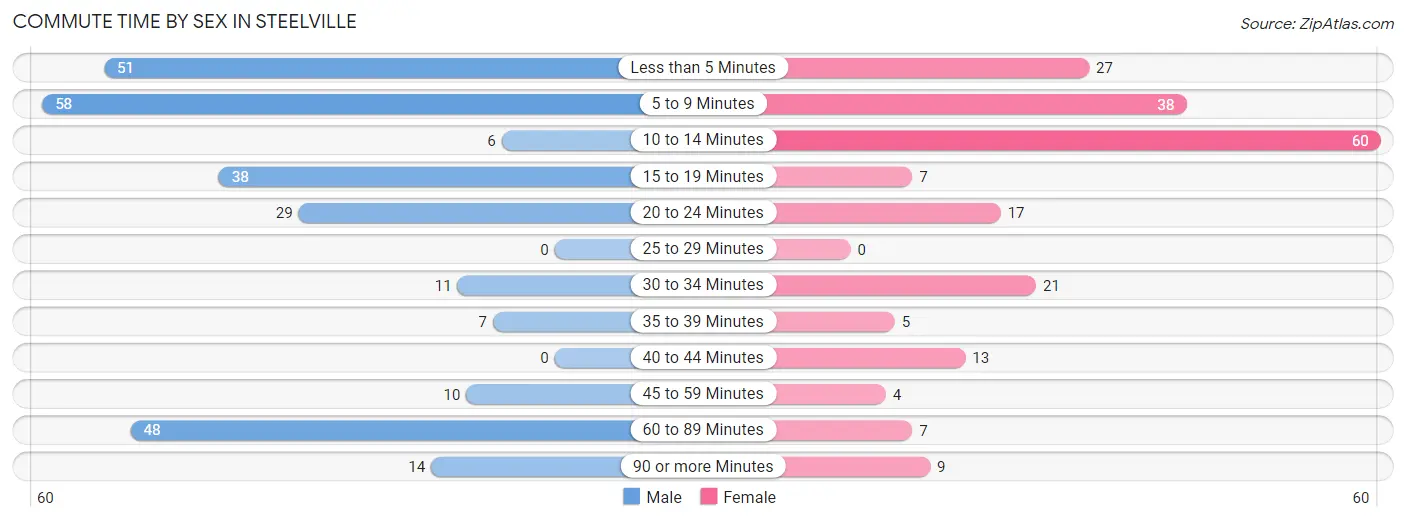
| Commute Time | Male | Female |
| Less than 5 Minutes | 51 (18.8%) | 27 (13.0%) |
| 5 to 9 Minutes | 58 (21.3%) | 38 (18.3%) |
| 10 to 14 Minutes | 6 (2.2%) | 60 (28.8%) |
| 15 to 19 Minutes | 38 (14.0%) | 7 (3.4%) |
| 20 to 24 Minutes | 29 (10.7%) | 17 (8.2%) |
| 25 to 29 Minutes | 0 (0.0%) | 0 (0.0%) |
| 30 to 34 Minutes | 11 (4.0%) | 21 (10.1%) |
| 35 to 39 Minutes | 7 (2.6%) | 5 (2.4%) |
| 40 to 44 Minutes | 0 (0.0%) | 13 (6.2%) |
| 45 to 59 Minutes | 10 (3.7%) | 4 (1.9%) |
| 60 to 89 Minutes | 48 (17.6%) | 7 (3.4%) |
| 90 or more Minutes | 14 (5.1%) | 9 (4.3%) |
Time of Departure to Work by Sex in Steelville
The most frequent times of departure to work in Steelville are 7:00 AM to 7:29 AM (58, 21.3%) for males and 7:00 AM to 7:29 AM (53, 25.5%) for females.
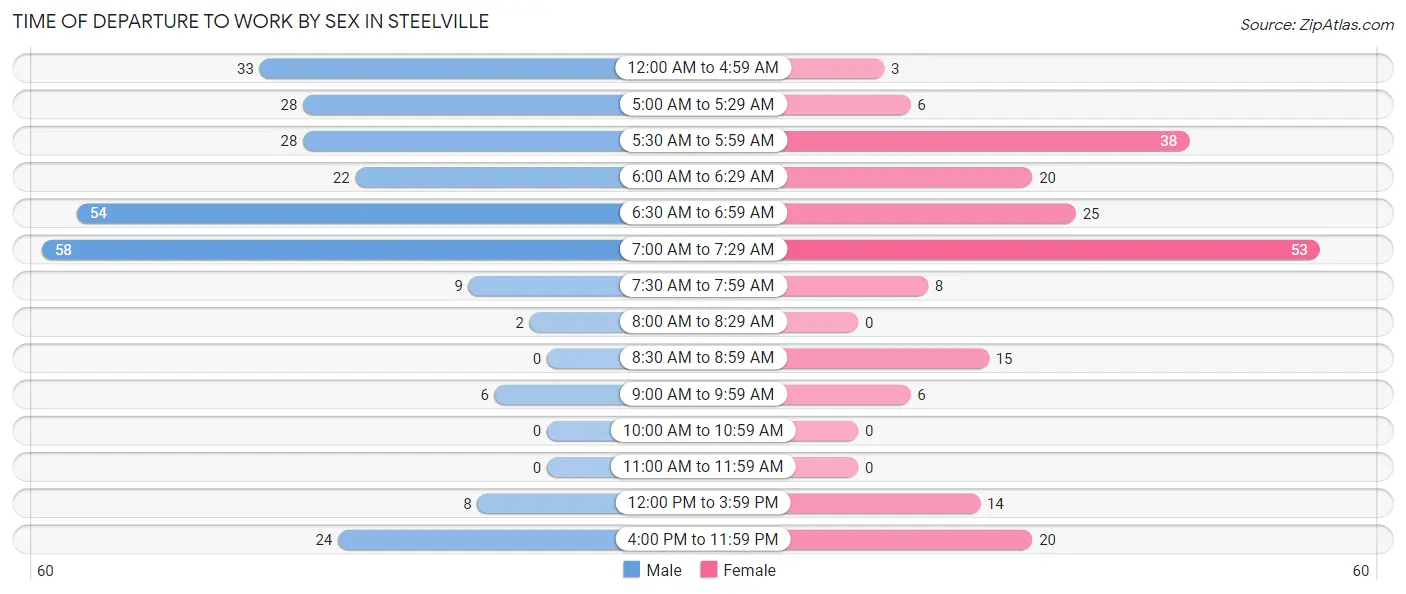
| Time of Departure | Male | Female |
| 12:00 AM to 4:59 AM | 33 (12.1%) | 3 (1.4%) |
| 5:00 AM to 5:29 AM | 28 (10.3%) | 6 (2.9%) |
| 5:30 AM to 5:59 AM | 28 (10.3%) | 38 (18.3%) |
| 6:00 AM to 6:29 AM | 22 (8.1%) | 20 (9.6%) |
| 6:30 AM to 6:59 AM | 54 (19.9%) | 25 (12.0%) |
| 7:00 AM to 7:29 AM | 58 (21.3%) | 53 (25.5%) |
| 7:30 AM to 7:59 AM | 9 (3.3%) | 8 (3.8%) |
| 8:00 AM to 8:29 AM | 2 (0.7%) | 0 (0.0%) |
| 8:30 AM to 8:59 AM | 0 (0.0%) | 15 (7.2%) |
| 9:00 AM to 9:59 AM | 6 (2.2%) | 6 (2.9%) |
| 10:00 AM to 10:59 AM | 0 (0.0%) | 0 (0.0%) |
| 11:00 AM to 11:59 AM | 0 (0.0%) | 0 (0.0%) |
| 12:00 PM to 3:59 PM | 8 (2.9%) | 14 (6.7%) |
| 4:00 PM to 11:59 PM | 24 (8.8%) | 20 (9.6%) |
| Total | 272 (100.0%) | 208 (100.0%) |
Housing Occupancy in Steelville
Occupancy by Ownership in Steelville
Of the total 592 dwellings in Steelville, owner-occupied units account for 253 (42.7%), while renter-occupied units make up 339 (57.3%).
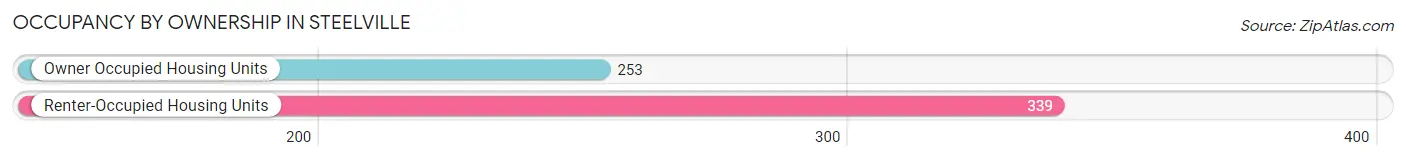
| Occupancy | # Housing Units | % Housing Units |
| Owner Occupied Housing Units | 253 | 42.7% |
| Renter-Occupied Housing Units | 339 | 57.3% |
| Total Occupied Housing Units | 592 | 100.0% |
Occupancy by Household Size in Steelville
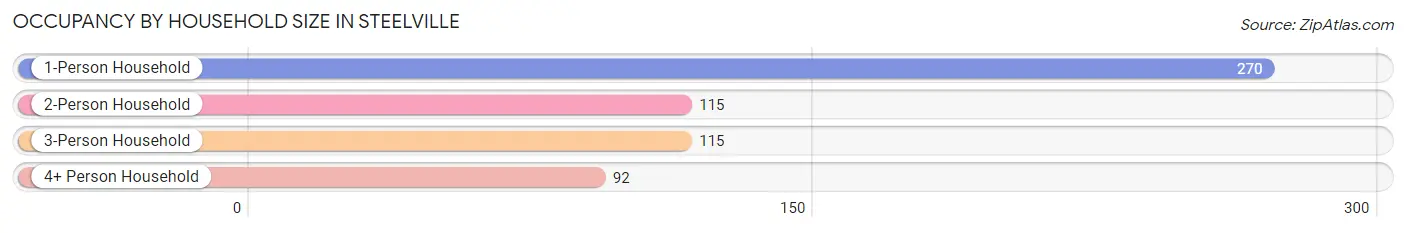
| Household Size | # Housing Units | % Housing Units |
| 1-Person Household | 270 | 45.6% |
| 2-Person Household | 115 | 19.4% |
| 3-Person Household | 115 | 19.4% |
| 4+ Person Household | 92 | 15.5% |
| Total Housing Units | 592 | 100.0% |
Occupancy by Ownership by Household Size in Steelville
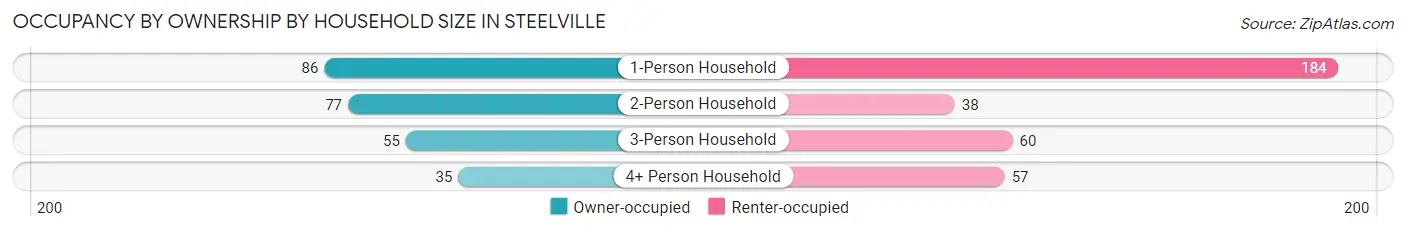
| Household Size | Owner-occupied | Renter-occupied |
| 1-Person Household | 86 (31.9%) | 184 (68.1%) |
| 2-Person Household | 77 (67.0%) | 38 (33.0%) |
| 3-Person Household | 55 (47.8%) | 60 (52.2%) |
| 4+ Person Household | 35 (38.0%) | 57 (62.0%) |
| Total Housing Units | 253 (42.7%) | 339 (57.3%) |
Occupancy by Educational Attainment in Steelville
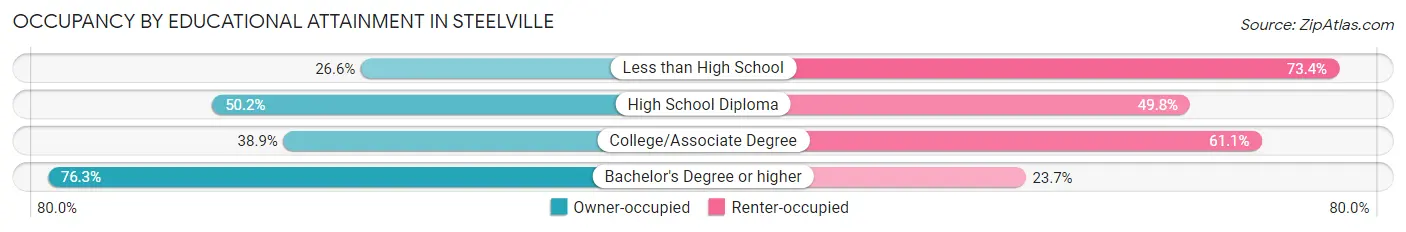
| Household Size | Owner-occupied | Renter-occupied |
| Less than High School | 33 (26.6%) | 91 (73.4%) |
| High School Diploma | 105 (50.2%) | 104 (49.8%) |
| College/Associate Degree | 86 (38.9%) | 135 (61.1%) |
| Bachelor's Degree or higher | 29 (76.3%) | 9 (23.7%) |
Occupancy by Age of Householder in Steelville
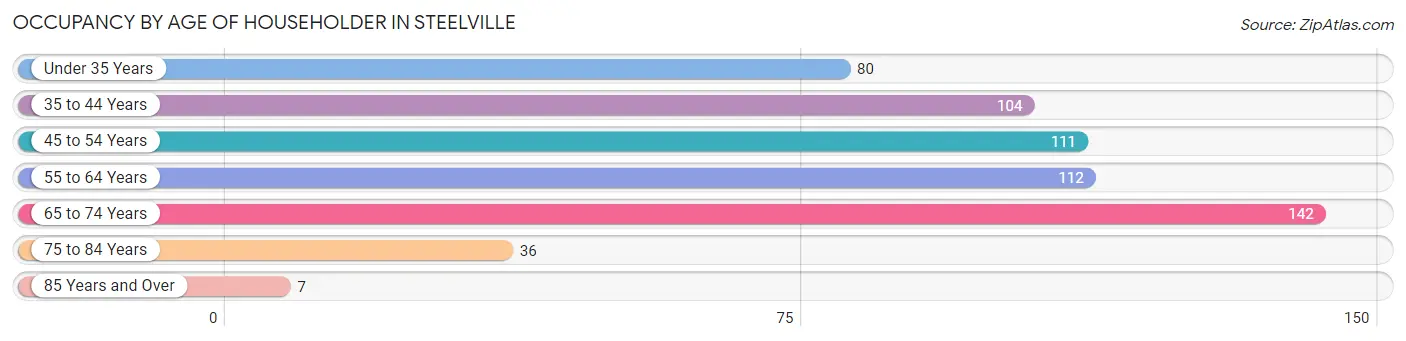
| Age Bracket | # Households | % Households |
| Under 35 Years | 80 | 13.5% |
| 35 to 44 Years | 104 | 17.6% |
| 45 to 54 Years | 111 | 18.8% |
| 55 to 64 Years | 112 | 18.9% |
| 65 to 74 Years | 142 | 24.0% |
| 75 to 84 Years | 36 | 6.1% |
| 85 Years and Over | 7 | 1.2% |
| Total | 592 | 100.0% |
Housing Finances in Steelville
Median Income by Occupancy in Steelville
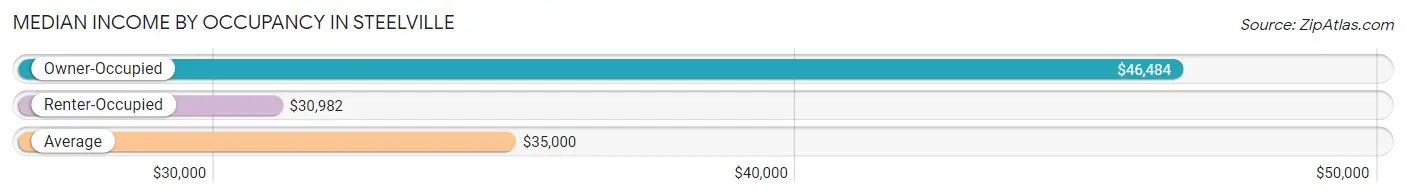
| Occupancy Type | # Households | Median Income |
| Owner-Occupied | 253 (42.7%) | $46,484 |
| Renter-Occupied | 339 (57.3%) | $30,982 |
| Average | 592 (100.0%) | $35,000 |
Occupancy by Householder Income Bracket in Steelville
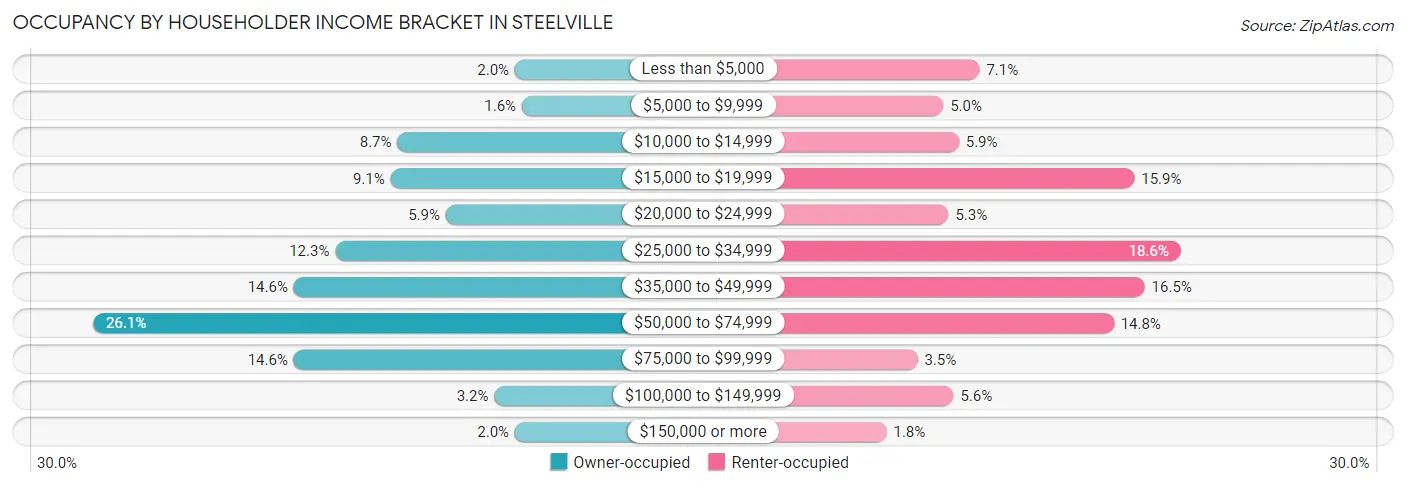
| Income Bracket | Owner-occupied | Renter-occupied |
| Less than $5,000 | 5 (2.0%) | 24 (7.1%) |
| $5,000 to $9,999 | 4 (1.6%) | 17 (5.0%) |
| $10,000 to $14,999 | 22 (8.7%) | 20 (5.9%) |
| $15,000 to $19,999 | 23 (9.1%) | 54 (15.9%) |
| $20,000 to $24,999 | 15 (5.9%) | 18 (5.3%) |
| $25,000 to $34,999 | 31 (12.2%) | 63 (18.6%) |
| $35,000 to $49,999 | 37 (14.6%) | 56 (16.5%) |
| $50,000 to $74,999 | 66 (26.1%) | 50 (14.7%) |
| $75,000 to $99,999 | 37 (14.6%) | 12 (3.5%) |
| $100,000 to $149,999 | 8 (3.2%) | 19 (5.6%) |
| $150,000 or more | 5 (2.0%) | 6 (1.8%) |
| Total | 253 (100.0%) | 339 (100.0%) |
Monthly Housing Cost Tiers in Steelville
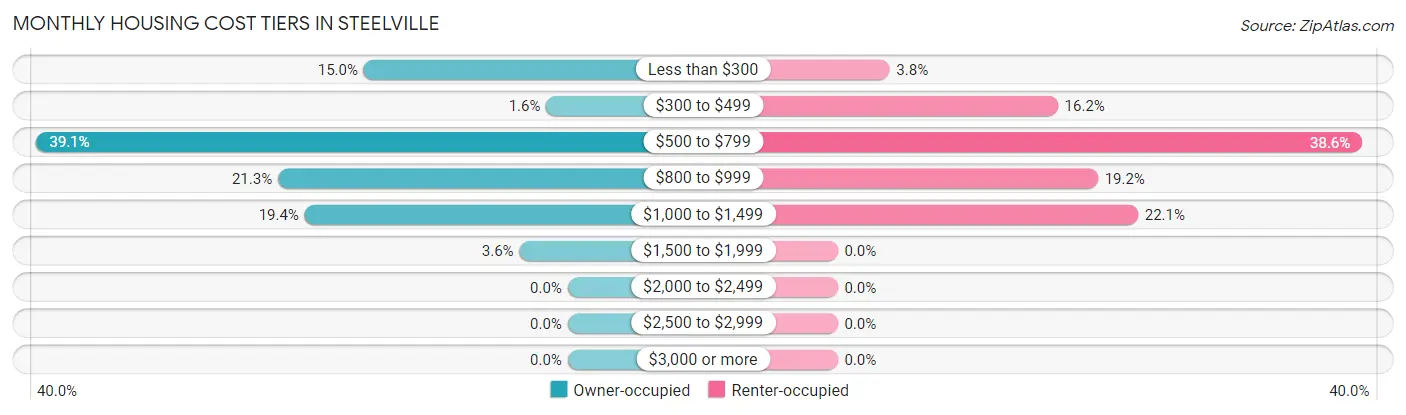
| Monthly Cost | Owner-occupied | Renter-occupied |
| Less than $300 | 38 (15.0%) | 13 (3.8%) |
| $300 to $499 | 4 (1.6%) | 55 (16.2%) |
| $500 to $799 | 99 (39.1%) | 131 (38.6%) |
| $800 to $999 | 54 (21.3%) | 65 (19.2%) |
| $1,000 to $1,499 | 49 (19.4%) | 75 (22.1%) |
| $1,500 to $1,999 | 9 (3.6%) | 0 (0.0%) |
| $2,000 to $2,499 | 0 (0.0%) | 0 (0.0%) |
| $2,500 to $2,999 | 0 (0.0%) | 0 (0.0%) |
| $3,000 or more | 0 (0.0%) | 0 (0.0%) |
| Total | 253 (100.0%) | 339 (100.0%) |
Physical Housing Characteristics in Steelville
Housing Structures in Steelville
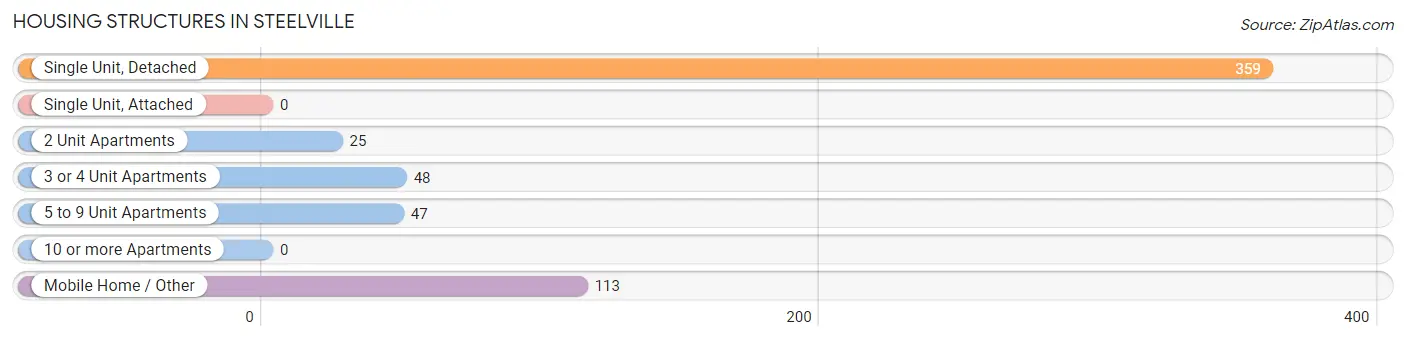
| Structure Type | # Housing Units | % Housing Units |
| Single Unit, Detached | 359 | 60.6% |
| Single Unit, Attached | 0 | 0.0% |
| 2 Unit Apartments | 25 | 4.2% |
| 3 or 4 Unit Apartments | 48 | 8.1% |
| 5 to 9 Unit Apartments | 47 | 7.9% |
| 10 or more Apartments | 0 | 0.0% |
| Mobile Home / Other | 113 | 19.1% |
| Total | 592 | 100.0% |
Housing Structures by Occupancy in Steelville
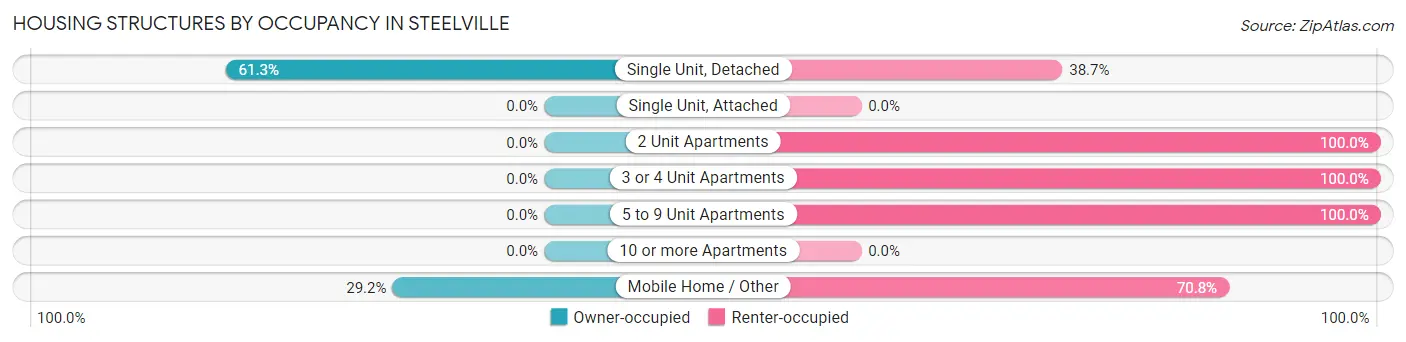
| Structure Type | Owner-occupied | Renter-occupied |
| Single Unit, Detached | 220 (61.3%) | 139 (38.7%) |
| Single Unit, Attached | 0 (0.0%) | 0 (0.0%) |
| 2 Unit Apartments | 0 (0.0%) | 25 (100.0%) |
| 3 or 4 Unit Apartments | 0 (0.0%) | 48 (100.0%) |
| 5 to 9 Unit Apartments | 0 (0.0%) | 47 (100.0%) |
| 10 or more Apartments | 0 (0.0%) | 0 (0.0%) |
| Mobile Home / Other | 33 (29.2%) | 80 (70.8%) |
| Total | 253 (42.7%) | 339 (57.3%) |
Housing Structures by Number of Rooms in Steelville
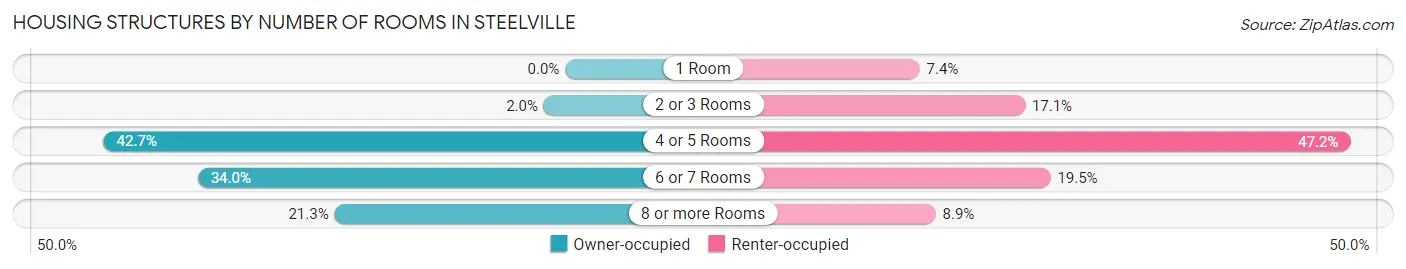
| Number of Rooms | Owner-occupied | Renter-occupied |
| 1 Room | 0 (0.0%) | 25 (7.4%) |
| 2 or 3 Rooms | 5 (2.0%) | 58 (17.1%) |
| 4 or 5 Rooms | 108 (42.7%) | 160 (47.2%) |
| 6 or 7 Rooms | 86 (34.0%) | 66 (19.5%) |
| 8 or more Rooms | 54 (21.3%) | 30 (8.8%) |
| Total | 253 (100.0%) | 339 (100.0%) |
Housing Structure by Heating Type in Steelville
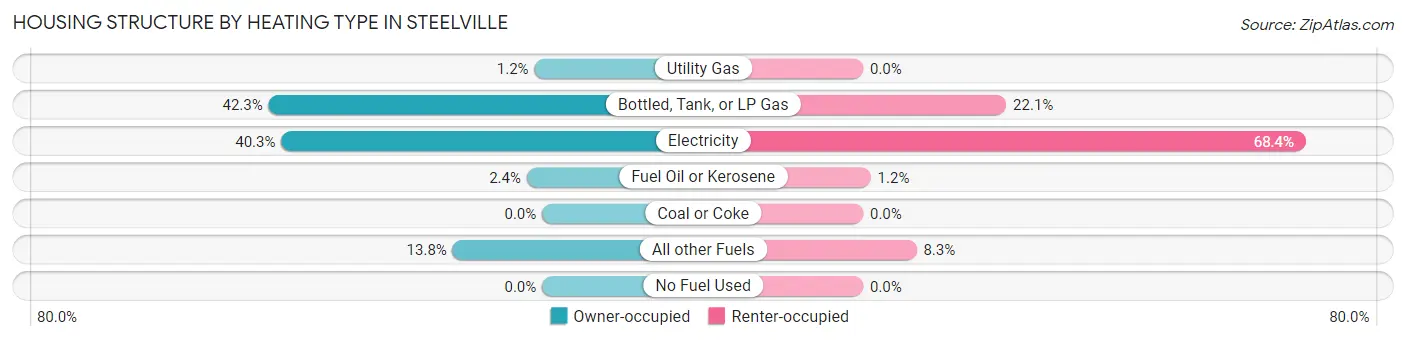
| Heating Type | Owner-occupied | Renter-occupied |
| Utility Gas | 3 (1.2%) | 0 (0.0%) |
| Bottled, Tank, or LP Gas | 107 (42.3%) | 75 (22.1%) |
| Electricity | 102 (40.3%) | 232 (68.4%) |
| Fuel Oil or Kerosene | 6 (2.4%) | 4 (1.2%) |
| Coal or Coke | 0 (0.0%) | 0 (0.0%) |
| All other Fuels | 35 (13.8%) | 28 (8.3%) |
| No Fuel Used | 0 (0.0%) | 0 (0.0%) |
| Total | 253 (100.0%) | 339 (100.0%) |
Household Vehicle Usage in Steelville
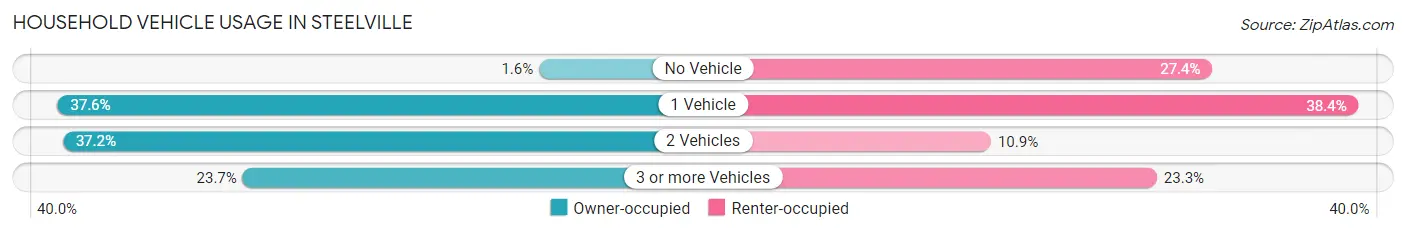
| Vehicles per Household | Owner-occupied | Renter-occupied |
| No Vehicle | 4 (1.6%) | 93 (27.4%) |
| 1 Vehicle | 95 (37.6%) | 130 (38.4%) |
| 2 Vehicles | 94 (37.1%) | 37 (10.9%) |
| 3 or more Vehicles | 60 (23.7%) | 79 (23.3%) |
| Total | 253 (100.0%) | 339 (100.0%) |
Real Estate & Mortgages in Steelville
Real Estate and Mortgage Overview in Steelville
| Characteristic | Without Mortgage | With Mortgage |
| Housing Units | 98 | 155 |
| Median Property Value | $93,500 | $73,500 |
| Median Household Income | $53,333 | $5 |
| Monthly Housing Costs | $529 | $0 |
| Real Estate Taxes | $695 | $0 |
Property Value by Mortgage Status in Steelville
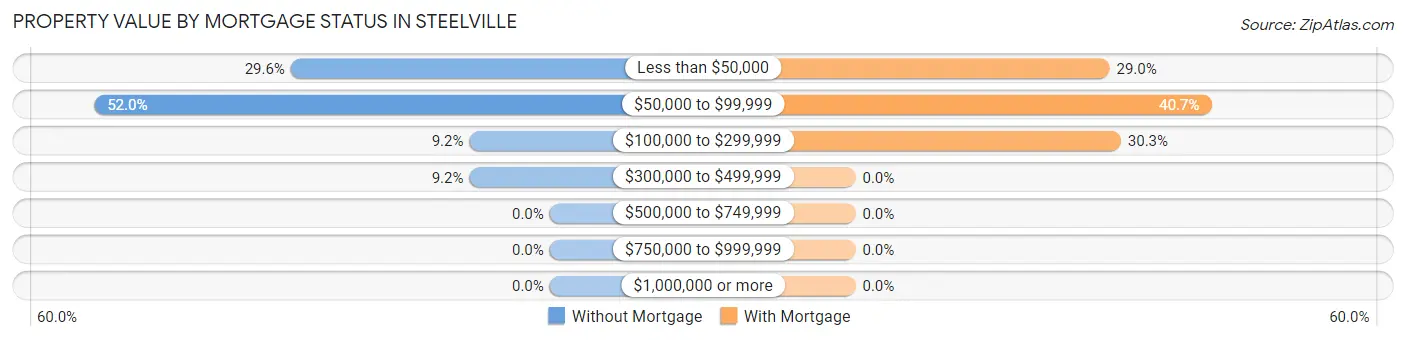
| Property Value | Without Mortgage | With Mortgage |
| Less than $50,000 | 29 (29.6%) | 45 (29.0%) |
| $50,000 to $99,999 | 51 (52.0%) | 63 (40.6%) |
| $100,000 to $299,999 | 9 (9.2%) | 47 (30.3%) |
| $300,000 to $499,999 | 9 (9.2%) | 0 (0.0%) |
| $500,000 to $749,999 | 0 (0.0%) | 0 (0.0%) |
| $750,000 to $999,999 | 0 (0.0%) | 0 (0.0%) |
| $1,000,000 or more | 0 (0.0%) | 0 (0.0%) |
| Total | 98 (100.0%) | 155 (100.0%) |
Household Income by Mortgage Status in Steelville
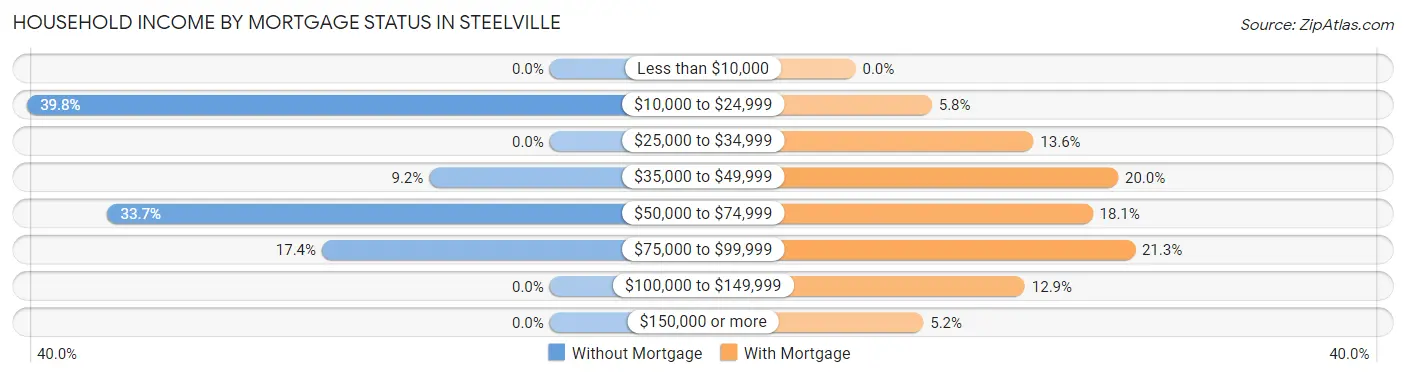
| Household Income | Without Mortgage | With Mortgage |
| Less than $10,000 | 0 (0.0%) | 0 (0.0%) |
| $10,000 to $24,999 | 39 (39.8%) | 9 (5.8%) |
| $25,000 to $34,999 | 0 (0.0%) | 21 (13.6%) |
| $35,000 to $49,999 | 9 (9.2%) | 31 (20.0%) |
| $50,000 to $74,999 | 33 (33.7%) | 28 (18.1%) |
| $75,000 to $99,999 | 17 (17.3%) | 33 (21.3%) |
| $100,000 to $149,999 | 0 (0.0%) | 20 (12.9%) |
| $150,000 or more | 0 (0.0%) | 8 (5.2%) |
| Total | 98 (100.0%) | 155 (100.0%) |
Property Value to Household Income Ratio in Steelville
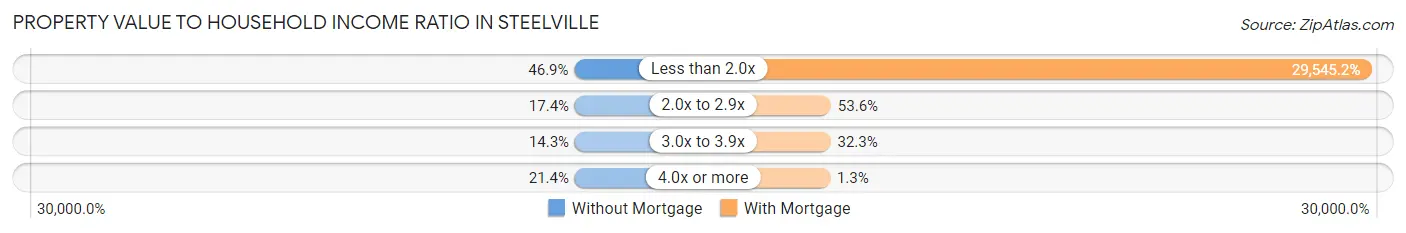
| Value-to-Income Ratio | Without Mortgage | With Mortgage |
| Less than 2.0x | 46 (46.9%) | 45,795 (29,545.2%) |
| 2.0x to 2.9x | 17 (17.3%) | 83 (53.5%) |
| 3.0x to 3.9x | 14 (14.3%) | 50 (32.3%) |
| 4.0x or more | 21 (21.4%) | 2 (1.3%) |
| Total | 98 (100.0%) | 155 (100.0%) |
Real Estate Taxes by Mortgage Status in Steelville
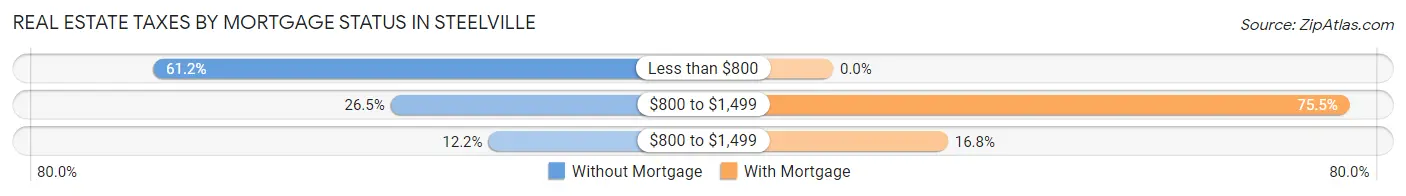
| Property Taxes | Without Mortgage | With Mortgage |
| Less than $800 | 60 (61.2%) | 0 (0.0%) |
| $800 to $1,499 | 26 (26.5%) | 117 (75.5%) |
| $800 to $1,499 | 12 (12.2%) | 26 (16.8%) |
| Total | 98 (100.0%) | 155 (100.0%) |
Health & Disability in Steelville
Health Insurance Coverage by Age in Steelville
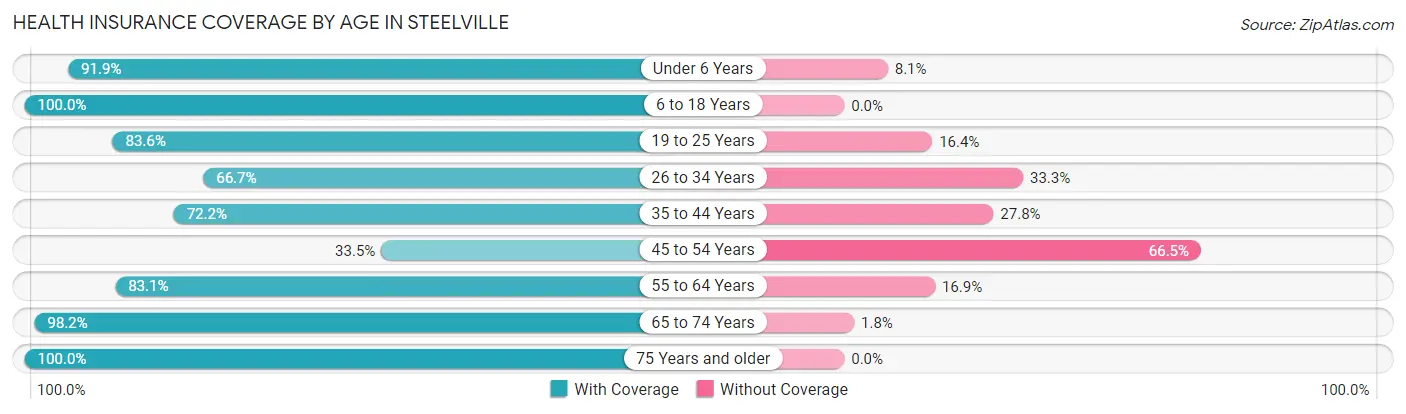
| Age Bracket | With Coverage | Without Coverage |
| Under 6 Years | 68 (91.9%) | 6 (8.1%) |
| 6 to 18 Years | 244 (100.0%) | 0 (0.0%) |
| 19 to 25 Years | 102 (83.6%) | 20 (16.4%) |
| 26 to 34 Years | 94 (66.7%) | 47 (33.3%) |
| 35 to 44 Years | 122 (72.2%) | 47 (27.8%) |
| 45 to 54 Years | 63 (33.5%) | 125 (66.5%) |
| 55 to 64 Years | 113 (83.1%) | 23 (16.9%) |
| 65 to 74 Years | 214 (98.2%) | 4 (1.8%) |
| 75 Years and older | 55 (100.0%) | 0 (0.0%) |
| Total | 1,075 (79.8%) | 272 (20.2%) |
Health Insurance Coverage by Citizenship Status in Steelville
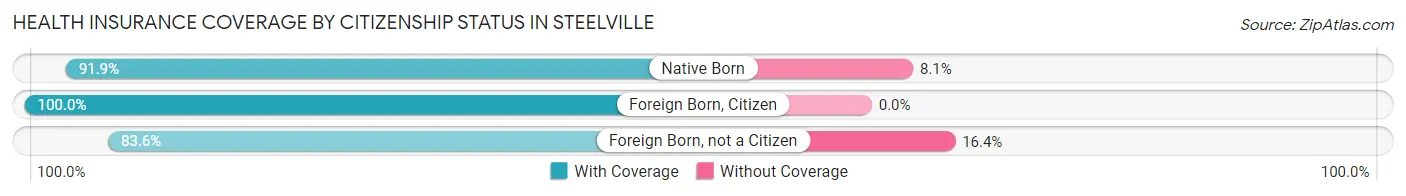
| Citizenship Status | With Coverage | Without Coverage |
| Native Born | 68 (91.9%) | 6 (8.1%) |
| Foreign Born, Citizen | 244 (100.0%) | 0 (0.0%) |
| Foreign Born, not a Citizen | 102 (83.6%) | 20 (16.4%) |
Health Insurance Coverage by Household Income in Steelville
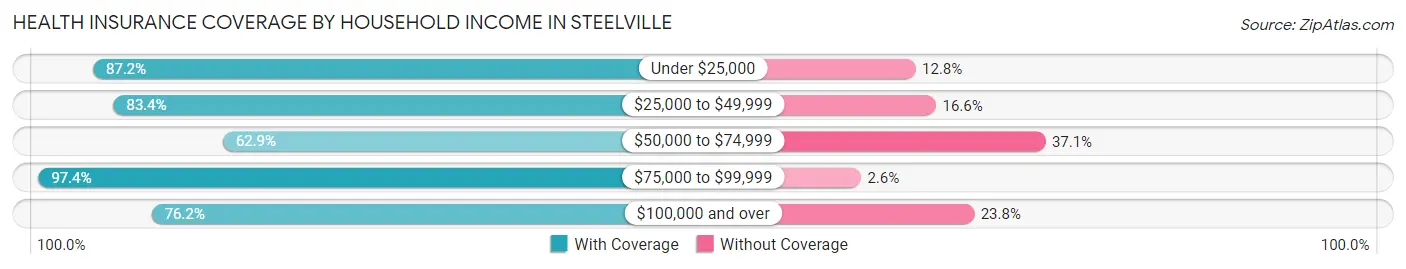
| Household Income | With Coverage | Without Coverage |
| Under $25,000 | 286 (87.2%) | 42 (12.8%) |
| $25,000 to $49,999 | 361 (83.4%) | 72 (16.6%) |
| $50,000 to $74,999 | 205 (62.9%) | 121 (37.1%) |
| $75,000 to $99,999 | 114 (97.4%) | 3 (2.6%) |
| $100,000 and over | 109 (76.2%) | 34 (23.8%) |
Public vs Private Health Insurance Coverage by Age in Steelville
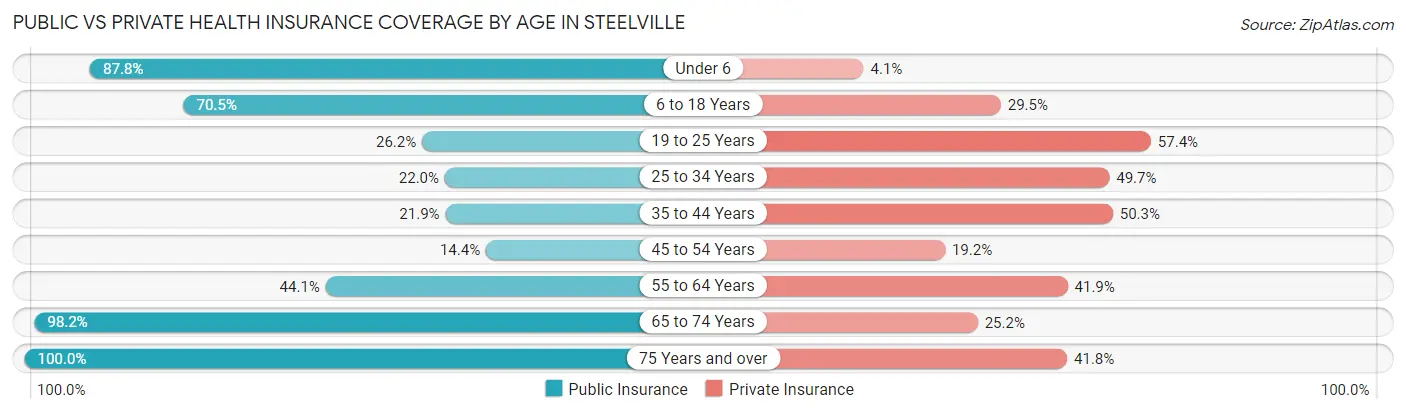
| Age Bracket | Public Insurance | Private Insurance |
| Under 6 | 65 (87.8%) | 3 (4.1%) |
| 6 to 18 Years | 172 (70.5%) | 72 (29.5%) |
| 19 to 25 Years | 32 (26.2%) | 70 (57.4%) |
| 25 to 34 Years | 31 (22.0%) | 70 (49.6%) |
| 35 to 44 Years | 37 (21.9%) | 85 (50.3%) |
| 45 to 54 Years | 27 (14.4%) | 36 (19.2%) |
| 55 to 64 Years | 60 (44.1%) | 57 (41.9%) |
| 65 to 74 Years | 214 (98.2%) | 55 (25.2%) |
| 75 Years and over | 55 (100.0%) | 23 (41.8%) |
| Total | 693 (51.4%) | 471 (35.0%) |
Disability Status by Sex by Age in Steelville
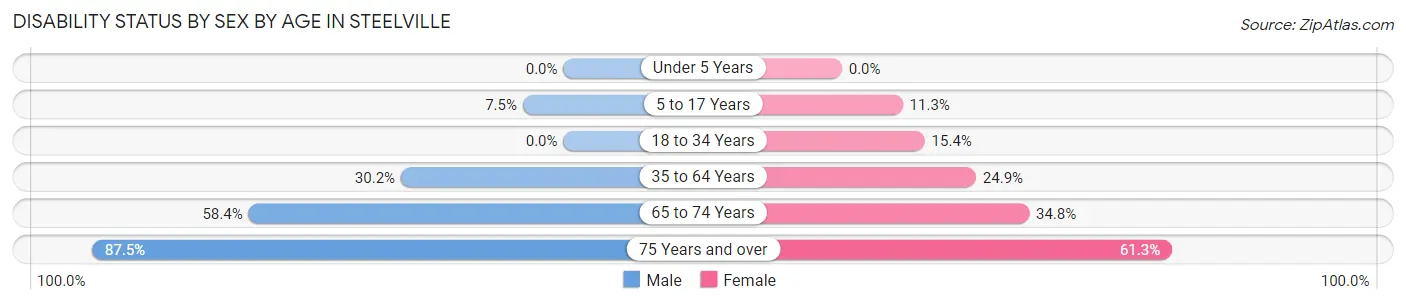
| Age Bracket | Male | Female |
| Under 5 Years | 0 (0.0%) | 0 (0.0%) |
| 5 to 17 Years | 10 (7.5%) | 13 (11.3%) |
| 18 to 34 Years | 0 (0.0%) | 16 (15.4%) |
| 35 to 64 Years | 82 (30.1%) | 55 (24.9%) |
| 65 to 74 Years | 45 (58.4%) | 49 (34.7%) |
| 75 Years and over | 21 (87.5%) | 19 (61.3%) |
Disability Class by Sex by Age in Steelville
Disability Class: Hearing Difficulty
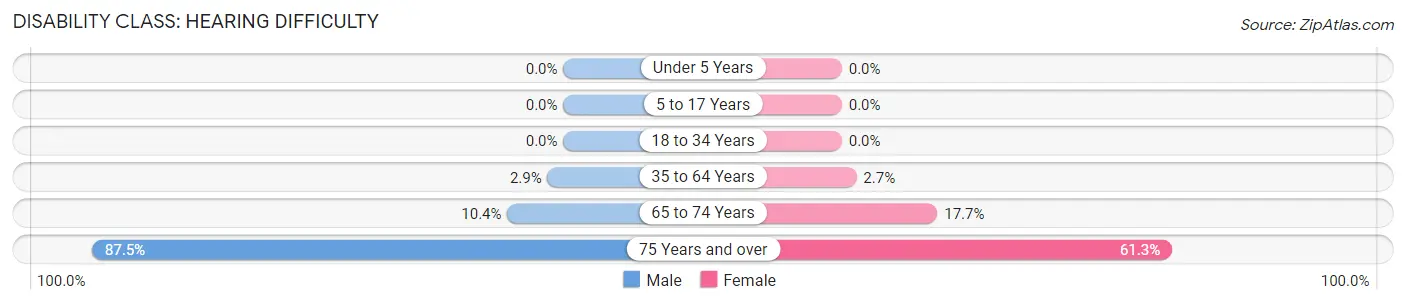
| Age Bracket | Male | Female |
| Under 5 Years | 0 (0.0%) | 0 (0.0%) |
| 5 to 17 Years | 0 (0.0%) | 0 (0.0%) |
| 18 to 34 Years | 0 (0.0%) | 0 (0.0%) |
| 35 to 64 Years | 8 (2.9%) | 6 (2.7%) |
| 65 to 74 Years | 8 (10.4%) | 25 (17.7%) |
| 75 Years and over | 21 (87.5%) | 19 (61.3%) |
Disability Class: Vision Difficulty
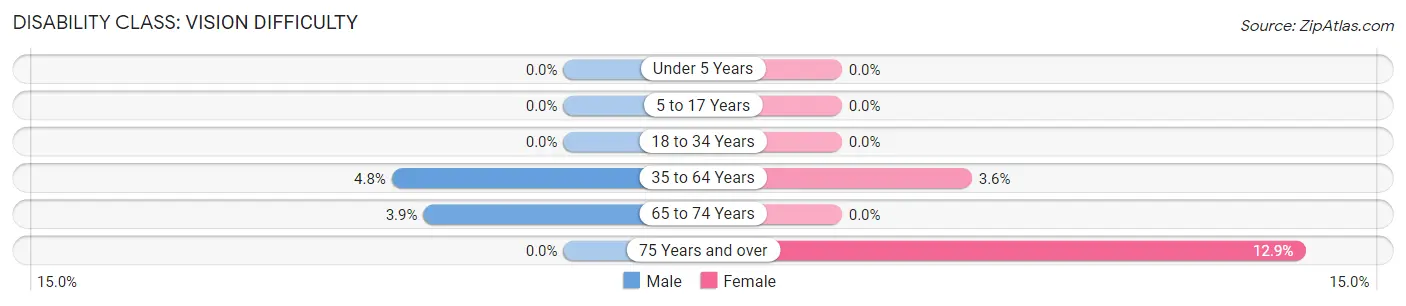
| Age Bracket | Male | Female |
| Under 5 Years | 0 (0.0%) | 0 (0.0%) |
| 5 to 17 Years | 0 (0.0%) | 0 (0.0%) |
| 18 to 34 Years | 0 (0.0%) | 0 (0.0%) |
| 35 to 64 Years | 13 (4.8%) | 8 (3.6%) |
| 65 to 74 Years | 3 (3.9%) | 0 (0.0%) |
| 75 Years and over | 0 (0.0%) | 4 (12.9%) |
Disability Class: Cognitive Difficulty
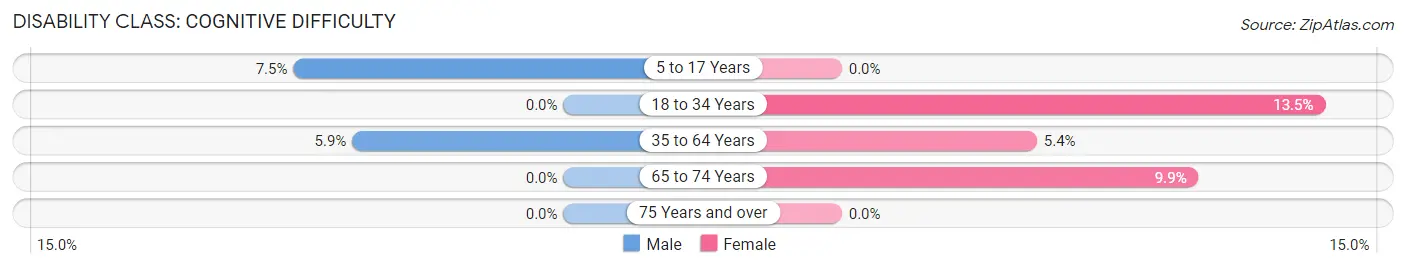
| Age Bracket | Male | Female |
| 5 to 17 Years | 10 (7.5%) | 0 (0.0%) |
| 18 to 34 Years | 0 (0.0%) | 14 (13.5%) |
| 35 to 64 Years | 16 (5.9%) | 12 (5.4%) |
| 65 to 74 Years | 0 (0.0%) | 14 (9.9%) |
| 75 Years and over | 0 (0.0%) | 0 (0.0%) |
Disability Class: Ambulatory Difficulty
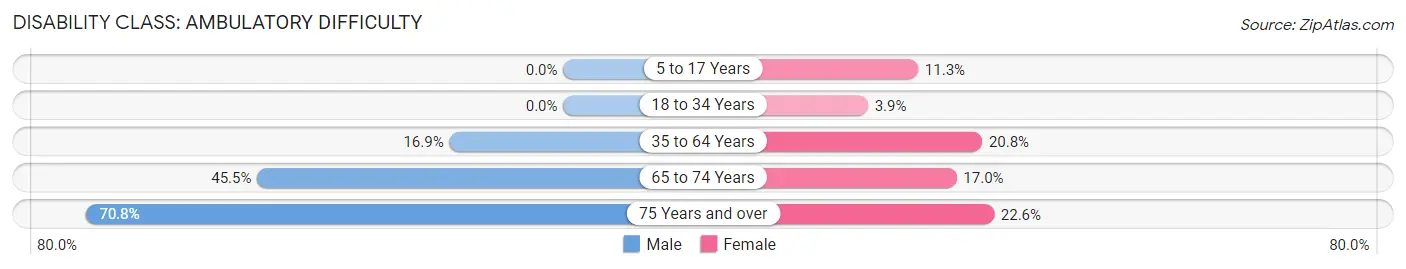
| Age Bracket | Male | Female |
| 5 to 17 Years | 0 (0.0%) | 13 (11.3%) |
| 18 to 34 Years | 0 (0.0%) | 4 (3.8%) |
| 35 to 64 Years | 46 (16.9%) | 46 (20.8%) |
| 65 to 74 Years | 35 (45.5%) | 24 (17.0%) |
| 75 Years and over | 17 (70.8%) | 7 (22.6%) |
Disability Class: Self-Care Difficulty
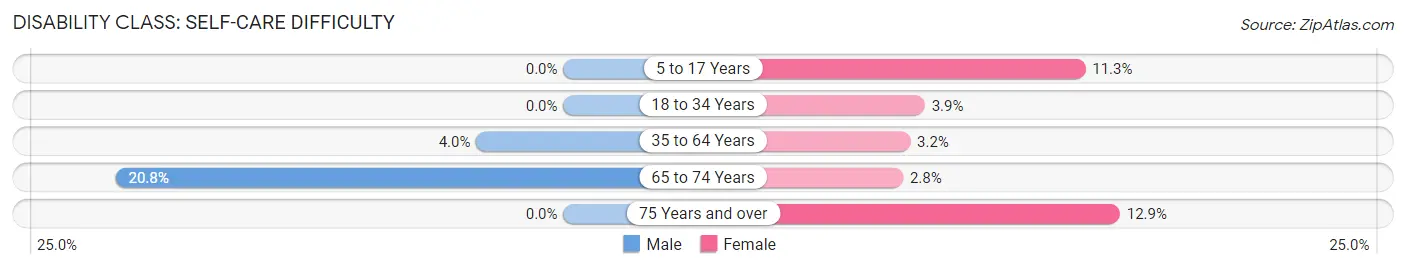
| Age Bracket | Male | Female |
| 5 to 17 Years | 0 (0.0%) | 13 (11.3%) |
| 18 to 34 Years | 0 (0.0%) | 4 (3.8%) |
| 35 to 64 Years | 11 (4.0%) | 7 (3.2%) |
| 65 to 74 Years | 16 (20.8%) | 4 (2.8%) |
| 75 Years and over | 0 (0.0%) | 4 (12.9%) |
Technology Access in Steelville
Computing Device Access in Steelville
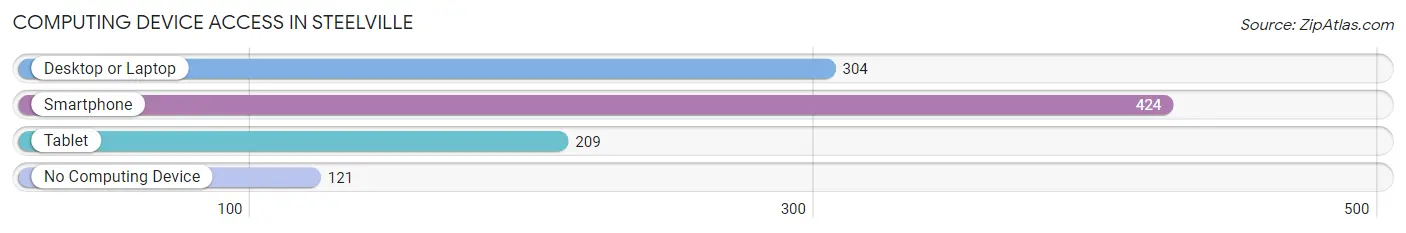
| Device Type | # Households | % Households |
| Desktop or Laptop | 304 | 51.3% |
| Smartphone | 424 | 71.6% |
| Tablet | 209 | 35.3% |
| No Computing Device | 121 | 20.4% |
| Total | 592 | 100.0% |
Internet Access in Steelville
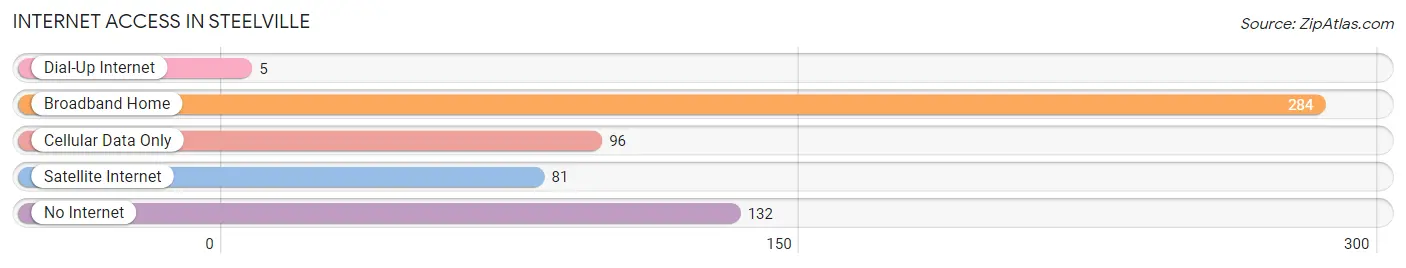
| Internet Type | # Households | % Households |
| Dial-Up Internet | 5 | 0.8% |
| Broadband Home | 284 | 48.0% |
| Cellular Data Only | 96 | 16.2% |
| Satellite Internet | 81 | 13.7% |
| No Internet | 132 | 22.3% |
| Total | 592 | 100.0% |
Steelville Summary
History
The city of Steelville, Missouri is located in the heart of the Ozark Mountains in Crawford County. It was founded in 1836 by a group of settlers from Kentucky and Tennessee. The town was named after the steel industry that was established in the area in the late 1800s. The steel industry was a major contributor to the economy of the area and provided jobs for many of the residents.
The town was also home to a number of other industries, including a flour mill, a sawmill, a brickyard, and a tannery. The town was also home to a number of churches, including the First Baptist Church, which was founded in 1837.
In the early 1900s, the town was home to a number of businesses, including a hotel, a bank, a general store, and a post office. The town also had a number of schools, including a high school, a grade school, and a business college.
The town was also home to a number of cultural and recreational activities, including a movie theater, a bowling alley, and a golf course. The town was also home to a number of parks, including the Steelville City Park, which was established in the early 1900s.
The town was also home to a number of organizations, including the Steelville Chamber of Commerce, which was established in the early 1900s. The Chamber of Commerce was responsible for promoting the town and its businesses.
The town was also home to a number of events, including the Steelville Fair, which was held annually from the late 1800s to the early 1900s. The fair was a popular event that attracted people from all over the region.
The town was also home to a number of clubs and organizations, including the Steelville Lions Club, which was established in the early 1900s. The Lions Club was responsible for providing community service and helping to improve the quality of life in the town.
Geography
Steelville is located in the Ozark Mountains in Crawford County, Missouri. The town is situated on the Meramec River, which is a tributary of the Mississippi River. The town is located about 40 miles south of St. Louis and about 60 miles north of Springfield.
The town is located in a hilly area with elevations ranging from about 800 to 1,000 feet above sea level. The town is surrounded by forests and is home to a number of parks, including the Steelville City Park, which was established in the early 1900s.
The town is located in a humid subtropical climate zone, with hot, humid summers and mild winters. The average annual temperature is about 60 degrees Fahrenheit, with average highs in the summer reaching into the mid-80s and average lows in the winter reaching into the mid-30s.
Economy
The economy of Steelville is largely based on tourism and agriculture. The town is home to a number of tourist attractions, including the Steelville City Park, which was established in the early 1900s. The park is home to a number of recreational activities, including hiking, fishing, and camping.
The town is also home to a number of agricultural businesses, including a number of farms and ranches. The town is also home to a number of businesses that provide services to the agricultural industry, including feed stores, equipment dealers, and veterinarians.
The town is also home to a number of manufacturing businesses, including a number of steel mills and other metalworking businesses. The town is also home to a number of businesses that provide services to the manufacturing industry, including machine shops and welding shops.
Demographics
As of the 2010 census, the population of Steelville was 1,845. The population is largely white, with about 95% of the population being white and about 5% being of other races. The median age of the population is about 40 years old.
The median household income in Steelville is about $37,000, which is slightly lower than the national median of $50,000. The median home value in Steelville is about $90,000, which is slightly lower than the national median of $200,000.
The town is home to a number of churches, including the First Baptist Church, which was founded in 1837. The town is also home to a number of schools, including a high school, a grade school, and a business college.
Common Questions
What is Per Capita Income in Steelville?
Per Capita income in Steelville is $17,792.
What is the Median Family Income in Steelville?
Median Family Income in Steelville is $47,396.
What is the Median Household income in Steelville?
Median Household Income in Steelville is $35,000.
What is Income or Wage Gap in Steelville?
Income or Wage Gap in Steelville is 20.0%.
Women in Steelville earn 80.0 cents for every dollar earned by a man.
What is Inequality or Gini Index in Steelville?
Inequality or Gini Index in Steelville is 0.40.
What is the Total Population of Steelville?
Total Population of Steelville is 1,515.
What is the Total Male Population of Steelville?
Total Male Population of Steelville is 792.
What is the Total Female Population of Steelville?
Total Female Population of Steelville is 723.
What is the Ratio of Males per 100 Females in Steelville?
There are 109.54 Males per 100 Females in Steelville.
What is the Ratio of Females per 100 Males in Steelville?
There are 91.29 Females per 100 Males in Steelville.
What is the Median Population Age in Steelville?
Median Population Age in Steelville is 40.1 Years.
What is the Average Family Size in Steelville
Average Family Size in Steelville is 3.3 People.
What is the Average Household Size in Steelville
Average Household Size in Steelville is 2.3 People.
How Large is the Labor Force in Steelville?
There are 558 People in the Labor Forcein in Steelville.
What is the Percentage of People in the Labor Force in Steelville?
44.8% of People are in the Labor Force in Steelville.
What is the Unemployment Rate in Steelville?
Unemployment Rate in Steelville is 9.1%.