East Prairie, MO Map & Demographics
East Prairie Map
East Prairie Overview
$19,728
PER CAPITA INCOME
$32,600
AVG FAMILY INCOME
$28,300
AVG HOUSEHOLD INCOME
40.4%
WAGE / INCOME GAP [ % ]
59.6¢/ $1
WAGE / INCOME GAP [ $ ]
0.46
INEQUALITY / GINI INDEX
2,969
TOTAL POPULATION
1,437
MALE POPULATION
1,532
FEMALE POPULATION
93.80
MALES / 100 FEMALES
106.61
FEMALES / 100 MALES
41.9
MEDIAN AGE
2.6
AVG FAMILY SIZE
2.1
AVG HOUSEHOLD SIZE
1,088
LABOR FORCE [ PEOPLE ]
45.6%
PERCENT IN LABOR FORCE
6.0%
UNEMPLOYMENT RATE
East Prairie Zip Codes
East Prairie Area Codes
Income in East Prairie
Income Overview in East Prairie
Per Capita Income in East Prairie is $19,728, while median incomes of families and households are $32,600 and $28,300 respectively.
| Characteristic | Number | Measure |
| Per Capita Income | 2,969 | $19,728 |
| Median Family Income | 900 | $32,600 |
| Mean Family Income | 900 | $44,406 |
| Median Household Income | 1,386 | $28,300 |
| Mean Household Income | 1,386 | $42,370 |
| Income Deficit | 900 | $0 |
| Wage / Income Gap (%) | 2,969 | 40.43% |
| Wage / Income Gap ($) | 2,969 | 59.57¢ per $1 |
| Gini / Inequality Index | 2,969 | 0.46 |
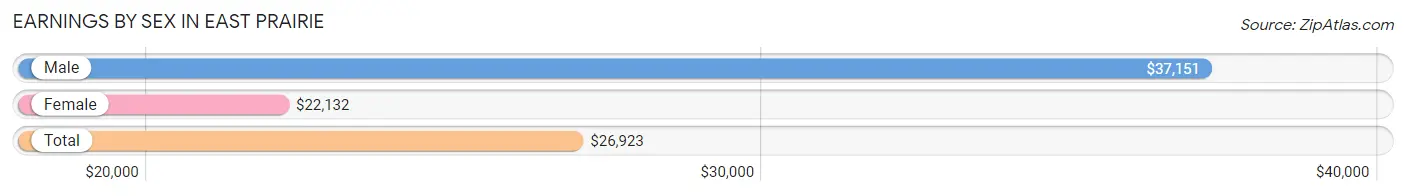
Earnings by Sex in East Prairie
Average Earnings in East Prairie are $26,923, $37,151 for men and $22,132 for women, a difference of 40.4%.
| Sex | Number | Average Earnings |
| Male | 671 (58.5%) | $37,151 |
| Female | 477 (41.5%) | $22,132 |
| Total | 1,148 (100.0%) | $26,923 |
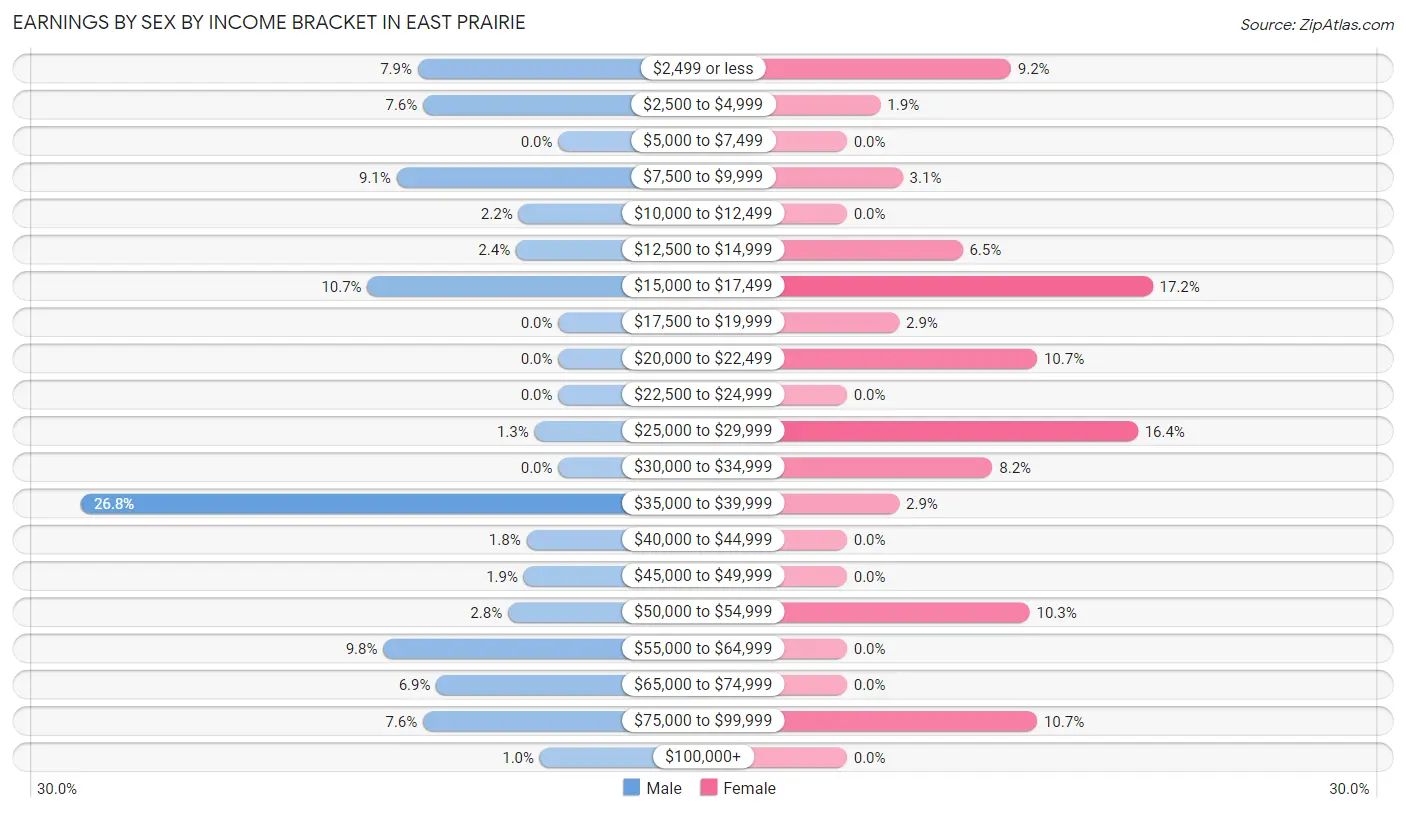
Earnings by Sex by Income Bracket in East Prairie
The most common earnings brackets in East Prairie are $35,000 to $39,999 for men (180 | 26.8%) and $15,000 to $17,499 for women (82 | 17.2%).
| Income | Male | Female |
| $2,499 or less | 53 (7.9%) | 44 (9.2%) |
| $2,500 to $4,999 | 51 (7.6%) | 9 (1.9%) |
| $5,000 to $7,499 | 0 (0.0%) | 0 (0.0%) |
| $7,500 to $9,999 | 61 (9.1%) | 15 (3.1%) |
| $10,000 to $12,499 | 15 (2.2%) | 0 (0.0%) |
| $12,500 to $14,999 | 16 (2.4%) | 31 (6.5%) |
| $15,000 to $17,499 | 72 (10.7%) | 82 (17.2%) |
| $17,500 to $19,999 | 0 (0.0%) | 14 (2.9%) |
| $20,000 to $22,499 | 0 (0.0%) | 51 (10.7%) |
| $22,500 to $24,999 | 0 (0.0%) | 0 (0.0%) |
| $25,000 to $29,999 | 9 (1.3%) | 78 (16.4%) |
| $30,000 to $34,999 | 0 (0.0%) | 39 (8.2%) |
| $35,000 to $39,999 | 180 (26.8%) | 14 (2.9%) |
| $40,000 to $44,999 | 12 (1.8%) | 0 (0.0%) |
| $45,000 to $49,999 | 13 (1.9%) | 0 (0.0%) |
| $50,000 to $54,999 | 19 (2.8%) | 49 (10.3%) |
| $55,000 to $64,999 | 66 (9.8%) | 0 (0.0%) |
| $65,000 to $74,999 | 46 (6.9%) | 0 (0.0%) |
| $75,000 to $99,999 | 51 (7.6%) | 51 (10.7%) |
| $100,000+ | 7 (1.0%) | 0 (0.0%) |
| Total | 671 (100.0%) | 477 (100.0%) |
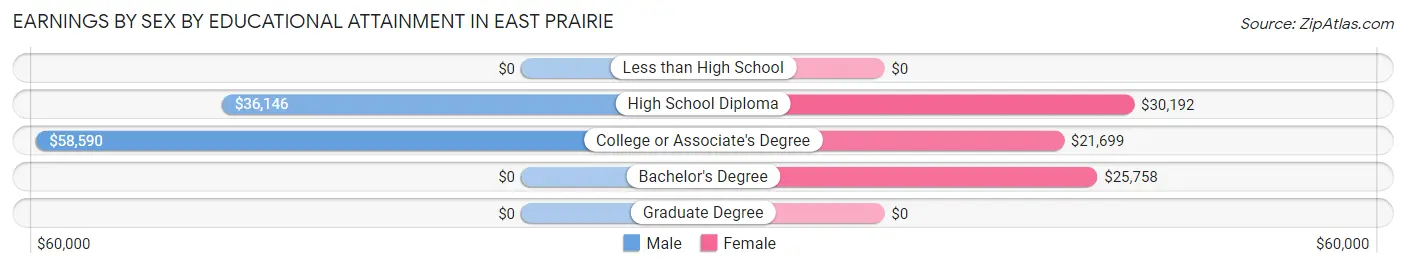
Earnings by Sex by Educational Attainment in East Prairie
Average earnings in East Prairie are $39,096 for men and $25,080 for women, a difference of 35.8%. Men with an educational attainment of college or associate's degree enjoy the highest average annual earnings of $58,590, while those with high school diploma education earn the least with $36,146. Women with an educational attainment of high school diploma earn the most with the average annual earnings of $30,192, while those with college or associate's degree education have the smallest earnings of $21,699.
| Educational Attainment | Male Income | Female Income |
| Less than High School | - | - |
| High School Diploma | $36,146 | $30,192 |
| College or Associate's Degree | $58,590 | $21,699 |
| Bachelor's Degree | - | - |
| Graduate Degree | - | - |
| Total | $39,096 | $25,080 |
Family Income in East Prairie
Family Income Brackets in East Prairie
According to the East Prairie family income data, there are 157 families falling into the $15,000 to $24,999 income range, which is the most common income bracket and makes up 17.4% of all families.

| Income Bracket | # Families | % Families |
| Less than $10,000 | 83 | 9.2% |
| $10,000 to $14,999 | 121 | 13.4% |
| $15,000 to $24,999 | 157 | 17.4% |
| $25,000 to $34,999 | 113 | 12.6% |
| $35,000 to $49,999 | 121 | 13.4% |
| $50,000 to $74,999 | 112 | 12.4% |
| $75,000 to $99,999 | 155 | 17.2% |
| $100,000 to $149,999 | 9 | 1.0% |
| $150,000 to $199,999 | 29 | 3.2% |
| $200,000+ | 0 | 0.0% |
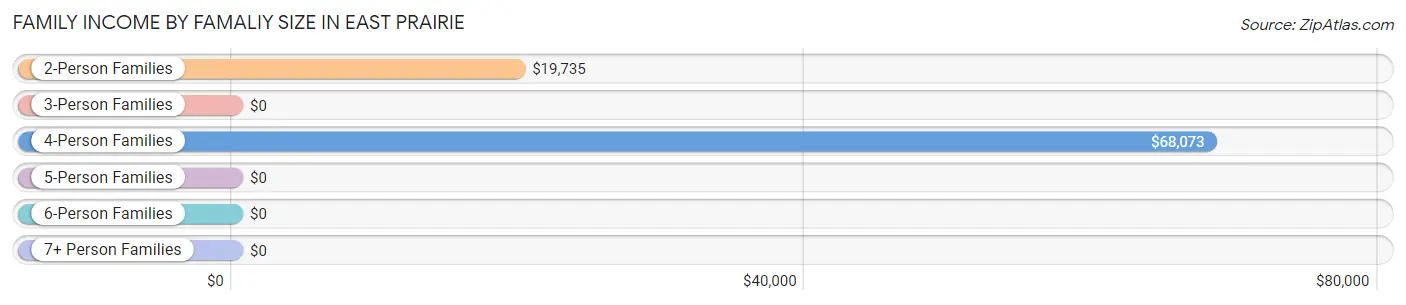
Family Income by Famaliy Size in East Prairie
4-person families (216 | 24.0%) account for the highest median family income in East Prairie with $68,073 per family, while 4-person families (216 | 24.0%) have the highest median income of $17,018 per family member.
| Income Bracket | # Families | Median Income |
| 2-Person Families | 503 (55.9%) | $19,735 |
| 3-Person Families | 172 (19.1%) | $0 |
| 4-Person Families | 216 (24.0%) | $68,073 |
| 5-Person Families | 9 (1.0%) | $0 |
| 6-Person Families | 0 (0.0%) | $0 |
| 7+ Person Families | 0 (0.0%) | $0 |
| Total | 900 (100.0%) | $32,600 |
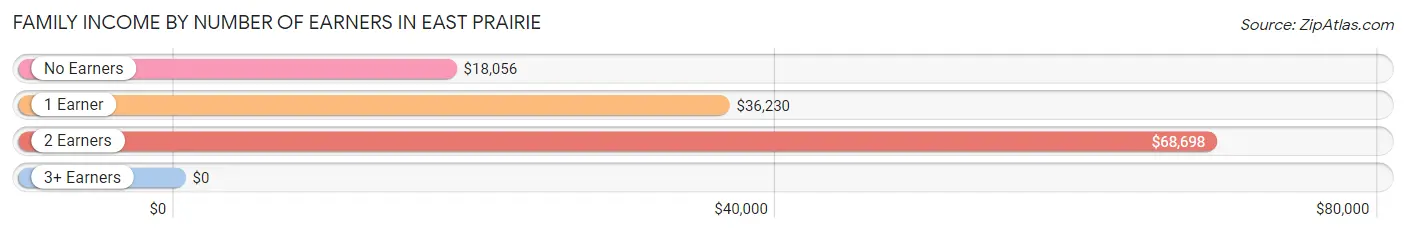
Family Income by Number of Earners in East Prairie
| Number of Earners | # Families | Median Income |
| No Earners | 338 (37.6%) | $18,056 |
| 1 Earner | 268 (29.8%) | $36,230 |
| 2 Earners | 294 (32.7%) | $68,698 |
| 3+ Earners | 0 (0.0%) | $0 |
| Total | 900 (100.0%) | $32,600 |
Household Income in East Prairie
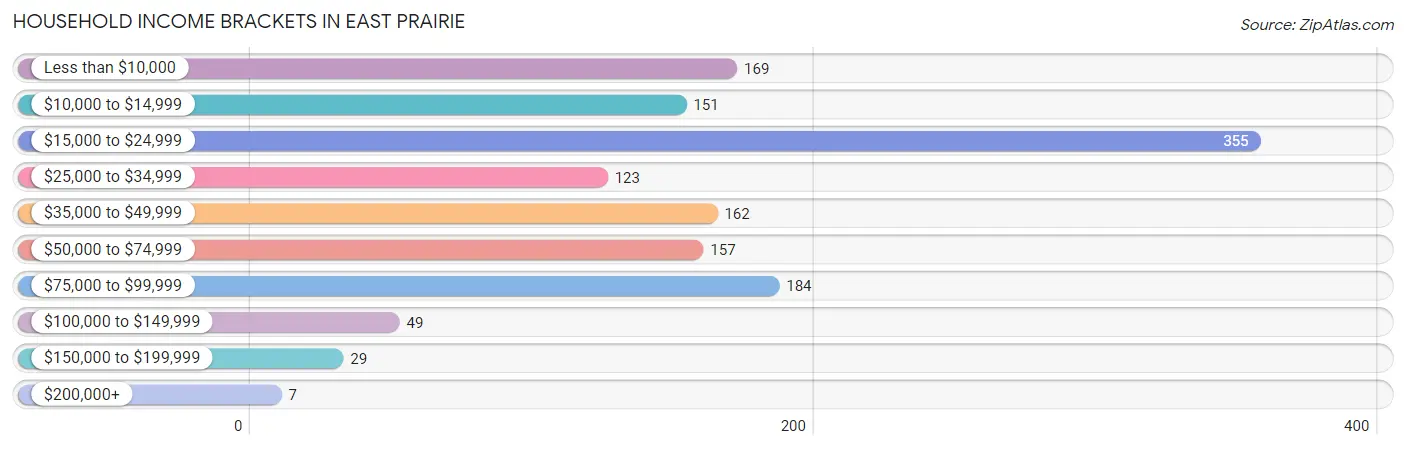
Household Income Brackets in East Prairie
With 355 households falling in the category, the $15,000 to $24,999 income range is the most frequent in East Prairie, accounting for 25.6% of all households. In contrast, only 7 households (0.5%) fall into the $200,000+ income bracket, making it the least populous group.
| Income Bracket | # Households | % Households |
| Less than $10,000 | 169 | 12.2% |
| $10,000 to $14,999 | 151 | 10.9% |
| $15,000 to $24,999 | 355 | 25.6% |
| $25,000 to $34,999 | 123 | 8.9% |
| $35,000 to $49,999 | 162 | 11.7% |
| $50,000 to $74,999 | 157 | 11.3% |
| $75,000 to $99,999 | 184 | 13.3% |
| $100,000 to $149,999 | 49 | 3.5% |
| $150,000 to $199,999 | 29 | 2.1% |
| $200,000+ | 7 | 0.5% |
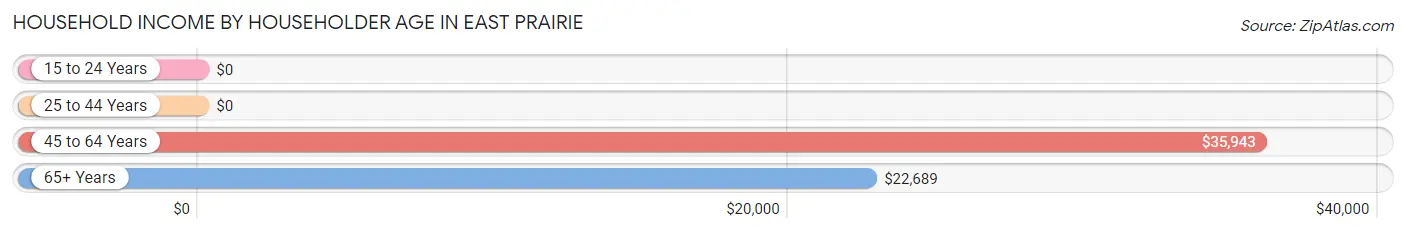
Household Income by Householder Age in East Prairie
The median household income in East Prairie is $28,300, with the highest median household income of $35,943 found in the 45 to 64 years age bracket for the primary householder. A total of 452 households (32.6%) fall into this category.
| Income Bracket | # Households | Median Income |
| 15 to 24 Years | 0 (0.0%) | $0 |
| 25 to 44 Years | 463 (33.4%) | $0 |
| 45 to 64 Years | 452 (32.6%) | $35,943 |
| 65+ Years | 471 (34.0%) | $22,689 |
| Total | 1,386 (100.0%) | $28,300 |
Poverty in East Prairie
Income Below Poverty by Sex and Age in East Prairie
With 30.1% poverty level for males and 26.3% for females among the residents of East Prairie, under 5 year old males and 18 to 24 year old females are the most vulnerable to poverty, with 52 males (80.0%) and 20 females (100.0%) in their respective age groups living below the poverty level.
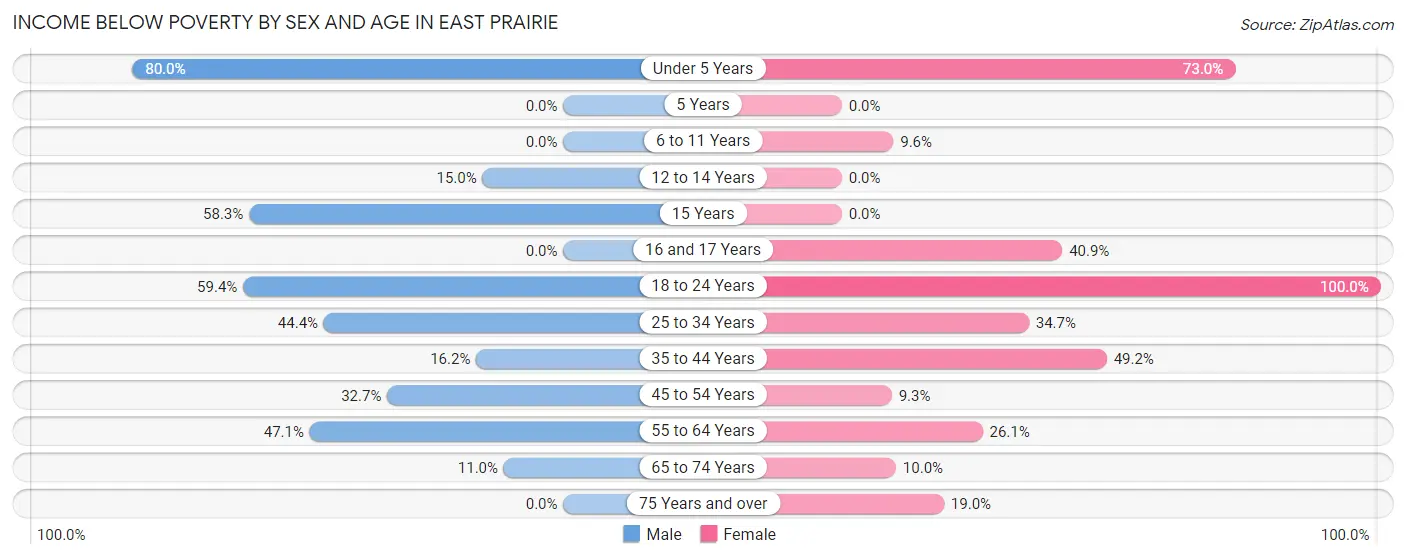
| Age Bracket | Male | Female |
| Under 5 Years | 52 (80.0%) | 73 (73.0%) |
| 5 Years | 0 (0.0%) | 0 (0.0%) |
| 6 to 11 Years | 0 (0.0%) | 13 (9.6%) |
| 12 to 14 Years | 21 (15.0%) | 0 (0.0%) |
| 15 Years | 7 (58.3%) | 0 (0.0%) |
| 16 and 17 Years | 0 (0.0%) | 9 (40.9%) |
| 18 to 24 Years | 104 (59.4%) | 20 (100.0%) |
| 25 to 34 Years | 84 (44.4%) | 59 (34.7%) |
| 35 to 44 Years | 27 (16.2%) | 89 (49.2%) |
| 45 to 54 Years | 68 (32.7%) | 14 (9.3%) |
| 55 to 64 Years | 48 (47.1%) | 64 (26.1%) |
| 65 to 74 Years | 18 (11.0%) | 28 (10.0%) |
| 75 Years and over | 0 (0.0%) | 29 (19.0%) |
| Total | 429 (30.1%) | 398 (26.3%) |
Income Above Poverty by Sex and Age in East Prairie
According to the poverty statistics in East Prairie, males aged 6 to 11 years and females aged 12 to 14 years are the age groups that are most secure financially, with 100.0% of males and 100.0% of females in these age groups living above the poverty line.
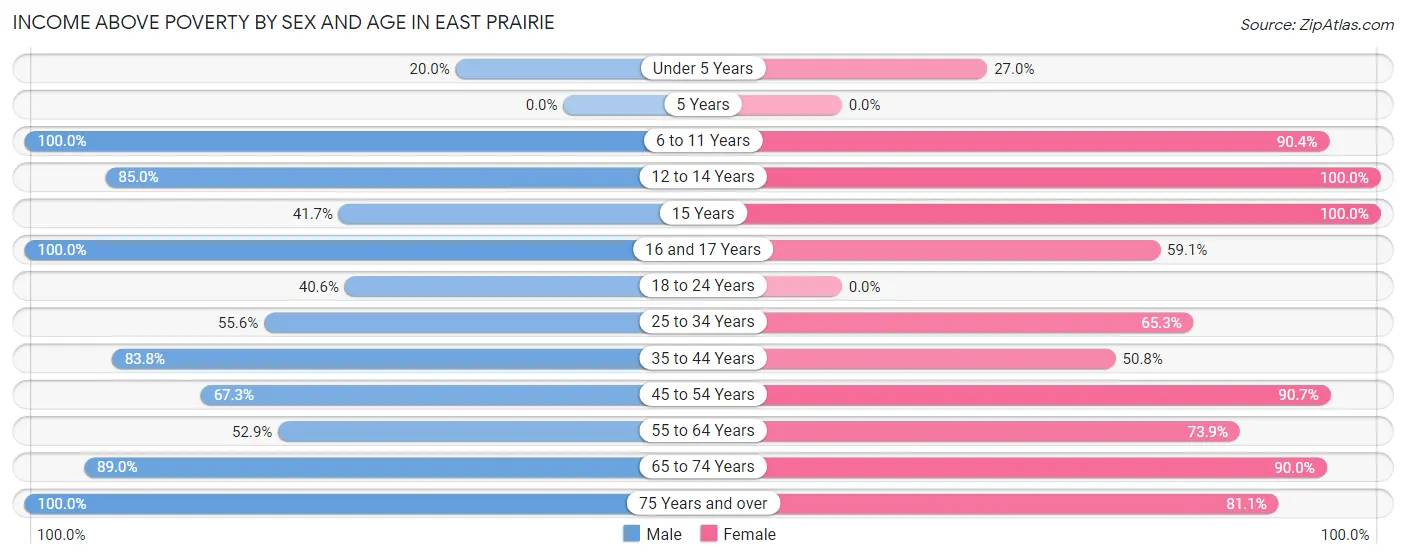
| Age Bracket | Male | Female |
| Under 5 Years | 13 (20.0%) | 27 (27.0%) |
| 5 Years | 0 (0.0%) | 0 (0.0%) |
| 6 to 11 Years | 75 (100.0%) | 123 (90.4%) |
| 12 to 14 Years | 119 (85.0%) | 9 (100.0%) |
| 15 Years | 5 (41.7%) | 46 (100.0%) |
| 16 and 17 Years | 75 (100.0%) | 13 (59.1%) |
| 18 to 24 Years | 71 (40.6%) | 0 (0.0%) |
| 25 to 34 Years | 105 (55.6%) | 111 (65.3%) |
| 35 to 44 Years | 140 (83.8%) | 92 (50.8%) |
| 45 to 54 Years | 140 (67.3%) | 137 (90.7%) |
| 55 to 64 Years | 54 (52.9%) | 181 (73.9%) |
| 65 to 74 Years | 145 (89.0%) | 251 (90.0%) |
| 75 Years and over | 53 (100.0%) | 124 (81.0%) |
| Total | 995 (69.9%) | 1,114 (73.7%) |
Income Below Poverty Among Married-Couple Families in East Prairie
The poverty statistics for married-couple families in East Prairie show that 8.9% or 47 of the total 530 families live below the poverty line. Families with no children have the highest poverty rate of 11.1%, comprising of 32 families. On the other hand, families with 3 or 4 children have the lowest poverty rate of 0.0%, which includes 0 families.
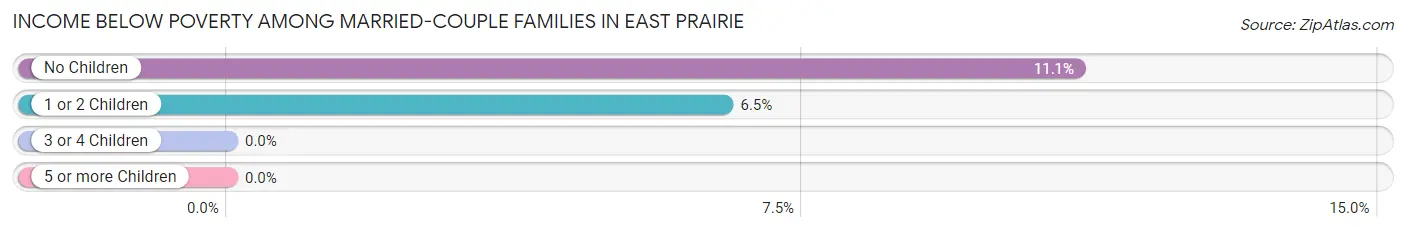
| Children | Above Poverty | Below Poverty |
| No Children | 257 (88.9%) | 32 (11.1%) |
| 1 or 2 Children | 217 (93.5%) | 15 (6.5%) |
| 3 or 4 Children | 9 (100.0%) | 0 (0.0%) |
| 5 or more Children | 0 (0.0%) | 0 (0.0%) |
| Total | 483 (91.1%) | 47 (8.9%) |
Income Below Poverty Among Single-Parent Households in East Prairie
According to the poverty data in East Prairie, 97.2% or 105 single-father households and 45.8% or 120 single-mother households are living below the poverty line. Among single-father households, those with no children have the highest poverty rate, with 36 households (100.0%) experiencing poverty. Likewise, among single-mother households, those with 1 or 2 children have the highest poverty rate, with 48 households (55.2%) falling below the poverty line.
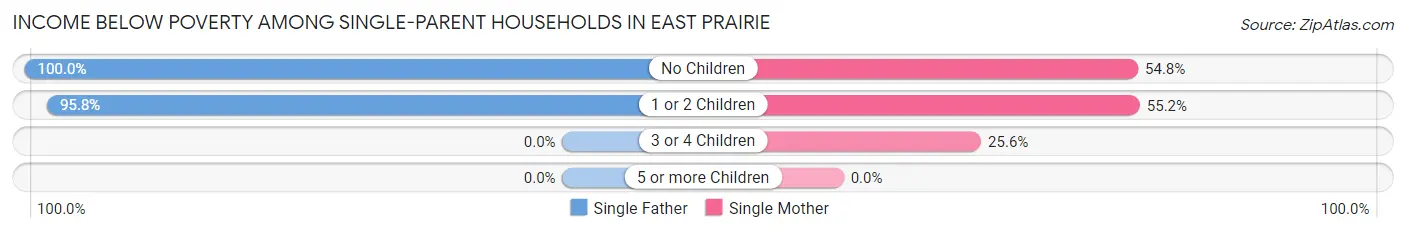
| Children | Single Father | Single Mother |
| No Children | 36 (100.0%) | 51 (54.8%) |
| 1 or 2 Children | 69 (95.8%) | 48 (55.2%) |
| 3 or 4 Children | 0 (0.0%) | 21 (25.6%) |
| 5 or more Children | 0 (0.0%) | 0 (0.0%) |
| Total | 105 (97.2%) | 120 (45.8%) |
Income Below Poverty Among Married-Couple vs Single-Parent Households in East Prairie
The poverty data for East Prairie shows that 47 of the married-couple family households (8.9%) and 225 of the single-parent households (60.8%) are living below the poverty level. Within the married-couple family households, those with no children have the highest poverty rate, with 32 households (11.1%) falling below the poverty line. Among the single-parent households, those with 1 or 2 children have the highest poverty rate, with 117 household (73.6%) living below poverty.
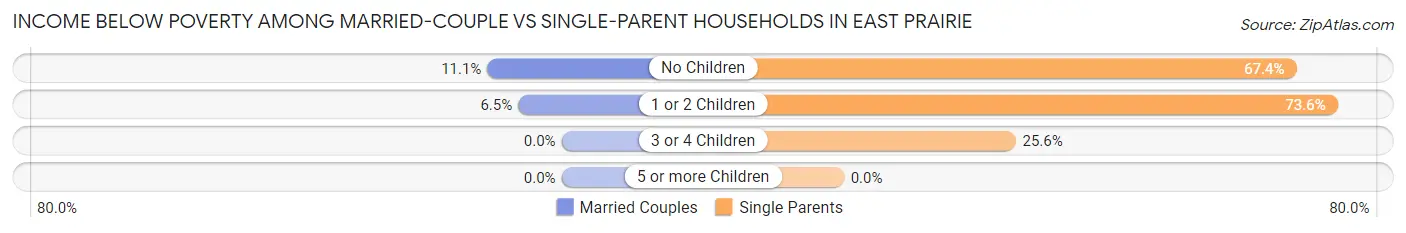
| Children | Married-Couple Families | Single-Parent Households |
| No Children | 32 (11.1%) | 87 (67.4%) |
| 1 or 2 Children | 15 (6.5%) | 117 (73.6%) |
| 3 or 4 Children | 0 (0.0%) | 21 (25.6%) |
| 5 or more Children | 0 (0.0%) | 0 (0.0%) |
| Total | 47 (8.9%) | 225 (60.8%) |
Race in East Prairie
The most populous races in East Prairie are White / Caucasian (2,739 | 92.2%), Two or more Races (203 | 6.8%), and Black / African American (27 | 0.9%).
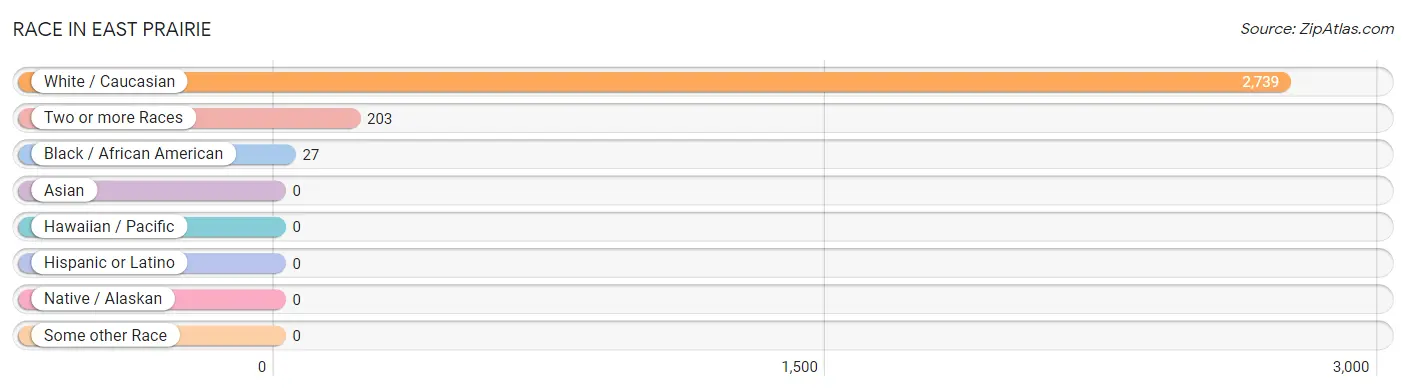
| Race | # Population | % Population |
| Asian | 0 | 0.0% |
| Black / African American | 27 | 0.9% |
| Hawaiian / Pacific | 0 | 0.0% |
| Hispanic or Latino | 0 | 0.0% |
| Native / Alaskan | 0 | 0.0% |
| White / Caucasian | 2,739 | 92.2% |
| Two or more Races | 203 | 6.8% |
| Some other Race | 0 | 0.0% |
| Total | 2,969 | 100.0% |
Ancestry in East Prairie
The most populous ancestries reported in East Prairie are English (487 | 16.4%), Scottish (318 | 10.7%), American (315 | 10.6%), Irish (260 | 8.8%), and German (88 | 3.0%), together accounting for 49.4% of all East Prairie residents.
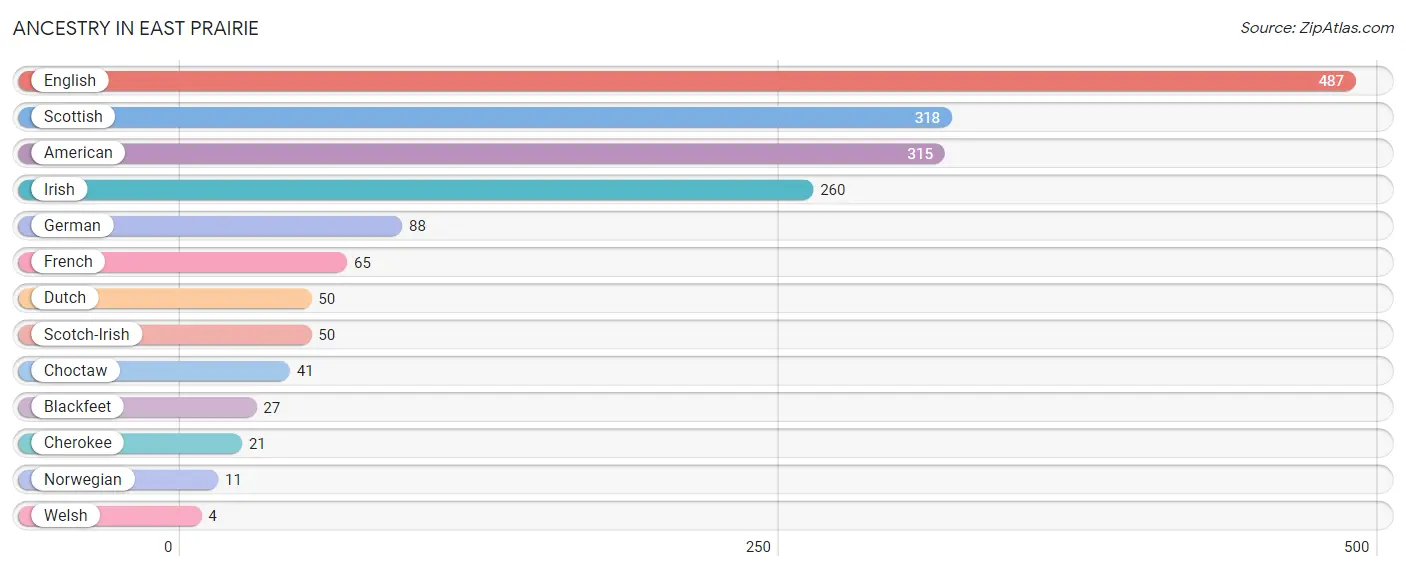
| Ancestry | # Population | % Population |
| American | 315 | 10.6% |
| Blackfeet | 27 | 0.9% |
| Cherokee | 21 | 0.7% |
| Choctaw | 41 | 1.4% |
| Dutch | 50 | 1.7% |
| English | 487 | 16.4% |
| French | 65 | 2.2% |
| German | 88 | 3.0% |
| Irish | 260 | 8.8% |
| Norwegian | 11 | 0.4% |
| Scotch-Irish | 50 | 1.7% |
| Scottish | 318 | 10.7% |
| Welsh | 4 | 0.1% | View All 13 Rows |
Immigrants in East Prairie

| Immigration Origin | # Population | % Population | View All 0 Rows |
Sex and Age in East Prairie
Sex and Age in East Prairie
The most populous age groups in East Prairie are 10 to 14 Years (193 | 13.4%) for men and 65 to 69 Years (174 | 11.4%) for women.
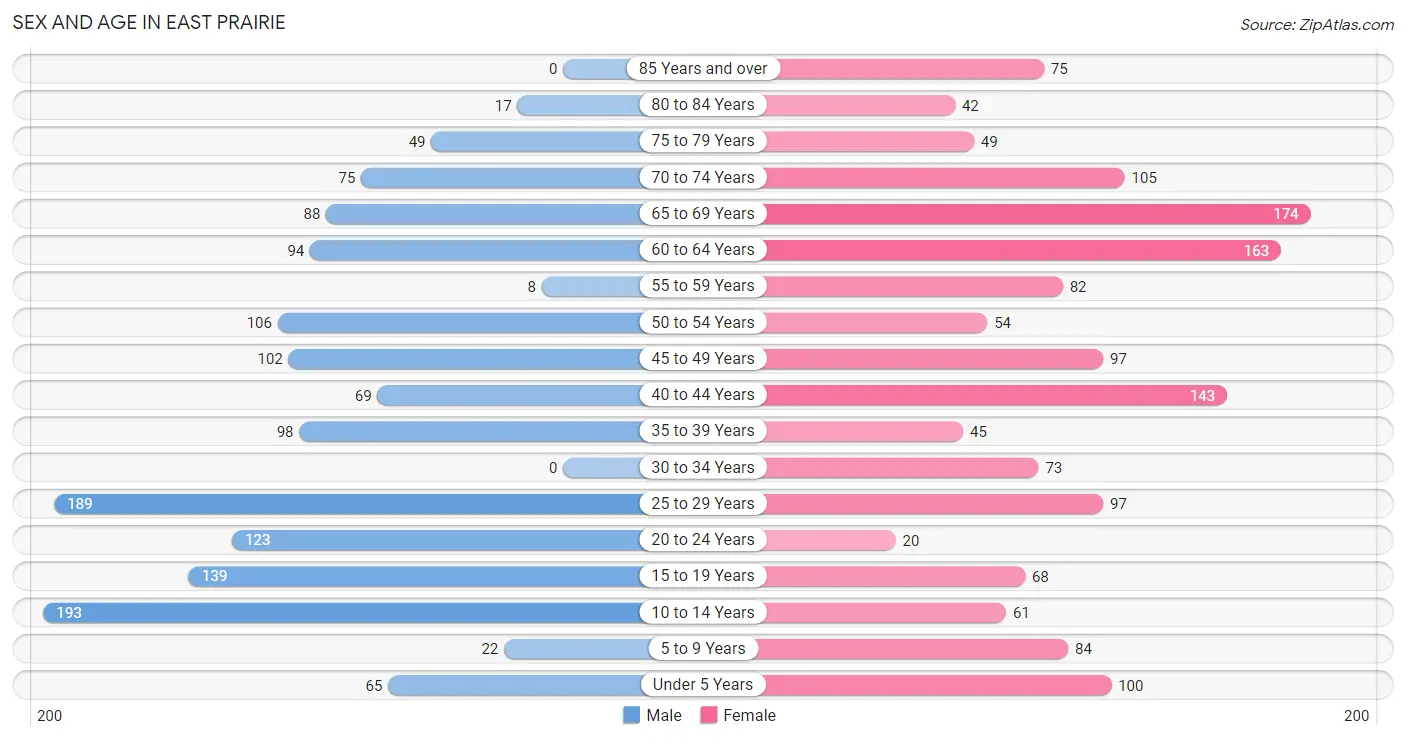
| Age Bracket | Male | Female |
| Under 5 Years | 65 (4.5%) | 100 (6.5%) |
| 5 to 9 Years | 22 (1.5%) | 84 (5.5%) |
| 10 to 14 Years | 193 (13.4%) | 61 (4.0%) |
| 15 to 19 Years | 139 (9.7%) | 68 (4.4%) |
| 20 to 24 Years | 123 (8.6%) | 20 (1.3%) |
| 25 to 29 Years | 189 (13.2%) | 97 (6.3%) |
| 30 to 34 Years | 0 (0.0%) | 73 (4.8%) |
| 35 to 39 Years | 98 (6.8%) | 45 (2.9%) |
| 40 to 44 Years | 69 (4.8%) | 143 (9.3%) |
| 45 to 49 Years | 102 (7.1%) | 97 (6.3%) |
| 50 to 54 Years | 106 (7.4%) | 54 (3.5%) |
| 55 to 59 Years | 8 (0.6%) | 82 (5.3%) |
| 60 to 64 Years | 94 (6.5%) | 163 (10.6%) |
| 65 to 69 Years | 88 (6.1%) | 174 (11.4%) |
| 70 to 74 Years | 75 (5.2%) | 105 (6.9%) |
| 75 to 79 Years | 49 (3.4%) | 49 (3.2%) |
| 80 to 84 Years | 17 (1.2%) | 42 (2.7%) |
| 85 Years and over | 0 (0.0%) | 75 (4.9%) |
| Total | 1,437 (100.0%) | 1,532 (100.0%) |
Families and Households in East Prairie
Median Family Size in East Prairie
The median family size in East Prairie is 2.61 persons per family, with married-couple families (530 | 58.9%) accounting for the largest median family size of 2.82 persons per family. On the other hand, single male/father families (108 | 12.0%) represent the smallest median family size with 1.72 persons per family.
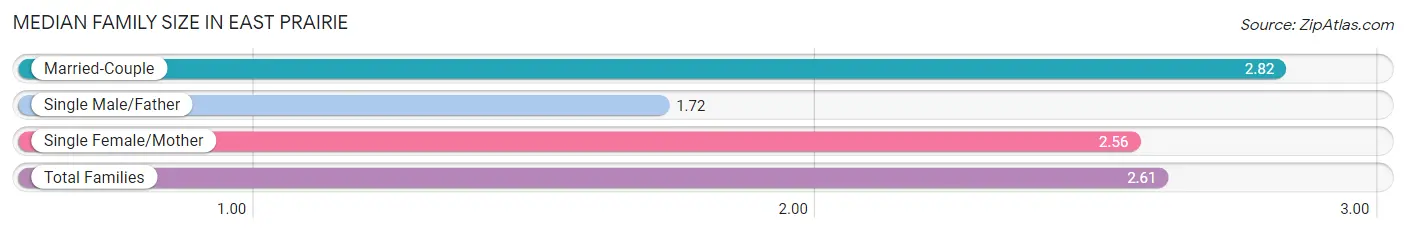
| Family Type | # Families | Family Size |
| Married-Couple | 530 (58.9%) | 2.82 |
| Single Male/Father | 108 (12.0%) | 1.72 |
| Single Female/Mother | 262 (29.1%) | 2.56 |
| Total Families | 900 (100.0%) | 2.61 |
Median Household Size in East Prairie
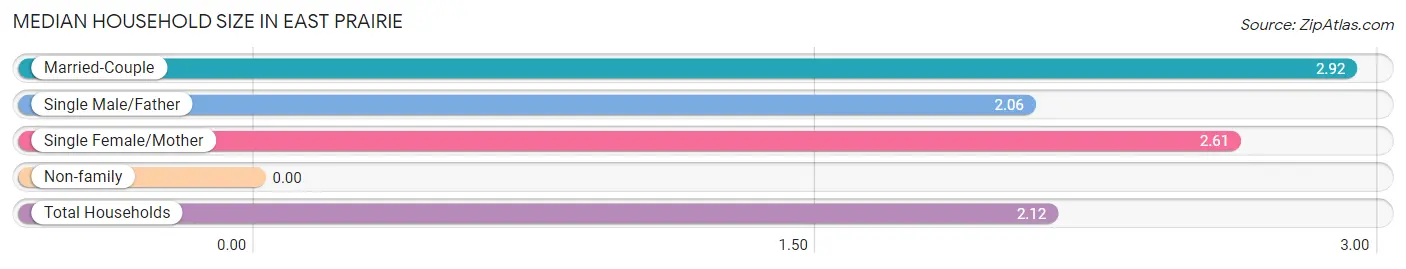
| Household Type | # Households | Household Size |
| Married-Couple | 530 (38.2%) | 2.92 |
| Single Male/Father | 108 (7.8%) | 2.06 |
| Single Female/Mother | 262 (18.9%) | 2.61 |
| Non-family | 486 (35.1%) | - |
| Total Households | 1,386 (100.0%) | 2.12 |
Household Size by Marriage Status in East Prairie
Out of a total of 1,386 households in East Prairie, 900 (64.9%) are family households, while 486 (35.1%) are nonfamily households. The most numerous type of family households are 2-person households, comprising 453, and the most common type of nonfamily households are 1-person households, comprising 486.
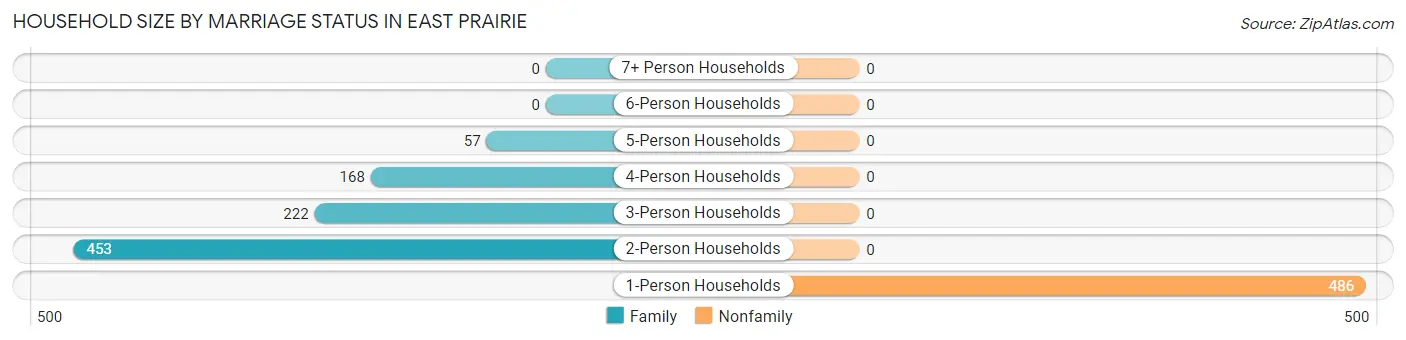
| Household Size | Family Households | Nonfamily Households |
| 1-Person Households | - | 486 (35.1%) |
| 2-Person Households | 453 (32.7%) | 0 (0.0%) |
| 3-Person Households | 222 (16.0%) | 0 (0.0%) |
| 4-Person Households | 168 (12.1%) | 0 (0.0%) |
| 5-Person Households | 57 (4.1%) | 0 (0.0%) |
| 6-Person Households | 0 (0.0%) | 0 (0.0%) |
| 7+ Person Households | 0 (0.0%) | 0 (0.0%) |
| Total | 900 (64.9%) | 486 (35.1%) |
Female Fertility in East Prairie
Fertility by Age in East Prairie
Average fertility rate in East Prairie is 34.0 births per 1,000 women. Women in the age bracket of 20 to 34 years have the highest fertility rate with 105.0 births per 1,000 women. Women in the age bracket of 20 to 34 years acount for 100.0% of all women with births.
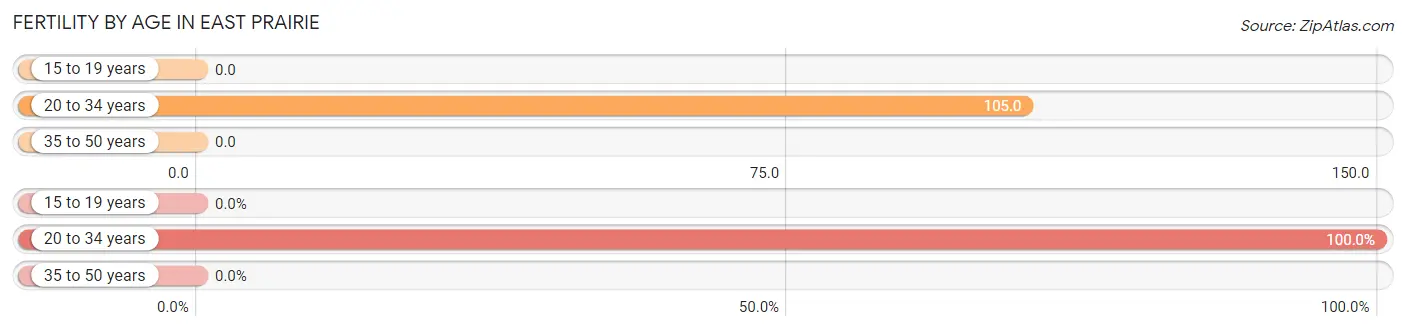
| Age Bracket | Women with Births | Births / 1,000 Women |
| 15 to 19 years | 0 (0.0%) | 0.0 |
| 20 to 34 years | 20 (100.0%) | 105.0 |
| 35 to 50 years | 0 (0.0%) | 0.0 |
| Total | 20 (100.0%) | 34.0 |
Fertility by Age by Marriage Status in East Prairie
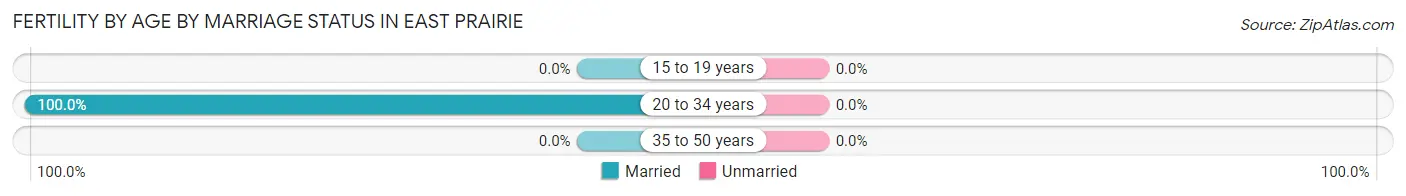
| Age Bracket | Married | Unmarried |
| 15 to 19 years | 0 (0.0%) | 0 (0.0%) |
| 20 to 34 years | 20 (100.0%) | 0 (0.0%) |
| 35 to 50 years | 0 (0.0%) | 0 (0.0%) |
| Total | 20 (100.0%) | 0 (0.0%) |
Fertility by Education in East Prairie
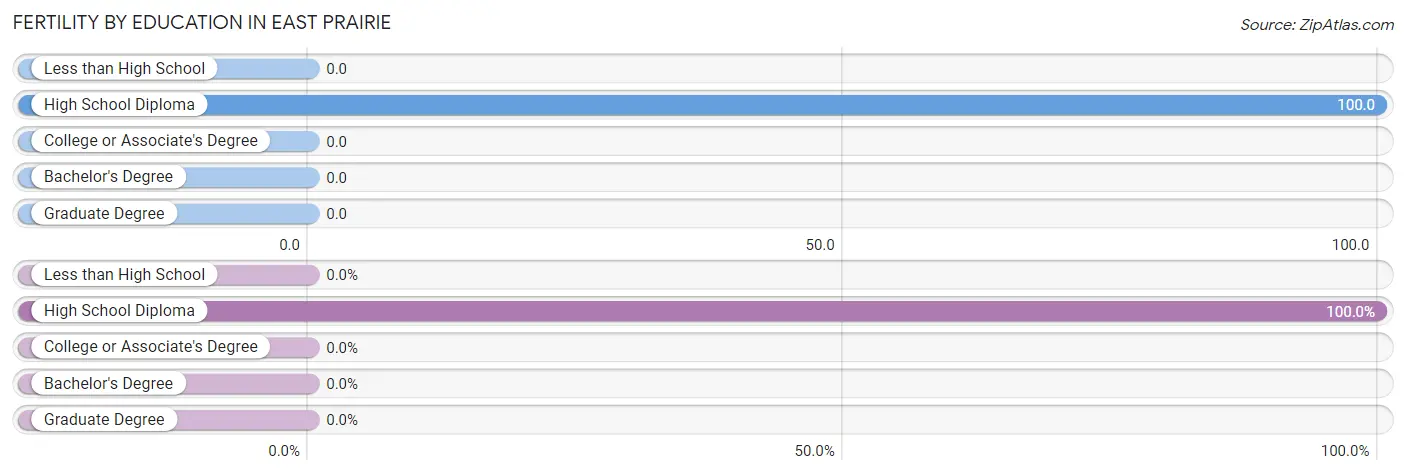
| Educational Attainment | Women with Births | Births / 1,000 Women |
| Less than High School | 0 (0.0%) | 0.0 |
| High School Diploma | 20 (100.0%) | 100.0 |
| College or Associate's Degree | 0 (0.0%) | 0.0 |
| Bachelor's Degree | 0 (0.0%) | 0.0 |
| Graduate Degree | 0 (0.0%) | 0.0 |
| Total | 20 (100.0%) | 34.0 |
Fertility by Education by Marriage Status in East Prairie
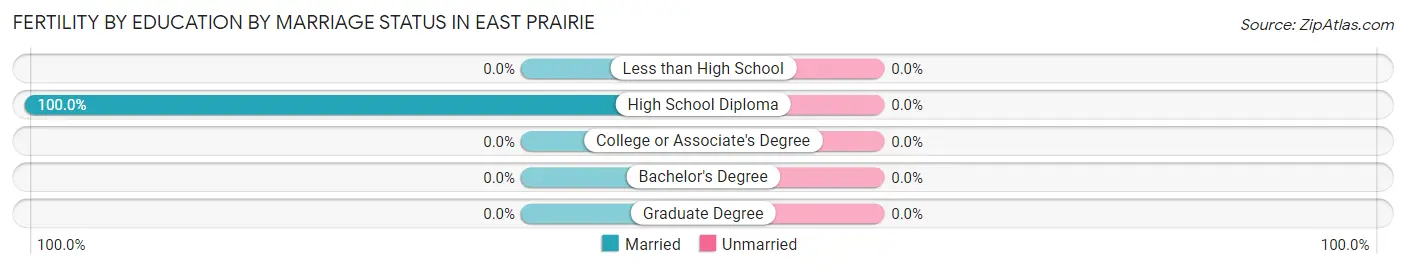
| Educational Attainment | Married | Unmarried |
| Less than High School | 0 (0.0%) | 0 (0.0%) |
| High School Diploma | 20 (100.0%) | 0 (0.0%) |
| College or Associate's Degree | 0 (0.0%) | 0 (0.0%) |
| Bachelor's Degree | 0 (0.0%) | 0 (0.0%) |
| Graduate Degree | 0 (0.0%) | 0 (0.0%) |
| Total | 20 (100.0%) | 0 (0.0%) |
Employment Characteristics in East Prairie
Employment by Class of Employer in East Prairie
Among the 974 employed individuals in East Prairie, private company employees (786 | 80.7%), state government employees (85 | 8.7%), and self-employed (not incorporated) (41 | 4.2%) make up the most common classes of employment.
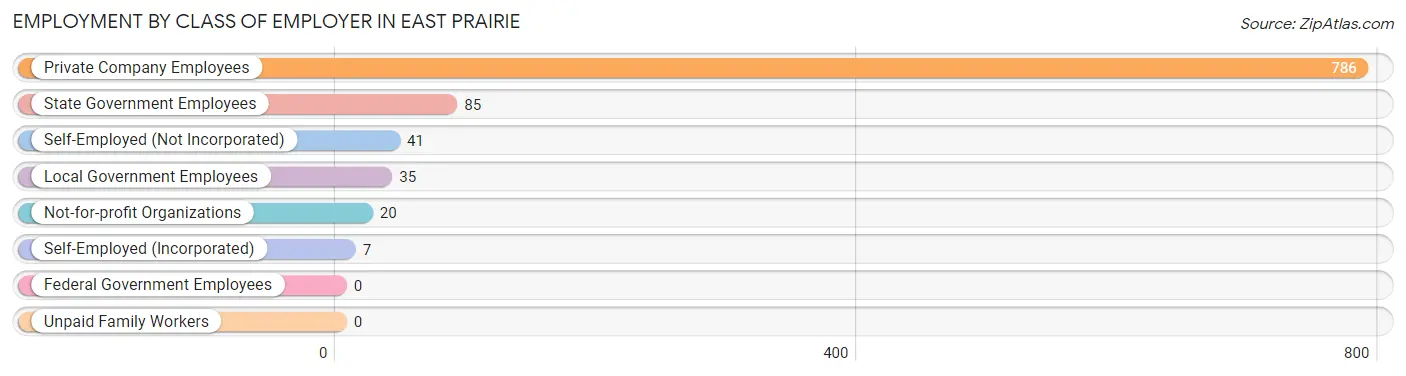
| Employer Class | # Employees | % Employees |
| Private Company Employees | 786 | 80.7% |
| Self-Employed (Incorporated) | 7 | 0.7% |
| Self-Employed (Not Incorporated) | 41 | 4.2% |
| Not-for-profit Organizations | 20 | 2.1% |
| Local Government Employees | 35 | 3.6% |
| State Government Employees | 85 | 8.7% |
| Federal Government Employees | 0 | 0.0% |
| Unpaid Family Workers | 0 | 0.0% |
| Total | 974 | 100.0% |
Employment Status by Age in East Prairie
According to the labor force statistics for East Prairie, out of the total population over 16 years of age (2,386), 45.6% or 1,088 individuals are in the labor force, with 6.0% or 65 of them unemployed. The age group with the highest labor force participation rate is 20 to 24 years, with 100.0% or 143 individuals in the labor force. Within the labor force, the 25 to 29 years age range has the highest percentage of unemployed individuals, with 27.7% or 48 of them being unemployed.
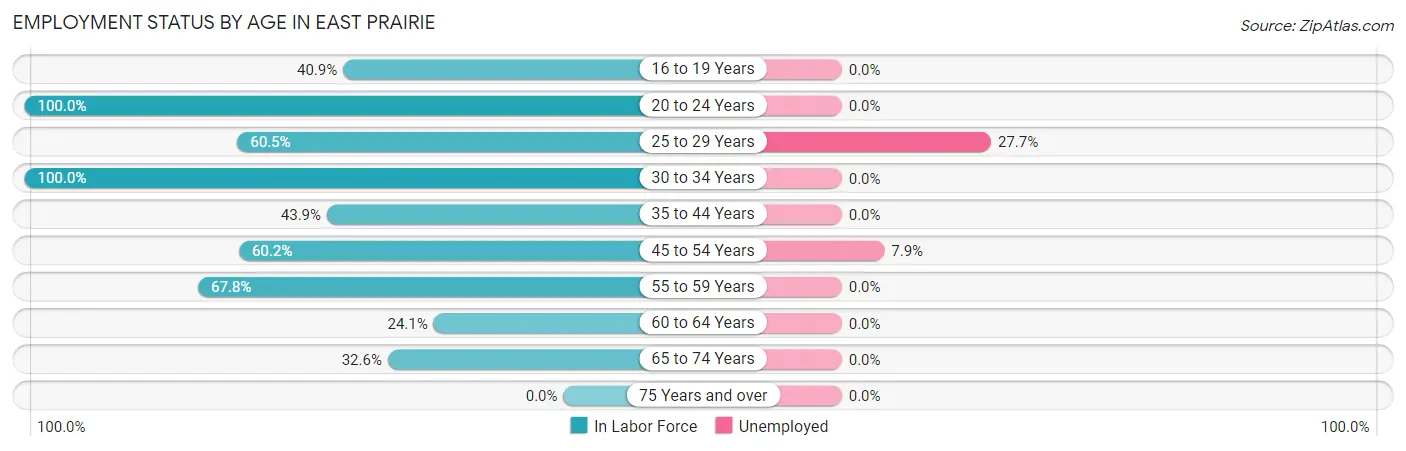
| Age Bracket | In Labor Force | Unemployed |
| 16 to 19 Years | 61 (40.9%) | 0 (0.0%) |
| 20 to 24 Years | 143 (100.0%) | 0 (0.0%) |
| 25 to 29 Years | 173 (60.5%) | 48 (27.7%) |
| 30 to 34 Years | 73 (100.0%) | 0 (0.0%) |
| 35 to 44 Years | 156 (43.9%) | 0 (0.0%) |
| 45 to 54 Years | 216 (60.2%) | 17 (7.9%) |
| 55 to 59 Years | 61 (67.8%) | 0 (0.0%) |
| 60 to 64 Years | 62 (24.1%) | 0 (0.0%) |
| 65 to 74 Years | 144 (32.6%) | 0 (0.0%) |
| 75 Years and over | 0 (0.0%) | 0 (0.0%) |
| Total | 1,088 (45.6%) | 65 (6.0%) |
Employment Status by Educational Attainment in East Prairie
According to labor force statistics for East Prairie, 52.2% of individuals (741) out of the total population between 25 and 64 years of age (1,420) are in the labor force, with 8.8% or 65 of them being unemployed. The group with the highest labor force participation rate are those with the educational attainment of bachelor's degree or higher, with 67.3% or 99 individuals in the labor force. Within the labor force, individuals with high school diploma education have the highest percentage of unemployment, with 12.8% or 48 of them being unemployed.
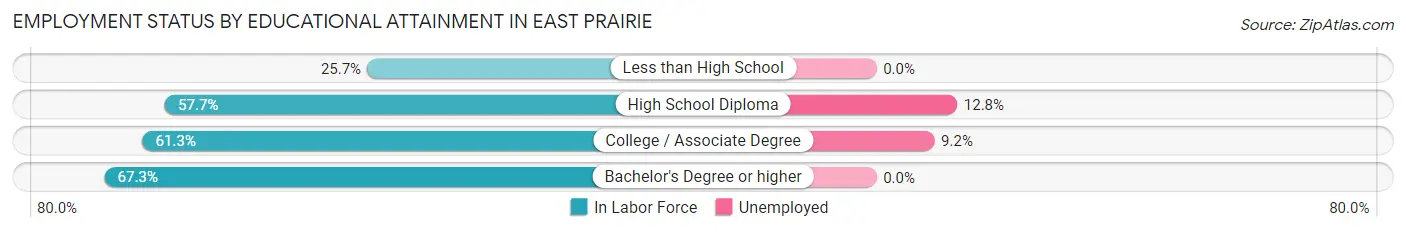
| Educational Attainment | In Labor Force | Unemployed |
| Less than High School | 83 (25.7%) | 0 (0.0%) |
| High School Diploma | 374 (57.7%) | 83 (12.8%) |
| College / Associate Degree | 185 (61.3%) | 28 (9.2%) |
| Bachelor's Degree or higher | 99 (67.3%) | 0 (0.0%) |
| Total | 741 (52.2%) | 125 (8.8%) |
Employment Occupations by Sex in East Prairie
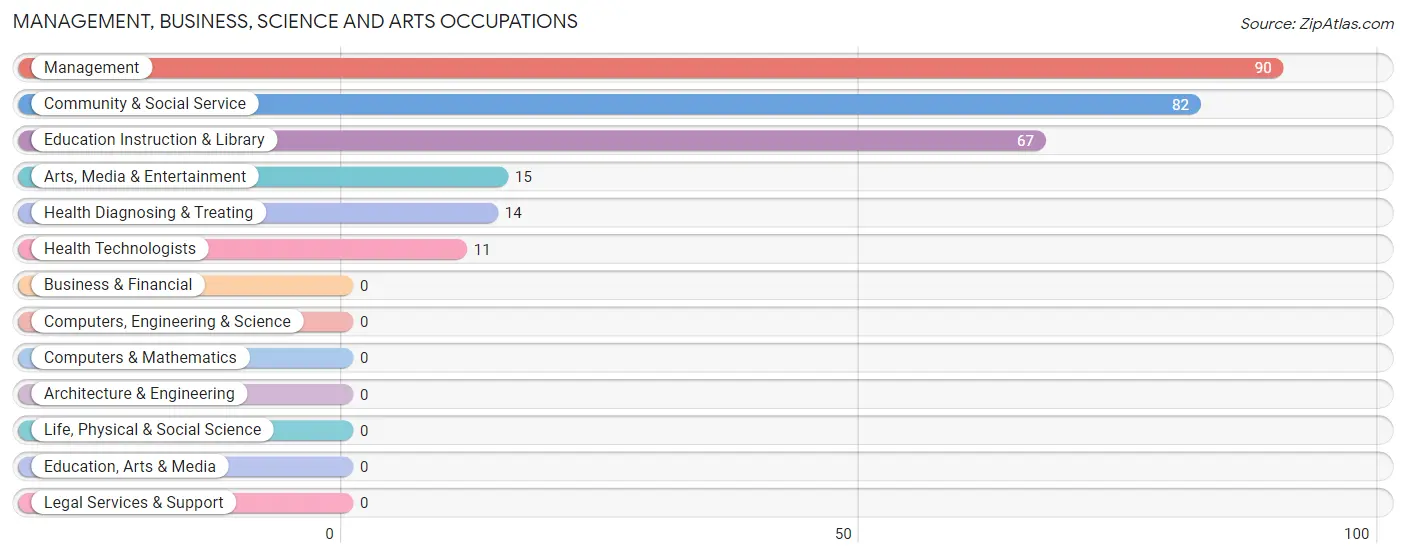
Management, Business, Science and Arts Occupations
The most common Management, Business, Science and Arts occupations in East Prairie are Management (90 | 8.8%), Community & Social Service (82 | 8.0%), Education Instruction & Library (67 | 6.5%), Arts, Media & Entertainment (15 | 1.5%), and Health Diagnosing & Treating (14 | 1.4%).
Management, Business, Science and Arts Occupations by Sex
Within the Management, Business, Science and Arts occupations in East Prairie, the most male-oriented occupations are Management (90.0%), Education Instruction & Library (40.3%), and Community & Social Service (32.9%), while the most female-oriented occupations are Arts, Media & Entertainment (100.0%), Health Technologists (100.0%), and Health Diagnosing & Treating (78.6%).
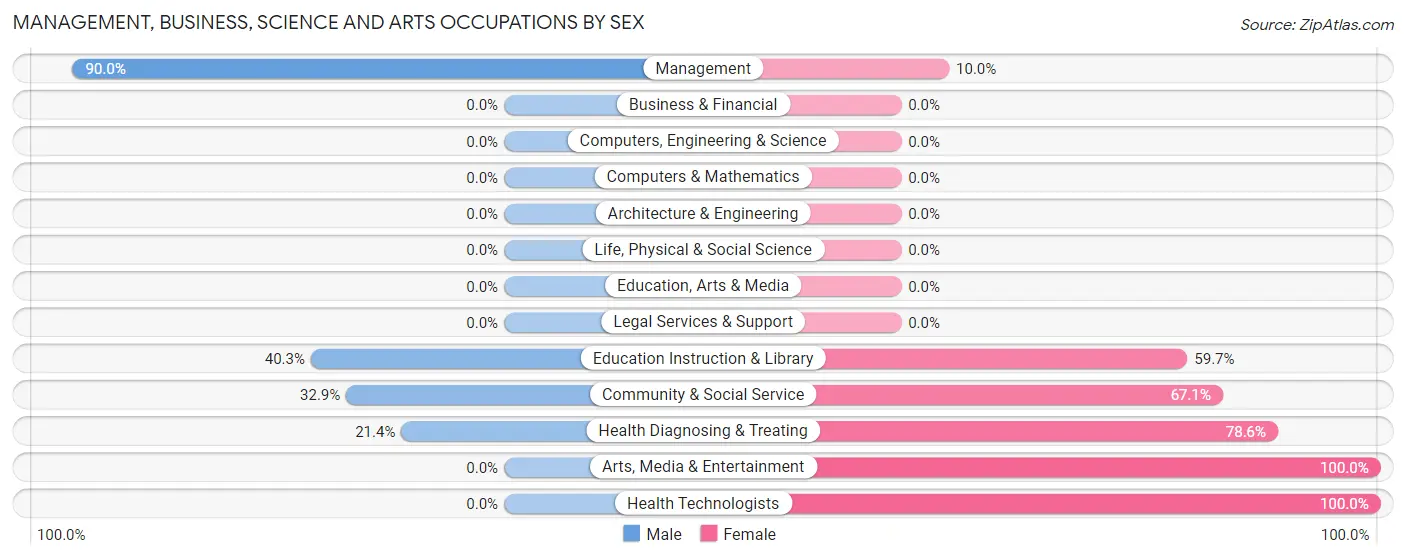
| Occupation | Male | Female |
| Management | 81 (90.0%) | 9 (10.0%) |
| Business & Financial | 0 (0.0%) | 0 (0.0%) |
| Computers, Engineering & Science | 0 (0.0%) | 0 (0.0%) |
| Computers & Mathematics | 0 (0.0%) | 0 (0.0%) |
| Architecture & Engineering | 0 (0.0%) | 0 (0.0%) |
| Life, Physical & Social Science | 0 (0.0%) | 0 (0.0%) |
| Community & Social Service | 27 (32.9%) | 55 (67.1%) |
| Education, Arts & Media | 0 (0.0%) | 0 (0.0%) |
| Legal Services & Support | 0 (0.0%) | 0 (0.0%) |
| Education Instruction & Library | 27 (40.3%) | 40 (59.7%) |
| Arts, Media & Entertainment | 0 (0.0%) | 15 (100.0%) |
| Health Diagnosing & Treating | 3 (21.4%) | 11 (78.6%) |
| Health Technologists | 0 (0.0%) | 11 (100.0%) |
| Total (Category) | 111 (59.7%) | 75 (40.3%) |
| Total (Overall) | 589 (57.5%) | 435 (42.5%) |
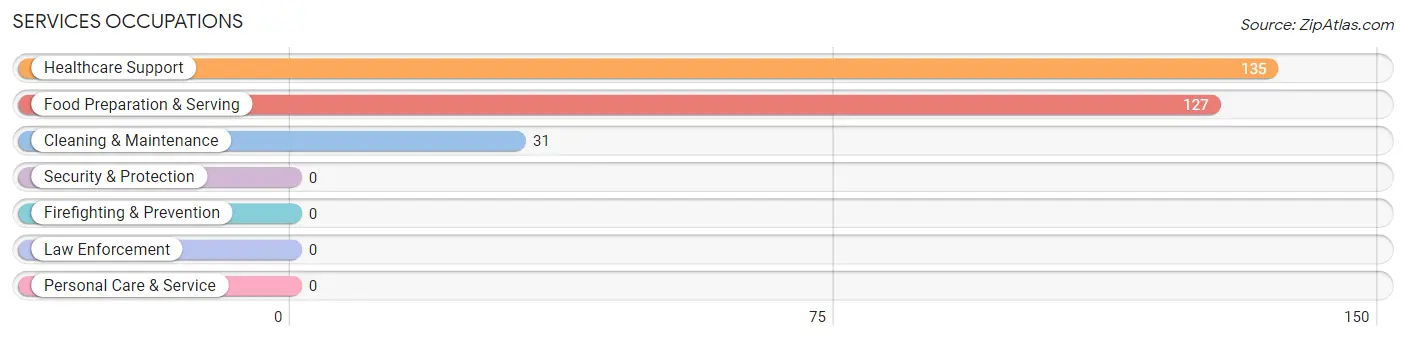
Services Occupations
The most common Services occupations in East Prairie are Healthcare Support (135 | 13.2%), Food Preparation & Serving (127 | 12.4%), and Cleaning & Maintenance (31 | 3.0%).
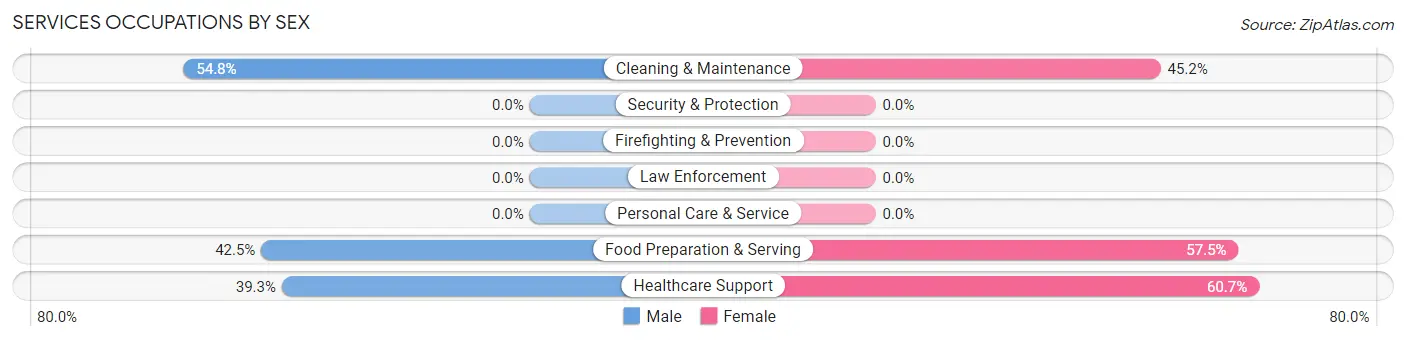
Services Occupations by Sex
Within the Services occupations in East Prairie, the most male-oriented occupations are Cleaning & Maintenance (54.8%), Food Preparation & Serving (42.5%), and Healthcare Support (39.3%), while the most female-oriented occupations are Healthcare Support (60.7%), Food Preparation & Serving (57.5%), and Cleaning & Maintenance (45.2%).
| Occupation | Male | Female |
| Healthcare Support | 53 (39.3%) | 82 (60.7%) |
| Security & Protection | 0 (0.0%) | 0 (0.0%) |
| Firefighting & Prevention | 0 (0.0%) | 0 (0.0%) |
| Law Enforcement | 0 (0.0%) | 0 (0.0%) |
| Food Preparation & Serving | 54 (42.5%) | 73 (57.5%) |
| Cleaning & Maintenance | 17 (54.8%) | 14 (45.2%) |
| Personal Care & Service | 0 (0.0%) | 0 (0.0%) |
| Total (Category) | 124 (42.3%) | 169 (57.7%) |
| Total (Overall) | 589 (57.5%) | 435 (42.5%) |
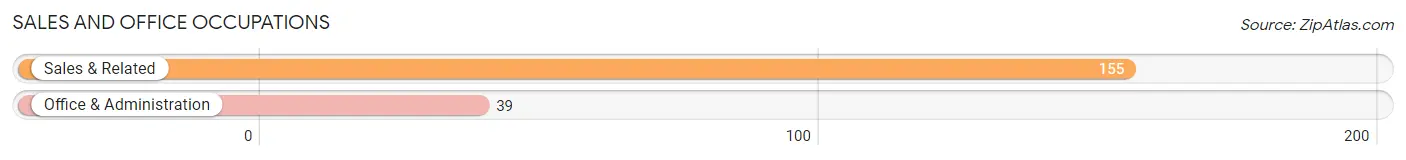
Sales and Office Occupations
The most common Sales and Office occupations in East Prairie are Sales & Related (155 | 15.1%), and Office & Administration (39 | 3.8%).
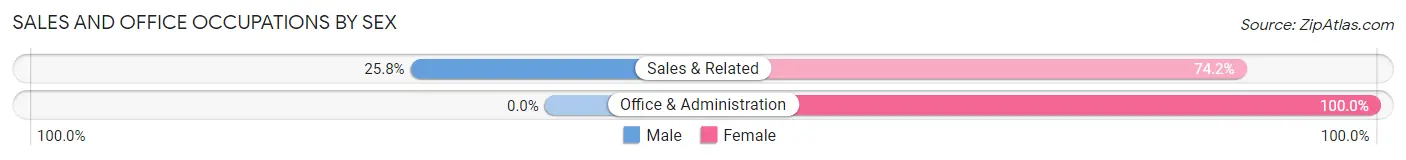
Sales and Office Occupations by Sex
| Occupation | Male | Female |
| Sales & Related | 40 (25.8%) | 115 (74.2%) |
| Office & Administration | 0 (0.0%) | 39 (100.0%) |
| Total (Category) | 40 (20.6%) | 154 (79.4%) |
| Total (Overall) | 589 (57.5%) | 435 (42.5%) |
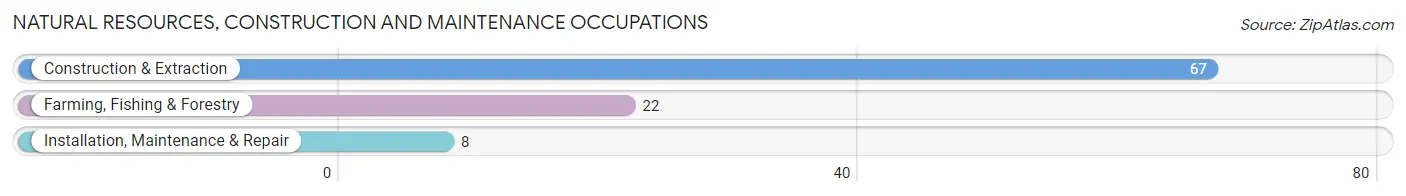
Natural Resources, Construction and Maintenance Occupations
The most common Natural Resources, Construction and Maintenance occupations in East Prairie are Construction & Extraction (67 | 6.5%), Farming, Fishing & Forestry (22 | 2.1%), and Installation, Maintenance & Repair (8 | 0.8%).
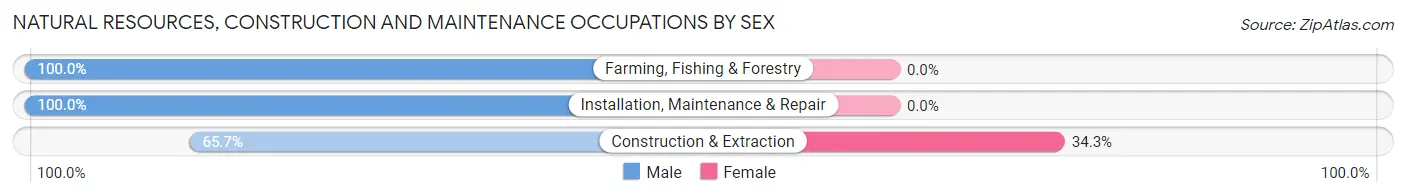
Natural Resources, Construction and Maintenance Occupations by Sex
| Occupation | Male | Female |
| Farming, Fishing & Forestry | 22 (100.0%) | 0 (0.0%) |
| Construction & Extraction | 44 (65.7%) | 23 (34.3%) |
| Installation, Maintenance & Repair | 8 (100.0%) | 0 (0.0%) |
| Total (Category) | 74 (76.3%) | 23 (23.7%) |
| Total (Overall) | 589 (57.5%) | 435 (42.5%) |
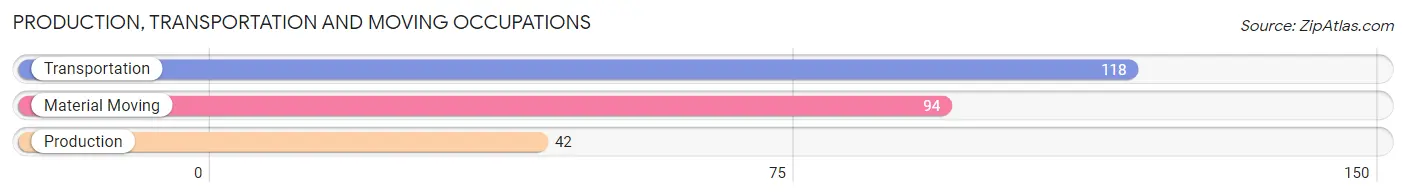
Production, Transportation and Moving Occupations
The most common Production, Transportation and Moving occupations in East Prairie are Transportation (118 | 11.5%), Material Moving (94 | 9.2%), and Production (42 | 4.1%).
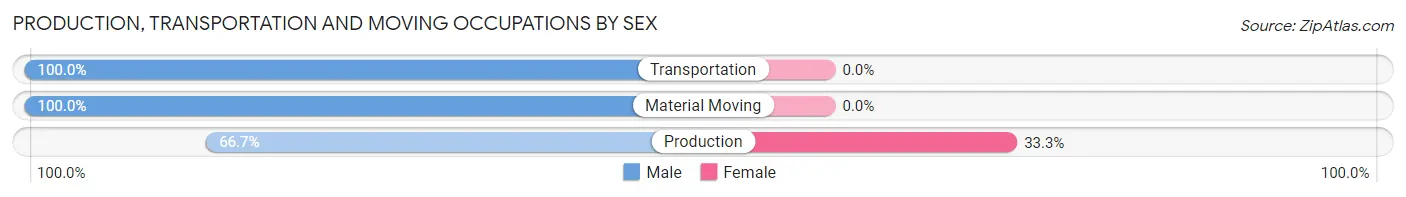
Production, Transportation and Moving Occupations by Sex
| Occupation | Male | Female |
| Production | 28 (66.7%) | 14 (33.3%) |
| Transportation | 118 (100.0%) | 0 (0.0%) |
| Material Moving | 94 (100.0%) | 0 (0.0%) |
| Total (Category) | 240 (94.5%) | 14 (5.5%) |
| Total (Overall) | 589 (57.5%) | 435 (42.5%) |
Employment Industries by Sex in East Prairie
Employment Industries in East Prairie
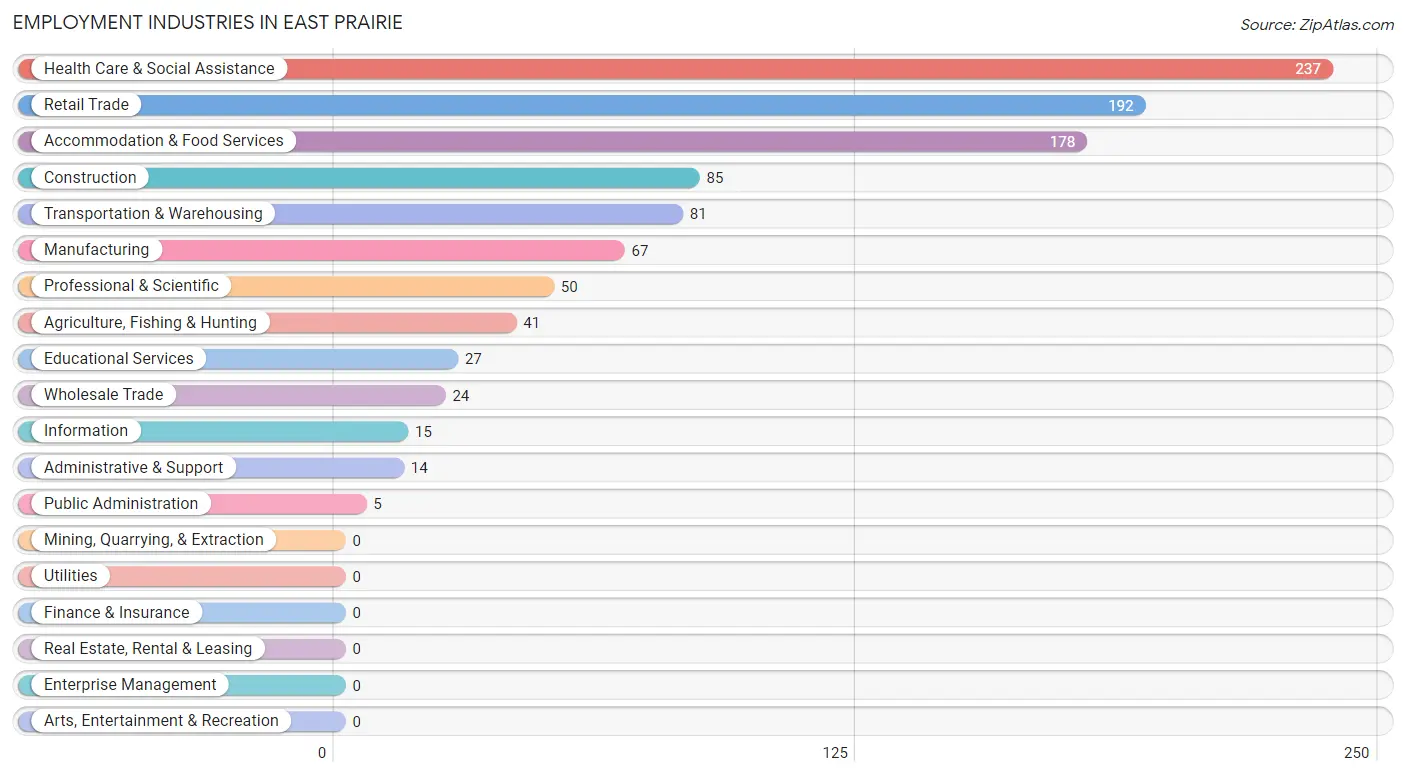
The major employment industries in East Prairie include Health Care & Social Assistance (237 | 23.1%), Retail Trade (192 | 18.8%), Accommodation & Food Services (178 | 17.4%), Construction (85 | 8.3%), and Transportation & Warehousing (81 | 7.9%).
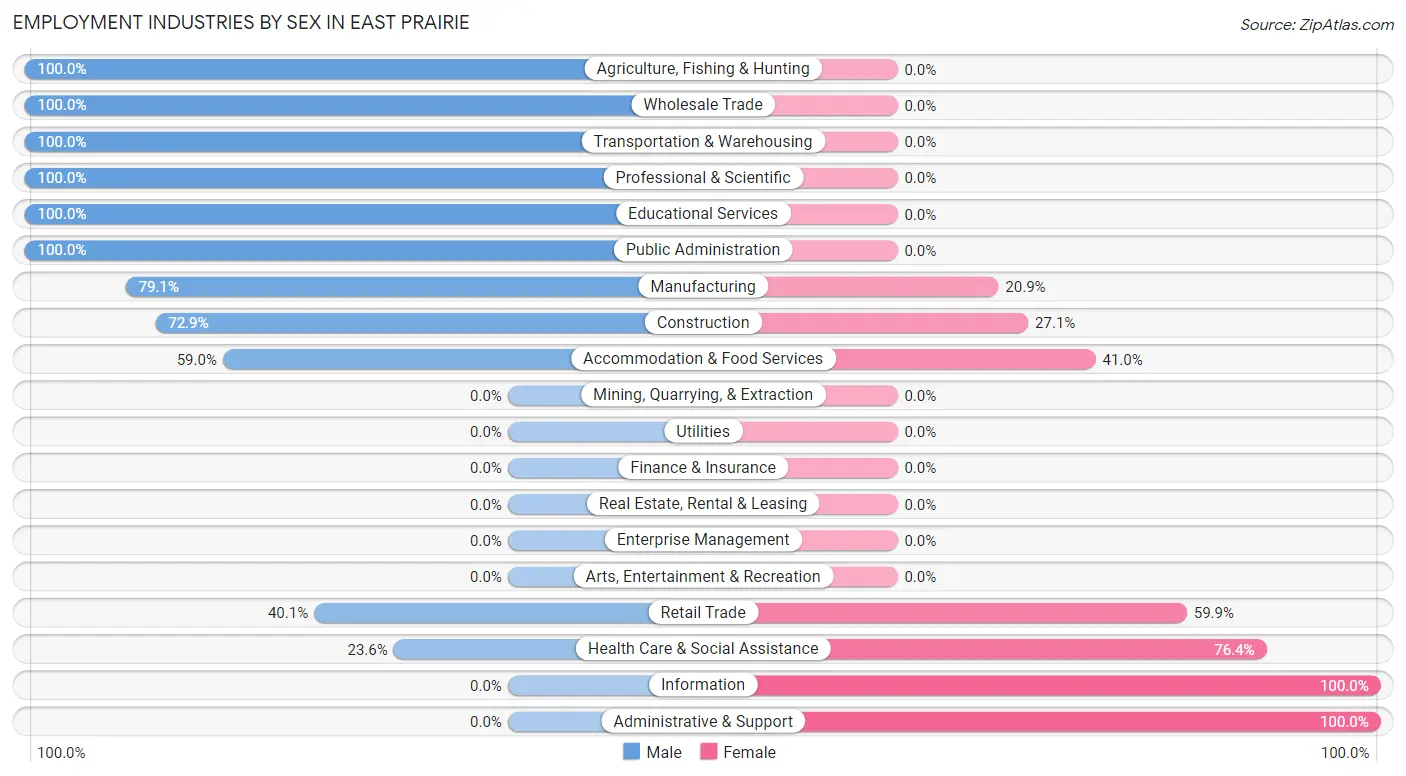
Employment Industries by Sex in East Prairie
The East Prairie industries that see more men than women are Agriculture, Fishing & Hunting (100.0%), Wholesale Trade (100.0%), and Transportation & Warehousing (100.0%), whereas the industries that tend to have a higher number of women are Information (100.0%), Administrative & Support (100.0%), and Health Care & Social Assistance (76.4%).
| Industry | Male | Female |
| Agriculture, Fishing & Hunting | 41 (100.0%) | 0 (0.0%) |
| Mining, Quarrying, & Extraction | 0 (0.0%) | 0 (0.0%) |
| Construction | 62 (72.9%) | 23 (27.1%) |
| Manufacturing | 53 (79.1%) | 14 (20.9%) |
| Wholesale Trade | 24 (100.0%) | 0 (0.0%) |
| Retail Trade | 77 (40.1%) | 115 (59.9%) |
| Transportation & Warehousing | 81 (100.0%) | 0 (0.0%) |
| Utilities | 0 (0.0%) | 0 (0.0%) |
| Information | 0 (0.0%) | 15 (100.0%) |
| Finance & Insurance | 0 (0.0%) | 0 (0.0%) |
| Real Estate, Rental & Leasing | 0 (0.0%) | 0 (0.0%) |
| Professional & Scientific | 50 (100.0%) | 0 (0.0%) |
| Enterprise Management | 0 (0.0%) | 0 (0.0%) |
| Administrative & Support | 0 (0.0%) | 14 (100.0%) |
| Educational Services | 27 (100.0%) | 0 (0.0%) |
| Health Care & Social Assistance | 56 (23.6%) | 181 (76.4%) |
| Arts, Entertainment & Recreation | 0 (0.0%) | 0 (0.0%) |
| Accommodation & Food Services | 105 (59.0%) | 73 (41.0%) |
| Public Administration | 5 (100.0%) | 0 (0.0%) |
| Total | 589 (57.5%) | 435 (42.5%) |
Education in East Prairie
School Enrollment in East Prairie
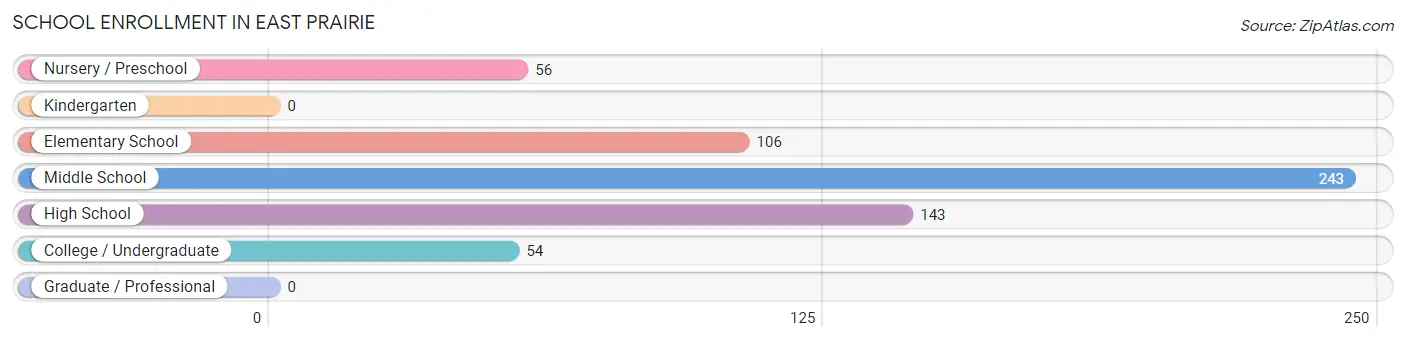
The most common levels of schooling among the 602 students in East Prairie are middle school (243 | 40.4%), high school (143 | 23.7%), and elementary school (106 | 17.6%).
| School Level | # Students | % Students |
| Nursery / Preschool | 56 | 9.3% |
| Kindergarten | 0 | 0.0% |
| Elementary School | 106 | 17.6% |
| Middle School | 243 | 40.4% |
| High School | 143 | 23.7% |
| College / Undergraduate | 54 | 9.0% |
| Graduate / Professional | 0 | 0.0% |
| Total | 602 | 100.0% |
School Enrollment by Age by Funding Source in East Prairie
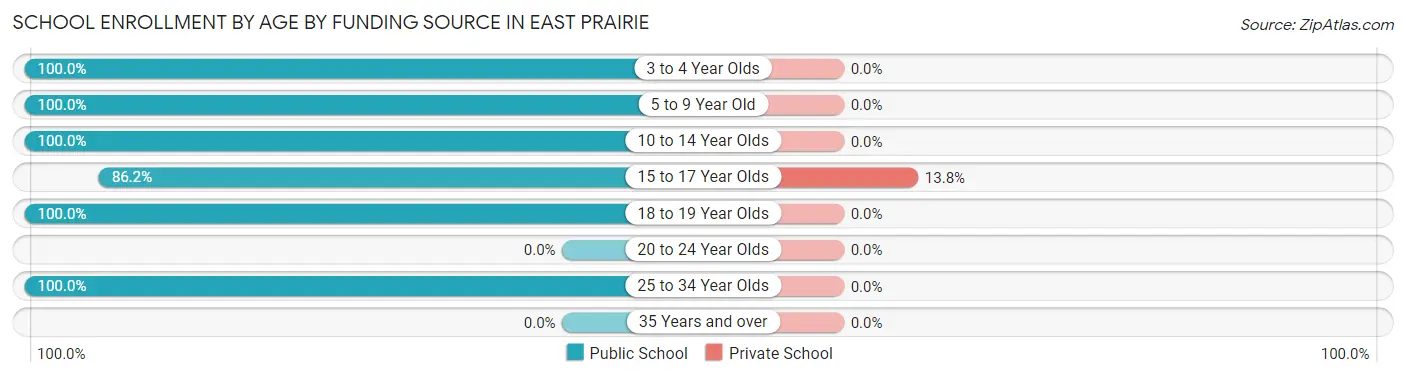
Out of a total of 602 students who are enrolled in schools in East Prairie, 13 (2.2%) attend a private institution, while the remaining 589 (97.8%) are enrolled in public schools. The age group of 15 to 17 year olds has the highest likelihood of being enrolled in private schools, with 13 (13.8% in the age bracket) enrolled. Conversely, the age group of 3 to 4 year olds has the lowest likelihood of being enrolled in a private school, with 56 (100.0% in the age bracket) attending a public institution.
| Age Bracket | Public School | Private School |
| 3 to 4 Year Olds | 56 (100.0%) | 0 (0.0%) |
| 5 to 9 Year Old | 106 (100.0%) | 0 (0.0%) |
| 10 to 14 Year Olds | 254 (100.0%) | 0 (0.0%) |
| 15 to 17 Year Olds | 81 (86.2%) | 13 (13.8%) |
| 18 to 19 Year Olds | 38 (100.0%) | 0 (0.0%) |
| 20 to 24 Year Olds | 0 (0.0%) | 0 (0.0%) |
| 25 to 34 Year Olds | 54 (100.0%) | 0 (0.0%) |
| 35 Years and over | 0 (0.0%) | 0 (0.0%) |
| Total | 589 (97.8%) | 13 (2.2%) |
Educational Attainment by Field of Study in East Prairie
Arts & humanities (73 | 36.9%), psychology (70 | 35.3%), education (18 | 9.1%), business (15 | 7.6%), and literature & languages (15 | 7.6%) are the most common fields of study among 198 individuals in East Prairie who have obtained a bachelor's degree or higher.
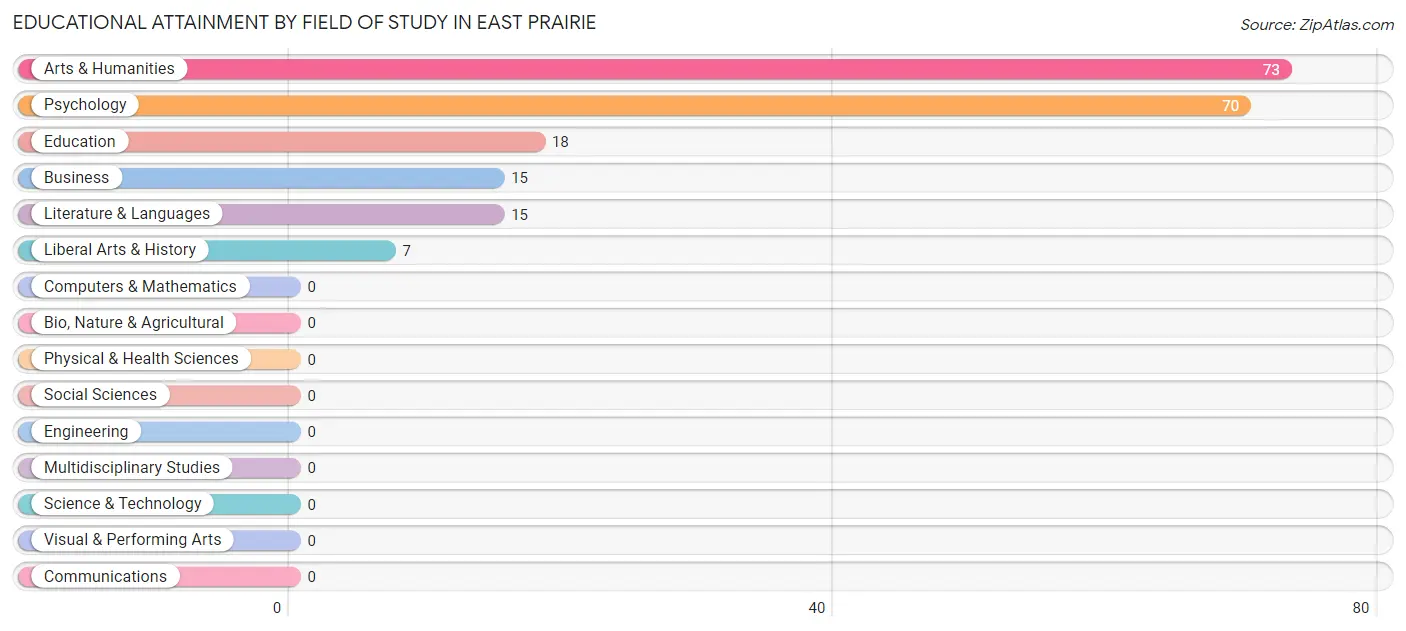
| Field of Study | # Graduates | % Graduates |
| Computers & Mathematics | 0 | 0.0% |
| Bio, Nature & Agricultural | 0 | 0.0% |
| Physical & Health Sciences | 0 | 0.0% |
| Psychology | 70 | 35.3% |
| Social Sciences | 0 | 0.0% |
| Engineering | 0 | 0.0% |
| Multidisciplinary Studies | 0 | 0.0% |
| Science & Technology | 0 | 0.0% |
| Business | 15 | 7.6% |
| Education | 18 | 9.1% |
| Literature & Languages | 15 | 7.6% |
| Liberal Arts & History | 7 | 3.5% |
| Visual & Performing Arts | 0 | 0.0% |
| Communications | 0 | 0.0% |
| Arts & Humanities | 73 | 36.9% |
| Total | 198 | 100.0% |
Transportation & Commute in East Prairie
Vehicle Availability by Sex in East Prairie
The most prevalent vehicle ownership categories in East Prairie are males with 3 vehicles (257, accounting for 47.7%) and females with 3 vehicles (46, making up 59.1%).
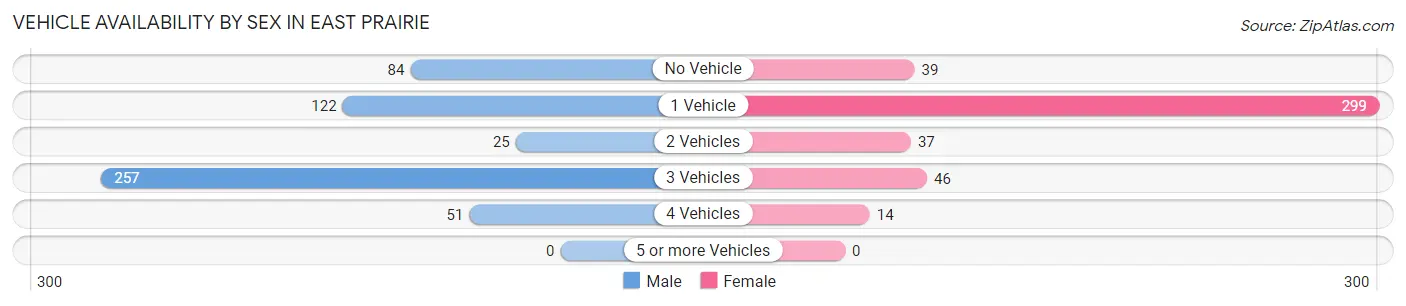
| Vehicles Available | Male | Female |
| No Vehicle | 84 (15.6%) | 39 (9.0%) |
| 1 Vehicle | 122 (22.6%) | 299 (68.7%) |
| 2 Vehicles | 25 (4.6%) | 37 (8.5%) |
| 3 Vehicles | 257 (47.7%) | 46 (10.6%) |
| 4 Vehicles | 51 (9.5%) | 14 (3.2%) |
| 5 or more Vehicles | 0 (0.0%) | 0 (0.0%) |
| Total | 539 (100.0%) | 435 (100.0%) |
Commute Time in East Prairie
The most frequently occuring commute durations in East Prairie are 5 to 9 minutes (251 commuters, 27.3%), 15 to 19 minutes (234 commuters, 25.5%), and 30 to 34 minutes (224 commuters, 24.4%).
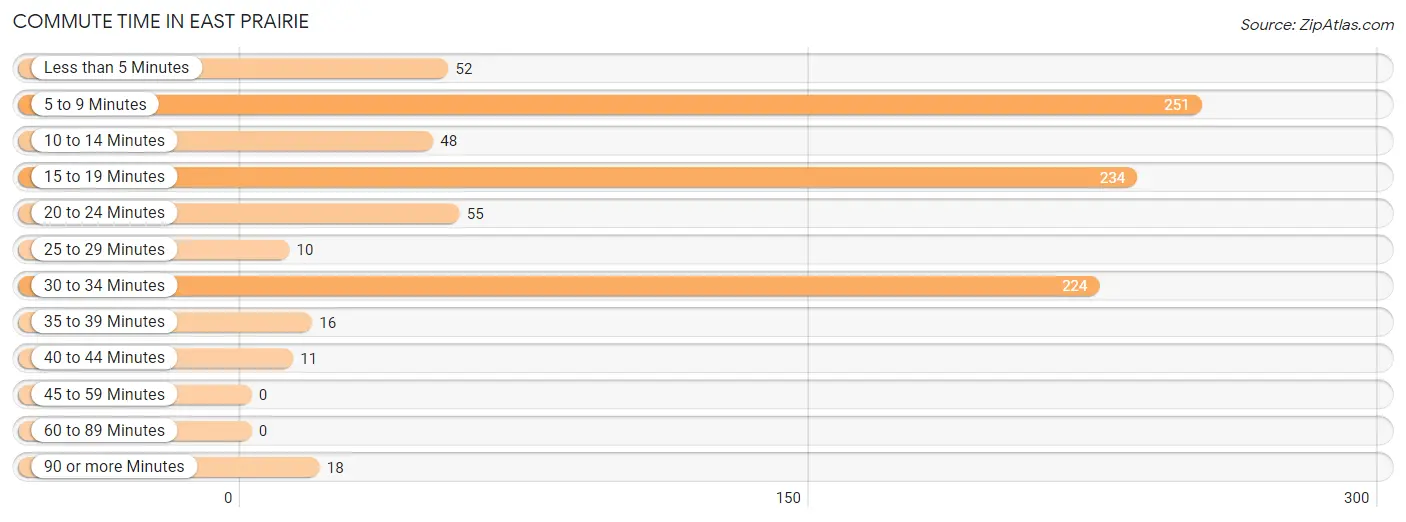
| Commute Time | # Commuters | % Commuters |
| Less than 5 Minutes | 52 | 5.7% |
| 5 to 9 Minutes | 251 | 27.3% |
| 10 to 14 Minutes | 48 | 5.2% |
| 15 to 19 Minutes | 234 | 25.5% |
| 20 to 24 Minutes | 55 | 6.0% |
| 25 to 29 Minutes | 10 | 1.1% |
| 30 to 34 Minutes | 224 | 24.4% |
| 35 to 39 Minutes | 16 | 1.7% |
| 40 to 44 Minutes | 11 | 1.2% |
| 45 to 59 Minutes | 0 | 0.0% |
| 60 to 89 Minutes | 0 | 0.0% |
| 90 or more Minutes | 18 | 2.0% |
Commute Time by Sex in East Prairie
The most common commute times in East Prairie are 30 to 34 minutes (178 commuters, 33.0%) for males and 5 to 9 minutes (139 commuters, 36.6%) for females.
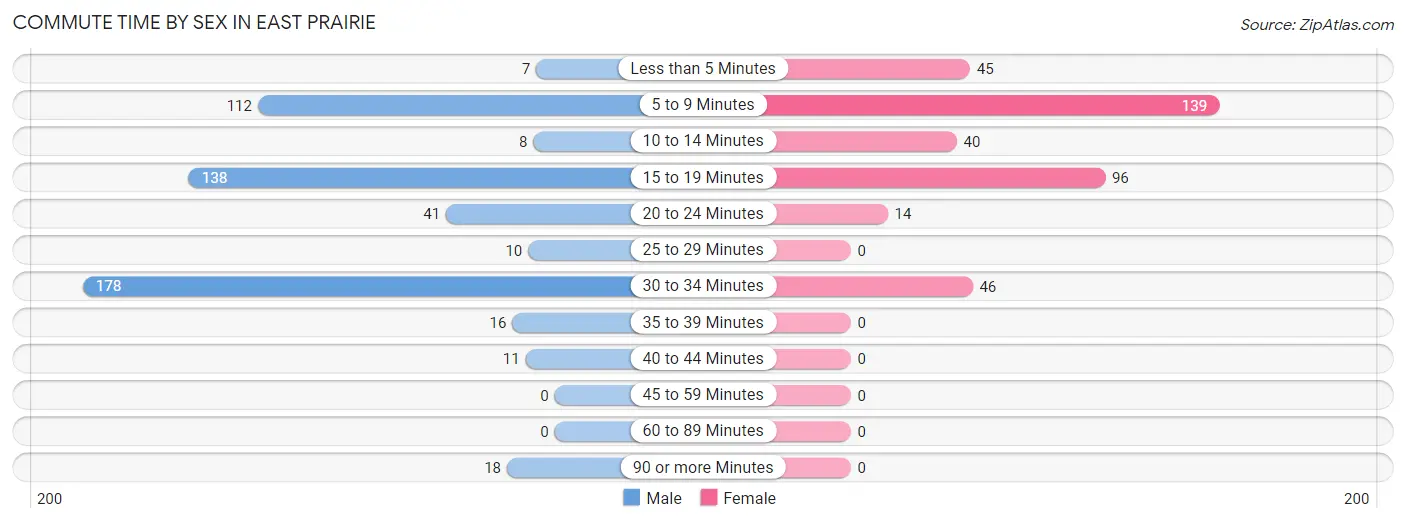
| Commute Time | Male | Female |
| Less than 5 Minutes | 7 (1.3%) | 45 (11.8%) |
| 5 to 9 Minutes | 112 (20.8%) | 139 (36.6%) |
| 10 to 14 Minutes | 8 (1.5%) | 40 (10.5%) |
| 15 to 19 Minutes | 138 (25.6%) | 96 (25.3%) |
| 20 to 24 Minutes | 41 (7.6%) | 14 (3.7%) |
| 25 to 29 Minutes | 10 (1.9%) | 0 (0.0%) |
| 30 to 34 Minutes | 178 (33.0%) | 46 (12.1%) |
| 35 to 39 Minutes | 16 (3.0%) | 0 (0.0%) |
| 40 to 44 Minutes | 11 (2.0%) | 0 (0.0%) |
| 45 to 59 Minutes | 0 (0.0%) | 0 (0.0%) |
| 60 to 89 Minutes | 0 (0.0%) | 0 (0.0%) |
| 90 or more Minutes | 18 (3.3%) | 0 (0.0%) |
Time of Departure to Work by Sex in East Prairie
The most frequent times of departure to work in East Prairie are 12:00 PM to 3:59 PM (112, 20.8%) for males and 7:30 AM to 7:59 AM (182, 47.9%) for females.
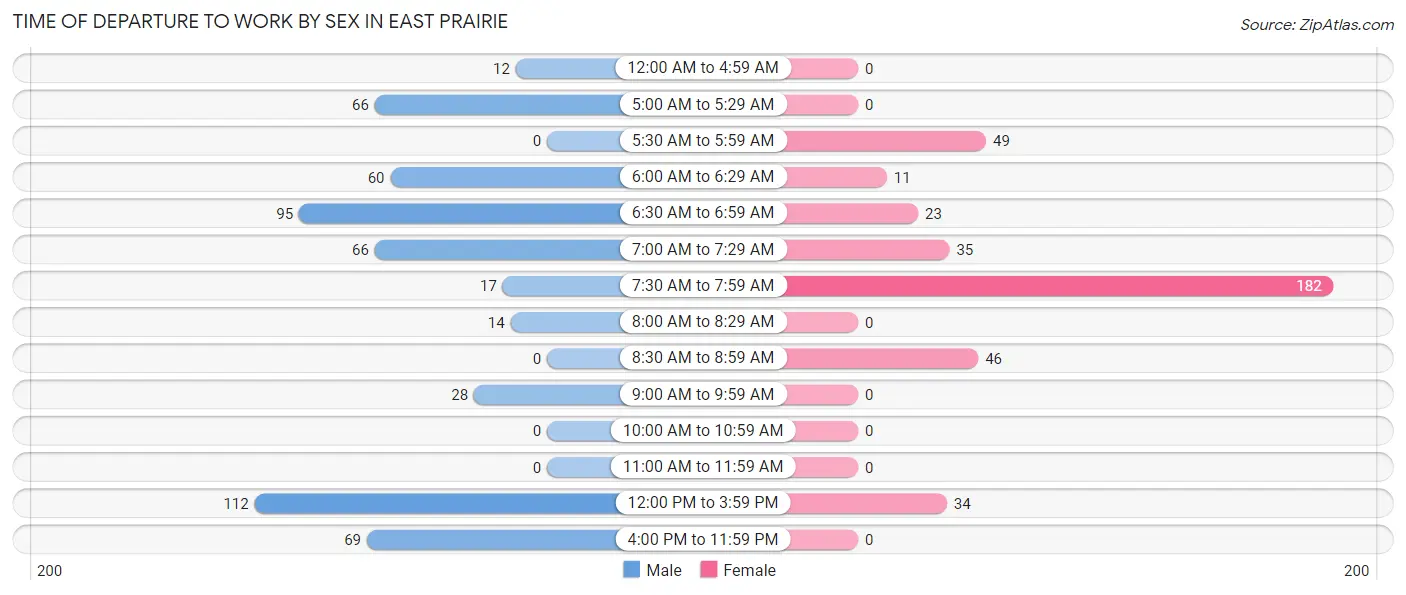
| Time of Departure | Male | Female |
| 12:00 AM to 4:59 AM | 12 (2.2%) | 0 (0.0%) |
| 5:00 AM to 5:29 AM | 66 (12.2%) | 0 (0.0%) |
| 5:30 AM to 5:59 AM | 0 (0.0%) | 49 (12.9%) |
| 6:00 AM to 6:29 AM | 60 (11.1%) | 11 (2.9%) |
| 6:30 AM to 6:59 AM | 95 (17.6%) | 23 (6.0%) |
| 7:00 AM to 7:29 AM | 66 (12.2%) | 35 (9.2%) |
| 7:30 AM to 7:59 AM | 17 (3.2%) | 182 (47.9%) |
| 8:00 AM to 8:29 AM | 14 (2.6%) | 0 (0.0%) |
| 8:30 AM to 8:59 AM | 0 (0.0%) | 46 (12.1%) |
| 9:00 AM to 9:59 AM | 28 (5.2%) | 0 (0.0%) |
| 10:00 AM to 10:59 AM | 0 (0.0%) | 0 (0.0%) |
| 11:00 AM to 11:59 AM | 0 (0.0%) | 0 (0.0%) |
| 12:00 PM to 3:59 PM | 112 (20.8%) | 34 (8.9%) |
| 4:00 PM to 11:59 PM | 69 (12.8%) | 0 (0.0%) |
| Total | 539 (100.0%) | 380 (100.0%) |
Housing Occupancy in East Prairie
Occupancy by Ownership in East Prairie
Of the total 1,386 dwellings in East Prairie, owner-occupied units account for 605 (43.6%), while renter-occupied units make up 781 (56.4%).
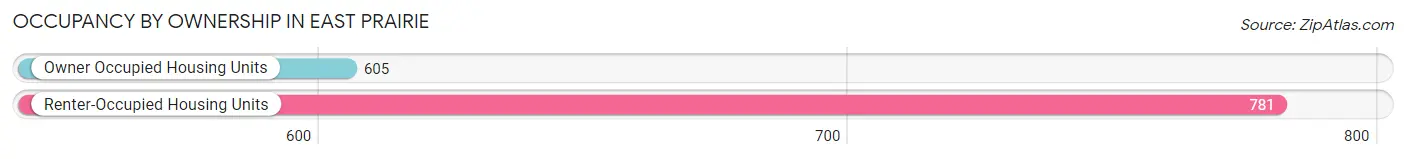
| Occupancy | # Housing Units | % Housing Units |
| Owner Occupied Housing Units | 605 | 43.6% |
| Renter-Occupied Housing Units | 781 | 56.4% |
| Total Occupied Housing Units | 1,386 | 100.0% |
Occupancy by Household Size in East Prairie
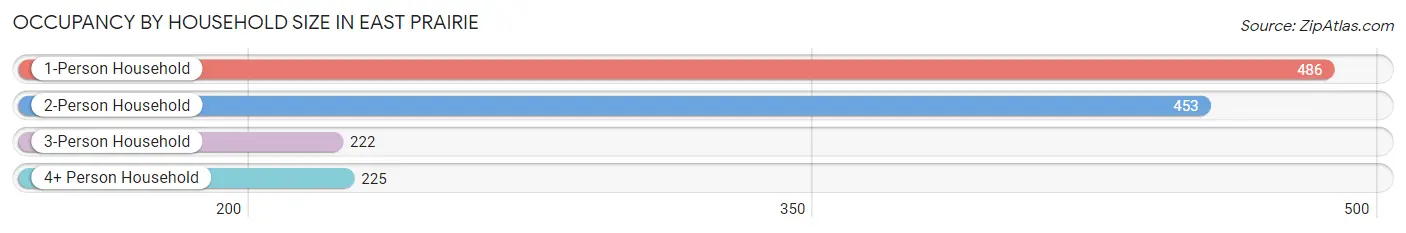
| Household Size | # Housing Units | % Housing Units |
| 1-Person Household | 486 | 35.1% |
| 2-Person Household | 453 | 32.7% |
| 3-Person Household | 222 | 16.0% |
| 4+ Person Household | 225 | 16.2% |
| Total Housing Units | 1,386 | 100.0% |
Occupancy by Ownership by Household Size in East Prairie
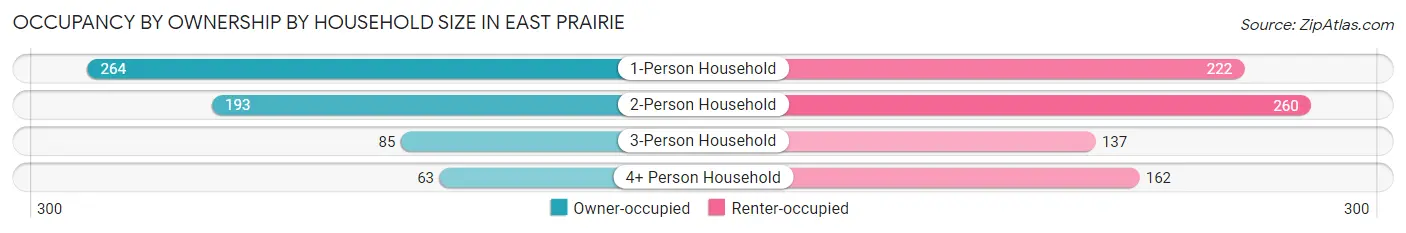
| Household Size | Owner-occupied | Renter-occupied |
| 1-Person Household | 264 (54.3%) | 222 (45.7%) |
| 2-Person Household | 193 (42.6%) | 260 (57.4%) |
| 3-Person Household | 85 (38.3%) | 137 (61.7%) |
| 4+ Person Household | 63 (28.0%) | 162 (72.0%) |
| Total Housing Units | 605 (43.6%) | 781 (56.4%) |
Occupancy by Educational Attainment in East Prairie
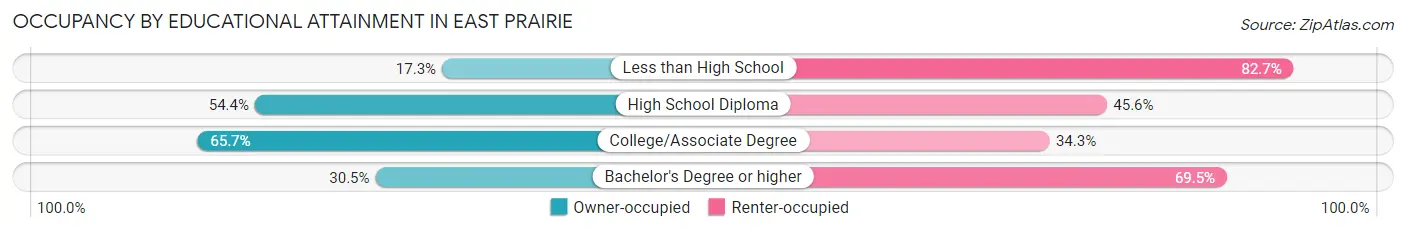
| Household Size | Owner-occupied | Renter-occupied |
| Less than High School | 63 (17.3%) | 302 (82.7%) |
| High School Diploma | 324 (54.4%) | 272 (45.6%) |
| College/Associate Degree | 165 (65.7%) | 86 (34.3%) |
| Bachelor's Degree or higher | 53 (30.5%) | 121 (69.5%) |
Occupancy by Age of Householder in East Prairie
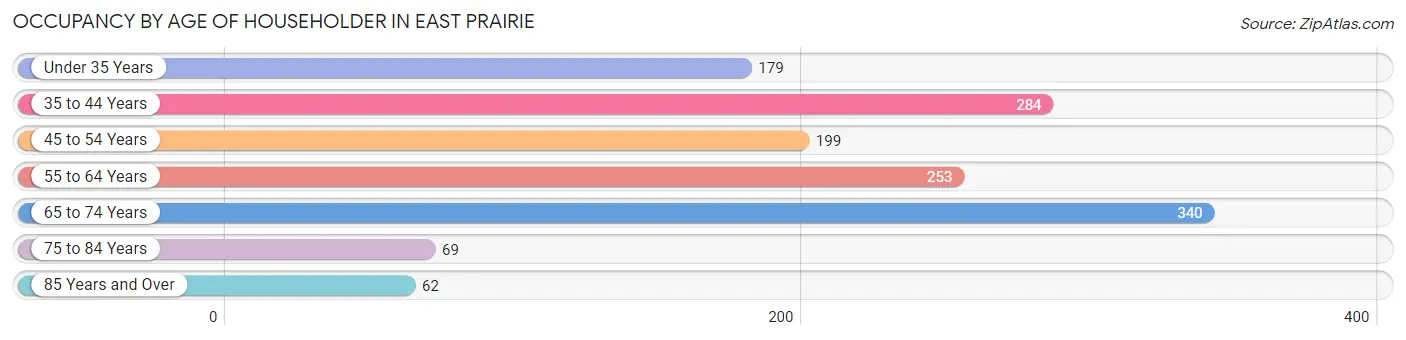
| Age Bracket | # Households | % Households |
| Under 35 Years | 179 | 12.9% |
| 35 to 44 Years | 284 | 20.5% |
| 45 to 54 Years | 199 | 14.4% |
| 55 to 64 Years | 253 | 18.2% |
| 65 to 74 Years | 340 | 24.5% |
| 75 to 84 Years | 69 | 5.0% |
| 85 Years and Over | 62 | 4.5% |
| Total | 1,386 | 100.0% |
Housing Finances in East Prairie
Median Income by Occupancy in East Prairie
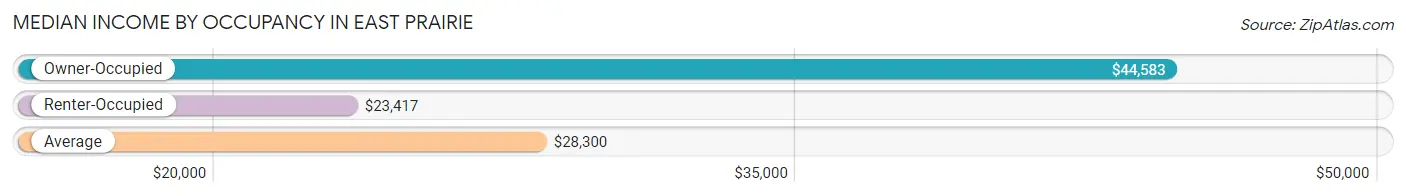
| Occupancy Type | # Households | Median Income |
| Owner-Occupied | 605 (43.6%) | $44,583 |
| Renter-Occupied | 781 (56.4%) | $23,417 |
| Average | 1,386 (100.0%) | $28,300 |
Occupancy by Householder Income Bracket in East Prairie
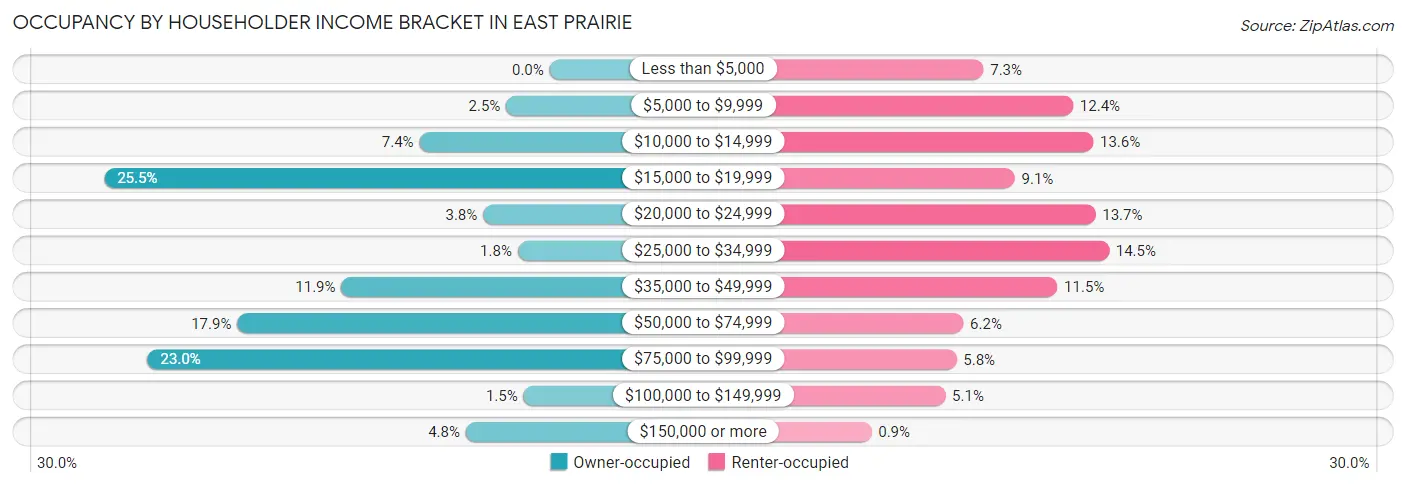
| Income Bracket | Owner-occupied | Renter-occupied |
| Less than $5,000 | 0 (0.0%) | 57 (7.3%) |
| $5,000 to $9,999 | 15 (2.5%) | 97 (12.4%) |
| $10,000 to $14,999 | 45 (7.4%) | 106 (13.6%) |
| $15,000 to $19,999 | 154 (25.5%) | 71 (9.1%) |
| $20,000 to $24,999 | 23 (3.8%) | 107 (13.7%) |
| $25,000 to $34,999 | 11 (1.8%) | 113 (14.5%) |
| $35,000 to $49,999 | 72 (11.9%) | 90 (11.5%) |
| $50,000 to $74,999 | 108 (17.8%) | 48 (6.1%) |
| $75,000 to $99,999 | 139 (23.0%) | 45 (5.8%) |
| $100,000 to $149,999 | 9 (1.5%) | 40 (5.1%) |
| $150,000 or more | 29 (4.8%) | 7 (0.9%) |
| Total | 605 (100.0%) | 781 (100.0%) |
Monthly Housing Cost Tiers in East Prairie
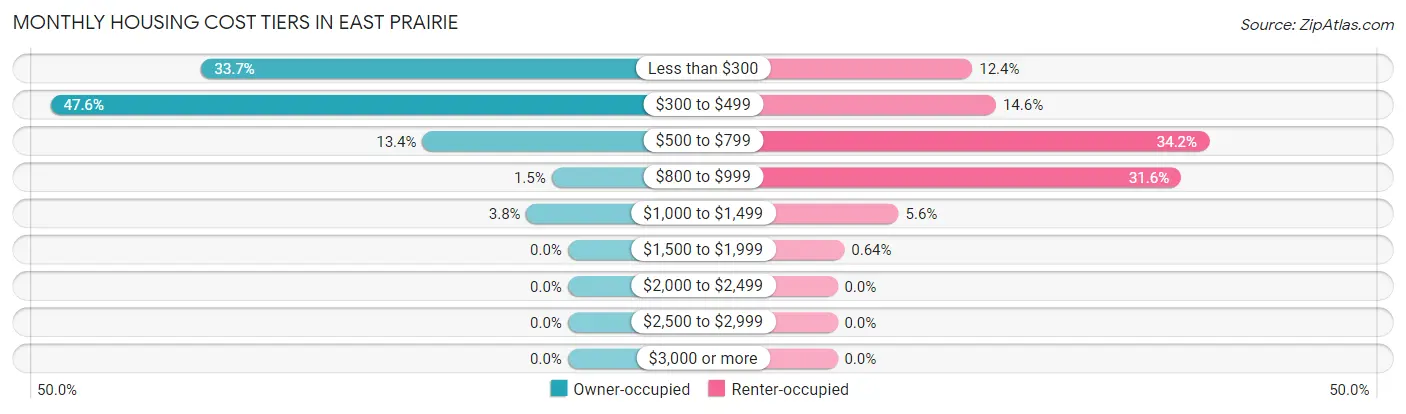
| Monthly Cost | Owner-occupied | Renter-occupied |
| Less than $300 | 204 (33.7%) | 97 (12.4%) |
| $300 to $499 | 288 (47.6%) | 114 (14.6%) |
| $500 to $799 | 81 (13.4%) | 267 (34.2%) |
| $800 to $999 | 9 (1.5%) | 247 (31.6%) |
| $1,000 to $1,499 | 23 (3.8%) | 44 (5.6%) |
| $1,500 to $1,999 | 0 (0.0%) | 5 (0.6%) |
| $2,000 to $2,499 | 0 (0.0%) | 0 (0.0%) |
| $2,500 to $2,999 | 0 (0.0%) | 0 (0.0%) |
| $3,000 or more | 0 (0.0%) | 0 (0.0%) |
| Total | 605 (100.0%) | 781 (100.0%) |
Physical Housing Characteristics in East Prairie
Housing Structures in East Prairie
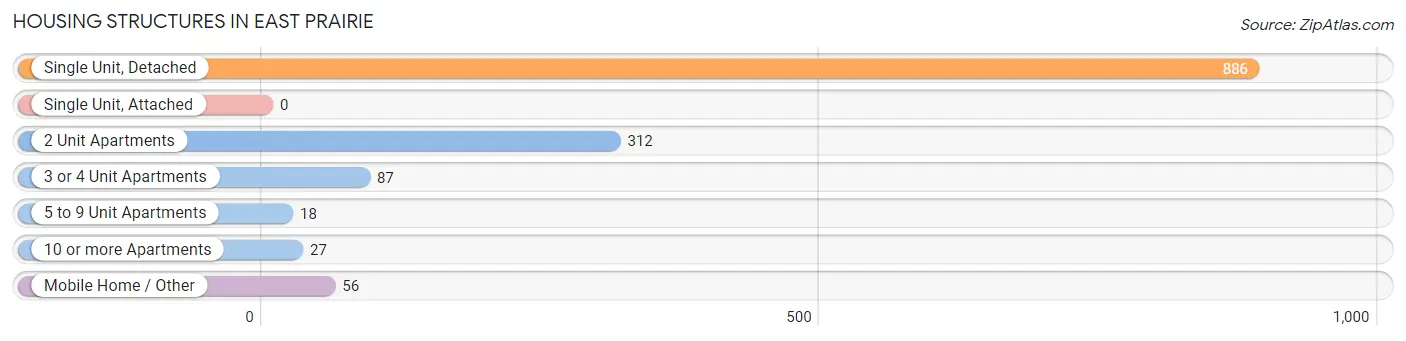
| Structure Type | # Housing Units | % Housing Units |
| Single Unit, Detached | 886 | 63.9% |
| Single Unit, Attached | 0 | 0.0% |
| 2 Unit Apartments | 312 | 22.5% |
| 3 or 4 Unit Apartments | 87 | 6.3% |
| 5 to 9 Unit Apartments | 18 | 1.3% |
| 10 or more Apartments | 27 | 1.9% |
| Mobile Home / Other | 56 | 4.0% |
| Total | 1,386 | 100.0% |
Housing Structures by Occupancy in East Prairie
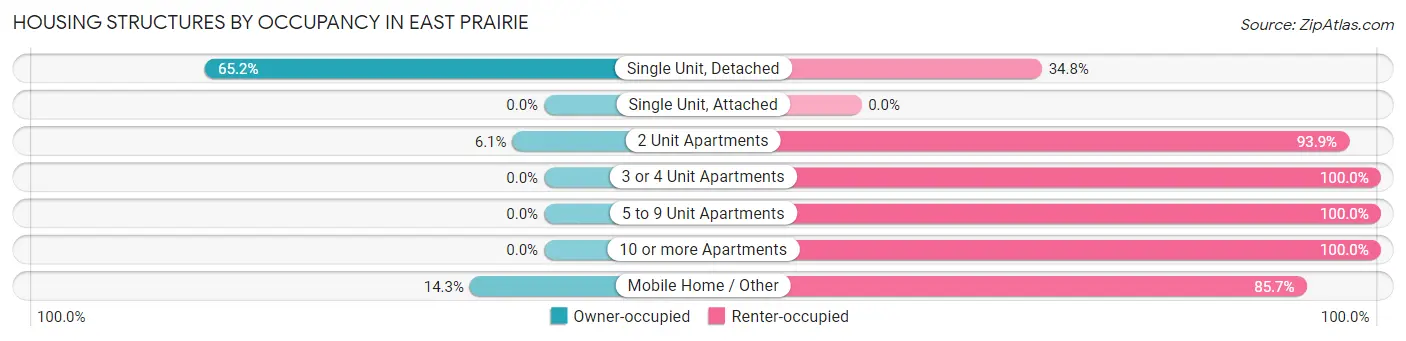
| Structure Type | Owner-occupied | Renter-occupied |
| Single Unit, Detached | 578 (65.2%) | 308 (34.8%) |
| Single Unit, Attached | 0 (0.0%) | 0 (0.0%) |
| 2 Unit Apartments | 19 (6.1%) | 293 (93.9%) |
| 3 or 4 Unit Apartments | 0 (0.0%) | 87 (100.0%) |
| 5 to 9 Unit Apartments | 0 (0.0%) | 18 (100.0%) |
| 10 or more Apartments | 0 (0.0%) | 27 (100.0%) |
| Mobile Home / Other | 8 (14.3%) | 48 (85.7%) |
| Total | 605 (43.6%) | 781 (56.4%) |
Housing Structures by Number of Rooms in East Prairie
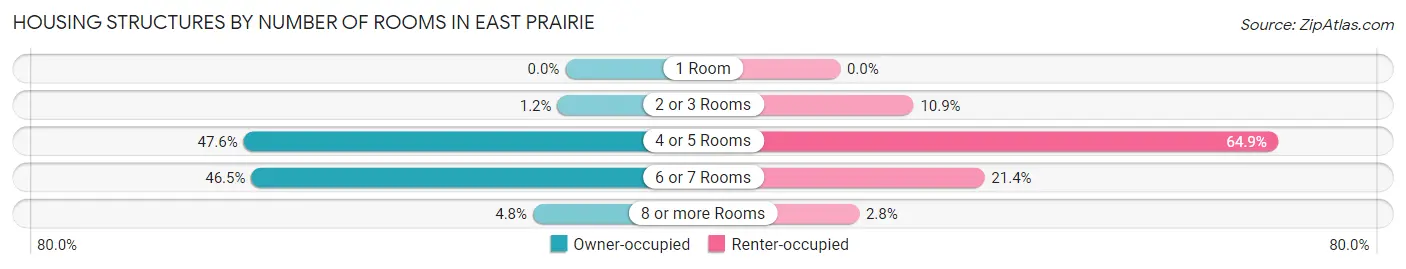
| Number of Rooms | Owner-occupied | Renter-occupied |
| 1 Room | 0 (0.0%) | 0 (0.0%) |
| 2 or 3 Rooms | 7 (1.2%) | 85 (10.9%) |
| 4 or 5 Rooms | 288 (47.6%) | 507 (64.9%) |
| 6 or 7 Rooms | 281 (46.5%) | 167 (21.4%) |
| 8 or more Rooms | 29 (4.8%) | 22 (2.8%) |
| Total | 605 (100.0%) | 781 (100.0%) |
Housing Structure by Heating Type in East Prairie
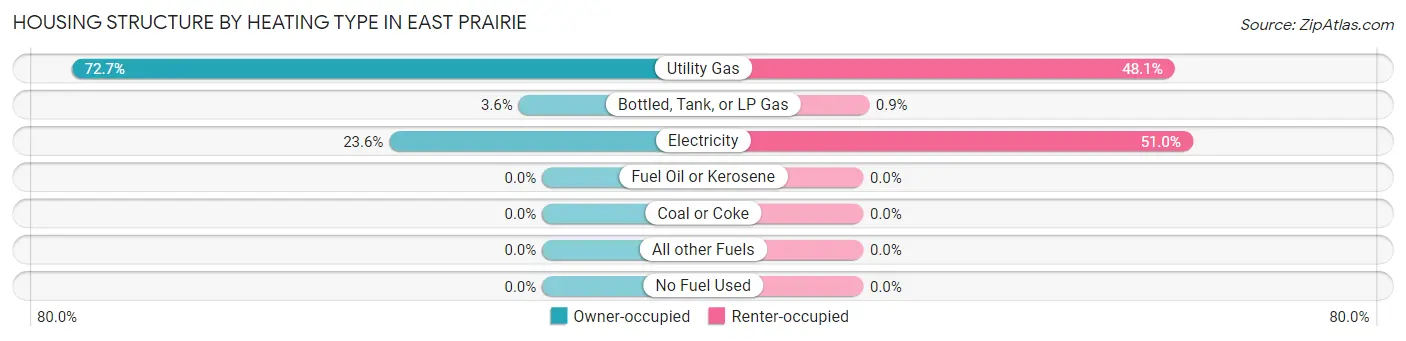
| Heating Type | Owner-occupied | Renter-occupied |
| Utility Gas | 440 (72.7%) | 376 (48.1%) |
| Bottled, Tank, or LP Gas | 22 (3.6%) | 7 (0.9%) |
| Electricity | 143 (23.6%) | 398 (51.0%) |
| Fuel Oil or Kerosene | 0 (0.0%) | 0 (0.0%) |
| Coal or Coke | 0 (0.0%) | 0 (0.0%) |
| All other Fuels | 0 (0.0%) | 0 (0.0%) |
| No Fuel Used | 0 (0.0%) | 0 (0.0%) |
| Total | 605 (100.0%) | 781 (100.0%) |
Household Vehicle Usage in East Prairie
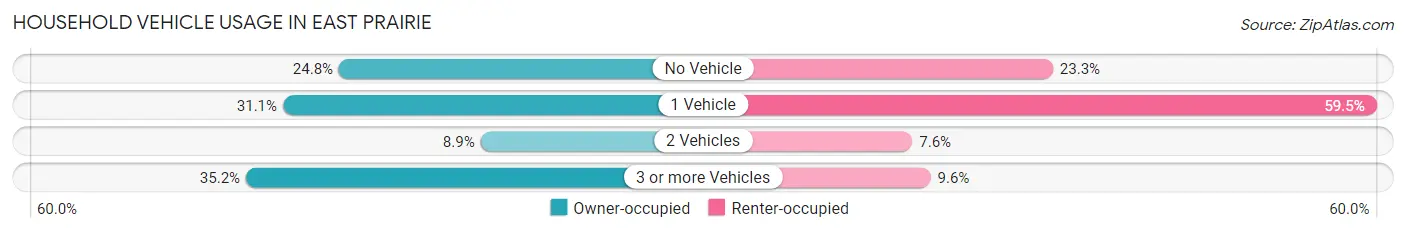
| Vehicles per Household | Owner-occupied | Renter-occupied |
| No Vehicle | 150 (24.8%) | 182 (23.3%) |
| 1 Vehicle | 188 (31.1%) | 465 (59.5%) |
| 2 Vehicles | 54 (8.9%) | 59 (7.5%) |
| 3 or more Vehicles | 213 (35.2%) | 75 (9.6%) |
| Total | 605 (100.0%) | 781 (100.0%) |
Real Estate & Mortgages in East Prairie
Real Estate and Mortgage Overview in East Prairie
| Characteristic | Without Mortgage | With Mortgage |
| Housing Units | 458 | 147 |
| Median Property Value | $58,900 | $48,300 |
| Median Household Income | $42,794 | $0 |
| Monthly Housing Costs | $320 | $0 |
| Real Estate Taxes | $480 | $14 |
Property Value by Mortgage Status in East Prairie
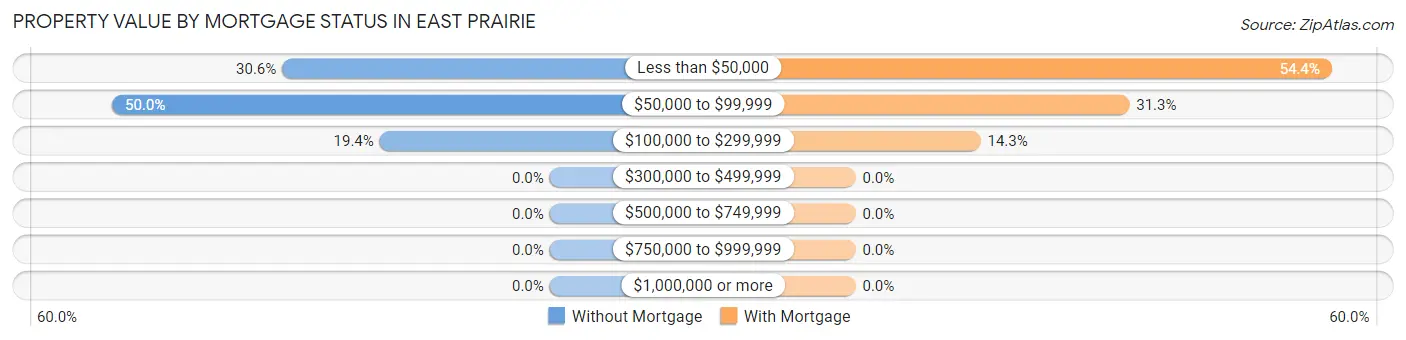
| Property Value | Without Mortgage | With Mortgage |
| Less than $50,000 | 140 (30.6%) | 80 (54.4%) |
| $50,000 to $99,999 | 229 (50.0%) | 46 (31.3%) |
| $100,000 to $299,999 | 89 (19.4%) | 21 (14.3%) |
| $300,000 to $499,999 | 0 (0.0%) | 0 (0.0%) |
| $500,000 to $749,999 | 0 (0.0%) | 0 (0.0%) |
| $750,000 to $999,999 | 0 (0.0%) | 0 (0.0%) |
| $1,000,000 or more | 0 (0.0%) | 0 (0.0%) |
| Total | 458 (100.0%) | 147 (100.0%) |
Household Income by Mortgage Status in East Prairie
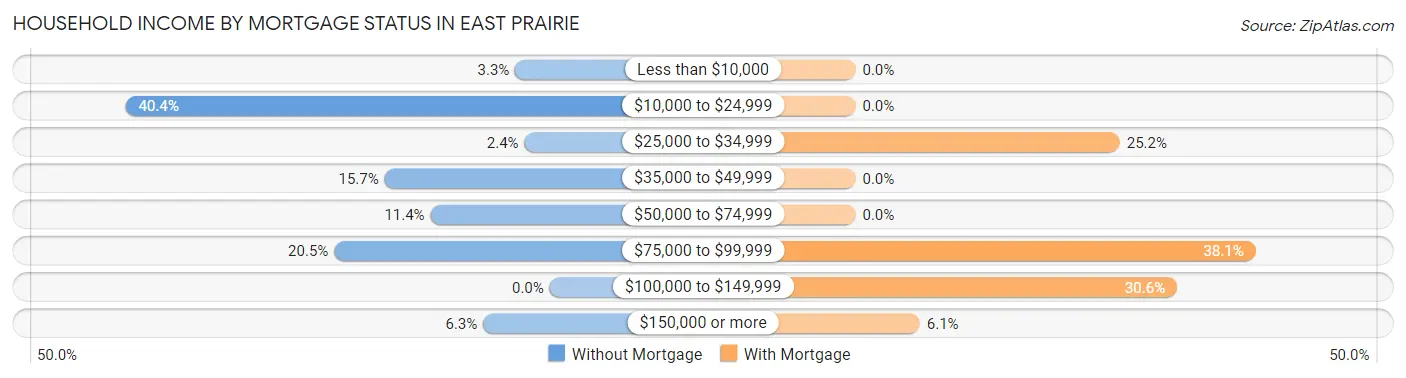
| Household Income | Without Mortgage | With Mortgage |
| Less than $10,000 | 15 (3.3%) | 0 (0.0%) |
| $10,000 to $24,999 | 185 (40.4%) | 0 (0.0%) |
| $25,000 to $34,999 | 11 (2.4%) | 37 (25.2%) |
| $35,000 to $49,999 | 72 (15.7%) | 0 (0.0%) |
| $50,000 to $74,999 | 52 (11.4%) | 0 (0.0%) |
| $75,000 to $99,999 | 94 (20.5%) | 56 (38.1%) |
| $100,000 to $149,999 | 0 (0.0%) | 45 (30.6%) |
| $150,000 or more | 29 (6.3%) | 9 (6.1%) |
| Total | 458 (100.0%) | 147 (100.0%) |
Property Value to Household Income Ratio in East Prairie
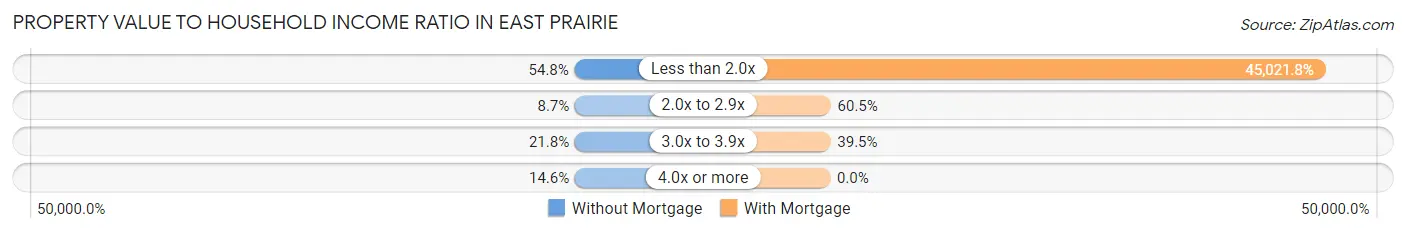
| Value-to-Income Ratio | Without Mortgage | With Mortgage |
| Less than 2.0x | 251 (54.8%) | 66,182 (45,021.8%) |
| 2.0x to 2.9x | 40 (8.7%) | 89 (60.5%) |
| 3.0x to 3.9x | 100 (21.8%) | 58 (39.5%) |
| 4.0x or more | 67 (14.6%) | 0 (0.0%) |
| Total | 458 (100.0%) | 147 (100.0%) |
Real Estate Taxes by Mortgage Status in East Prairie
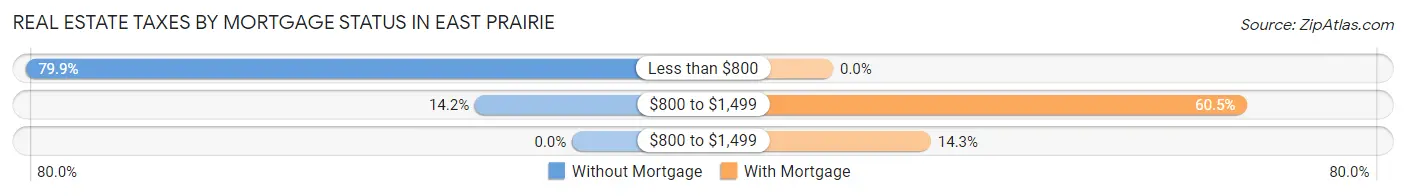
| Property Taxes | Without Mortgage | With Mortgage |
| Less than $800 | 366 (79.9%) | 0 (0.0%) |
| $800 to $1,499 | 65 (14.2%) | 89 (60.5%) |
| $800 to $1,499 | 0 (0.0%) | 21 (14.3%) |
| Total | 458 (100.0%) | 147 (100.0%) |
Health & Disability in East Prairie
Health Insurance Coverage by Age in East Prairie
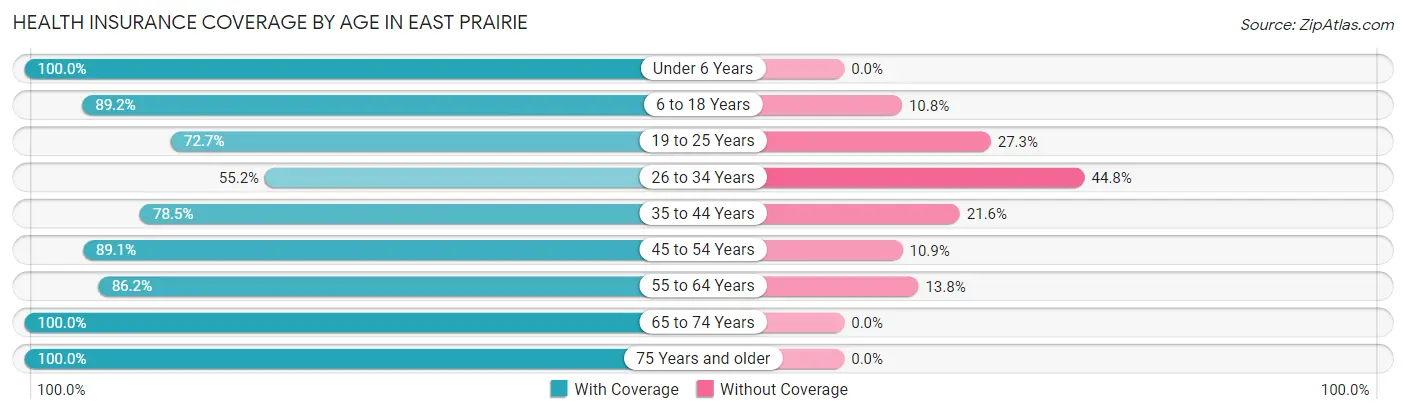
| Age Bracket | With Coverage | Without Coverage |
| Under 6 Years | 165 (100.0%) | 0 (0.0%) |
| 6 to 18 Years | 506 (89.2%) | 61 (10.8%) |
| 19 to 25 Years | 141 (72.7%) | 53 (27.3%) |
| 26 to 34 Years | 170 (55.2%) | 138 (44.8%) |
| 35 to 44 Years | 273 (78.4%) | 75 (21.5%) |
| 45 to 54 Years | 320 (89.1%) | 39 (10.9%) |
| 55 to 64 Years | 299 (86.2%) | 48 (13.8%) |
| 65 to 74 Years | 442 (100.0%) | 0 (0.0%) |
| 75 Years and older | 206 (100.0%) | 0 (0.0%) |
| Total | 2,522 (85.9%) | 414 (14.1%) |
Health Insurance Coverage by Citizenship Status in East Prairie
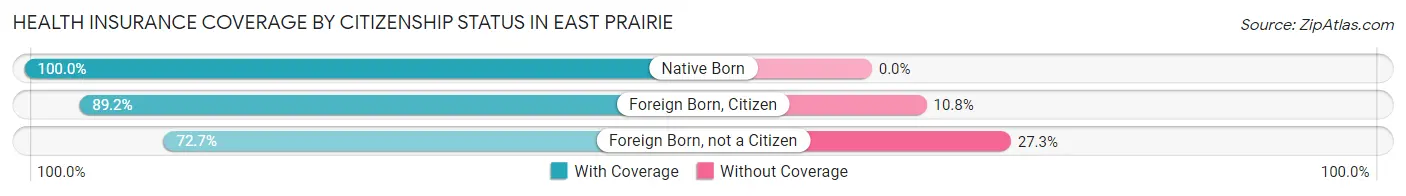
| Citizenship Status | With Coverage | Without Coverage |
| Native Born | 165 (100.0%) | 0 (0.0%) |
| Foreign Born, Citizen | 506 (89.2%) | 61 (10.8%) |
| Foreign Born, not a Citizen | 141 (72.7%) | 53 (27.3%) |
Health Insurance Coverage by Household Income in East Prairie
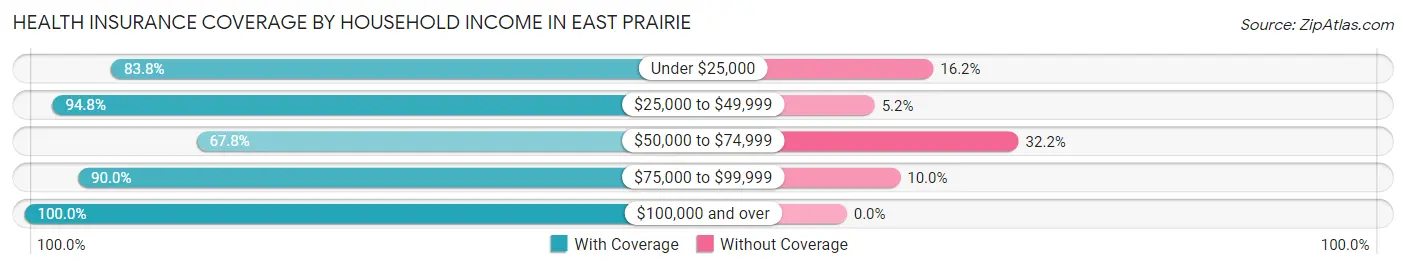
| Household Income | With Coverage | Without Coverage |
| Under $25,000 | 909 (83.8%) | 176 (16.2%) |
| $25,000 to $49,999 | 705 (94.8%) | 39 (5.2%) |
| $50,000 to $74,999 | 318 (67.8%) | 151 (32.2%) |
| $75,000 to $99,999 | 431 (90.0%) | 48 (10.0%) |
| $100,000 and over | 159 (100.0%) | 0 (0.0%) |
Public vs Private Health Insurance Coverage by Age in East Prairie
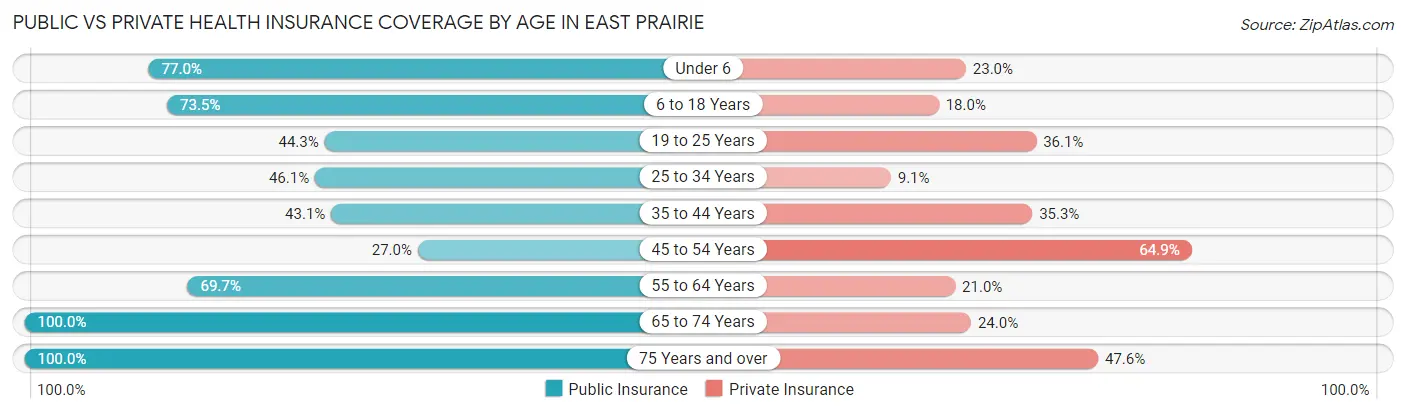
| Age Bracket | Public Insurance | Private Insurance |
| Under 6 | 127 (77.0%) | 38 (23.0%) |
| 6 to 18 Years | 417 (73.5%) | 102 (18.0%) |
| 19 to 25 Years | 86 (44.3%) | 70 (36.1%) |
| 25 to 34 Years | 142 (46.1%) | 28 (9.1%) |
| 35 to 44 Years | 150 (43.1%) | 123 (35.3%) |
| 45 to 54 Years | 97 (27.0%) | 233 (64.9%) |
| 55 to 64 Years | 242 (69.7%) | 73 (21.0%) |
| 65 to 74 Years | 442 (100.0%) | 106 (24.0%) |
| 75 Years and over | 206 (100.0%) | 98 (47.6%) |
| Total | 1,909 (65.0%) | 871 (29.7%) |
Disability Status by Sex by Age in East Prairie
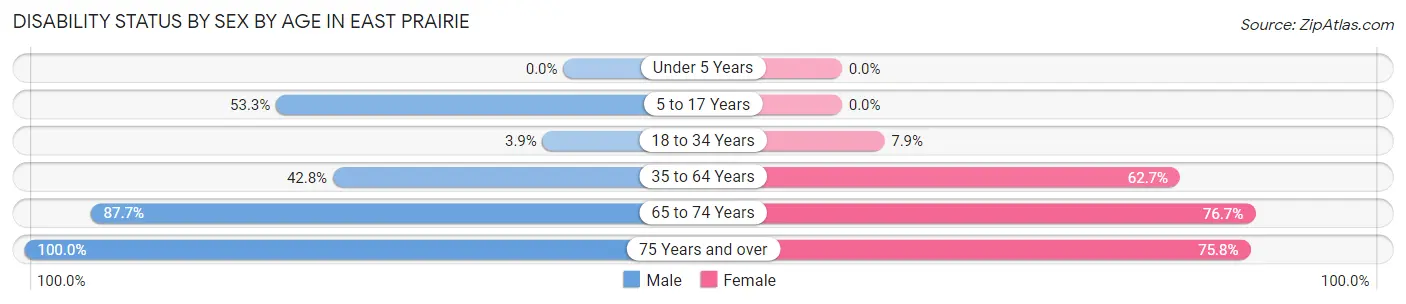
| Age Bracket | Male | Female |
| Under 5 Years | 0 (0.0%) | 0 (0.0%) |
| 5 to 17 Years | 161 (53.3%) | 0 (0.0%) |
| 18 to 34 Years | 14 (3.8%) | 15 (7.9%) |
| 35 to 64 Years | 204 (42.8%) | 362 (62.7%) |
| 65 to 74 Years | 143 (87.7%) | 214 (76.7%) |
| 75 Years and over | 53 (100.0%) | 116 (75.8%) |
Disability Class by Sex by Age in East Prairie
Disability Class: Hearing Difficulty
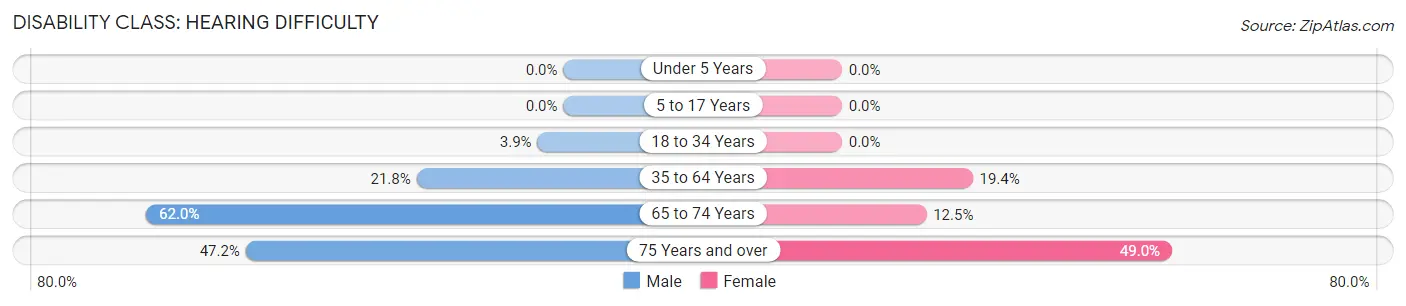
| Age Bracket | Male | Female |
| Under 5 Years | 0 (0.0%) | 0 (0.0%) |
| 5 to 17 Years | 0 (0.0%) | 0 (0.0%) |
| 18 to 34 Years | 14 (3.8%) | 0 (0.0%) |
| 35 to 64 Years | 104 (21.8%) | 112 (19.4%) |
| 65 to 74 Years | 101 (62.0%) | 35 (12.5%) |
| 75 Years and over | 25 (47.2%) | 75 (49.0%) |
Disability Class: Vision Difficulty
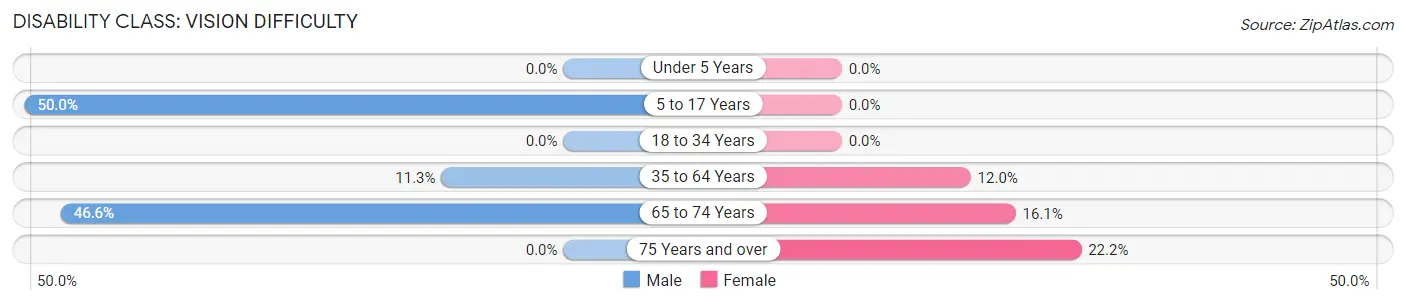
| Age Bracket | Male | Female |
| Under 5 Years | 0 (0.0%) | 0 (0.0%) |
| 5 to 17 Years | 151 (50.0%) | 0 (0.0%) |
| 18 to 34 Years | 0 (0.0%) | 0 (0.0%) |
| 35 to 64 Years | 54 (11.3%) | 69 (12.0%) |
| 65 to 74 Years | 76 (46.6%) | 45 (16.1%) |
| 75 Years and over | 0 (0.0%) | 34 (22.2%) |
Disability Class: Cognitive Difficulty
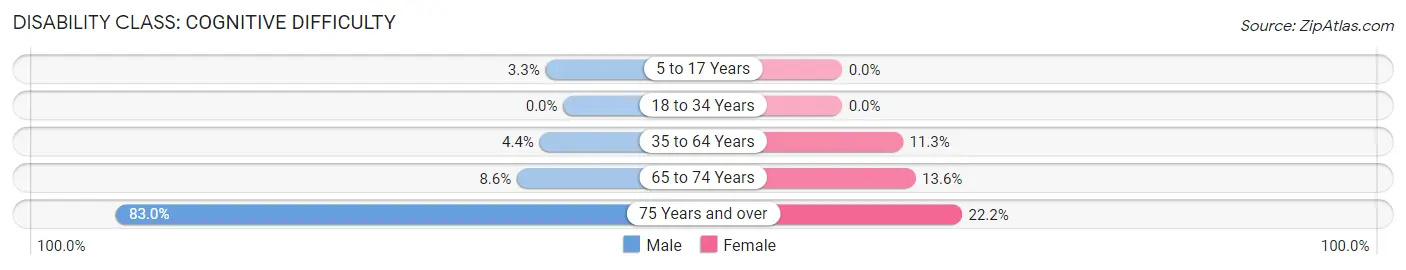
| Age Bracket | Male | Female |
| 5 to 17 Years | 10 (3.3%) | 0 (0.0%) |
| 18 to 34 Years | 0 (0.0%) | 0 (0.0%) |
| 35 to 64 Years | 21 (4.4%) | 65 (11.3%) |
| 65 to 74 Years | 14 (8.6%) | 38 (13.6%) |
| 75 Years and over | 44 (83.0%) | 34 (22.2%) |
Disability Class: Ambulatory Difficulty
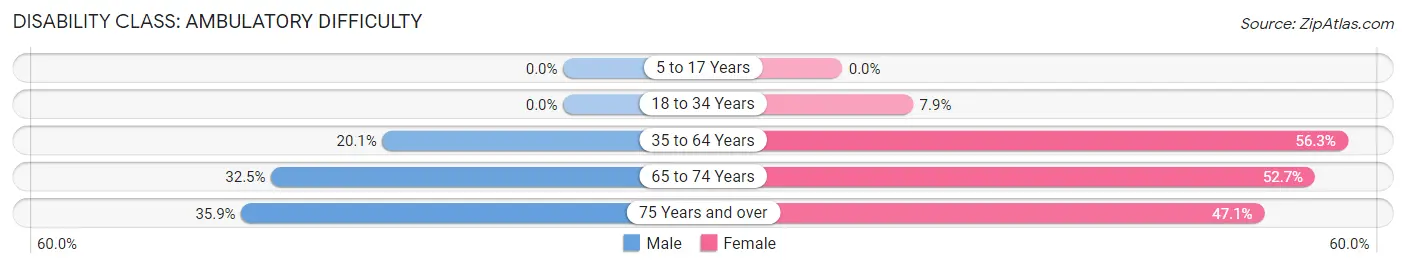
| Age Bracket | Male | Female |
| 5 to 17 Years | 0 (0.0%) | 0 (0.0%) |
| 18 to 34 Years | 0 (0.0%) | 15 (7.9%) |
| 35 to 64 Years | 96 (20.1%) | 325 (56.3%) |
| 65 to 74 Years | 53 (32.5%) | 147 (52.7%) |
| 75 Years and over | 19 (35.8%) | 72 (47.1%) |
Disability Class: Self-Care Difficulty
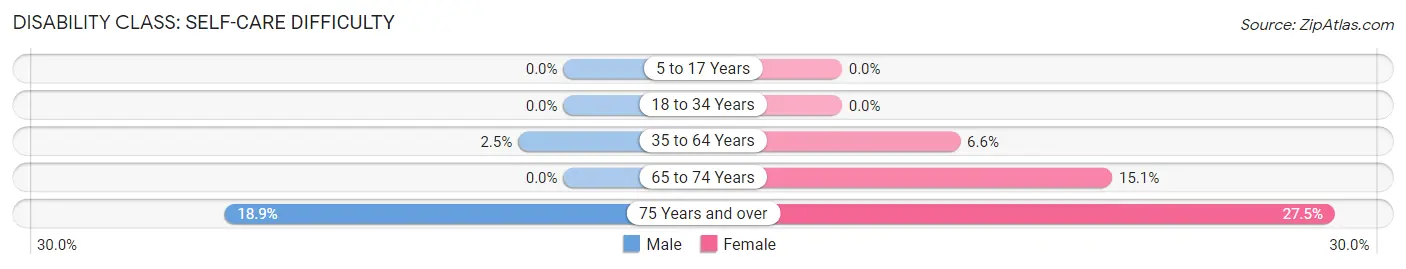
| Age Bracket | Male | Female |
| 5 to 17 Years | 0 (0.0%) | 0 (0.0%) |
| 18 to 34 Years | 0 (0.0%) | 0 (0.0%) |
| 35 to 64 Years | 12 (2.5%) | 38 (6.6%) |
| 65 to 74 Years | 0 (0.0%) | 42 (15.0%) |
| 75 Years and over | 10 (18.9%) | 42 (27.5%) |
Technology Access in East Prairie
Computing Device Access in East Prairie
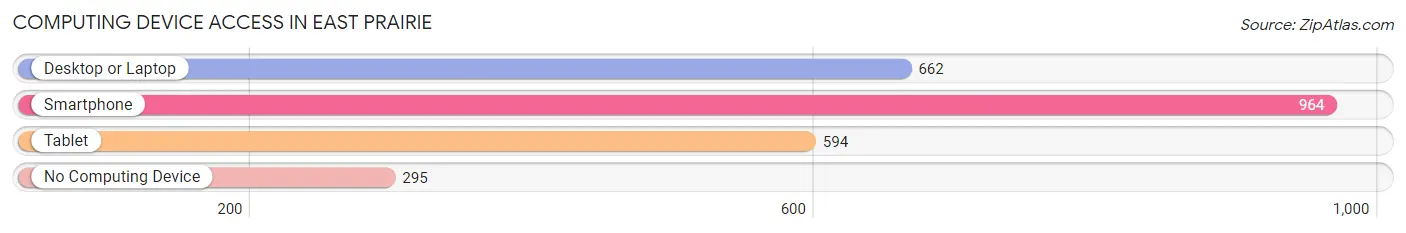
| Device Type | # Households | % Households |
| Desktop or Laptop | 662 | 47.8% |
| Smartphone | 964 | 69.6% |
| Tablet | 594 | 42.9% |
| No Computing Device | 295 | 21.3% |
| Total | 1,386 | 100.0% |
Internet Access in East Prairie
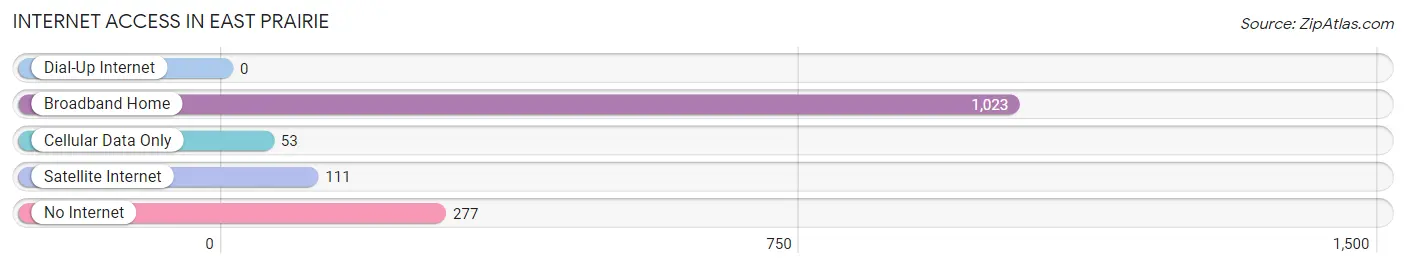
| Internet Type | # Households | % Households |
| Dial-Up Internet | 0 | 0.0% |
| Broadband Home | 1,023 | 73.8% |
| Cellular Data Only | 53 | 3.8% |
| Satellite Internet | 111 | 8.0% |
| No Internet | 277 | 20.0% |
| Total | 1,386 | 100.0% |
East Prairie Summary
History
East Prairie, Missouri is a small city located in Mississippi County, Missouri. It is situated on the banks of the Mississippi River, approximately 30 miles north of the state capital of Jefferson City. The city was founded in 1837 by a group of settlers from Kentucky and Tennessee, who were looking for a place to settle and start a new life. The city was named after the nearby East Prairie Creek, which was named by the early settlers for its abundance of wild prairie grasses.
East Prairie has a rich history that dates back to the early 1800s. The city was a major stop on the Underground Railroad, and was home to several prominent abolitionists, including William Still and Harriet Tubman. During the Civil War, East Prairie was a major supply center for the Union Army, and was the site of several battles. After the war, the city experienced a period of growth and prosperity, and was home to several prominent businesses, including a cotton mill, a flour mill, and a brickyard.
In the late 19th century, East Prairie was a major hub for the railroad industry, and was home to several major railroads, including the St. Louis and Iron Mountain Railroad, the St. Louis and San Francisco Railroad, and the Missouri Pacific Railroad. The city was also home to several major industries, including a cotton mill, a flour mill, and a brickyard.
Geography
East Prairie is located in the southeastern corner of Missouri, in the Mississippi River Valley. The city is situated on the banks of the Mississippi River, approximately 30 miles north of the state capital of Jefferson City. The city is surrounded by rolling hills and farmland, and is home to several small lakes and streams. The climate in East Prairie is generally mild, with hot summers and cold winters.
Economy
East Prairie’s economy is largely based on agriculture and manufacturing. The city is home to several large farms, which produce a variety of crops, including corn, soybeans, wheat, and hay. The city is also home to several manufacturing companies, including a cotton mill, a flour mill, and a brickyard. In addition, the city is home to several small businesses, including restaurants, retail stores, and service providers.
Demographics
As of the 2010 census, East Prairie had a population of 2,845. The racial makeup of the city was 95.3% White, 0.7% African American, 0.3% Native American, 0.3% Asian, 0.1% Pacific Islander, 1.2% from other races, and 2.3% from two or more races. Hispanic or Latino of any race were 3.2% of the population.
The median income for a household in East Prairie was $30,938, and the median income for a family was $37,813. The per capita income for the city was $15,945. About 17.2% of families and 20.2% of the population were below the poverty line, including 28.2% of those under age 18 and 11.2% of those age 65 or over.
Common Questions
What is Per Capita Income in East Prairie?
Per Capita income in East Prairie is $19,728.
What is the Median Family Income in East Prairie?
Median Family Income in East Prairie is $32,600.
What is the Median Household income in East Prairie?
Median Household Income in East Prairie is $28,300.
What is Income or Wage Gap in East Prairie?
Income or Wage Gap in East Prairie is 40.4%.
Women in East Prairie earn 59.6 cents for every dollar earned by a man.
What is Inequality or Gini Index in East Prairie?
Inequality or Gini Index in East Prairie is 0.46.
What is the Total Population of East Prairie?
Total Population of East Prairie is 2,969.
What is the Total Male Population of East Prairie?
Total Male Population of East Prairie is 1,437.
What is the Total Female Population of East Prairie?
Total Female Population of East Prairie is 1,532.
What is the Ratio of Males per 100 Females in East Prairie?
There are 93.80 Males per 100 Females in East Prairie.
What is the Ratio of Females per 100 Males in East Prairie?
There are 106.61 Females per 100 Males in East Prairie.
What is the Median Population Age in East Prairie?
Median Population Age in East Prairie is 41.9 Years.
What is the Average Family Size in East Prairie
Average Family Size in East Prairie is 2.6 People.
What is the Average Household Size in East Prairie
Average Household Size in East Prairie is 2.1 People.
How Large is the Labor Force in East Prairie?
There are 1,088 People in the Labor Forcein in East Prairie.
What is the Percentage of People in the Labor Force in East Prairie?
45.6% of People are in the Labor Force in East Prairie.
What is the Unemployment Rate in East Prairie?
Unemployment Rate in East Prairie is 6.0%.