Flemington, MO Map & Demographics
Flemington Map
Flemington Overview
$18,195
PER CAPITA INCOME
$42,500
AVG FAMILY INCOME
$29,167
AVG HOUSEHOLD INCOME
0.33
INEQUALITY / GINI INDEX
62
TOTAL POPULATION
32
MALE POPULATION
30
FEMALE POPULATION
106.67
MALES / 100 FEMALES
93.75
FEMALES / 100 MALES
53.0
MEDIAN AGE
3.1
AVG FAMILY SIZE
2.1
AVG HOUSEHOLD SIZE
18
LABOR FORCE [ PEOPLE ]
31.0%
PERCENT IN LABOR FORCE
5.6%
UNEMPLOYMENT RATE
Flemington Zip Codes
Flemington Area Codes
Income in Flemington
Income Overview in Flemington
Per Capita Income in Flemington is $18,195, while median incomes of families and households are $42,500 and $29,167 respectively.
| Characteristic | Number | Measure |
| Per Capita Income | 62 | $18,195 |
| Median Family Income | 14 | $42,500 |
| Mean Family Income | 14 | $50,500 |
| Median Household Income | 30 | $29,167 |
| Mean Household Income | 30 | $36,980 |
| Income Deficit | 14 | $0 |
| Wage / Income Gap (%) | 62 | 0.00% |
| Wage / Income Gap ($) | 62 | 100.00¢ per $1 |
| Gini / Inequality Index | 62 | 0.33 |
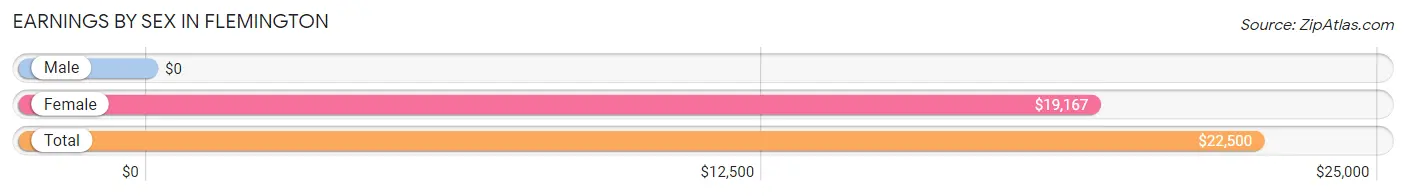
Earnings by Sex in Flemington
| Sex | Number | Average Earnings |
| Male | 10 (50.0%) | $0 |
| Female | 10 (50.0%) | $19,167 |
| Total | 20 (100.0%) | $22,500 |
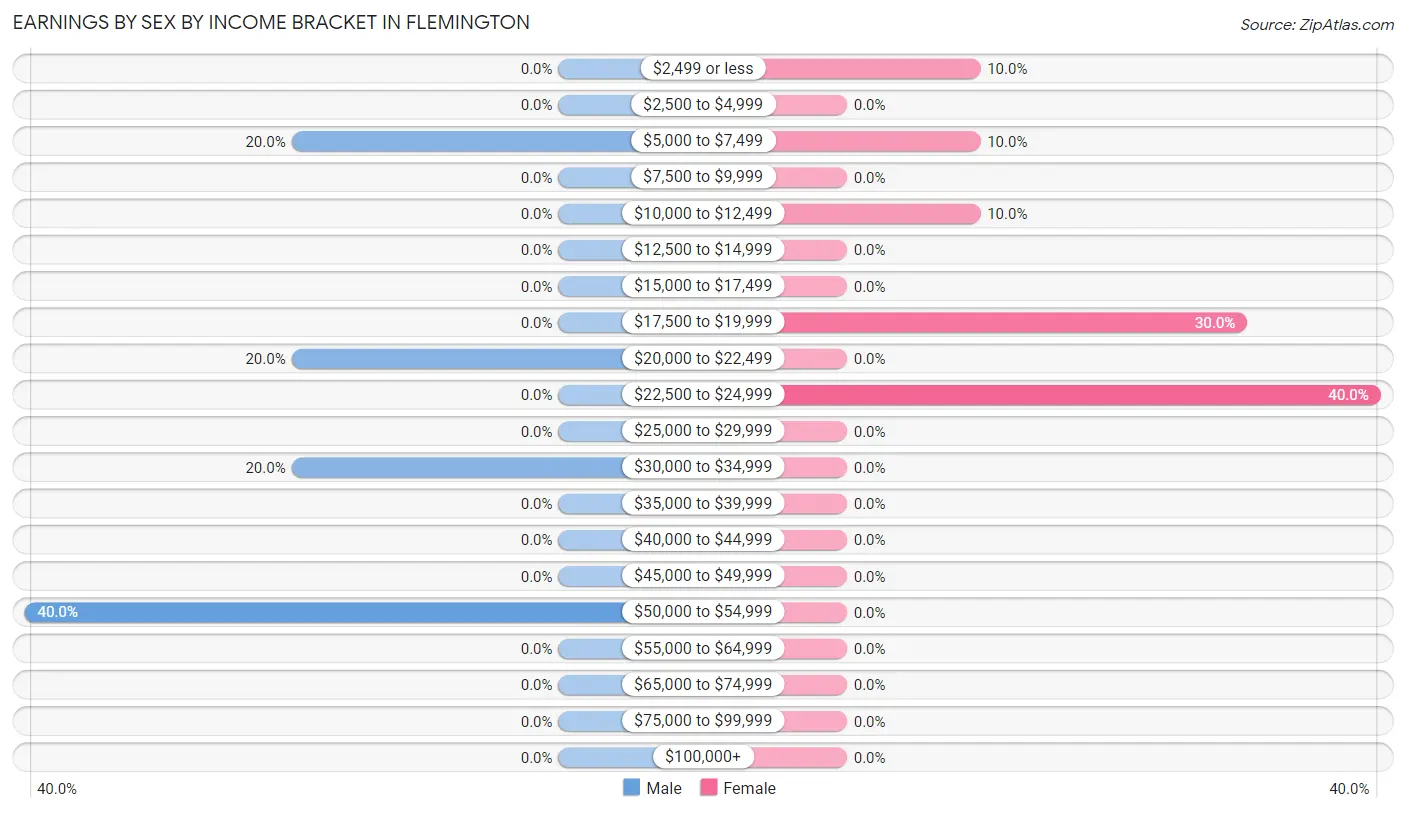
Earnings by Sex by Income Bracket in Flemington
The most common earnings brackets in Flemington are $50,000 to $54,999 for men (4 | 40.0%) and $22,500 to $24,999 for women (4 | 40.0%).
| Income | Male | Female |
| $2,499 or less | 0 (0.0%) | 1 (10.0%) |
| $2,500 to $4,999 | 0 (0.0%) | 0 (0.0%) |
| $5,000 to $7,499 | 2 (20.0%) | 1 (10.0%) |
| $7,500 to $9,999 | 0 (0.0%) | 0 (0.0%) |
| $10,000 to $12,499 | 0 (0.0%) | 1 (10.0%) |
| $12,500 to $14,999 | 0 (0.0%) | 0 (0.0%) |
| $15,000 to $17,499 | 0 (0.0%) | 0 (0.0%) |
| $17,500 to $19,999 | 0 (0.0%) | 3 (30.0%) |
| $20,000 to $22,499 | 2 (20.0%) | 0 (0.0%) |
| $22,500 to $24,999 | 0 (0.0%) | 4 (40.0%) |
| $25,000 to $29,999 | 0 (0.0%) | 0 (0.0%) |
| $30,000 to $34,999 | 2 (20.0%) | 0 (0.0%) |
| $35,000 to $39,999 | 0 (0.0%) | 0 (0.0%) |
| $40,000 to $44,999 | 0 (0.0%) | 0 (0.0%) |
| $45,000 to $49,999 | 0 (0.0%) | 0 (0.0%) |
| $50,000 to $54,999 | 4 (40.0%) | 0 (0.0%) |
| $55,000 to $64,999 | 0 (0.0%) | 0 (0.0%) |
| $65,000 to $74,999 | 0 (0.0%) | 0 (0.0%) |
| $75,000 to $99,999 | 0 (0.0%) | 0 (0.0%) |
| $100,000+ | 0 (0.0%) | 0 (0.0%) |
| Total | 10 (100.0%) | 10 (100.0%) |
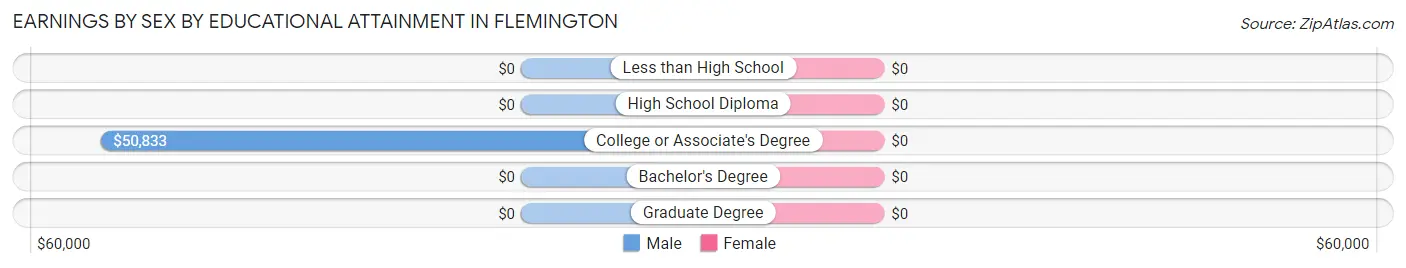
Earnings by Sex by Educational Attainment in Flemington
| Educational Attainment | Male Income | Female Income |
| Less than High School | - | - |
| High School Diploma | - | - |
| College or Associate's Degree | $50,833 | $0 |
| Bachelor's Degree | - | - |
| Graduate Degree | - | - |
| Total | - | - |
Family Income in Flemington
Family Income Brackets in Flemington
According to the Flemington family income data, there are 5 families falling into the $75,000 to $99,999 income range, which is the most common income bracket and makes up 35.7% of all families.
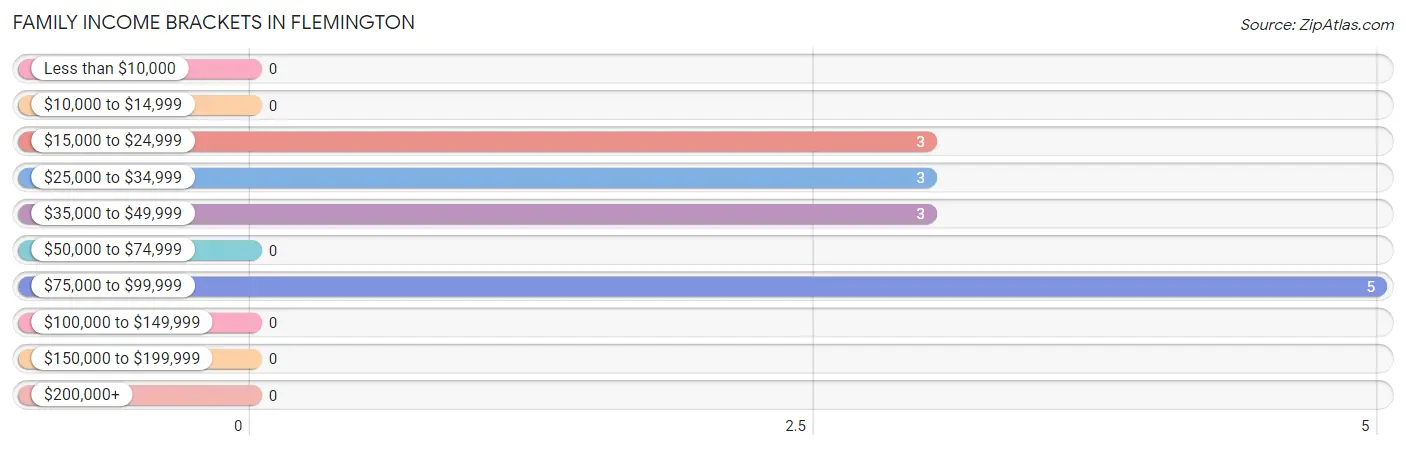
| Income Bracket | # Families | % Families |
| Less than $10,000 | 0 | 0.0% |
| $10,000 to $14,999 | 0 | 0.0% |
| $15,000 to $24,999 | 3 | 21.4% |
| $25,000 to $34,999 | 3 | 21.4% |
| $35,000 to $49,999 | 3 | 21.4% |
| $50,000 to $74,999 | 0 | 0.0% |
| $75,000 to $99,999 | 5 | 35.7% |
| $100,000 to $149,999 | 0 | 0.0% |
| $150,000 to $199,999 | 0 | 0.0% |
| $200,000+ | 0 | 0.0% |
Family Income by Famaliy Size in Flemington
2-person families (7 | 50.0%) account for the highest median family income in Flemington with $29,375 per family, while 2-person families (7 | 50.0%) have the highest median income of $14,688 per family member.
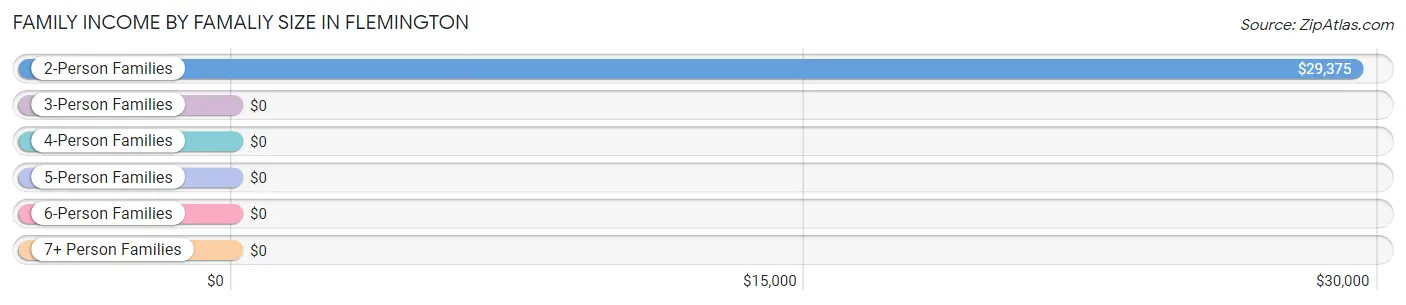
| Income Bracket | # Families | Median Income |
| 2-Person Families | 7 (50.0%) | $29,375 |
| 3-Person Families | 2 (14.3%) | $0 |
| 4-Person Families | 4 (28.6%) | $0 |
| 5-Person Families | 1 (7.1%) | $0 |
| 6-Person Families | 0 (0.0%) | $0 |
| 7+ Person Families | 0 (0.0%) | $0 |
| Total | 14 (100.0%) | $42,500 |
Family Income by Number of Earners in Flemington
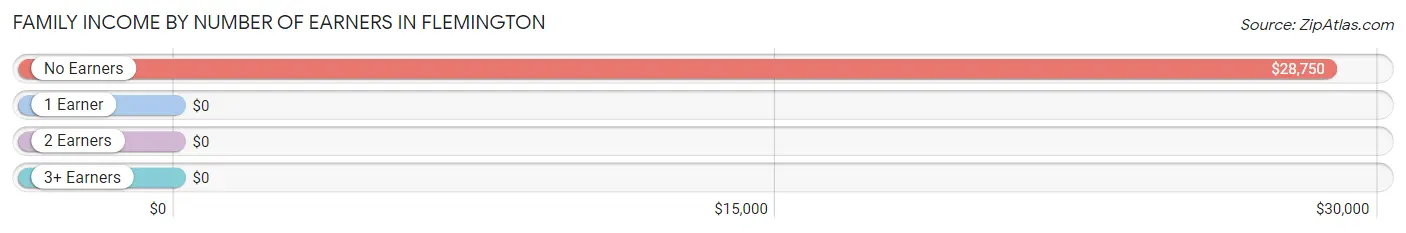
| Number of Earners | # Families | Median Income |
| No Earners | 6 (42.9%) | $28,750 |
| 1 Earner | 3 (21.4%) | $0 |
| 2 Earners | 4 (28.6%) | $0 |
| 3+ Earners | 1 (7.1%) | $0 |
| Total | 14 (100.0%) | $42,500 |
Household Income in Flemington
Household Income Brackets in Flemington
With 11 households falling in the category, the $25,000 to $34,999 income range is the most frequent in Flemington, accounting for 36.7% of all households.
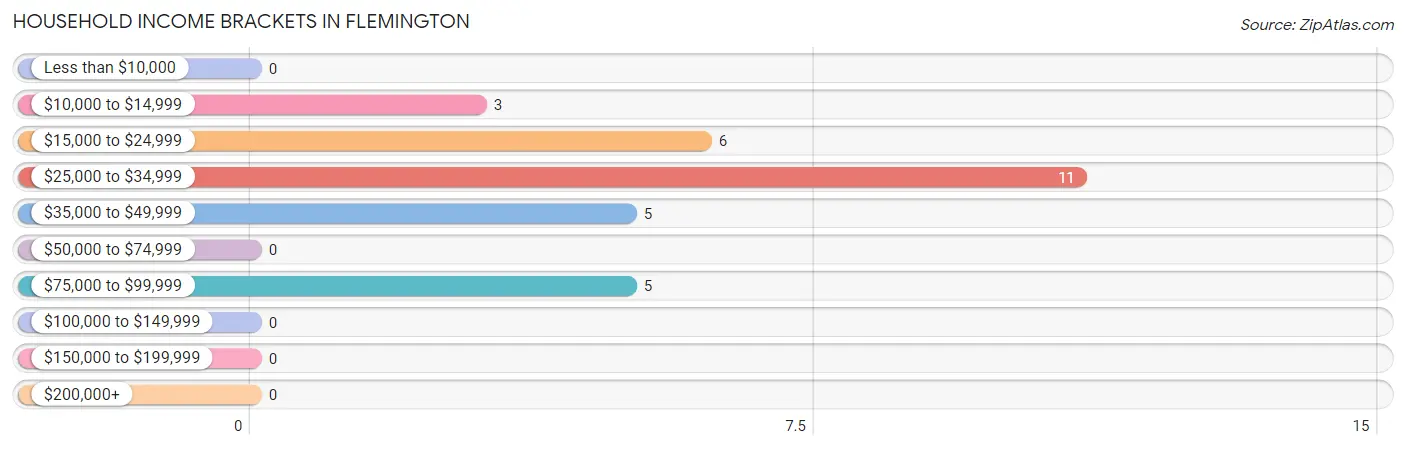
| Income Bracket | # Households | % Households |
| Less than $10,000 | 0 | 0.0% |
| $10,000 to $14,999 | 3 | 10.0% |
| $15,000 to $24,999 | 6 | 20.0% |
| $25,000 to $34,999 | 11 | 36.7% |
| $35,000 to $49,999 | 5 | 16.7% |
| $50,000 to $74,999 | 0 | 0.0% |
| $75,000 to $99,999 | 5 | 16.7% |
| $100,000 to $149,999 | 0 | 0.0% |
| $150,000 to $199,999 | 0 | 0.0% |
| $200,000+ | 0 | 0.0% |
Household Income by Householder Age in Flemington
The median household income in Flemington is $29,167, with the highest median household income of $30,000 found in the 65+ years age bracket for the primary householder. A total of 16 households (53.3%) fall into this category.
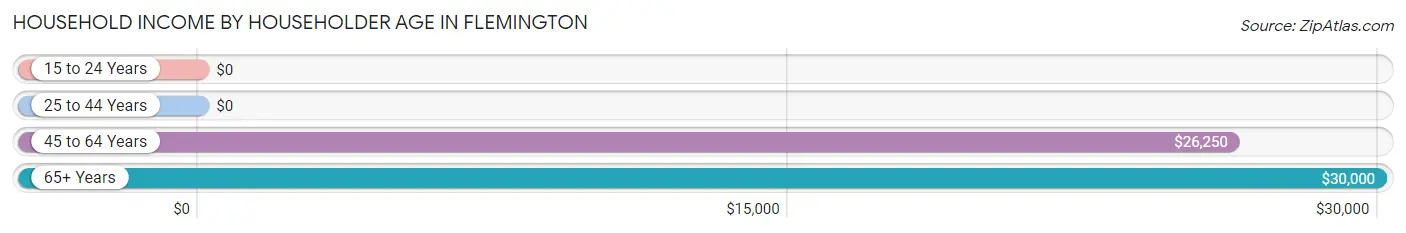
| Income Bracket | # Households | Median Income |
| 15 to 24 Years | 0 (0.0%) | $0 |
| 25 to 44 Years | 7 (23.3%) | $0 |
| 45 to 64 Years | 7 (23.3%) | $26,250 |
| 65+ Years | 16 (53.3%) | $30,000 |
| Total | 30 (100.0%) | $29,167 |
Poverty in Flemington
Income Below Poverty by Sex and Age in Flemington
With 18.8% poverty level for males and 10.0% for females among the residents of Flemington, 12 to 14 year old males and 12 to 14 year old females are the most vulnerable to poverty, with 1 males (100.0%) and 1 females (100.0%) in their respective age groups living below the poverty level.
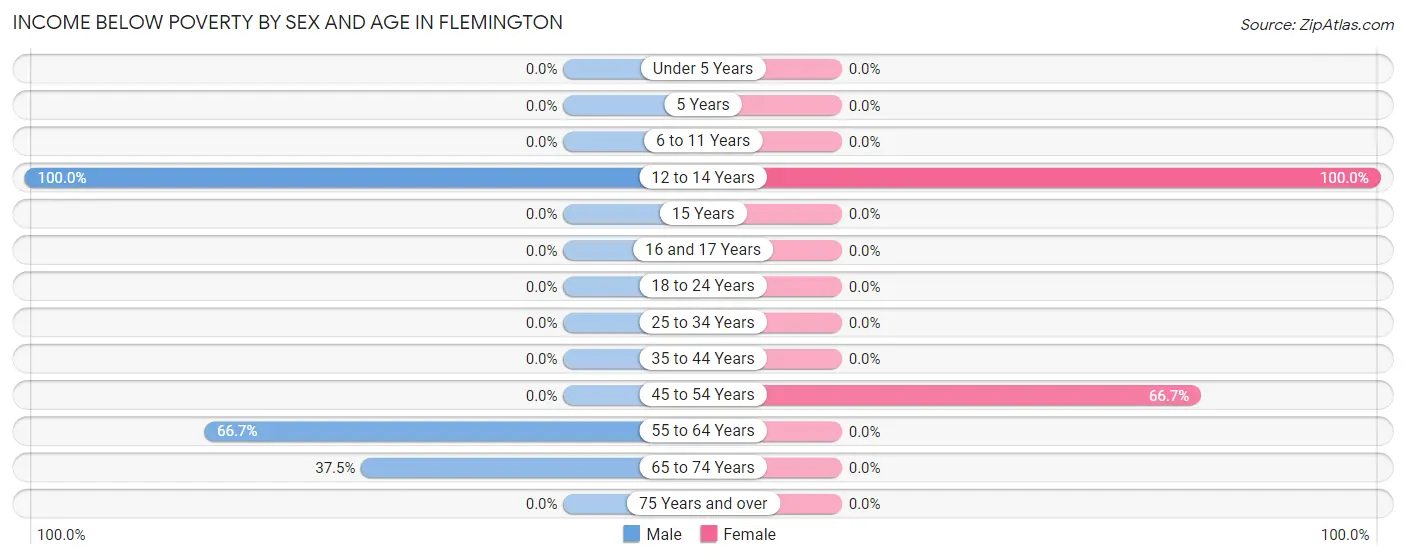
| Age Bracket | Male | Female |
| Under 5 Years | 0 (0.0%) | 0 (0.0%) |
| 5 Years | 0 (0.0%) | 0 (0.0%) |
| 6 to 11 Years | 0 (0.0%) | 0 (0.0%) |
| 12 to 14 Years | 1 (100.0%) | 1 (100.0%) |
| 15 Years | 0 (0.0%) | 0 (0.0%) |
| 16 and 17 Years | 0 (0.0%) | 0 (0.0%) |
| 18 to 24 Years | 0 (0.0%) | 0 (0.0%) |
| 25 to 34 Years | 0 (0.0%) | 0 (0.0%) |
| 35 to 44 Years | 0 (0.0%) | 0 (0.0%) |
| 45 to 54 Years | 0 (0.0%) | 2 (66.7%) |
| 55 to 64 Years | 2 (66.7%) | 0 (0.0%) |
| 65 to 74 Years | 3 (37.5%) | 0 (0.0%) |
| 75 Years and over | 0 (0.0%) | 0 (0.0%) |
| Total | 6 (18.8%) | 3 (10.0%) |
Income Above Poverty by Sex and Age in Flemington
According to the poverty statistics in Flemington, males aged 16 and 17 years and females aged 6 to 11 years are the age groups that are most secure financially, with 100.0% of males and 100.0% of females in these age groups living above the poverty line.
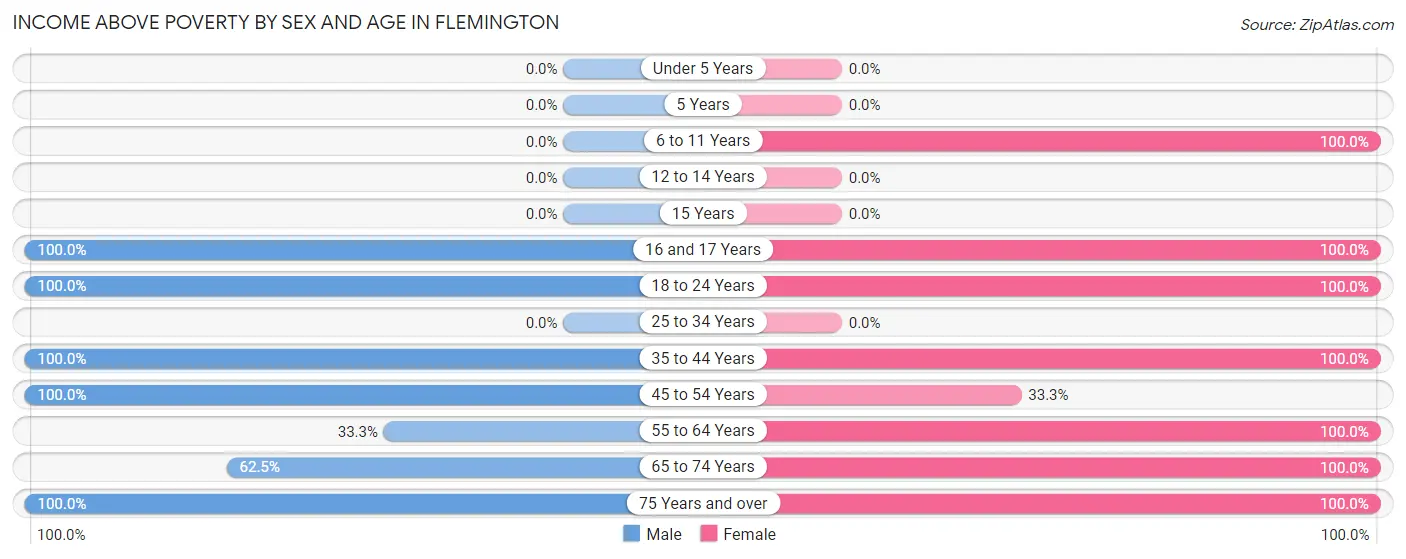
| Age Bracket | Male | Female |
| Under 5 Years | 0 (0.0%) | 0 (0.0%) |
| 5 Years | 0 (0.0%) | 0 (0.0%) |
| 6 to 11 Years | 0 (0.0%) | 2 (100.0%) |
| 12 to 14 Years | 0 (0.0%) | 0 (0.0%) |
| 15 Years | 0 (0.0%) | 0 (0.0%) |
| 16 and 17 Years | 4 (100.0%) | 1 (100.0%) |
| 18 to 24 Years | 6 (100.0%) | 1 (100.0%) |
| 25 to 34 Years | 0 (0.0%) | 0 (0.0%) |
| 35 to 44 Years | 2 (100.0%) | 7 (100.0%) |
| 45 to 54 Years | 3 (100.0%) | 1 (33.3%) |
| 55 to 64 Years | 1 (33.3%) | 8 (100.0%) |
| 65 to 74 Years | 5 (62.5%) | 1 (100.0%) |
| 75 Years and over | 5 (100.0%) | 6 (100.0%) |
| Total | 26 (81.2%) | 27 (90.0%) |
Income Below Poverty Among Married-Couple Families in Flemington
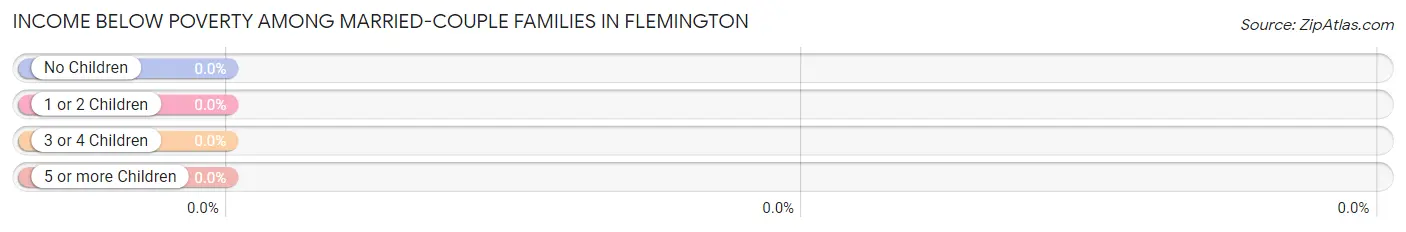
| Children | Above Poverty | Below Poverty |
| No Children | 6 (100.0%) | 0 (0.0%) |
| 1 or 2 Children | 5 (100.0%) | 0 (0.0%) |
| 3 or 4 Children | 0 (0.0%) | 0 (0.0%) |
| 5 or more Children | 0 (0.0%) | 0 (0.0%) |
| Total | 11 (100.0%) | 0 (0.0%) |
Income Below Poverty Among Single-Parent Households in Flemington
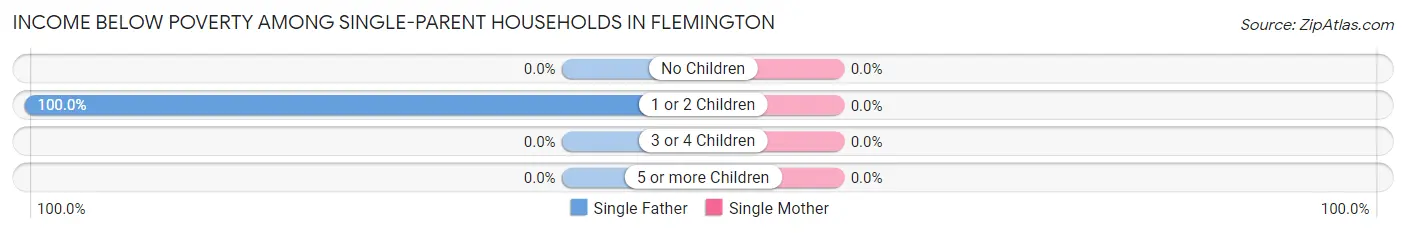
| Children | Single Father | Single Mother |
| No Children | 0 (0.0%) | 0 (0.0%) |
| 1 or 2 Children | 2 (100.0%) | 0 (0.0%) |
| 3 or 4 Children | 0 (0.0%) | 0 (0.0%) |
| 5 or more Children | 0 (0.0%) | 0 (0.0%) |
| Total | 2 (100.0%) | 0 (0.0%) |
Income Below Poverty Among Married-Couple vs Single-Parent Households in Flemington
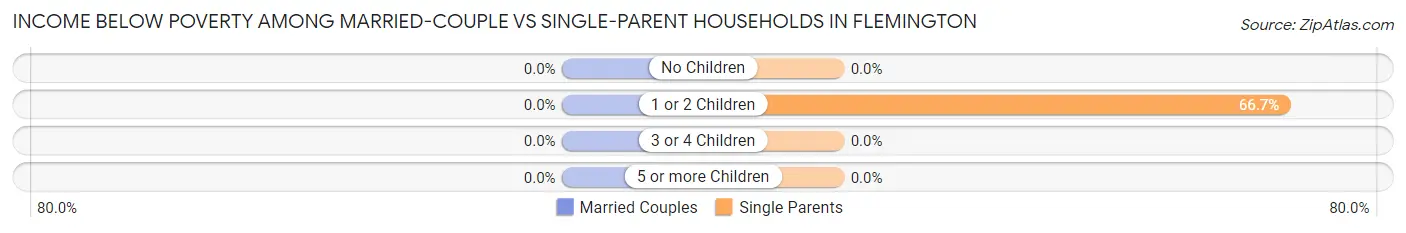
| Children | Married-Couple Families | Single-Parent Households |
| No Children | 0 (0.0%) | 0 (0.0%) |
| 1 or 2 Children | 0 (0.0%) | 2 (66.7%) |
| 3 or 4 Children | 0 (0.0%) | 0 (0.0%) |
| 5 or more Children | 0 (0.0%) | 0 (0.0%) |
| Total | 0 (0.0%) | 2 (66.7%) |
Race in Flemington
The most populous races in Flemington are White / Caucasian (60 | 96.8%), and Two or more Races (2 | 3.2%).
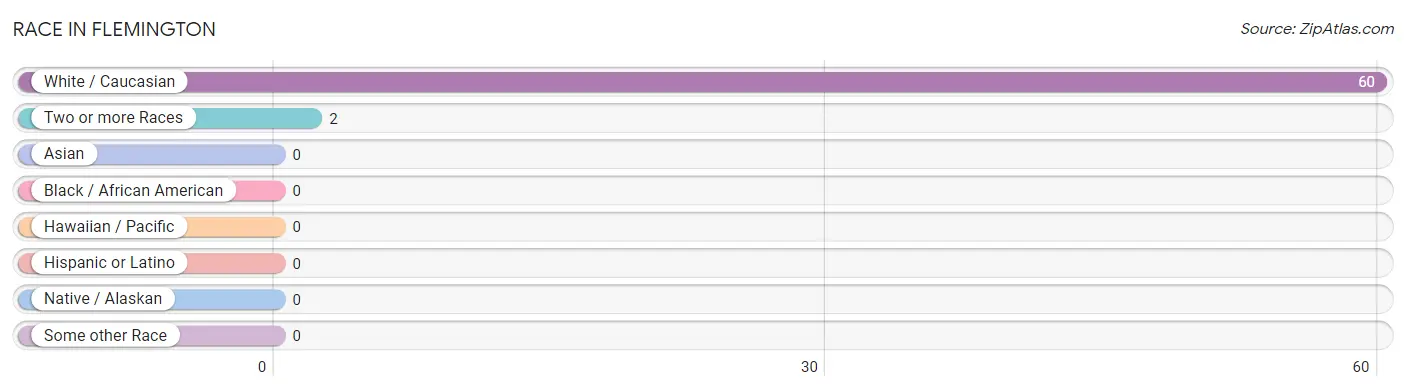
| Race | # Population | % Population |
| Asian | 0 | 0.0% |
| Black / African American | 0 | 0.0% |
| Hawaiian / Pacific | 0 | 0.0% |
| Hispanic or Latino | 0 | 0.0% |
| Native / Alaskan | 0 | 0.0% |
| White / Caucasian | 60 | 96.8% |
| Two or more Races | 2 | 3.2% |
| Some other Race | 0 | 0.0% |
| Total | 62 | 100.0% |
Ancestry in Flemington
The most populous ancestries reported in Flemington are German (9 | 14.5%), Italian (8 | 12.9%), Irish (7 | 11.3%), English (5 | 8.1%), and American (2 | 3.2%), together accounting for 50.0% of all Flemington residents.
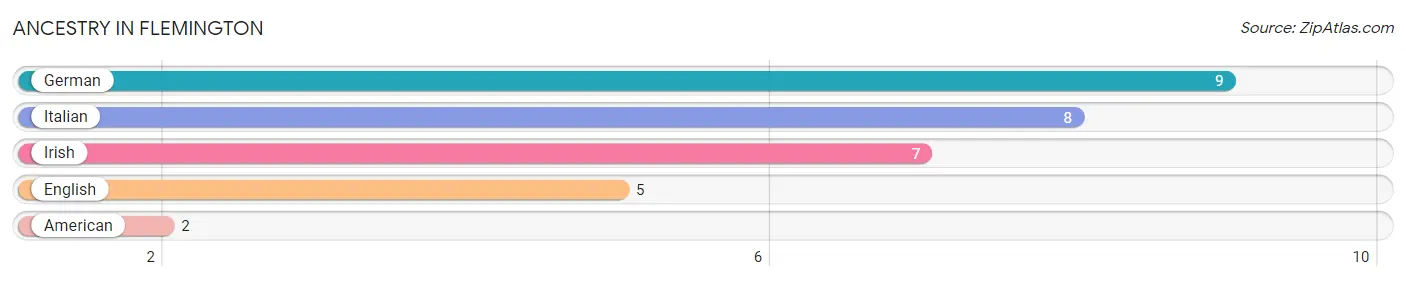
| Ancestry | # Population | % Population |
| American | 2 | 3.2% |
| English | 5 | 8.1% |
| German | 9 | 14.5% |
| Irish | 7 | 11.3% |
| Italian | 8 | 12.9% | View All 5 Rows |
Immigrants in Flemington

| Immigration Origin | # Population | % Population | View All 0 Rows |
Sex and Age in Flemington
Sex and Age in Flemington
The most populous age groups in Flemington are 15 to 19 Years (10 | 31.2%) for men and 40 to 44 Years (7 | 23.3%) for women.
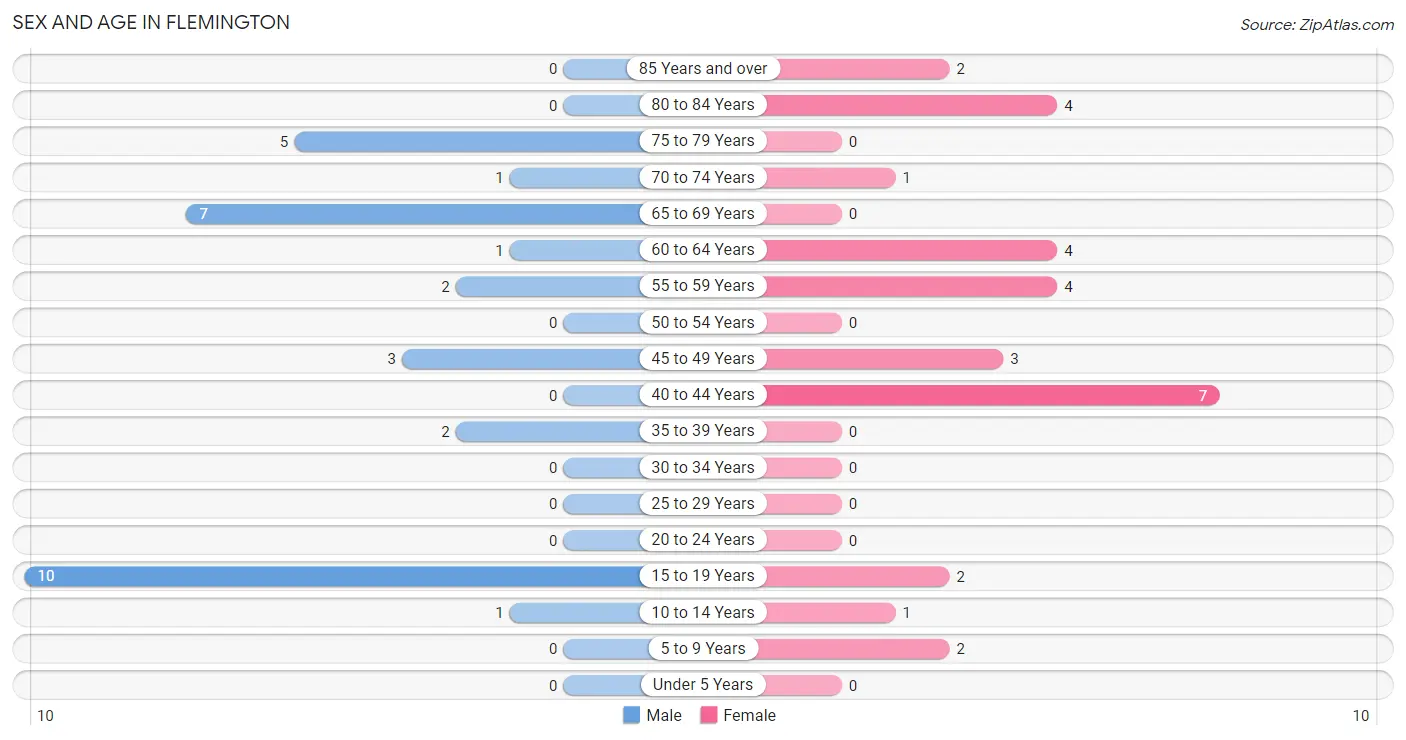
| Age Bracket | Male | Female |
| Under 5 Years | 0 (0.0%) | 0 (0.0%) |
| 5 to 9 Years | 0 (0.0%) | 2 (6.7%) |
| 10 to 14 Years | 1 (3.1%) | 1 (3.3%) |
| 15 to 19 Years | 10 (31.2%) | 2 (6.7%) |
| 20 to 24 Years | 0 (0.0%) | 0 (0.0%) |
| 25 to 29 Years | 0 (0.0%) | 0 (0.0%) |
| 30 to 34 Years | 0 (0.0%) | 0 (0.0%) |
| 35 to 39 Years | 2 (6.2%) | 0 (0.0%) |
| 40 to 44 Years | 0 (0.0%) | 7 (23.3%) |
| 45 to 49 Years | 3 (9.4%) | 3 (10.0%) |
| 50 to 54 Years | 0 (0.0%) | 0 (0.0%) |
| 55 to 59 Years | 2 (6.2%) | 4 (13.3%) |
| 60 to 64 Years | 1 (3.1%) | 4 (13.3%) |
| 65 to 69 Years | 7 (21.9%) | 0 (0.0%) |
| 70 to 74 Years | 1 (3.1%) | 1 (3.3%) |
| 75 to 79 Years | 5 (15.6%) | 0 (0.0%) |
| 80 to 84 Years | 0 (0.0%) | 4 (13.3%) |
| 85 Years and over | 0 (0.0%) | 2 (6.7%) |
| Total | 32 (100.0%) | 30 (100.0%) |
Families and Households in Flemington
Median Family Size in Flemington
The median family size in Flemington is 3.14 persons per family, with married-couple families (11 | 78.6%) accounting for the largest median family size of 3.45 persons per family. On the other hand, single male/father families (2 | 14.3%) represent the smallest median family size with 2.00 persons per family.
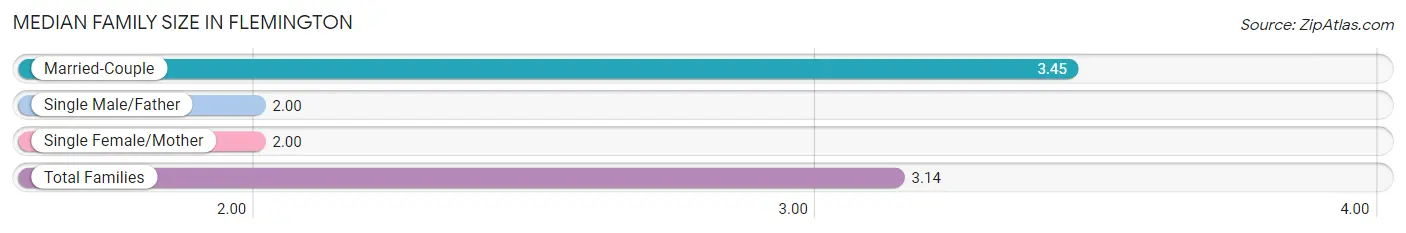
| Family Type | # Families | Family Size |
| Married-Couple | 11 (78.6%) | 3.45 |
| Single Male/Father | 2 (14.3%) | 2.00 |
| Single Female/Mother | 1 (7.1%) | 2.00 |
| Total Families | 14 (100.0%) | 3.14 |
Median Household Size in Flemington
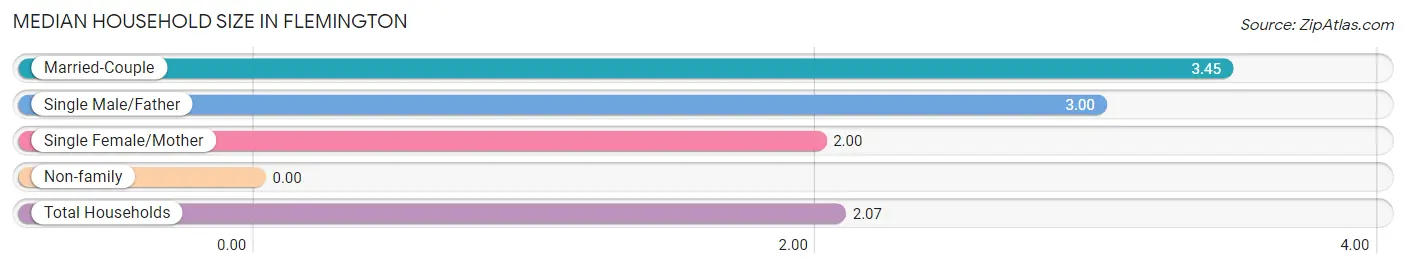
| Household Type | # Households | Household Size |
| Married-Couple | 11 (36.7%) | 3.45 |
| Single Male/Father | 2 (6.7%) | 3.00 |
| Single Female/Mother | 1 (3.3%) | 2.00 |
| Non-family | 16 (53.3%) | - |
| Total Households | 30 (100.0%) | 2.07 |
Household Size by Marriage Status in Flemington
Out of a total of 30 households in Flemington, 14 (46.7%) are family households, while 16 (53.3%) are nonfamily households. The most numerous type of family households are 2-person households, comprising 7, and the most common type of nonfamily households are 1-person households, comprising 16.
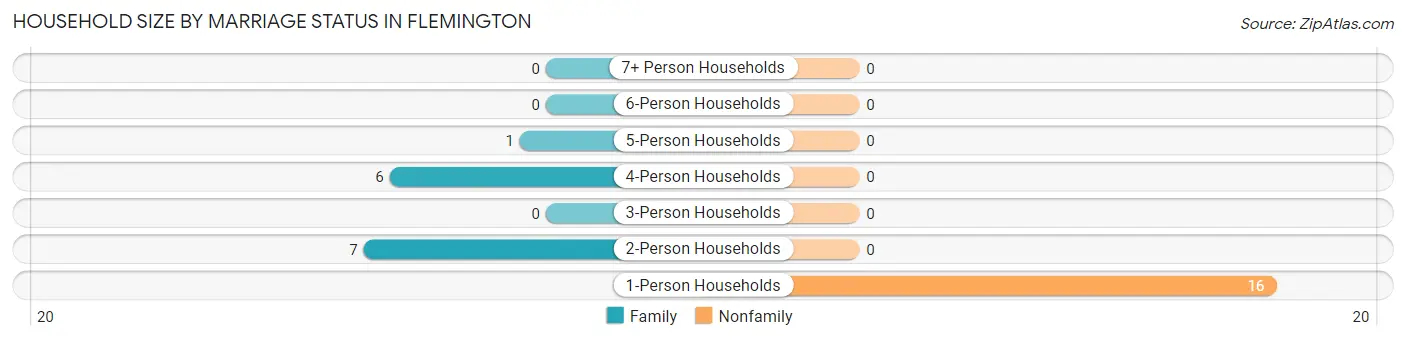
| Household Size | Family Households | Nonfamily Households |
| 1-Person Households | - | 16 (53.3%) |
| 2-Person Households | 7 (23.3%) | 0 (0.0%) |
| 3-Person Households | 0 (0.0%) | 0 (0.0%) |
| 4-Person Households | 6 (20.0%) | 0 (0.0%) |
| 5-Person Households | 1 (3.3%) | 0 (0.0%) |
| 6-Person Households | 0 (0.0%) | 0 (0.0%) |
| 7+ Person Households | 0 (0.0%) | 0 (0.0%) |
| Total | 14 (46.7%) | 16 (53.3%) |
Female Fertility in Flemington
Fertility by Age in Flemington
| Age Bracket | Women with Births | Births / 1,000 Women |
| 15 to 19 years | 0 (0.0%) | 0.0 |
| 20 to 34 years | 0 (0.0%) | 0.0 |
| 35 to 50 years | 0 (0.0%) | 0.0 |
| Total | 0 (0.0%) | 0.0 |
Fertility by Age by Marriage Status in Flemington
| Age Bracket | Married | Unmarried |
| 15 to 19 years | 0 (0.0%) | 0 (0.0%) |
| 20 to 34 years | 0 (0.0%) | 0 (0.0%) |
| 35 to 50 years | 0 (0.0%) | 0 (0.0%) |
| Total | 0 (0.0%) | 0 (0.0%) |
Fertility by Education in Flemington
| Educational Attainment | Women with Births | Births / 1,000 Women |
| Less than High School | 0 (0.0%) | 0.0 |
| High School Diploma | 0 (0.0%) | 0.0 |
| College or Associate's Degree | 0 (0.0%) | 0.0 |
| Bachelor's Degree | 0 (0.0%) | 0.0 |
| Graduate Degree | 0 (0.0%) | 0.0 |
| Total | 0 (0.0%) | 0.0 |
Fertility by Education by Marriage Status in Flemington
| Educational Attainment | Married | Unmarried |
| Less than High School | 0 (0.0%) | 0 (0.0%) |
| High School Diploma | 0 (0.0%) | 0 (0.0%) |
| College or Associate's Degree | 0 (0.0%) | 0 (0.0%) |
| Bachelor's Degree | 0 (0.0%) | 0 (0.0%) |
| Graduate Degree | 0 (0.0%) | 0 (0.0%) |
| Total | 0 (0.0%) | 0 (0.0%) |
Employment Characteristics in Flemington
Employment by Class of Employer in Flemington
Among the 17 employed individuals in Flemington, private company employees (9 | 52.9%), local government employees (4 | 23.5%), and self-employed (not incorporated) (3 | 17.6%) make up the most common classes of employment.
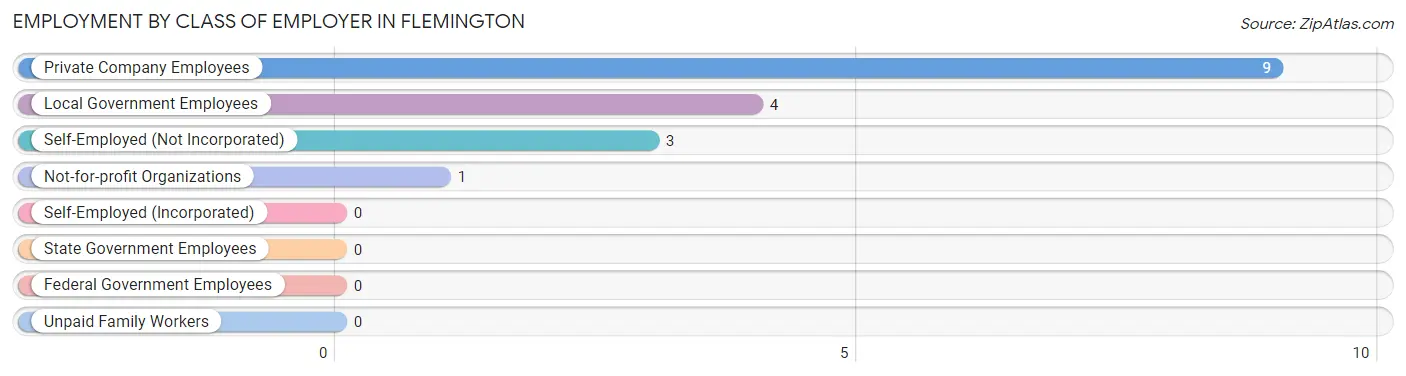
| Employer Class | # Employees | % Employees |
| Private Company Employees | 9 | 52.9% |
| Self-Employed (Incorporated) | 0 | 0.0% |
| Self-Employed (Not Incorporated) | 3 | 17.6% |
| Not-for-profit Organizations | 1 | 5.9% |
| Local Government Employees | 4 | 23.5% |
| State Government Employees | 0 | 0.0% |
| Federal Government Employees | 0 | 0.0% |
| Unpaid Family Workers | 0 | 0.0% |
| Total | 17 | 100.0% |
Employment Status by Age in Flemington
According to the labor force statistics for Flemington, out of the total population over 16 years of age (58), 31.0% or 18 individuals are in the labor force, with 5.6% or 1 of them unemployed. The age group with the highest labor force participation rate is 35 to 44 years, with 77.8% or 7 individuals in the labor force. Within the labor force, the 16 to 19 years age range has the highest percentage of unemployed individuals, with 33.3% or 1 of them being unemployed.
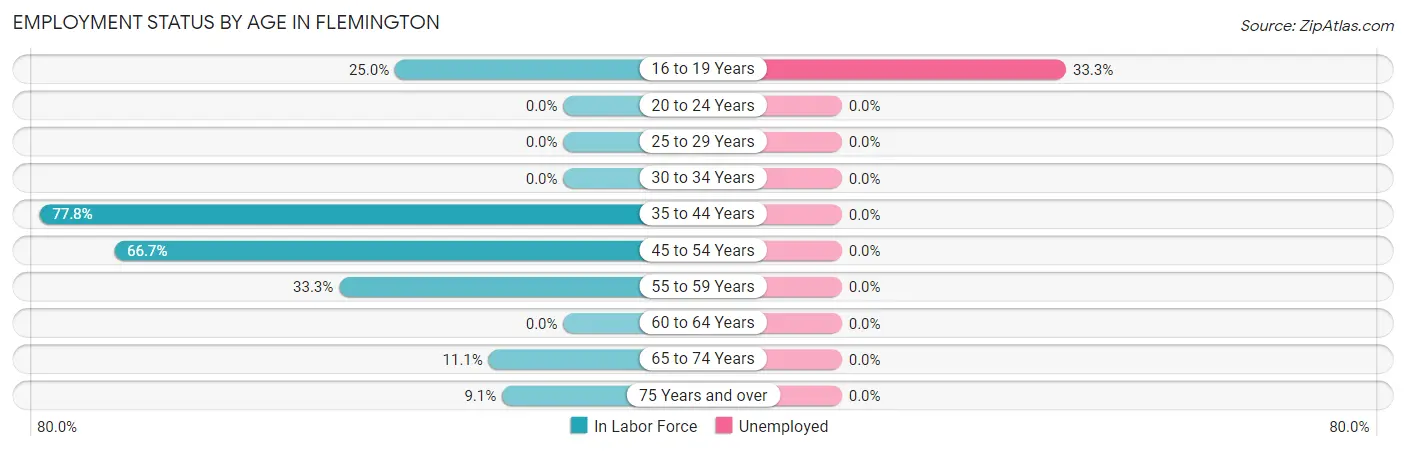
| Age Bracket | In Labor Force | Unemployed |
| 16 to 19 Years | 3 (25.0%) | 1 (33.3%) |
| 20 to 24 Years | 0 (0.0%) | 0 (0.0%) |
| 25 to 29 Years | 0 (0.0%) | 0 (0.0%) |
| 30 to 34 Years | 0 (0.0%) | 0 (0.0%) |
| 35 to 44 Years | 7 (77.8%) | 0 (0.0%) |
| 45 to 54 Years | 4 (66.7%) | 0 (0.0%) |
| 55 to 59 Years | 2 (33.3%) | 0 (0.0%) |
| 60 to 64 Years | 0 (0.0%) | 0 (0.0%) |
| 65 to 74 Years | 1 (11.1%) | 0 (0.0%) |
| 75 Years and over | 1 (9.1%) | 0 (0.0%) |
| Total | 18 (31.0%) | 1 (5.6%) |
Employment Status by Educational Attainment in Flemington
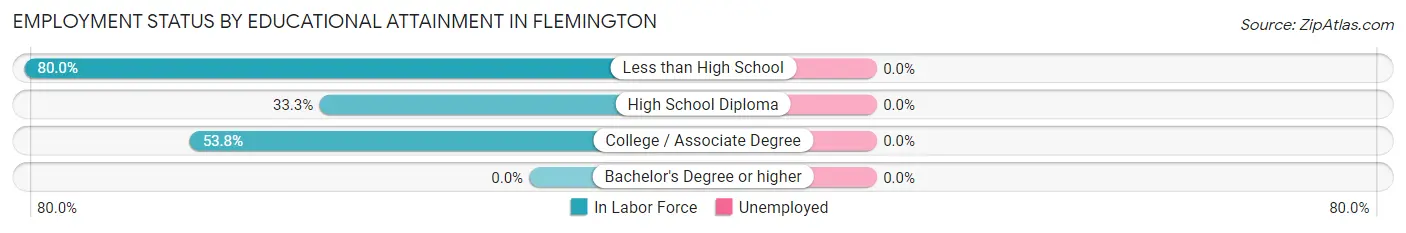
| Educational Attainment | In Labor Force | Unemployed |
| Less than High School | 4 (80.0%) | 0 (0.0%) |
| High School Diploma | 2 (33.3%) | 0 (0.0%) |
| College / Associate Degree | 7 (53.8%) | 0 (0.0%) |
| Bachelor's Degree or higher | 0 (0.0%) | 0 (0.0%) |
| Total | 13 (50.0%) | 0 (0.0%) |
Employment Occupations by Sex in Flemington
Management, Business, Science and Arts Occupations
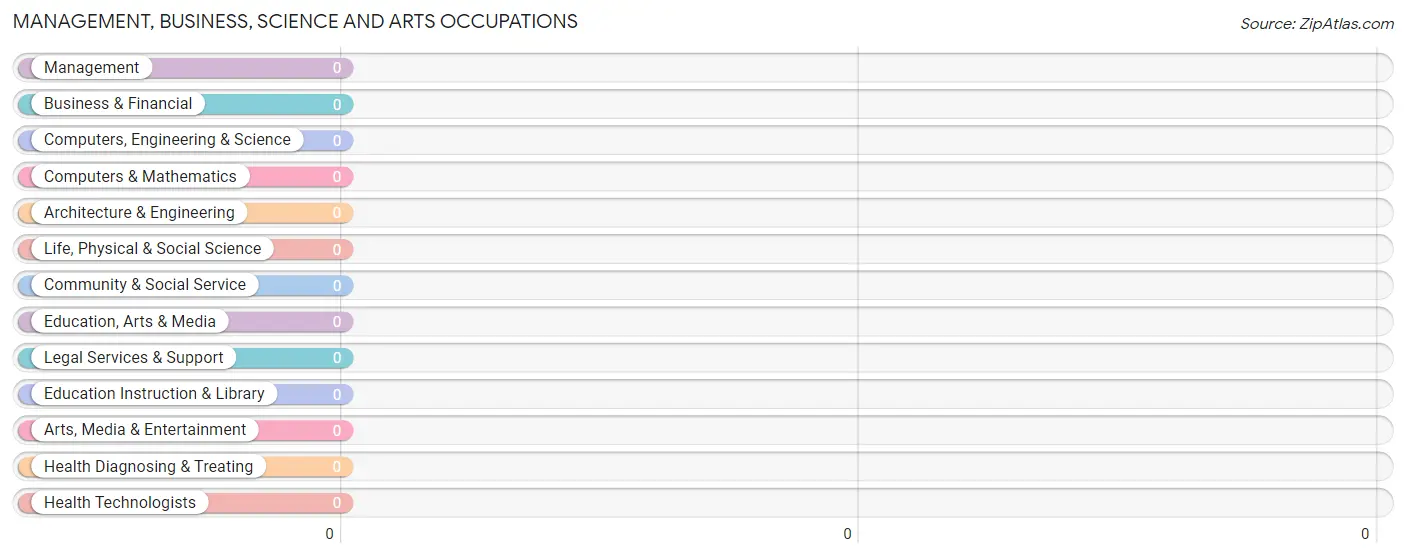
Management, Business, Science and Arts Occupations by Sex
| Occupation | Male | Female |
| Management | 0 (0.0%) | 0 (0.0%) |
| Business & Financial | 0 (0.0%) | 0 (0.0%) |
| Computers, Engineering & Science | 0 (0.0%) | 0 (0.0%) |
| Computers & Mathematics | 0 (0.0%) | 0 (0.0%) |
| Architecture & Engineering | 0 (0.0%) | 0 (0.0%) |
| Life, Physical & Social Science | 0 (0.0%) | 0 (0.0%) |
| Community & Social Service | 0 (0.0%) | 0 (0.0%) |
| Education, Arts & Media | 0 (0.0%) | 0 (0.0%) |
| Legal Services & Support | 0 (0.0%) | 0 (0.0%) |
| Education Instruction & Library | 0 (0.0%) | 0 (0.0%) |
| Arts, Media & Entertainment | 0 (0.0%) | 0 (0.0%) |
| Health Diagnosing & Treating | 0 (0.0%) | 0 (0.0%) |
| Health Technologists | 0 (0.0%) | 0 (0.0%) |
| Total (Category) | 0 (0.0%) | 0 (0.0%) |
| Total (Overall) | 8 (47.1%) | 9 (52.9%) |
Services Occupations
The most common Services occupations in Flemington are , and Cleaning & Maintenance (2 | 11.8%).
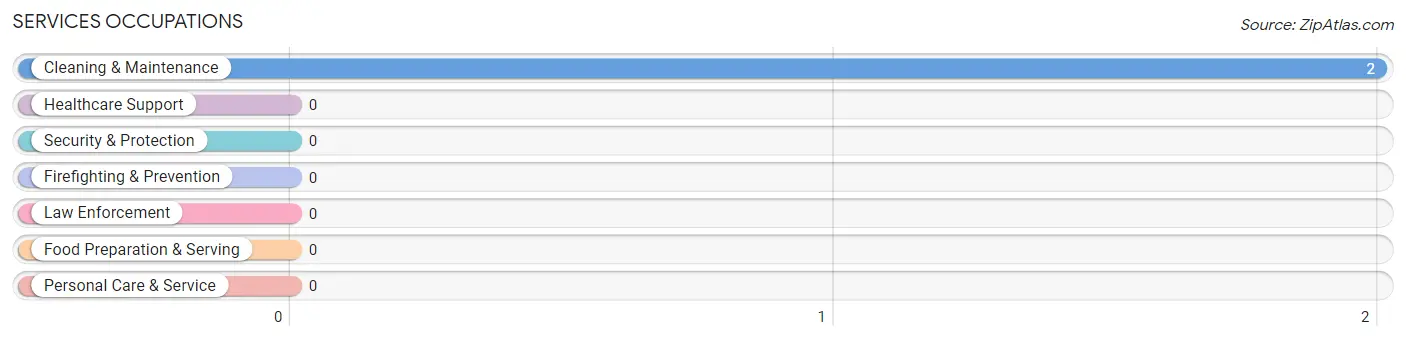
Services Occupations by Sex
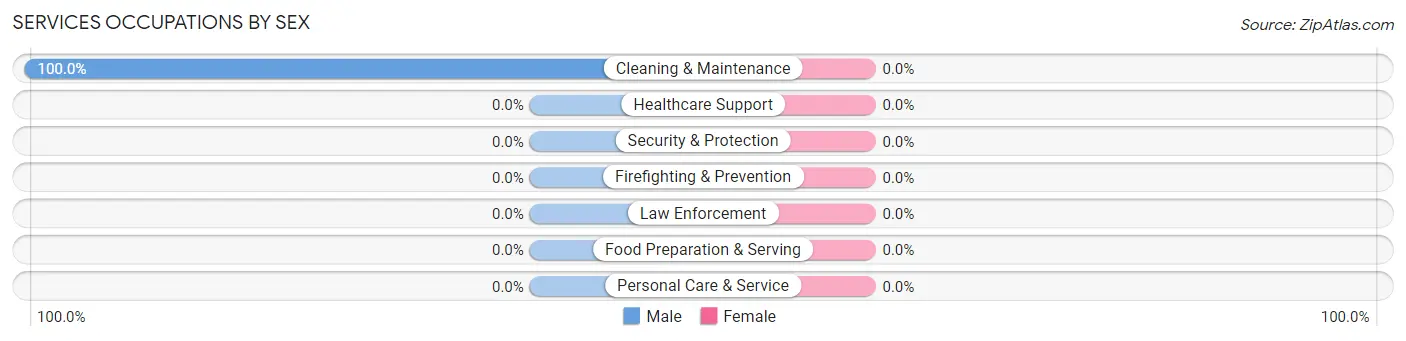
| Occupation | Male | Female |
| Healthcare Support | 0 (0.0%) | 0 (0.0%) |
| Security & Protection | 0 (0.0%) | 0 (0.0%) |
| Firefighting & Prevention | 0 (0.0%) | 0 (0.0%) |
| Law Enforcement | 0 (0.0%) | 0 (0.0%) |
| Food Preparation & Serving | 0 (0.0%) | 0 (0.0%) |
| Cleaning & Maintenance | 2 (100.0%) | 0 (0.0%) |
| Personal Care & Service | 0 (0.0%) | 0 (0.0%) |
| Total (Category) | 2 (100.0%) | 0 (0.0%) |
| Total (Overall) | 8 (47.1%) | 9 (52.9%) |
Sales and Office Occupations
The most common Sales and Office occupations in Flemington are Office & Administration (6 | 35.3%), and Sales & Related (3 | 17.6%).
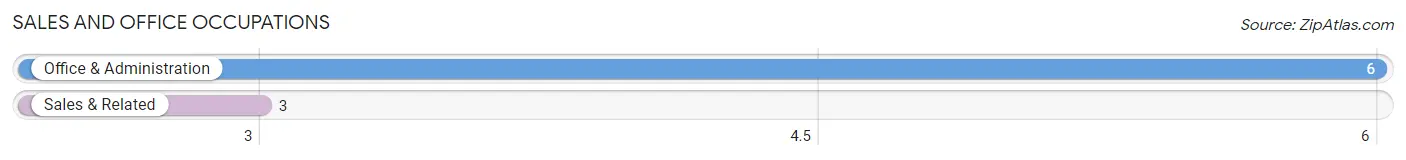
Sales and Office Occupations by Sex
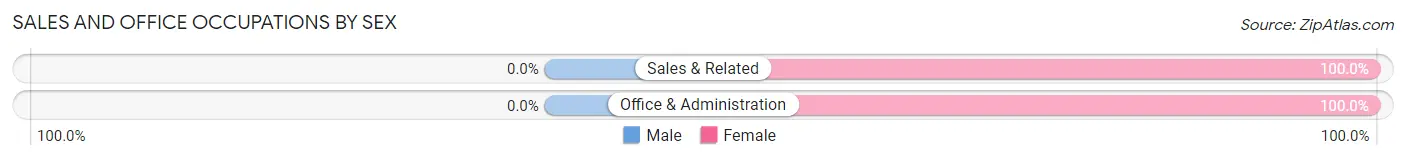
| Occupation | Male | Female |
| Sales & Related | 0 (0.0%) | 3 (100.0%) |
| Office & Administration | 0 (0.0%) | 6 (100.0%) |
| Total (Category) | 0 (0.0%) | 9 (100.0%) |
| Total (Overall) | 8 (47.1%) | 9 (52.9%) |
Natural Resources, Construction and Maintenance Occupations
The most common Natural Resources, Construction and Maintenance occupations in Flemington are Installation, Maintenance & Repair (3 | 17.6%), and Construction & Extraction (2 | 11.8%).
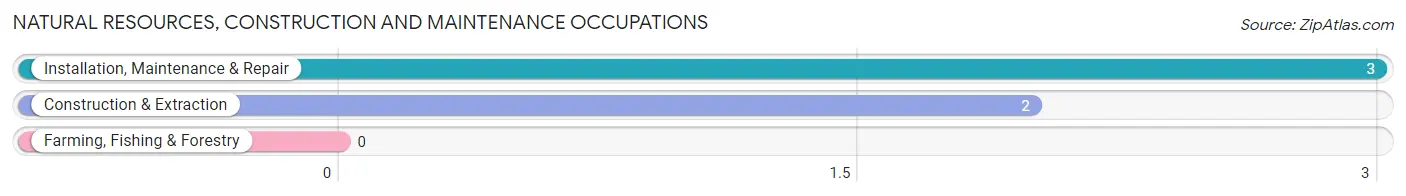
Natural Resources, Construction and Maintenance Occupations by Sex
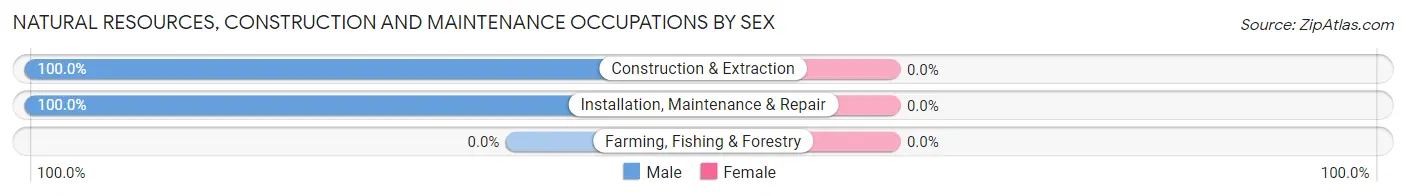
| Occupation | Male | Female |
| Farming, Fishing & Forestry | 0 (0.0%) | 0 (0.0%) |
| Construction & Extraction | 2 (100.0%) | 0 (0.0%) |
| Installation, Maintenance & Repair | 3 (100.0%) | 0 (0.0%) |
| Total (Category) | 5 (100.0%) | 0 (0.0%) |
| Total (Overall) | 8 (47.1%) | 9 (52.9%) |
Production, Transportation and Moving Occupations
The most common Production, Transportation and Moving occupations in Flemington are , and Transportation (1 | 5.9%).
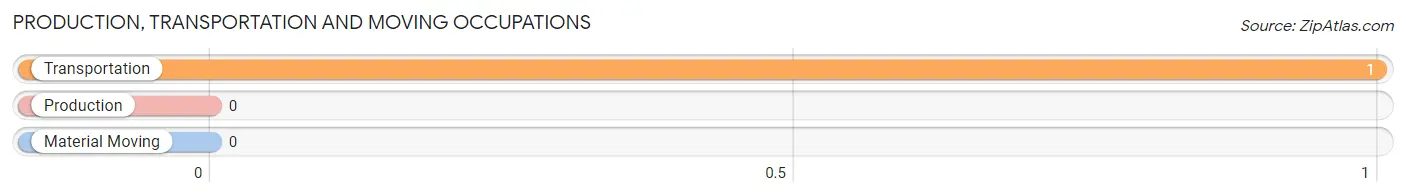
Production, Transportation and Moving Occupations by Sex
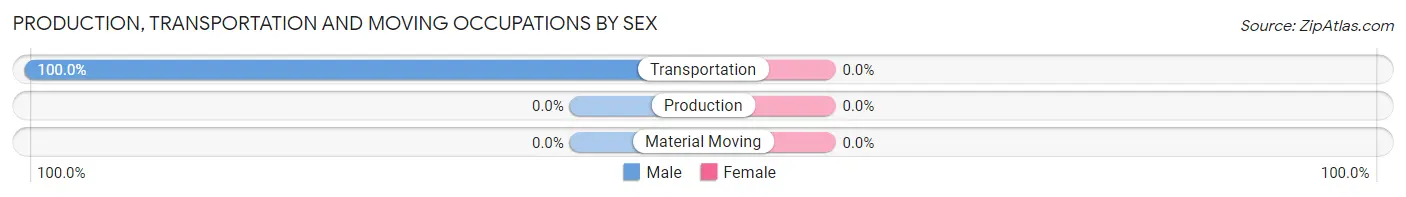
| Occupation | Male | Female |
| Production | 0 (0.0%) | 0 (0.0%) |
| Transportation | 1 (100.0%) | 0 (0.0%) |
| Material Moving | 0 (0.0%) | 0 (0.0%) |
| Total (Category) | 1 (100.0%) | 0 (0.0%) |
| Total (Overall) | 8 (47.1%) | 9 (52.9%) |
Employment Industries by Sex in Flemington
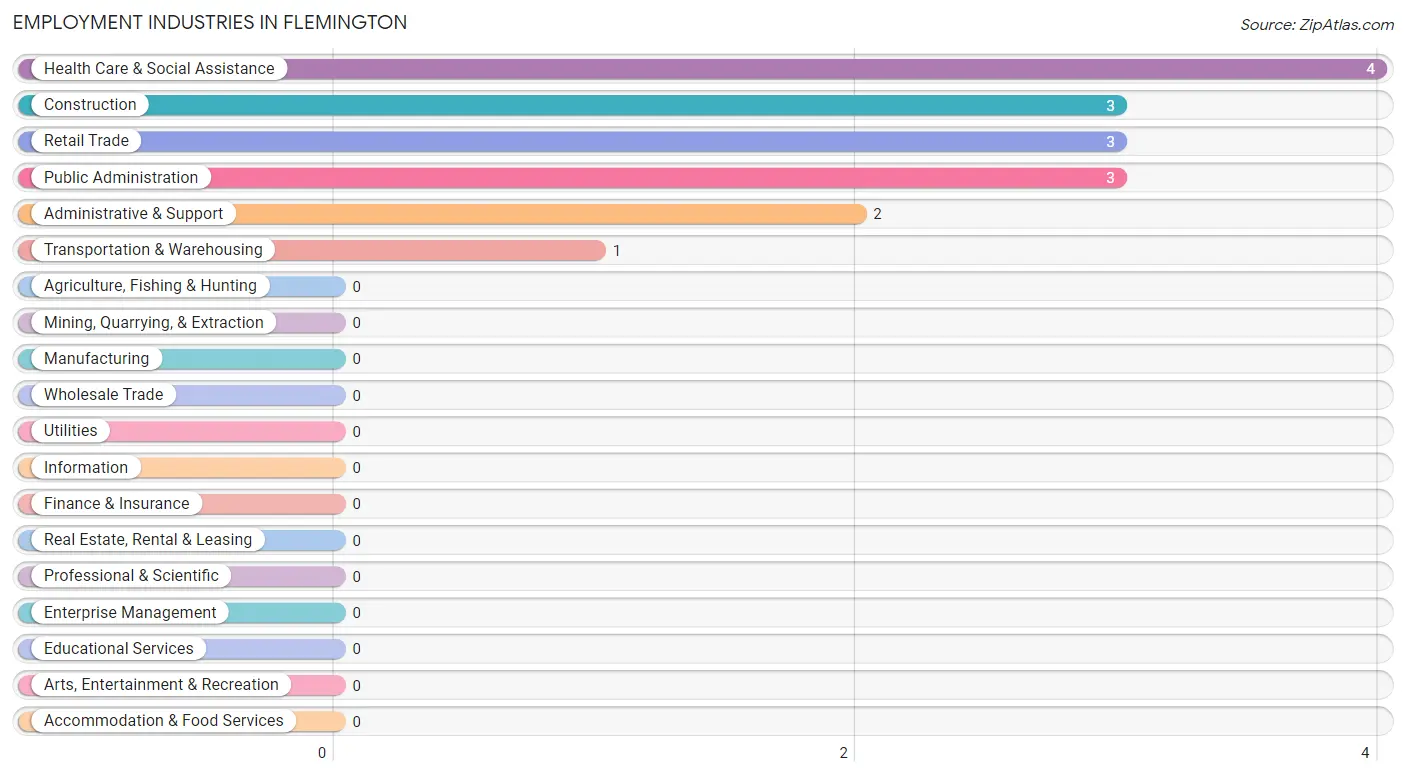
Employment Industries in Flemington
The major employment industries in Flemington include Health Care & Social Assistance (4 | 23.5%), Construction (3 | 17.6%), Retail Trade (3 | 17.6%), Public Administration (3 | 17.6%), and Administrative & Support (2 | 11.8%).
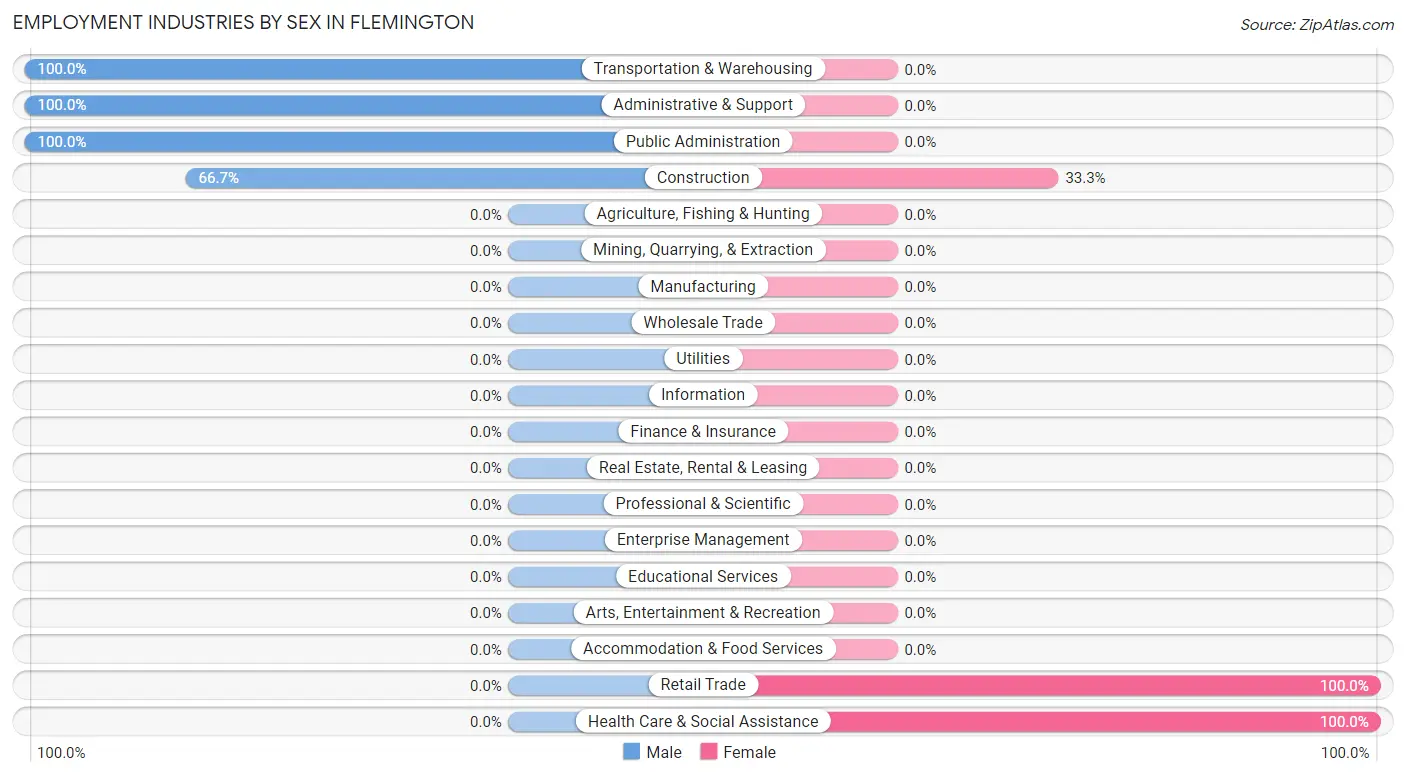
Employment Industries by Sex in Flemington
The Flemington industries that see more men than women are Transportation & Warehousing (100.0%), Administrative & Support (100.0%), and Public Administration (100.0%), whereas the industries that tend to have a higher number of women are Retail Trade (100.0%), Health Care & Social Assistance (100.0%), and Construction (33.3%).
| Industry | Male | Female |
| Agriculture, Fishing & Hunting | 0 (0.0%) | 0 (0.0%) |
| Mining, Quarrying, & Extraction | 0 (0.0%) | 0 (0.0%) |
| Construction | 2 (66.7%) | 1 (33.3%) |
| Manufacturing | 0 (0.0%) | 0 (0.0%) |
| Wholesale Trade | 0 (0.0%) | 0 (0.0%) |
| Retail Trade | 0 (0.0%) | 3 (100.0%) |
| Transportation & Warehousing | 1 (100.0%) | 0 (0.0%) |
| Utilities | 0 (0.0%) | 0 (0.0%) |
| Information | 0 (0.0%) | 0 (0.0%) |
| Finance & Insurance | 0 (0.0%) | 0 (0.0%) |
| Real Estate, Rental & Leasing | 0 (0.0%) | 0 (0.0%) |
| Professional & Scientific | 0 (0.0%) | 0 (0.0%) |
| Enterprise Management | 0 (0.0%) | 0 (0.0%) |
| Administrative & Support | 2 (100.0%) | 0 (0.0%) |
| Educational Services | 0 (0.0%) | 0 (0.0%) |
| Health Care & Social Assistance | 0 (0.0%) | 4 (100.0%) |
| Arts, Entertainment & Recreation | 0 (0.0%) | 0 (0.0%) |
| Accommodation & Food Services | 0 (0.0%) | 0 (0.0%) |
| Public Administration | 3 (100.0%) | 0 (0.0%) |
| Total | 8 (47.1%) | 9 (52.9%) |
Education in Flemington
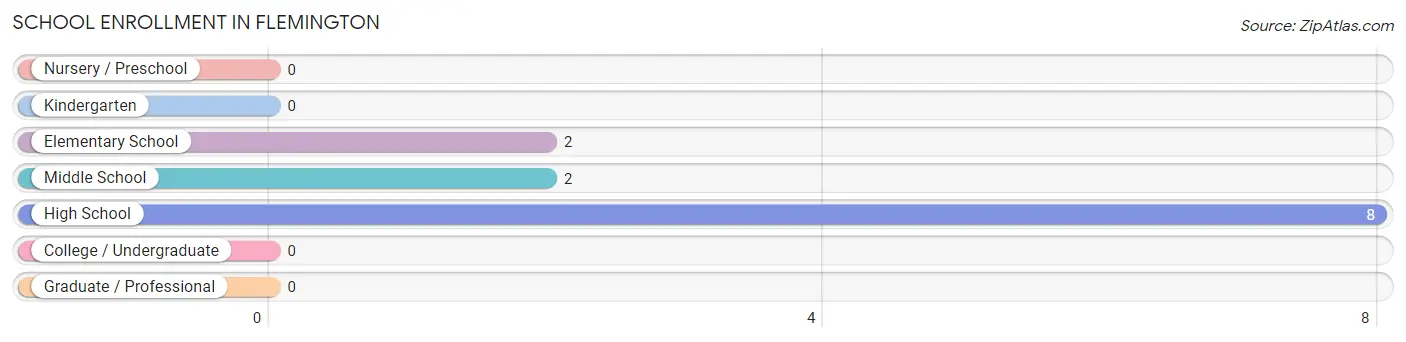
School Enrollment in Flemington
The most common levels of schooling among the 12 students in Flemington are high school (8 | 66.7%), elementary school (2 | 16.7%), and middle school (2 | 16.7%).
| School Level | # Students | % Students |
| Nursery / Preschool | 0 | 0.0% |
| Kindergarten | 0 | 0.0% |
| Elementary School | 2 | 16.7% |
| Middle School | 2 | 16.7% |
| High School | 8 | 66.7% |
| College / Undergraduate | 0 | 0.0% |
| Graduate / Professional | 0 | 0.0% |
| Total | 12 | 100.0% |
School Enrollment by Age by Funding Source in Flemington

| Age Bracket | Public School | Private School |
| 3 to 4 Year Olds | 0 (0.0%) | 0 (0.0%) |
| 5 to 9 Year Old | 2 (100.0%) | 0 (0.0%) |
| 10 to 14 Year Olds | 2 (100.0%) | 0 (0.0%) |
| 15 to 17 Year Olds | 4 (100.0%) | 0 (0.0%) |
| 18 to 19 Year Olds | 4 (100.0%) | 0 (0.0%) |
| 20 to 24 Year Olds | 0 (0.0%) | 0 (0.0%) |
| 25 to 34 Year Olds | 0 (0.0%) | 0 (0.0%) |
| 35 Years and over | 0 (0.0%) | 0 (0.0%) |
| Total | 12 (100.0%) | 0 (0.0%) |
Educational Attainment by Field of Study in Flemington
, and psychology (2 | 100.0%) are the most common fields of study among 2 individuals in Flemington who have obtained a bachelor's degree or higher.
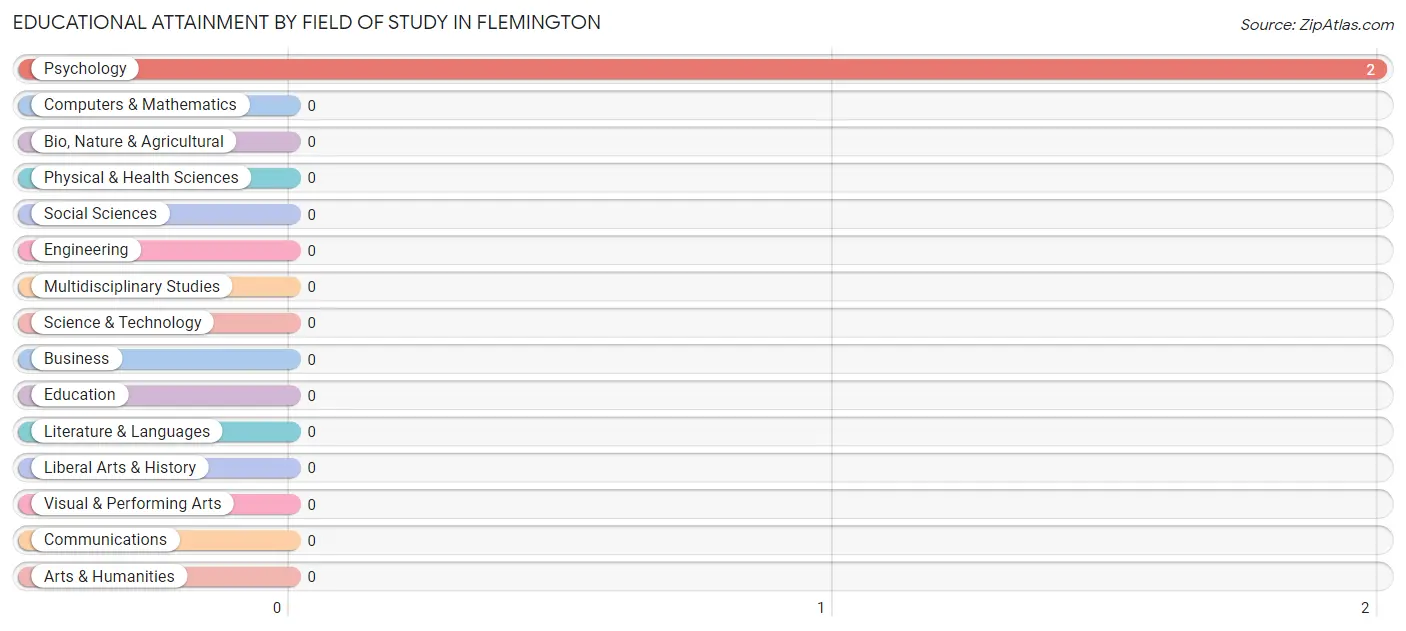
| Field of Study | # Graduates | % Graduates |
| Computers & Mathematics | 0 | 0.0% |
| Bio, Nature & Agricultural | 0 | 0.0% |
| Physical & Health Sciences | 0 | 0.0% |
| Psychology | 2 | 100.0% |
| Social Sciences | 0 | 0.0% |
| Engineering | 0 | 0.0% |
| Multidisciplinary Studies | 0 | 0.0% |
| Science & Technology | 0 | 0.0% |
| Business | 0 | 0.0% |
| Education | 0 | 0.0% |
| Literature & Languages | 0 | 0.0% |
| Liberal Arts & History | 0 | 0.0% |
| Visual & Performing Arts | 0 | 0.0% |
| Communications | 0 | 0.0% |
| Arts & Humanities | 0 | 0.0% |
| Total | 2 | 100.0% |
Transportation & Commute in Flemington
Vehicle Availability by Sex in Flemington
The most prevalent vehicle ownership categories in Flemington are males with 2 vehicles (3, accounting for 37.5%) and females with 2 vehicles (0, making up 33.3%).
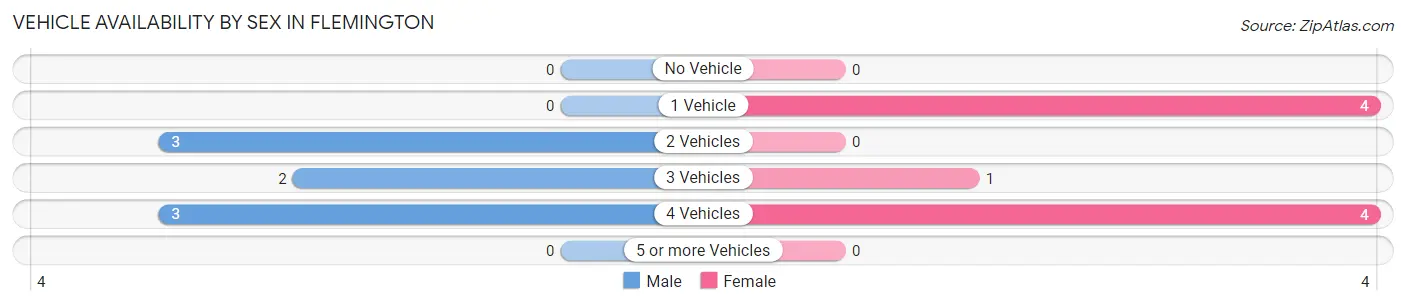
| Vehicles Available | Male | Female |
| No Vehicle | 0 (0.0%) | 0 (0.0%) |
| 1 Vehicle | 0 (0.0%) | 4 (44.4%) |
| 2 Vehicles | 3 (37.5%) | 0 (0.0%) |
| 3 Vehicles | 2 (25.0%) | 1 (11.1%) |
| 4 Vehicles | 3 (37.5%) | 4 (44.4%) |
| 5 or more Vehicles | 0 (0.0%) | 0 (0.0%) |
| Total | 8 (100.0%) | 9 (100.0%) |
Commute Time in Flemington
The most frequently occuring commute durations in Flemington are 25 to 29 minutes (4 commuters, 25.0%), 30 to 34 minutes (3 commuters, 18.8%), and 60 to 89 minutes (3 commuters, 18.8%).
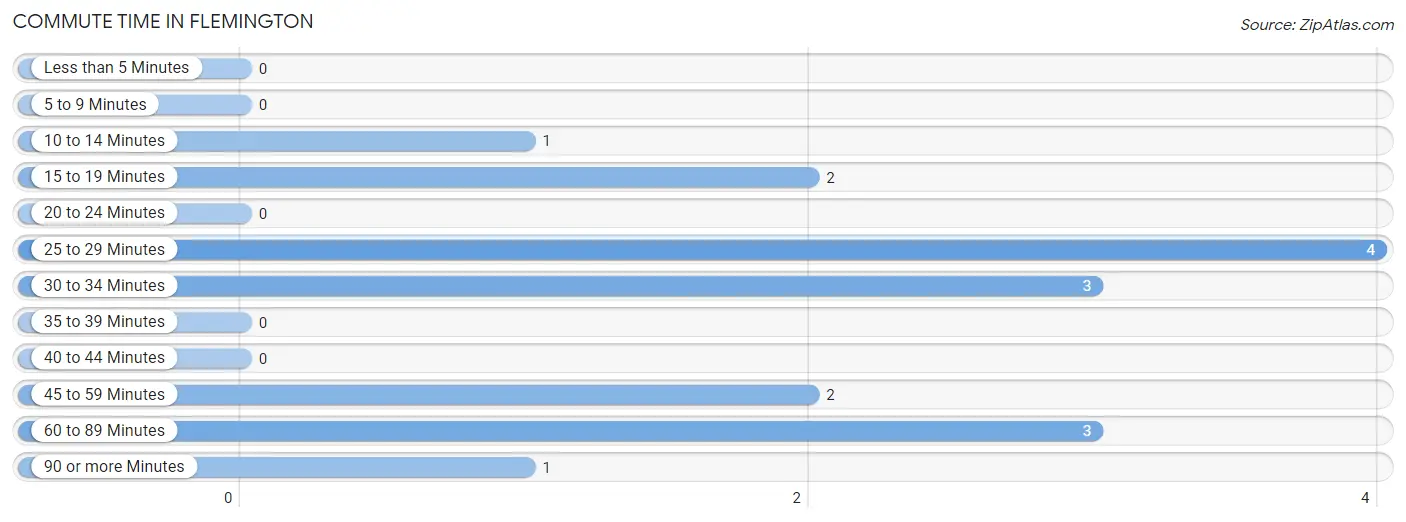
| Commute Time | # Commuters | % Commuters |
| Less than 5 Minutes | 0 | 0.0% |
| 5 to 9 Minutes | 0 | 0.0% |
| 10 to 14 Minutes | 1 | 6.2% |
| 15 to 19 Minutes | 2 | 12.5% |
| 20 to 24 Minutes | 0 | 0.0% |
| 25 to 29 Minutes | 4 | 25.0% |
| 30 to 34 Minutes | 3 | 18.8% |
| 35 to 39 Minutes | 0 | 0.0% |
| 40 to 44 Minutes | 0 | 0.0% |
| 45 to 59 Minutes | 2 | 12.5% |
| 60 to 89 Minutes | 3 | 18.8% |
| 90 or more Minutes | 1 | 6.2% |
Commute Time by Sex in Flemington
The most common commute times in Flemington are 60 to 89 minutes (3 commuters, 37.5%) for males and 25 to 29 minutes (4 commuters, 50.0%) for females.
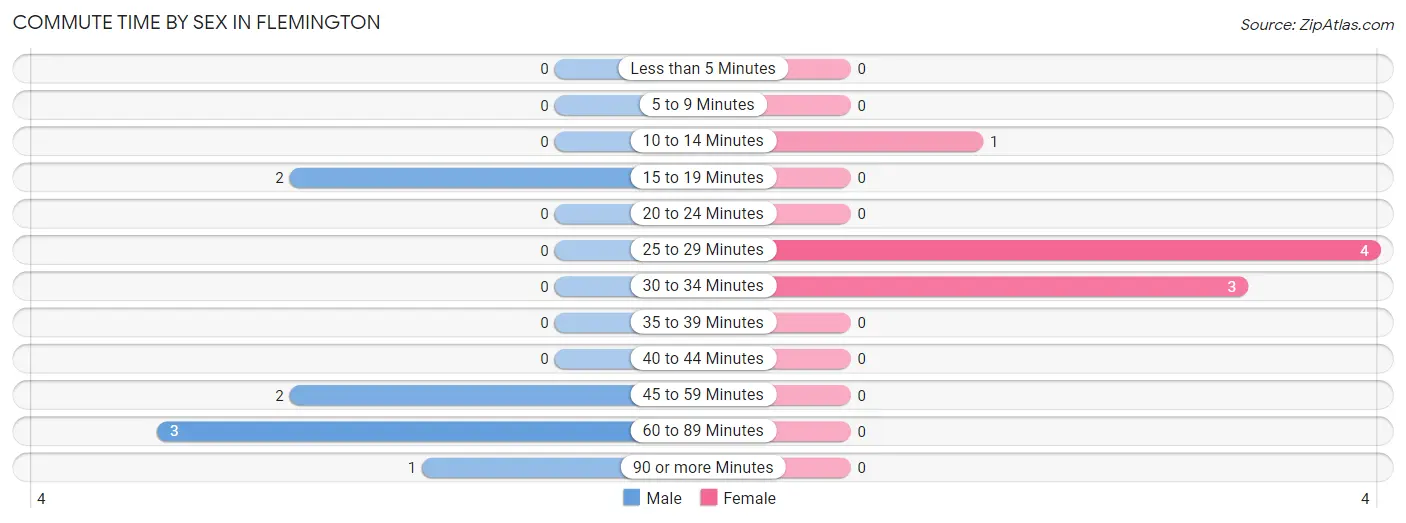
| Commute Time | Male | Female |
| Less than 5 Minutes | 0 (0.0%) | 0 (0.0%) |
| 5 to 9 Minutes | 0 (0.0%) | 0 (0.0%) |
| 10 to 14 Minutes | 0 (0.0%) | 1 (12.5%) |
| 15 to 19 Minutes | 2 (25.0%) | 0 (0.0%) |
| 20 to 24 Minutes | 0 (0.0%) | 0 (0.0%) |
| 25 to 29 Minutes | 0 (0.0%) | 4 (50.0%) |
| 30 to 34 Minutes | 0 (0.0%) | 3 (37.5%) |
| 35 to 39 Minutes | 0 (0.0%) | 0 (0.0%) |
| 40 to 44 Minutes | 0 (0.0%) | 0 (0.0%) |
| 45 to 59 Minutes | 2 (25.0%) | 0 (0.0%) |
| 60 to 89 Minutes | 3 (37.5%) | 0 (0.0%) |
| 90 or more Minutes | 1 (12.5%) | 0 (0.0%) |
Time of Departure to Work by Sex in Flemington
The most frequent times of departure to work in Flemington are 6:00 AM to 6:29 AM (3, 37.5%) for males and 6:00 AM to 6:29 AM (4, 50.0%) for females.
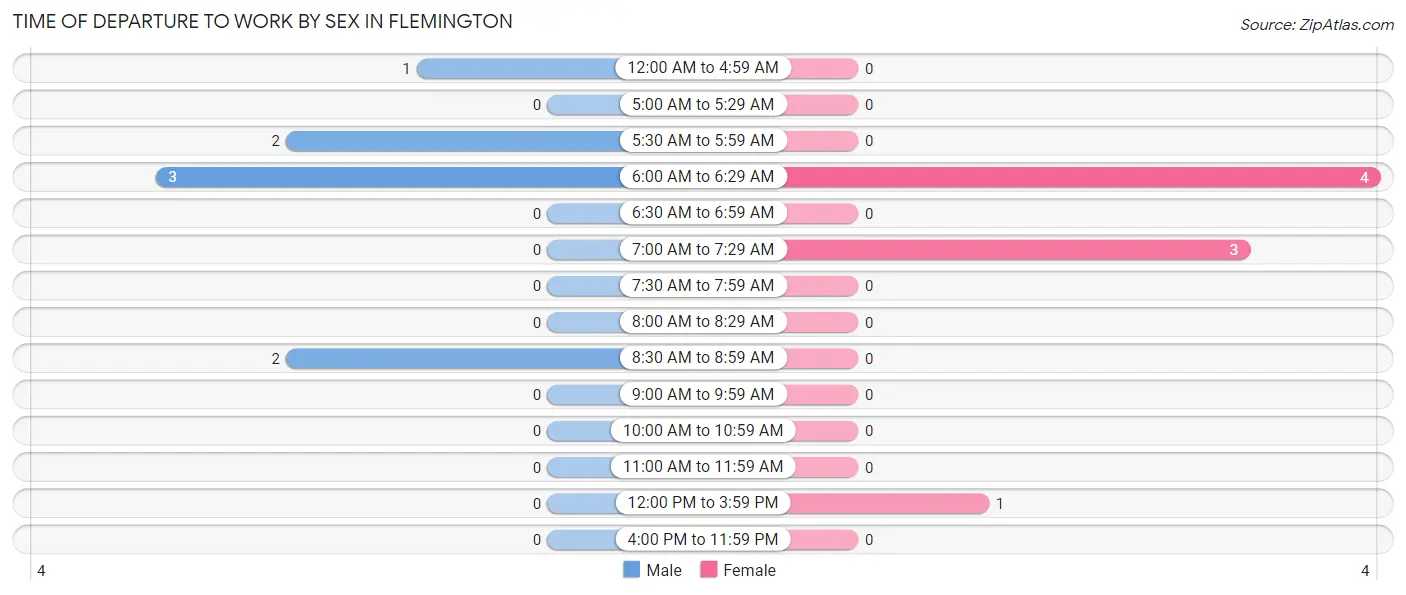
| Time of Departure | Male | Female |
| 12:00 AM to 4:59 AM | 1 (12.5%) | 0 (0.0%) |
| 5:00 AM to 5:29 AM | 0 (0.0%) | 0 (0.0%) |
| 5:30 AM to 5:59 AM | 2 (25.0%) | 0 (0.0%) |
| 6:00 AM to 6:29 AM | 3 (37.5%) | 4 (50.0%) |
| 6:30 AM to 6:59 AM | 0 (0.0%) | 0 (0.0%) |
| 7:00 AM to 7:29 AM | 0 (0.0%) | 3 (37.5%) |
| 7:30 AM to 7:59 AM | 0 (0.0%) | 0 (0.0%) |
| 8:00 AM to 8:29 AM | 0 (0.0%) | 0 (0.0%) |
| 8:30 AM to 8:59 AM | 2 (25.0%) | 0 (0.0%) |
| 9:00 AM to 9:59 AM | 0 (0.0%) | 0 (0.0%) |
| 10:00 AM to 10:59 AM | 0 (0.0%) | 0 (0.0%) |
| 11:00 AM to 11:59 AM | 0 (0.0%) | 0 (0.0%) |
| 12:00 PM to 3:59 PM | 0 (0.0%) | 1 (12.5%) |
| 4:00 PM to 11:59 PM | 0 (0.0%) | 0 (0.0%) |
| Total | 8 (100.0%) | 8 (100.0%) |
Housing Occupancy in Flemington
Occupancy by Ownership in Flemington
Of the total 30 dwellings in Flemington, owner-occupied units account for 25 (83.3%), while renter-occupied units make up 5 (16.7%).
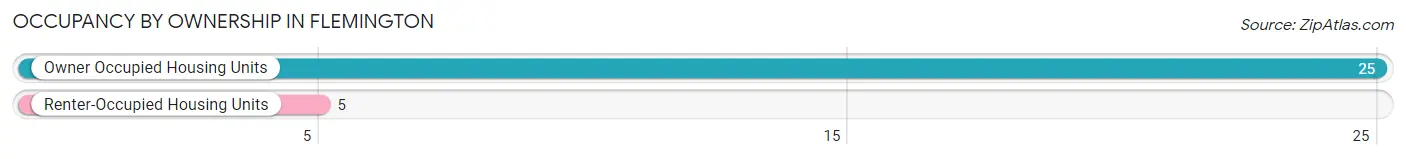
| Occupancy | # Housing Units | % Housing Units |
| Owner Occupied Housing Units | 25 | 83.3% |
| Renter-Occupied Housing Units | 5 | 16.7% |
| Total Occupied Housing Units | 30 | 100.0% |
Occupancy by Household Size in Flemington
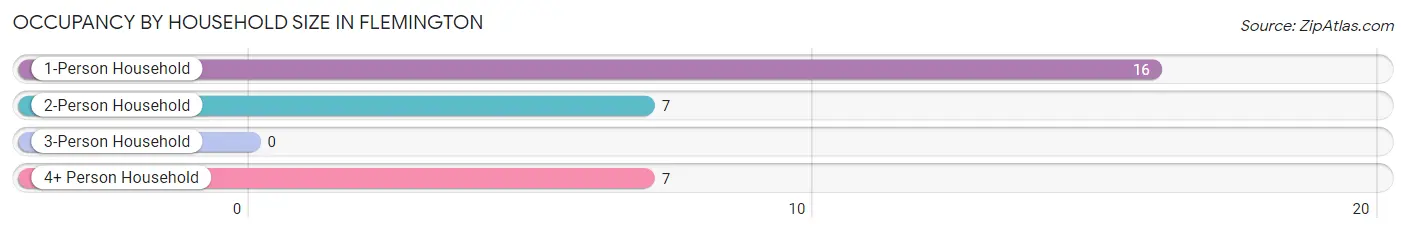
| Household Size | # Housing Units | % Housing Units |
| 1-Person Household | 16 | 53.3% |
| 2-Person Household | 7 | 23.3% |
| 3-Person Household | 0 | 0.0% |
| 4+ Person Household | 7 | 23.3% |
| Total Housing Units | 30 | 100.0% |
Occupancy by Ownership by Household Size in Flemington
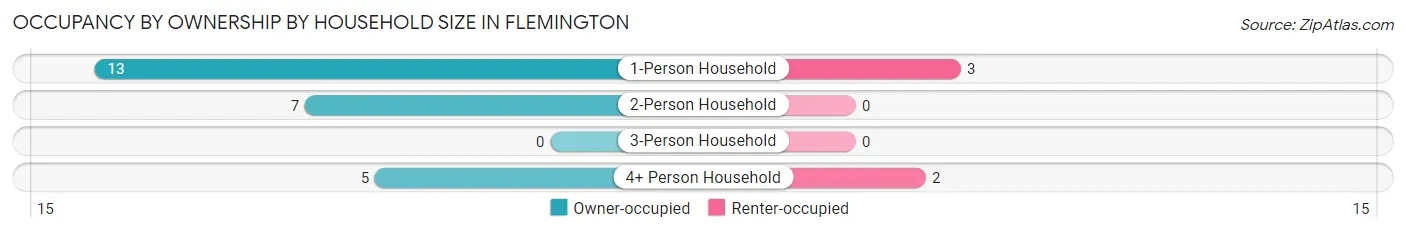
| Household Size | Owner-occupied | Renter-occupied |
| 1-Person Household | 13 (81.2%) | 3 (18.8%) |
| 2-Person Household | 7 (100.0%) | 0 (0.0%) |
| 3-Person Household | 0 (0.0%) | 0 (0.0%) |
| 4+ Person Household | 5 (71.4%) | 2 (28.6%) |
| Total Housing Units | 25 (83.3%) | 5 (16.7%) |
Occupancy by Educational Attainment in Flemington
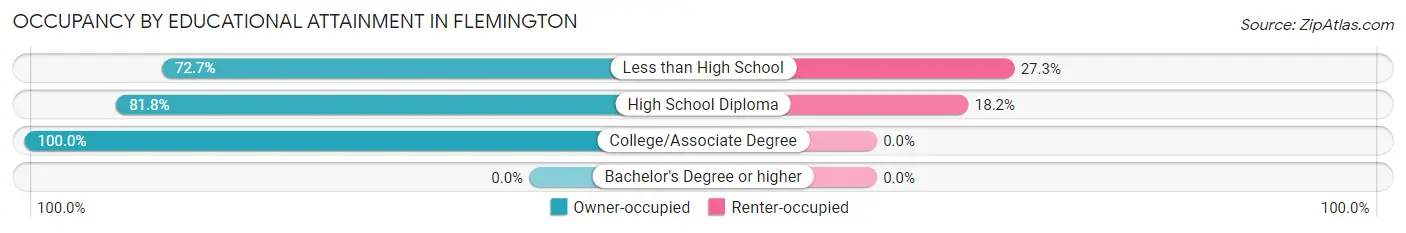
| Household Size | Owner-occupied | Renter-occupied |
| Less than High School | 8 (72.7%) | 3 (27.3%) |
| High School Diploma | 9 (81.8%) | 2 (18.2%) |
| College/Associate Degree | 8 (100.0%) | 0 (0.0%) |
| Bachelor's Degree or higher | 0 (0.0%) | 0 (0.0%) |
Occupancy by Age of Householder in Flemington
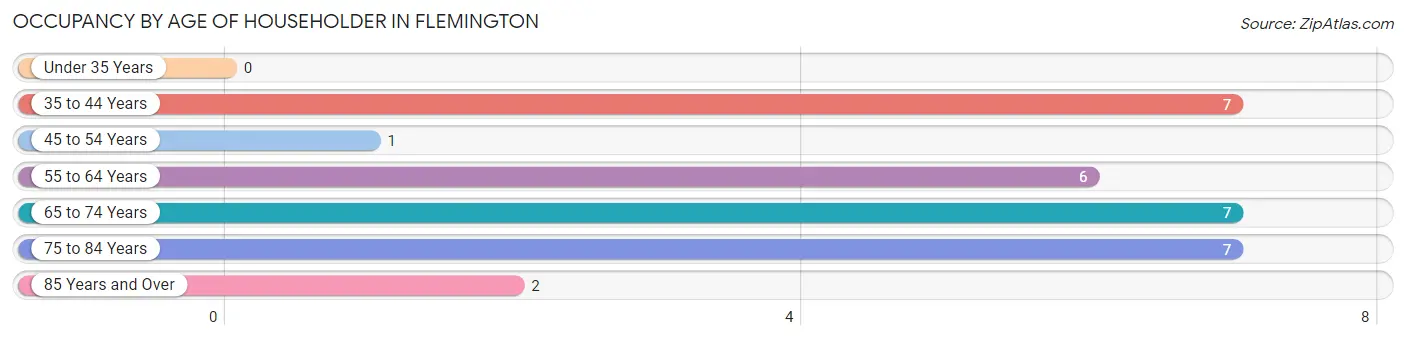
| Age Bracket | # Households | % Households |
| Under 35 Years | 0 | 0.0% |
| 35 to 44 Years | 7 | 23.3% |
| 45 to 54 Years | 1 | 3.3% |
| 55 to 64 Years | 6 | 20.0% |
| 65 to 74 Years | 7 | 23.3% |
| 75 to 84 Years | 7 | 23.3% |
| 85 Years and Over | 2 | 6.7% |
| Total | 30 | 100.0% |
Housing Finances in Flemington
Median Income by Occupancy in Flemington
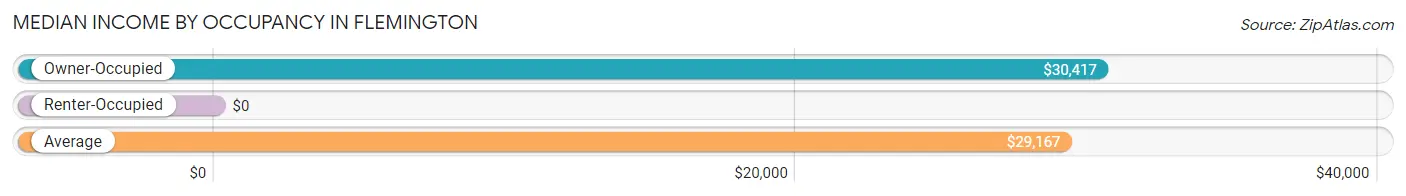
| Occupancy Type | # Households | Median Income |
| Owner-Occupied | 25 (83.3%) | $30,417 |
| Renter-Occupied | 5 (16.7%) | $0 |
| Average | 30 (100.0%) | $29,167 |
Occupancy by Householder Income Bracket in Flemington
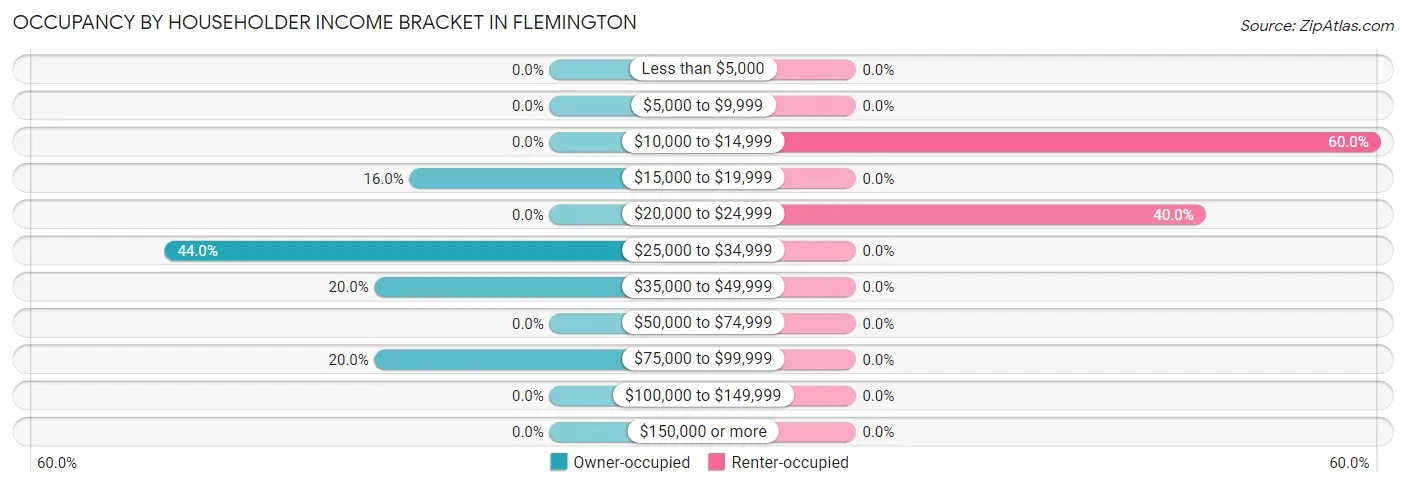
| Income Bracket | Owner-occupied | Renter-occupied |
| Less than $5,000 | 0 (0.0%) | 0 (0.0%) |
| $5,000 to $9,999 | 0 (0.0%) | 0 (0.0%) |
| $10,000 to $14,999 | 0 (0.0%) | 3 (60.0%) |
| $15,000 to $19,999 | 4 (16.0%) | 0 (0.0%) |
| $20,000 to $24,999 | 0 (0.0%) | 2 (40.0%) |
| $25,000 to $34,999 | 11 (44.0%) | 0 (0.0%) |
| $35,000 to $49,999 | 5 (20.0%) | 0 (0.0%) |
| $50,000 to $74,999 | 0 (0.0%) | 0 (0.0%) |
| $75,000 to $99,999 | 5 (20.0%) | 0 (0.0%) |
| $100,000 to $149,999 | 0 (0.0%) | 0 (0.0%) |
| $150,000 or more | 0 (0.0%) | 0 (0.0%) |
| Total | 25 (100.0%) | 5 (100.0%) |
Monthly Housing Cost Tiers in Flemington
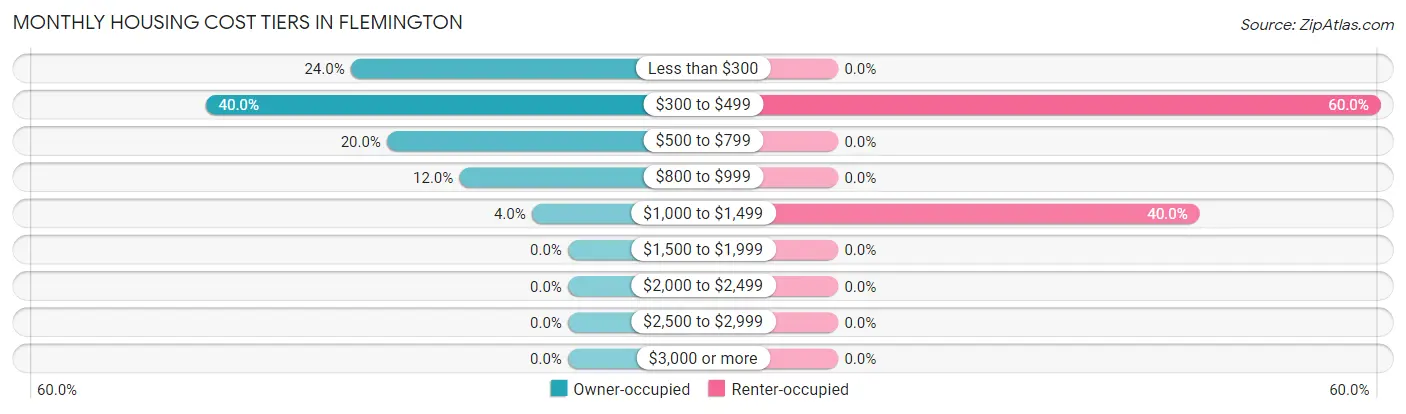
| Monthly Cost | Owner-occupied | Renter-occupied |
| Less than $300 | 6 (24.0%) | 0 (0.0%) |
| $300 to $499 | 10 (40.0%) | 3 (60.0%) |
| $500 to $799 | 5 (20.0%) | 0 (0.0%) |
| $800 to $999 | 3 (12.0%) | 0 (0.0%) |
| $1,000 to $1,499 | 1 (4.0%) | 2 (40.0%) |
| $1,500 to $1,999 | 0 (0.0%) | 0 (0.0%) |
| $2,000 to $2,499 | 0 (0.0%) | 0 (0.0%) |
| $2,500 to $2,999 | 0 (0.0%) | 0 (0.0%) |
| $3,000 or more | 0 (0.0%) | 0 (0.0%) |
| Total | 25 (100.0%) | 5 (100.0%) |
Physical Housing Characteristics in Flemington
Housing Structures in Flemington
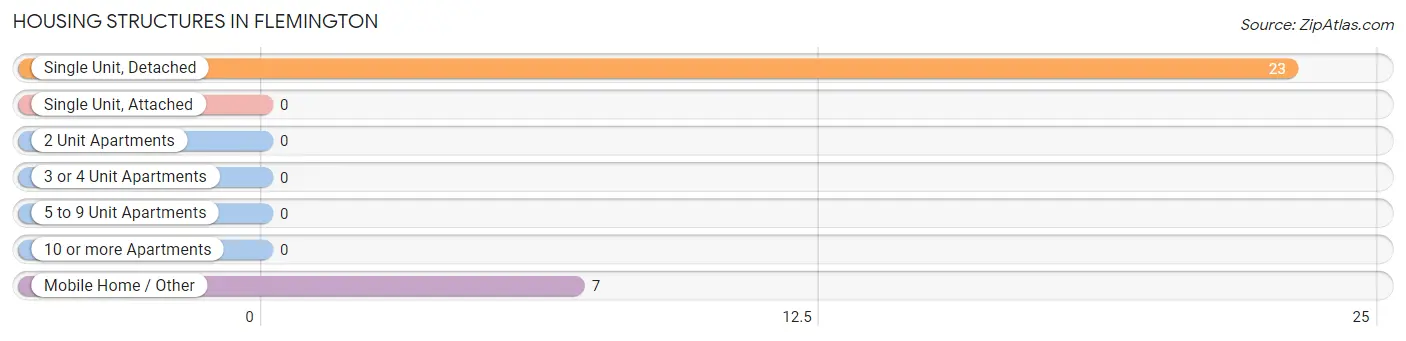
| Structure Type | # Housing Units | % Housing Units |
| Single Unit, Detached | 23 | 76.7% |
| Single Unit, Attached | 0 | 0.0% |
| 2 Unit Apartments | 0 | 0.0% |
| 3 or 4 Unit Apartments | 0 | 0.0% |
| 5 to 9 Unit Apartments | 0 | 0.0% |
| 10 or more Apartments | 0 | 0.0% |
| Mobile Home / Other | 7 | 23.3% |
| Total | 30 | 100.0% |
Housing Structures by Occupancy in Flemington
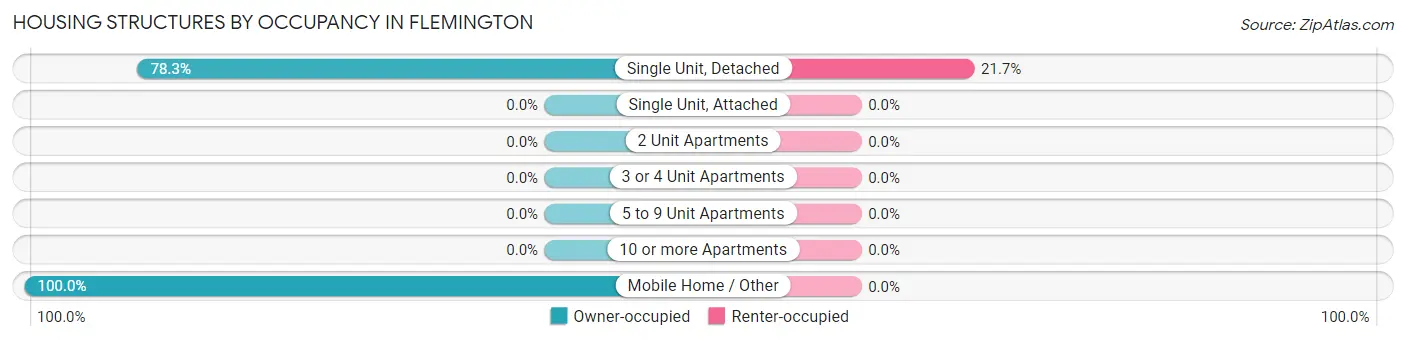
| Structure Type | Owner-occupied | Renter-occupied |
| Single Unit, Detached | 18 (78.3%) | 5 (21.7%) |
| Single Unit, Attached | 0 (0.0%) | 0 (0.0%) |
| 2 Unit Apartments | 0 (0.0%) | 0 (0.0%) |
| 3 or 4 Unit Apartments | 0 (0.0%) | 0 (0.0%) |
| 5 to 9 Unit Apartments | 0 (0.0%) | 0 (0.0%) |
| 10 or more Apartments | 0 (0.0%) | 0 (0.0%) |
| Mobile Home / Other | 7 (100.0%) | 0 (0.0%) |
| Total | 25 (83.3%) | 5 (16.7%) |
Housing Structures by Number of Rooms in Flemington
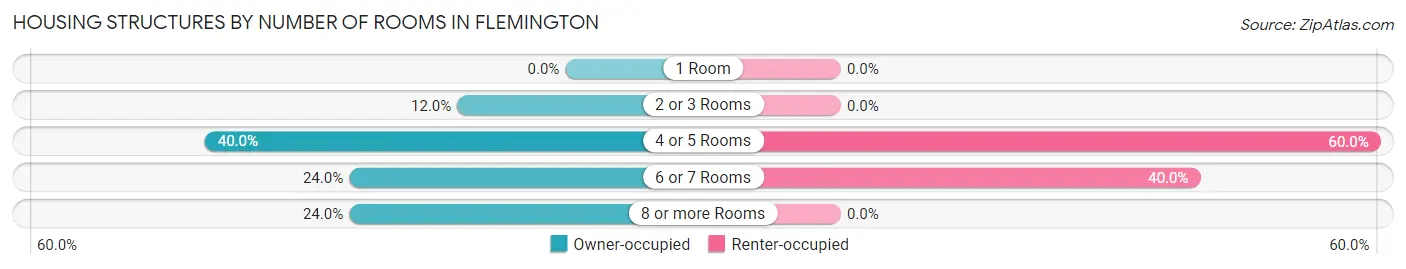
| Number of Rooms | Owner-occupied | Renter-occupied |
| 1 Room | 0 (0.0%) | 0 (0.0%) |
| 2 or 3 Rooms | 3 (12.0%) | 0 (0.0%) |
| 4 or 5 Rooms | 10 (40.0%) | 3 (60.0%) |
| 6 or 7 Rooms | 6 (24.0%) | 2 (40.0%) |
| 8 or more Rooms | 6 (24.0%) | 0 (0.0%) |
| Total | 25 (100.0%) | 5 (100.0%) |
Housing Structure by Heating Type in Flemington
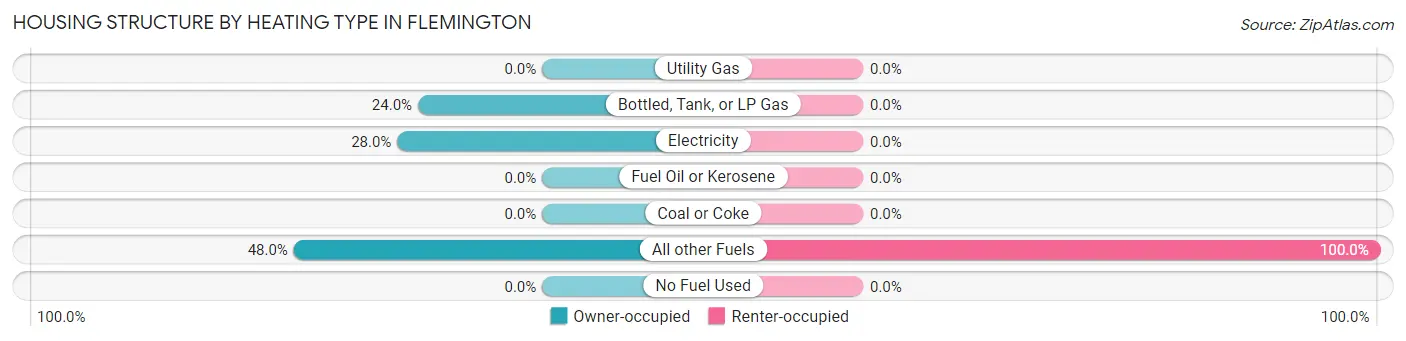
| Heating Type | Owner-occupied | Renter-occupied |
| Utility Gas | 0 (0.0%) | 0 (0.0%) |
| Bottled, Tank, or LP Gas | 6 (24.0%) | 0 (0.0%) |
| Electricity | 7 (28.0%) | 0 (0.0%) |
| Fuel Oil or Kerosene | 0 (0.0%) | 0 (0.0%) |
| Coal or Coke | 0 (0.0%) | 0 (0.0%) |
| All other Fuels | 12 (48.0%) | 5 (100.0%) |
| No Fuel Used | 0 (0.0%) | 0 (0.0%) |
| Total | 25 (100.0%) | 5 (100.0%) |
Household Vehicle Usage in Flemington
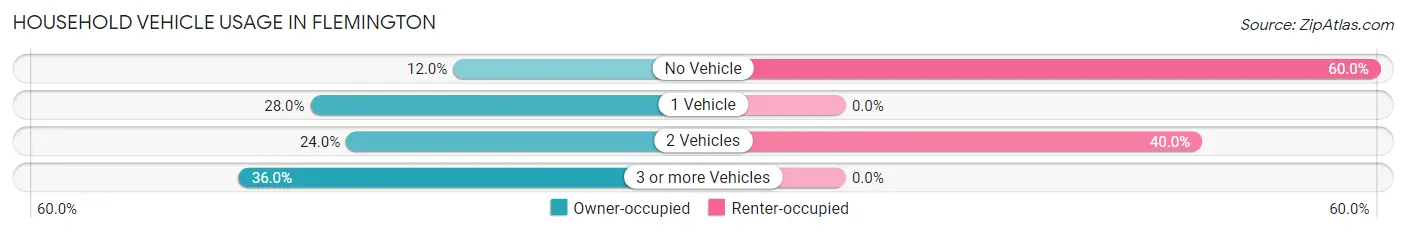
| Vehicles per Household | Owner-occupied | Renter-occupied |
| No Vehicle | 3 (12.0%) | 3 (60.0%) |
| 1 Vehicle | 7 (28.0%) | 0 (0.0%) |
| 2 Vehicles | 6 (24.0%) | 2 (40.0%) |
| 3 or more Vehicles | 9 (36.0%) | 0 (0.0%) |
| Total | 25 (100.0%) | 5 (100.0%) |
Real Estate & Mortgages in Flemington
Real Estate and Mortgage Overview in Flemington
| Characteristic | Without Mortgage | With Mortgage |
| Housing Units | 23 | 2 |
| Median Property Value | $37,500 | $0 |
| Median Household Income | $29,792 | $0 |
| Monthly Housing Costs | $425 | $0 |
| Real Estate Taxes | $294 | $0 |
Property Value by Mortgage Status in Flemington
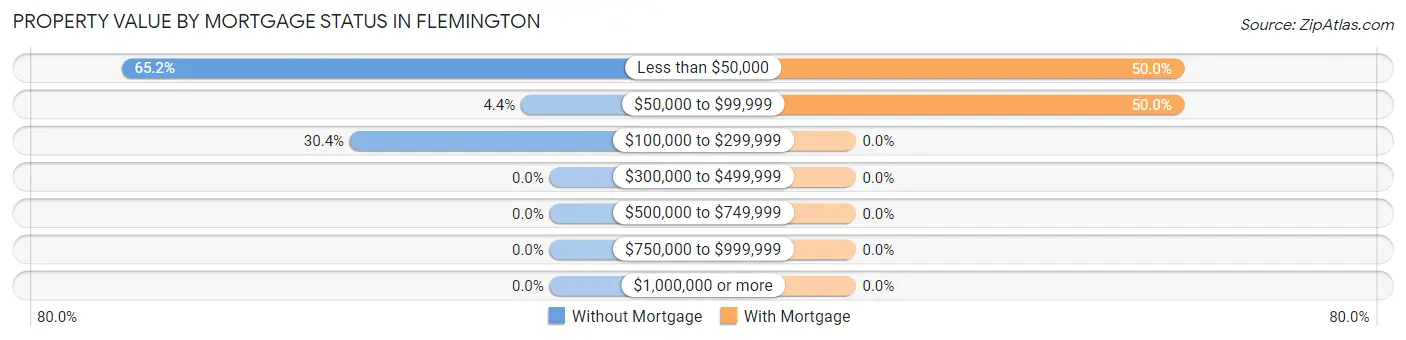
| Property Value | Without Mortgage | With Mortgage |
| Less than $50,000 | 15 (65.2%) | 1 (50.0%) |
| $50,000 to $99,999 | 1 (4.3%) | 1 (50.0%) |
| $100,000 to $299,999 | 7 (30.4%) | 0 (0.0%) |
| $300,000 to $499,999 | 0 (0.0%) | 0 (0.0%) |
| $500,000 to $749,999 | 0 (0.0%) | 0 (0.0%) |
| $750,000 to $999,999 | 0 (0.0%) | 0 (0.0%) |
| $1,000,000 or more | 0 (0.0%) | 0 (0.0%) |
| Total | 23 (100.0%) | 2 (100.0%) |
Household Income by Mortgage Status in Flemington
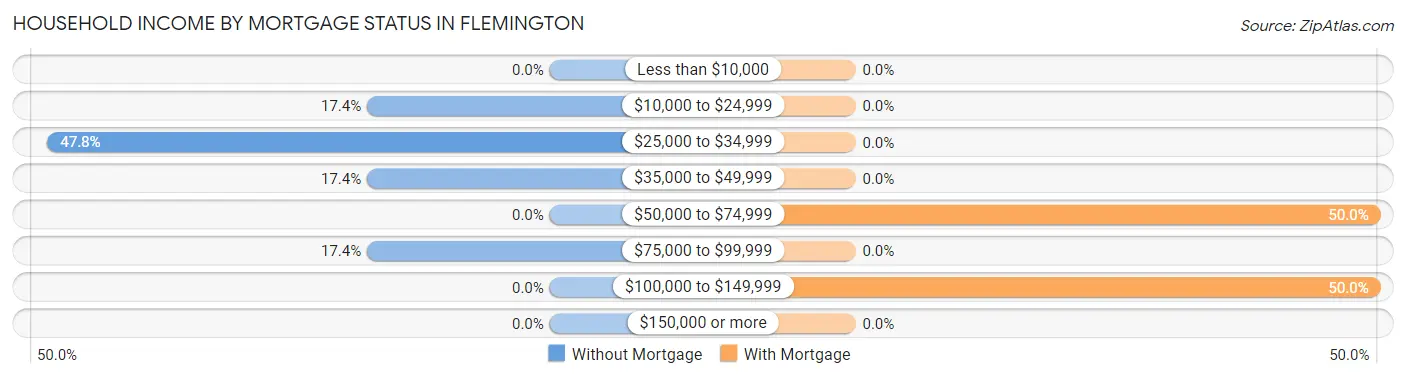
| Household Income | Without Mortgage | With Mortgage |
| Less than $10,000 | 0 (0.0%) | 0 (0.0%) |
| $10,000 to $24,999 | 4 (17.4%) | 0 (0.0%) |
| $25,000 to $34,999 | 11 (47.8%) | 0 (0.0%) |
| $35,000 to $49,999 | 4 (17.4%) | 0 (0.0%) |
| $50,000 to $74,999 | 0 (0.0%) | 1 (50.0%) |
| $75,000 to $99,999 | 4 (17.4%) | 0 (0.0%) |
| $100,000 to $149,999 | 0 (0.0%) | 1 (50.0%) |
| $150,000 or more | 0 (0.0%) | 0 (0.0%) |
| Total | 23 (100.0%) | 2 (100.0%) |
Property Value to Household Income Ratio in Flemington
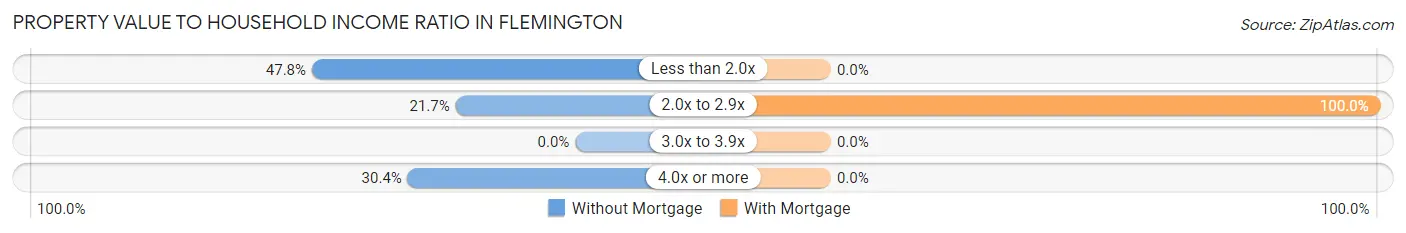
| Value-to-Income Ratio | Without Mortgage | With Mortgage |
| Less than 2.0x | 11 (47.8%) | 0 (0.0%) |
| 2.0x to 2.9x | 5 (21.7%) | 2 (100.0%) |
| 3.0x to 3.9x | 0 (0.0%) | 0 (0.0%) |
| 4.0x or more | 7 (30.4%) | 0 (0.0%) |
| Total | 23 (100.0%) | 2 (100.0%) |
Real Estate Taxes by Mortgage Status in Flemington
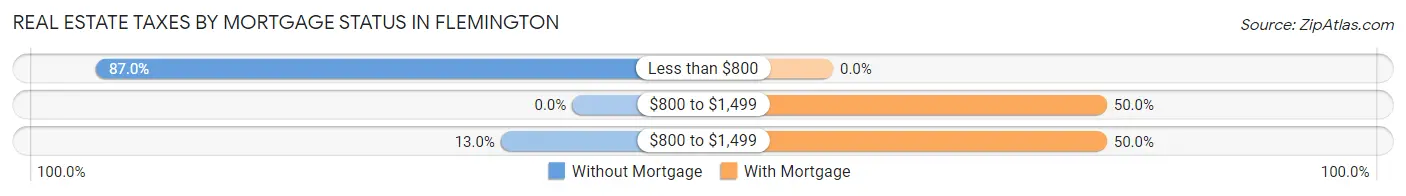
| Property Taxes | Without Mortgage | With Mortgage |
| Less than $800 | 20 (87.0%) | 0 (0.0%) |
| $800 to $1,499 | 0 (0.0%) | 1 (50.0%) |
| $800 to $1,499 | 3 (13.0%) | 1 (50.0%) |
| Total | 23 (100.0%) | 2 (100.0%) |
Health & Disability in Flemington
Health Insurance Coverage by Age in Flemington
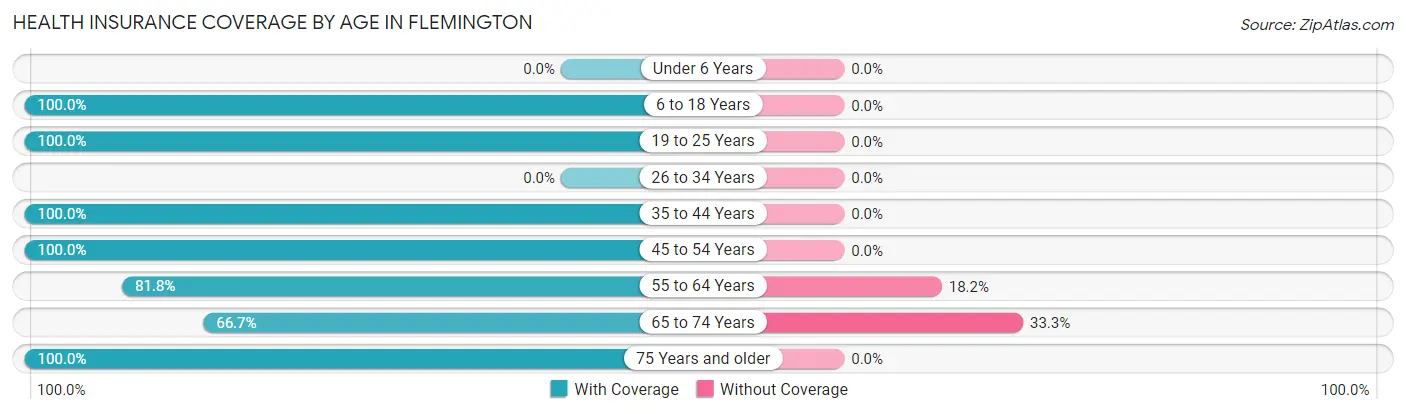
| Age Bracket | With Coverage | Without Coverage |
| Under 6 Years | 0 (0.0%) | 0 (0.0%) |
| 6 to 18 Years | 14 (100.0%) | 0 (0.0%) |
| 19 to 25 Years | 2 (100.0%) | 0 (0.0%) |
| 26 to 34 Years | 0 (0.0%) | 0 (0.0%) |
| 35 to 44 Years | 9 (100.0%) | 0 (0.0%) |
| 45 to 54 Years | 6 (100.0%) | 0 (0.0%) |
| 55 to 64 Years | 9 (81.8%) | 2 (18.2%) |
| 65 to 74 Years | 6 (66.7%) | 3 (33.3%) |
| 75 Years and older | 11 (100.0%) | 0 (0.0%) |
| Total | 57 (91.9%) | 5 (8.1%) |
Health Insurance Coverage by Citizenship Status in Flemington
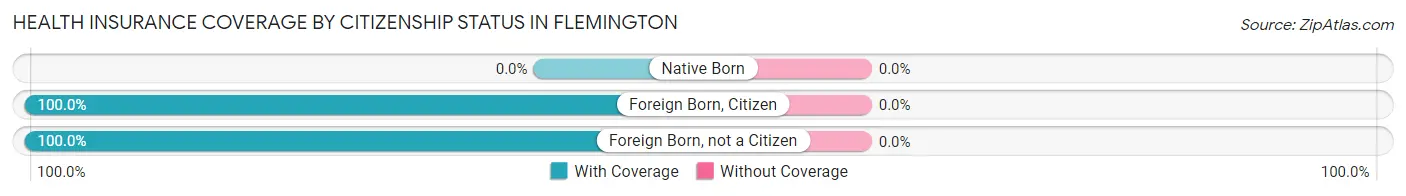
| Citizenship Status | With Coverage | Without Coverage |
| Native Born | 0 (0.0%) | 0 (0.0%) |
| Foreign Born, Citizen | 14 (100.0%) | 0 (0.0%) |
| Foreign Born, not a Citizen | 2 (100.0%) | 0 (0.0%) |
Health Insurance Coverage by Household Income in Flemington
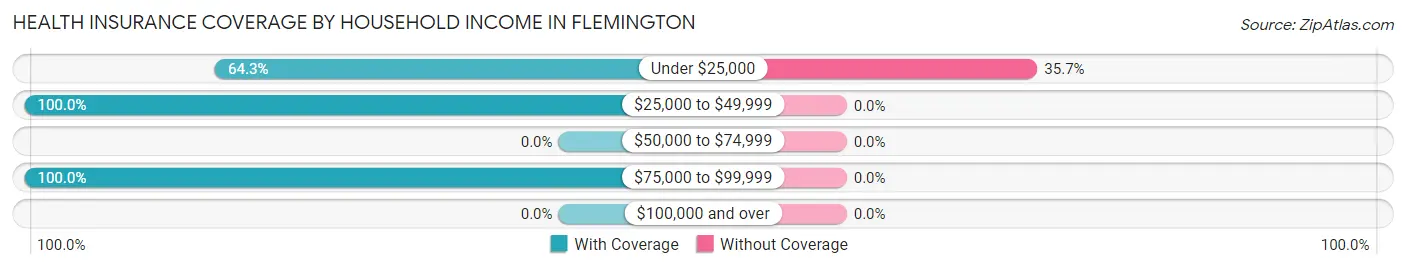
| Household Income | With Coverage | Without Coverage |
| Under $25,000 | 9 (64.3%) | 5 (35.7%) |
| $25,000 to $49,999 | 30 (100.0%) | 0 (0.0%) |
| $50,000 to $74,999 | 0 (0.0%) | 0 (0.0%) |
| $75,000 to $99,999 | 18 (100.0%) | 0 (0.0%) |
| $100,000 and over | 0 (0.0%) | 0 (0.0%) |
Public vs Private Health Insurance Coverage by Age in Flemington
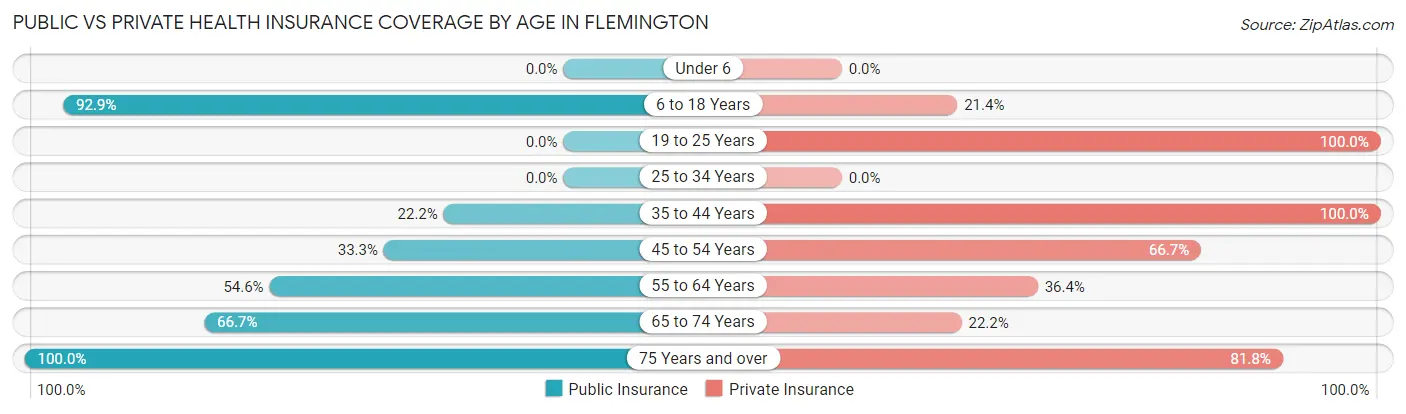
| Age Bracket | Public Insurance | Private Insurance |
| Under 6 | 0 (0.0%) | 0 (0.0%) |
| 6 to 18 Years | 13 (92.9%) | 3 (21.4%) |
| 19 to 25 Years | 0 (0.0%) | 2 (100.0%) |
| 25 to 34 Years | 0 (0.0%) | 0 (0.0%) |
| 35 to 44 Years | 2 (22.2%) | 9 (100.0%) |
| 45 to 54 Years | 2 (33.3%) | 4 (66.7%) |
| 55 to 64 Years | 6 (54.5%) | 4 (36.4%) |
| 65 to 74 Years | 6 (66.7%) | 2 (22.2%) |
| 75 Years and over | 11 (100.0%) | 9 (81.8%) |
| Total | 40 (64.5%) | 33 (53.2%) |
Disability Status by Sex by Age in Flemington
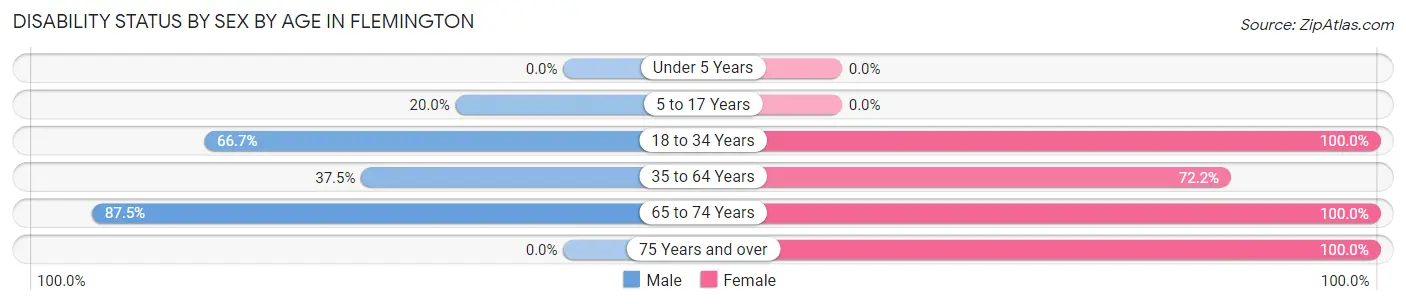
| Age Bracket | Male | Female |
| Under 5 Years | 0 (0.0%) | 0 (0.0%) |
| 5 to 17 Years | 1 (20.0%) | 0 (0.0%) |
| 18 to 34 Years | 4 (66.7%) | 1 (100.0%) |
| 35 to 64 Years | 3 (37.5%) | 13 (72.2%) |
| 65 to 74 Years | 7 (87.5%) | 1 (100.0%) |
| 75 Years and over | 0 (0.0%) | 6 (100.0%) |
Disability Class by Sex by Age in Flemington
Disability Class: Hearing Difficulty
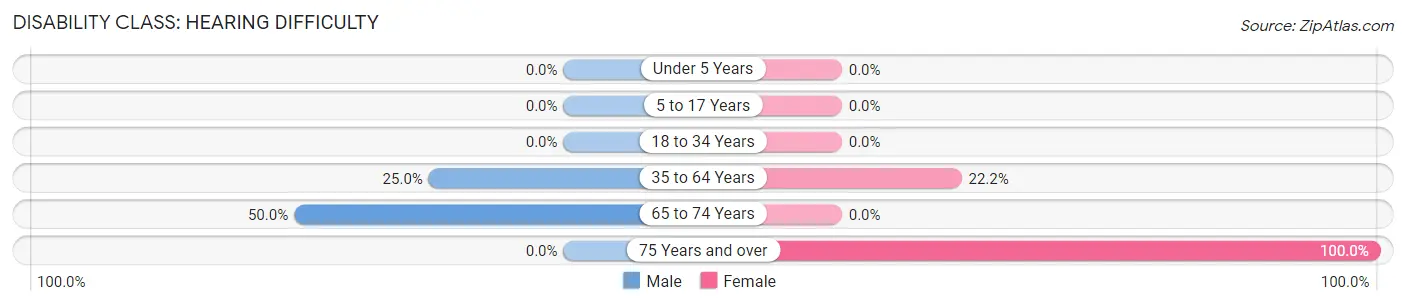
| Age Bracket | Male | Female |
| Under 5 Years | 0 (0.0%) | 0 (0.0%) |
| 5 to 17 Years | 0 (0.0%) | 0 (0.0%) |
| 18 to 34 Years | 0 (0.0%) | 0 (0.0%) |
| 35 to 64 Years | 2 (25.0%) | 4 (22.2%) |
| 65 to 74 Years | 4 (50.0%) | 0 (0.0%) |
| 75 Years and over | 0 (0.0%) | 6 (100.0%) |
Disability Class: Vision Difficulty
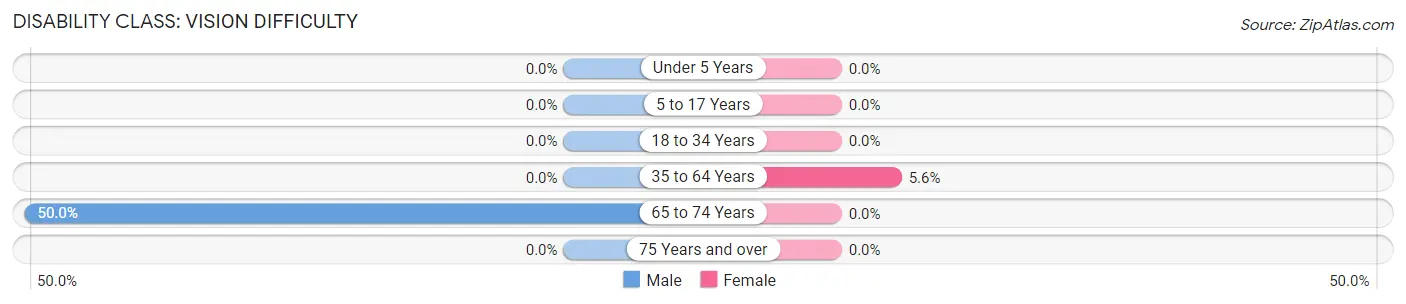
| Age Bracket | Male | Female |
| Under 5 Years | 0 (0.0%) | 0 (0.0%) |
| 5 to 17 Years | 0 (0.0%) | 0 (0.0%) |
| 18 to 34 Years | 0 (0.0%) | 0 (0.0%) |
| 35 to 64 Years | 0 (0.0%) | 1 (5.6%) |
| 65 to 74 Years | 4 (50.0%) | 0 (0.0%) |
| 75 Years and over | 0 (0.0%) | 0 (0.0%) |
Disability Class: Cognitive Difficulty
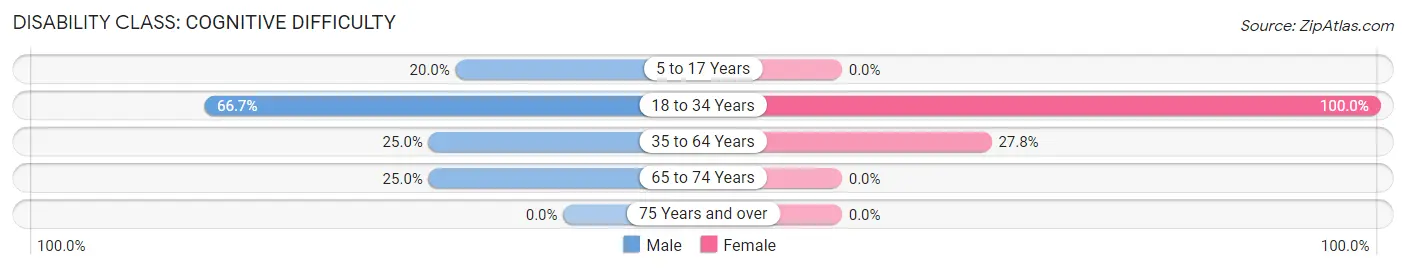
| Age Bracket | Male | Female |
| 5 to 17 Years | 1 (20.0%) | 0 (0.0%) |
| 18 to 34 Years | 4 (66.7%) | 1 (100.0%) |
| 35 to 64 Years | 2 (25.0%) | 5 (27.8%) |
| 65 to 74 Years | 2 (25.0%) | 0 (0.0%) |
| 75 Years and over | 0 (0.0%) | 0 (0.0%) |
Disability Class: Ambulatory Difficulty
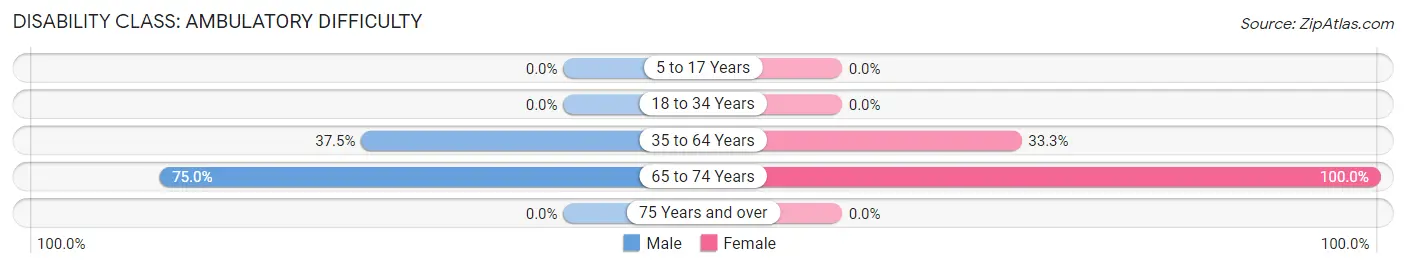
| Age Bracket | Male | Female |
| 5 to 17 Years | 0 (0.0%) | 0 (0.0%) |
| 18 to 34 Years | 0 (0.0%) | 0 (0.0%) |
| 35 to 64 Years | 3 (37.5%) | 6 (33.3%) |
| 65 to 74 Years | 6 (75.0%) | 1 (100.0%) |
| 75 Years and over | 0 (0.0%) | 0 (0.0%) |
Disability Class: Self-Care Difficulty
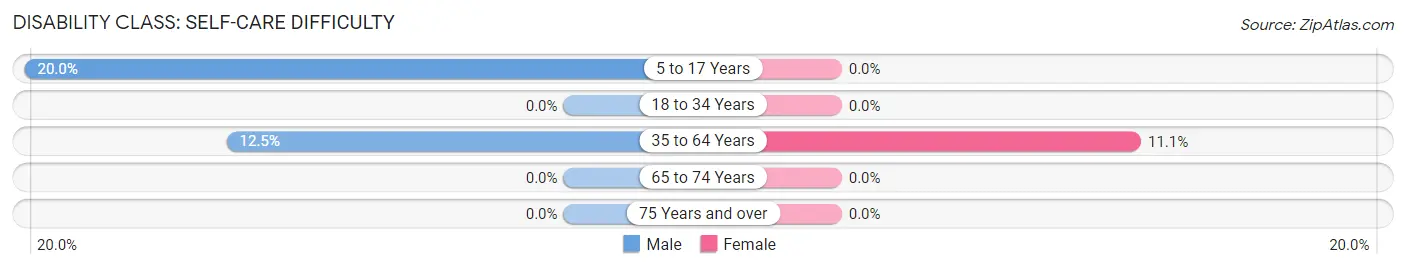
| Age Bracket | Male | Female |
| 5 to 17 Years | 1 (20.0%) | 0 (0.0%) |
| 18 to 34 Years | 0 (0.0%) | 0 (0.0%) |
| 35 to 64 Years | 1 (12.5%) | 2 (11.1%) |
| 65 to 74 Years | 0 (0.0%) | 0 (0.0%) |
| 75 Years and over | 0 (0.0%) | 0 (0.0%) |
Technology Access in Flemington
Computing Device Access in Flemington
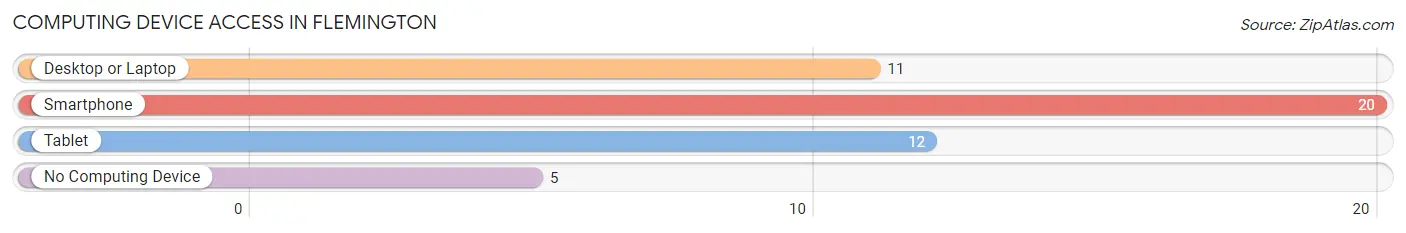
| Device Type | # Households | % Households |
| Desktop or Laptop | 11 | 36.7% |
| Smartphone | 20 | 66.7% |
| Tablet | 12 | 40.0% |
| No Computing Device | 5 | 16.7% |
| Total | 30 | 100.0% |
Internet Access in Flemington
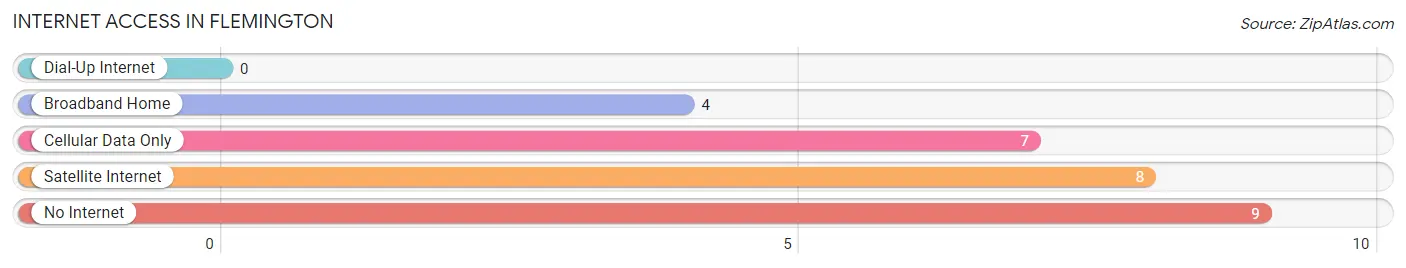
| Internet Type | # Households | % Households |
| Dial-Up Internet | 0 | 0.0% |
| Broadband Home | 4 | 13.3% |
| Cellular Data Only | 7 | 23.3% |
| Satellite Internet | 8 | 26.7% |
| No Internet | 9 | 30.0% |
| Total | 30 | 100.0% |
Flemington Summary
Flemington, Missouri is a small town located in the northwest corner of the state, in the Ozark Mountains. It is situated in the heart of the Ozark National Scenic Riverways, a protected area of rivers, streams, and forests. The town is home to a population of just over 500 people, and is known for its rural charm and natural beauty.
Geography
Flemington is located in the Ozark Mountains, in the northwest corner of Missouri. It is situated in the heart of the Ozark National Scenic Riverways, a protected area of rivers, streams, and forests. The town is surrounded by rolling hills and lush forests, and is home to a variety of wildlife. The nearest major city is Springfield, which is located about 40 miles to the south.
The town is situated on the banks of the Current River, which is a popular destination for canoeing, fishing, and swimming. The river is also home to a variety of wildlife, including beavers, otters, and bald eagles. The town is also home to a variety of other outdoor activities, such as hiking, camping, and horseback riding.
Economy
The economy of Flemington is largely based on tourism and agriculture. The town is home to a variety of tourist attractions, such as the Ozark National Scenic Riverways, which attracts visitors from all over the country. The town is also home to a variety of small businesses, such as restaurants, shops, and lodging.
Agriculture is also an important part of the local economy. The town is home to a variety of farms, which produce a variety of crops, such as corn, soybeans, and wheat. The town is also home to a variety of livestock, such as cattle, sheep, and horses.
Demographics
As of the 2010 census, the population of Flemington was 514. The town is predominantly white, with a small minority population of African Americans, Hispanics, and Native Americans. The median household income is $37,500, and the median age is 44.
The town is home to a variety of religious denominations, including Baptist, Methodist, and Catholic. The town is also home to a variety of educational institutions, including a public elementary school, a middle school, and a high school.
History
Flemington was founded in 1837 by a group of settlers from Kentucky. The town was originally known as “Fleming’s Station”, after the first settler, William Fleming. The town was officially incorporated in 1845, and was named after the nearby town of Flemington, Kentucky.
The town was an important stop on the Butterfield Overland Mail route, which ran from St. Louis to San Francisco. The town was also an important stop on the Missouri Pacific Railroad, which ran from St. Louis to Kansas City.
The town was also an important stop on the Ozark Trail, which was a popular route for settlers heading west. The town was also an important stop on the Trail of Tears, which was the route taken by the Cherokee Nation during their forced relocation in the 1830s.
The town was also an important stop on the Underground Railroad, which was a network of secret routes and safe houses used by African Americans escaping slavery. The town was also an important stop on the Butterfield Overland Mail route, which ran from St. Louis to San Francisco.
Conclusion
Flemington, Missouri is a small town located in the northwest corner of the state, in the Ozark Mountains. It is situated in the heart of the Ozark National Scenic Riverways, a protected area of rivers, streams, and forests. The town is home to a population of just over 500 people, and is known for its rural charm and natural beauty. The economy of Flemington is largely based on tourism and agriculture, and the town is home to a variety of religious denominations, educational institutions, and small businesses. The town has a rich history, and was an important stop on the Butterfield Overland Mail route, the Missouri Pacific Railroad, the Ozark Trail, the Trail of Tears, and the Underground Railroad.
Common Questions
What is Per Capita Income in Flemington?
Per Capita income in Flemington is $18,195.
What is the Median Family Income in Flemington?
Median Family Income in Flemington is $42,500.
What is the Median Household income in Flemington?
Median Household Income in Flemington is $29,167.
What is Inequality or Gini Index in Flemington?
Inequality or Gini Index in Flemington is 0.33.
What is the Total Population of Flemington?
Total Population of Flemington is 62.
What is the Total Male Population of Flemington?
Total Male Population of Flemington is 32.
What is the Total Female Population of Flemington?
Total Female Population of Flemington is 30.
What is the Ratio of Males per 100 Females in Flemington?
There are 106.67 Males per 100 Females in Flemington.
What is the Ratio of Females per 100 Males in Flemington?
There are 93.75 Females per 100 Males in Flemington.
What is the Median Population Age in Flemington?
Median Population Age in Flemington is 53.0 Years.
What is the Average Family Size in Flemington
Average Family Size in Flemington is 3.1 People.
What is the Average Household Size in Flemington
Average Household Size in Flemington is 2.1 People.
How Large is the Labor Force in Flemington?
There are 18 People in the Labor Forcein in Flemington.
What is the Percentage of People in the Labor Force in Flemington?
31.0% of People are in the Labor Force in Flemington.
What is the Unemployment Rate in Flemington?
Unemployment Rate in Flemington is 5.6%.