Nisswa, MN Map & Demographics
Nisswa Map
Nisswa Overview
$58,024
PER CAPITA INCOME
$110,313
AVG FAMILY INCOME
$94,650
AVG HOUSEHOLD INCOME
11.5%
WAGE / INCOME GAP [ % ]
88.5¢/ $1
WAGE / INCOME GAP [ $ ]
0.45
INEQUALITY / GINI INDEX
1,733
TOTAL POPULATION
954
MALE POPULATION
779
FEMALE POPULATION
122.46
MALES / 100 FEMALES
81.66
FEMALES / 100 MALES
52.3
MEDIAN AGE
2.8
AVG FAMILY SIZE
2.4
AVG HOUSEHOLD SIZE
972
LABOR FORCE [ PEOPLE ]
64.5%
PERCENT IN LABOR FORCE
1.0%
UNEMPLOYMENT RATE
Nisswa Zip Codes
Nisswa Area Codes
Income in Nisswa
Income Overview in Nisswa
Per Capita Income in Nisswa is $58,024, while median incomes of families and households are $110,313 and $94,650 respectively.
| Characteristic | Number | Measure |
| Per Capita Income | 1,733 | $58,024 |
| Median Family Income | 535 | $110,313 |
| Mean Family Income | 535 | $157,284 |
| Median Household Income | 715 | $94,650 |
| Mean Household Income | 715 | $137,381 |
| Income Deficit | 535 | $0 |
| Wage / Income Gap (%) | 1,733 | 11.48% |
| Wage / Income Gap ($) | 1,733 | 88.52¢ per $1 |
| Gini / Inequality Index | 1,733 | 0.45 |
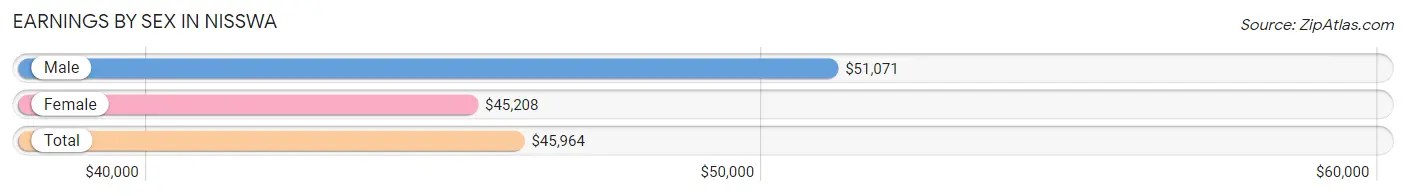
Earnings by Sex in Nisswa
Average Earnings in Nisswa are $45,964, $51,071 for men and $45,208 for women, a difference of 11.5%.
| Sex | Number | Average Earnings |
| Male | 616 (58.1%) | $51,071 |
| Female | 445 (41.9%) | $45,208 |
| Total | 1,061 (100.0%) | $45,964 |
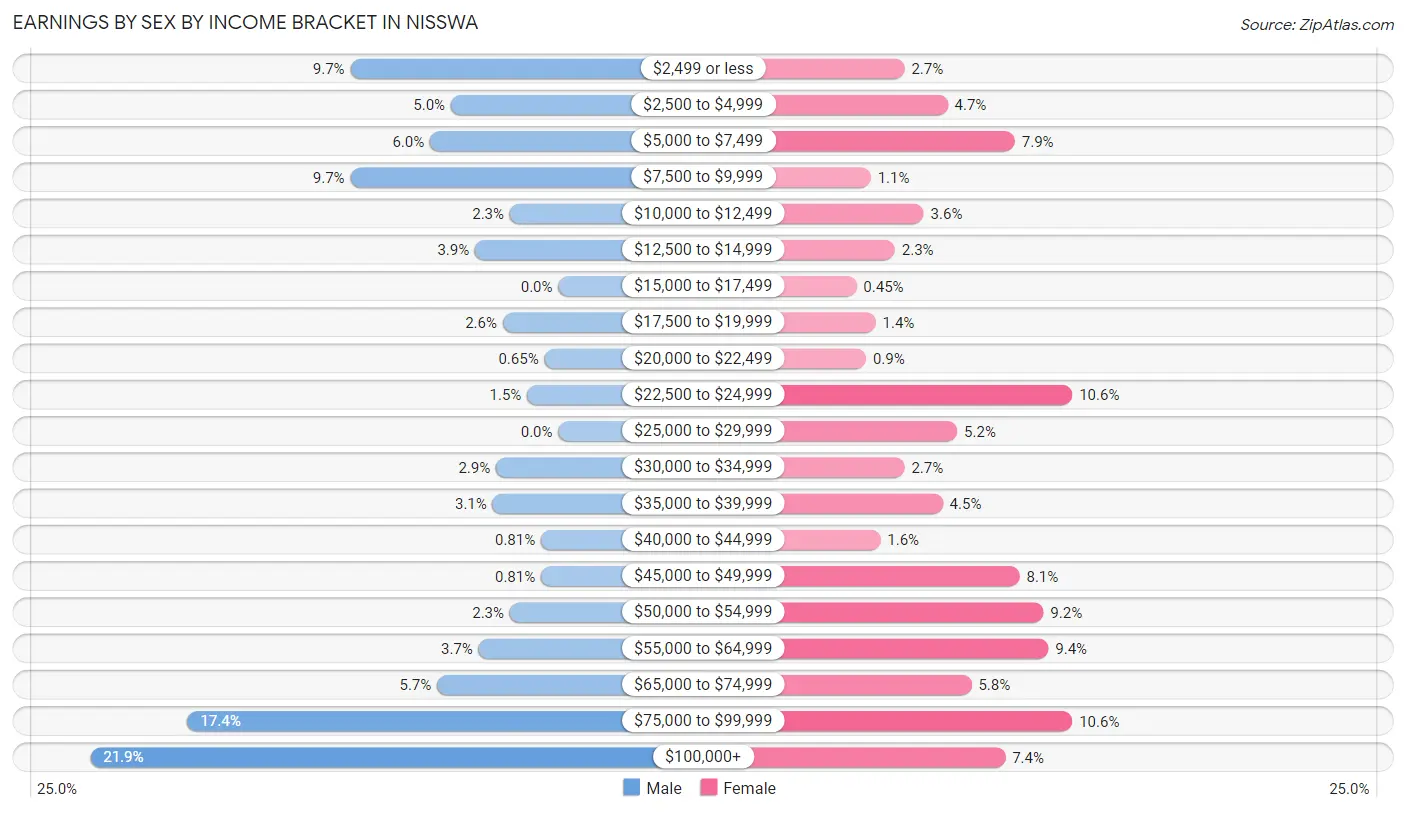
Earnings by Sex by Income Bracket in Nisswa
The most common earnings brackets in Nisswa are $100,000+ for men (135 | 21.9%) and $22,500 to $24,999 for women (47 | 10.6%).
| Income | Male | Female |
| $2,499 or less | 60 (9.7%) | 12 (2.7%) |
| $2,500 to $4,999 | 31 (5.0%) | 21 (4.7%) |
| $5,000 to $7,499 | 37 (6.0%) | 35 (7.9%) |
| $7,500 to $9,999 | 60 (9.7%) | 5 (1.1%) |
| $10,000 to $12,499 | 14 (2.3%) | 16 (3.6%) |
| $12,500 to $14,999 | 24 (3.9%) | 10 (2.2%) |
| $15,000 to $17,499 | 0 (0.0%) | 2 (0.4%) |
| $17,500 to $19,999 | 16 (2.6%) | 6 (1.3%) |
| $20,000 to $22,499 | 4 (0.6%) | 4 (0.9%) |
| $22,500 to $24,999 | 9 (1.5%) | 47 (10.6%) |
| $25,000 to $29,999 | 0 (0.0%) | 23 (5.2%) |
| $30,000 to $34,999 | 18 (2.9%) | 12 (2.7%) |
| $35,000 to $39,999 | 19 (3.1%) | 20 (4.5%) |
| $40,000 to $44,999 | 5 (0.8%) | 7 (1.6%) |
| $45,000 to $49,999 | 5 (0.8%) | 36 (8.1%) |
| $50,000 to $54,999 | 14 (2.3%) | 41 (9.2%) |
| $55,000 to $64,999 | 23 (3.7%) | 42 (9.4%) |
| $65,000 to $74,999 | 35 (5.7%) | 26 (5.8%) |
| $75,000 to $99,999 | 107 (17.4%) | 47 (10.6%) |
| $100,000+ | 135 (21.9%) | 33 (7.4%) |
| Total | 616 (100.0%) | 445 (100.0%) |
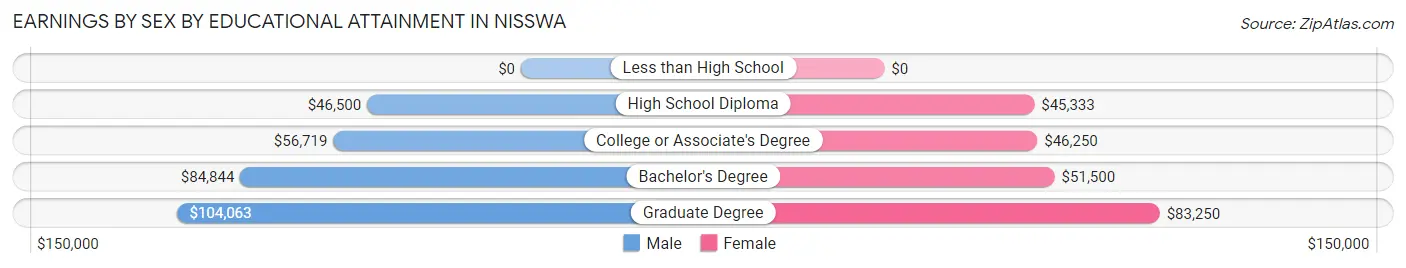
Earnings by Sex by Educational Attainment in Nisswa
Average earnings in Nisswa are $82,829 for men and $47,708 for women, a difference of 42.4%. Men with an educational attainment of graduate degree enjoy the highest average annual earnings of $104,063, while those with high school diploma education earn the least with $46,500. Women with an educational attainment of graduate degree earn the most with the average annual earnings of $83,250, while those with high school diploma education have the smallest earnings of $45,333.
| Educational Attainment | Male Income | Female Income |
| Less than High School | - | - |
| High School Diploma | $46,500 | $45,333 |
| College or Associate's Degree | $56,719 | $46,250 |
| Bachelor's Degree | $84,844 | $51,500 |
| Graduate Degree | $104,063 | $83,250 |
| Total | $82,829 | $47,708 |
Family Income in Nisswa
Family Income Brackets in Nisswa
According to the Nisswa family income data, there are 114 families falling into the $200,000+ income range, which is the most common income bracket and makes up 21.3% of all families. Conversely, the less than $10,000 income bracket is the least frequent group with only 8 families (1.5%) belonging to this category.
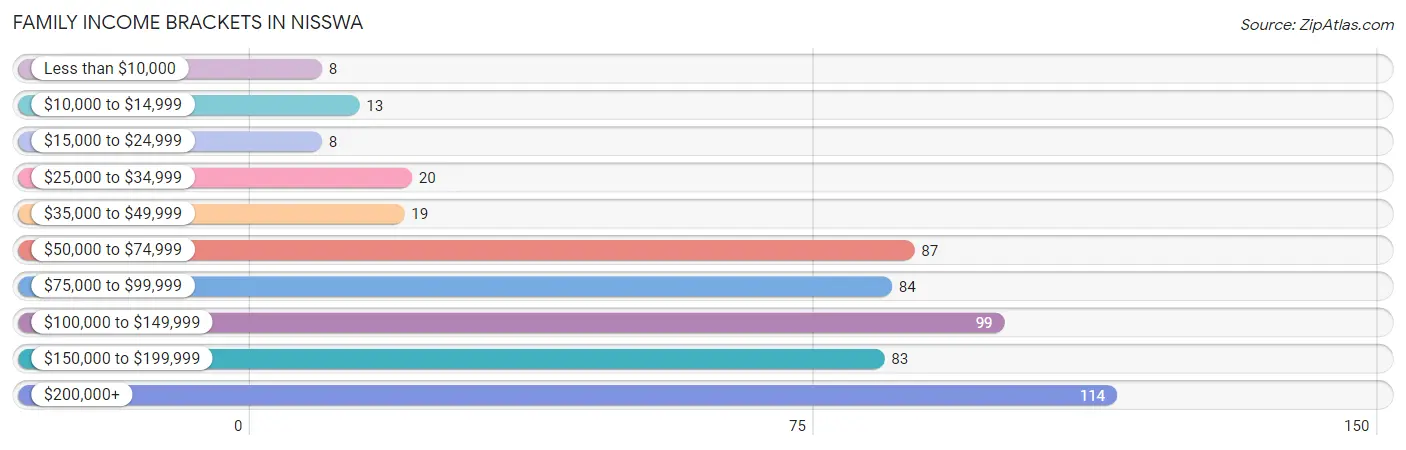
| Income Bracket | # Families | % Families |
| Less than $10,000 | 8 | 1.5% |
| $10,000 to $14,999 | 13 | 2.4% |
| $15,000 to $24,999 | 8 | 1.5% |
| $25,000 to $34,999 | 20 | 3.7% |
| $35,000 to $49,999 | 19 | 3.6% |
| $50,000 to $74,999 | 87 | 16.3% |
| $75,000 to $99,999 | 84 | 15.7% |
| $100,000 to $149,999 | 99 | 18.5% |
| $150,000 to $199,999 | 83 | 15.5% |
| $200,000+ | 114 | 21.3% |
Family Income by Famaliy Size in Nisswa
4-person families (61 | 11.4%) account for the highest median family income in Nisswa with $145,417 per family, while 2-person families (293 | 54.8%) have the highest median income of $50,312 per family member.
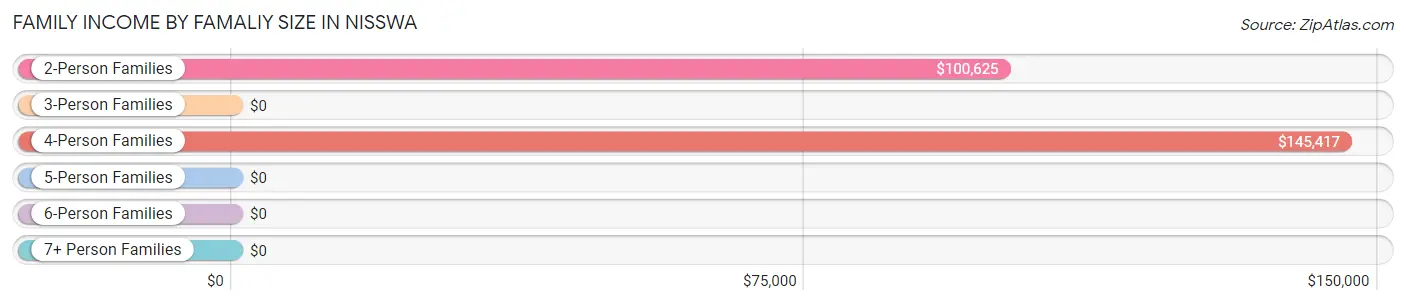
| Income Bracket | # Families | Median Income |
| 2-Person Families | 293 (54.8%) | $100,625 |
| 3-Person Families | 135 (25.2%) | $0 |
| 4-Person Families | 61 (11.4%) | $145,417 |
| 5-Person Families | 40 (7.5%) | $0 |
| 6-Person Families | 6 (1.1%) | $0 |
| 7+ Person Families | 0 (0.0%) | $0 |
| Total | 535 (100.0%) | $110,313 |
Family Income by Number of Earners in Nisswa
The median family income in Nisswa is $110,313, with families comprising 3+ earners (83) having the highest median family income of $189,250, while families with 1 earner (108) have the lowest median family income of $69,643, accounting for 15.5% and 20.2% of families, respectively.
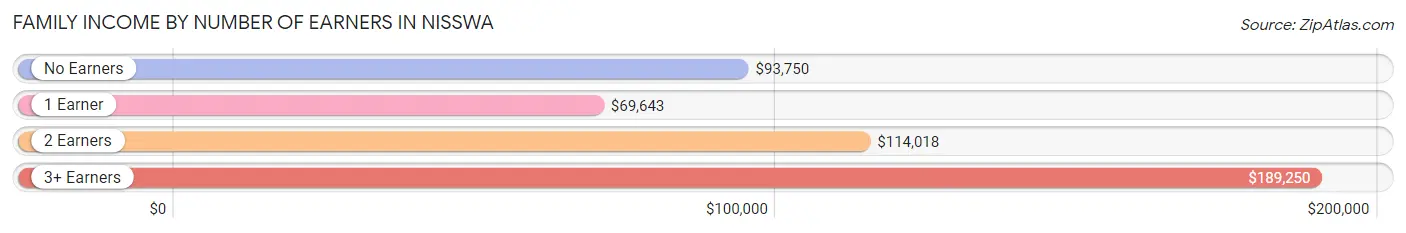
| Number of Earners | # Families | Median Income |
| No Earners | 111 (20.7%) | $93,750 |
| 1 Earner | 108 (20.2%) | $69,643 |
| 2 Earners | 233 (43.5%) | $114,018 |
| 3+ Earners | 83 (15.5%) | $189,250 |
| Total | 535 (100.0%) | $110,313 |
Household Income in Nisswa
Household Income Brackets in Nisswa
With 124 households falling in the category, the $50,000 to $74,999 income range is the most frequent in Nisswa, accounting for 17.3% of all households. In contrast, only 9 households (1.3%) fall into the less than $10,000 income bracket, making it the least populous group.
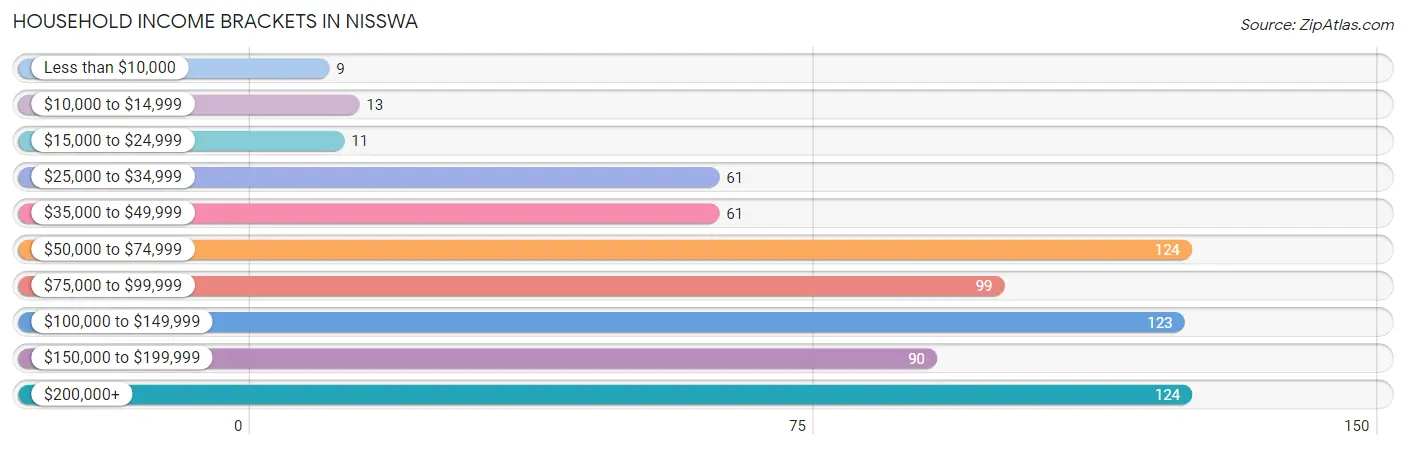
| Income Bracket | # Households | % Households |
| Less than $10,000 | 9 | 1.3% |
| $10,000 to $14,999 | 13 | 1.8% |
| $15,000 to $24,999 | 11 | 1.5% |
| $25,000 to $34,999 | 61 | 8.5% |
| $35,000 to $49,999 | 61 | 8.5% |
| $50,000 to $74,999 | 124 | 17.3% |
| $75,000 to $99,999 | 99 | 13.8% |
| $100,000 to $149,999 | 123 | 17.2% |
| $150,000 to $199,999 | 90 | 12.6% |
| $200,000+ | 124 | 17.3% |
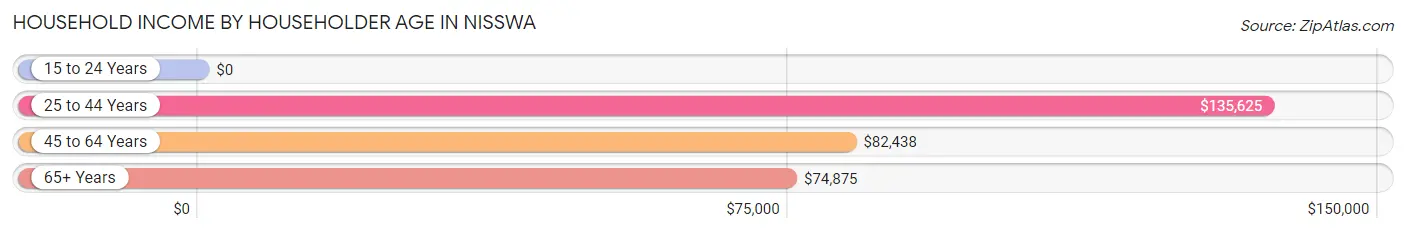
Household Income by Householder Age in Nisswa
The median household income in Nisswa is $94,650, with the highest median household income of $135,625 found in the 25 to 44 years age bracket for the primary householder. A total of 147 households (20.6%) fall into this category. Meanwhile, the 15 to 24 years age bracket for the primary householder has the lowest median household income of $0, with 14 households (2.0%) in this group.
| Income Bracket | # Households | Median Income |
| 15 to 24 Years | 14 (2.0%) | $0 |
| 25 to 44 Years | 147 (20.6%) | $135,625 |
| 45 to 64 Years | 319 (44.6%) | $82,438 |
| 65+ Years | 235 (32.9%) | $74,875 |
| Total | 715 (100.0%) | $94,650 |
Poverty in Nisswa
Income Below Poverty by Sex and Age in Nisswa
With 5.2% poverty level for males and 5.0% for females among the residents of Nisswa, 12 to 14 year old males and 12 to 14 year old females are the most vulnerable to poverty, with 3 males (25.0%) and 4 females (30.8%) in their respective age groups living below the poverty level.
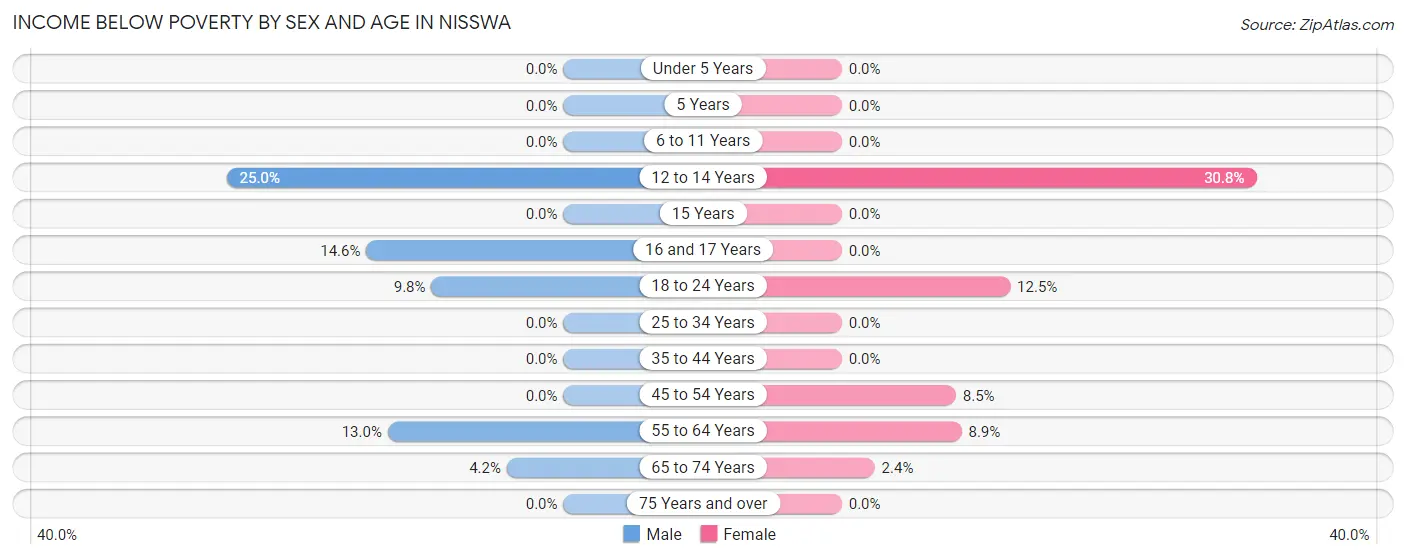
| Age Bracket | Male | Female |
| Under 5 Years | 0 (0.0%) | 0 (0.0%) |
| 5 Years | 0 (0.0%) | 0 (0.0%) |
| 6 to 11 Years | 0 (0.0%) | 0 (0.0%) |
| 12 to 14 Years | 3 (25.0%) | 4 (30.8%) |
| 15 Years | 0 (0.0%) | 0 (0.0%) |
| 16 and 17 Years | 6 (14.6%) | 0 (0.0%) |
| 18 to 24 Years | 15 (9.8%) | 6 (12.5%) |
| 25 to 34 Years | 0 (0.0%) | 0 (0.0%) |
| 35 to 44 Years | 0 (0.0%) | 0 (0.0%) |
| 45 to 54 Years | 0 (0.0%) | 10 (8.5%) |
| 55 to 64 Years | 21 (13.0%) | 16 (8.9%) |
| 65 to 74 Years | 5 (4.2%) | 3 (2.4%) |
| 75 Years and over | 0 (0.0%) | 0 (0.0%) |
| Total | 50 (5.2%) | 39 (5.0%) |
Income Above Poverty by Sex and Age in Nisswa
According to the poverty statistics in Nisswa, males aged under 5 years and females aged under 5 years are the age groups that are most secure financially, with 100.0% of males and 100.0% of females in these age groups living above the poverty line.
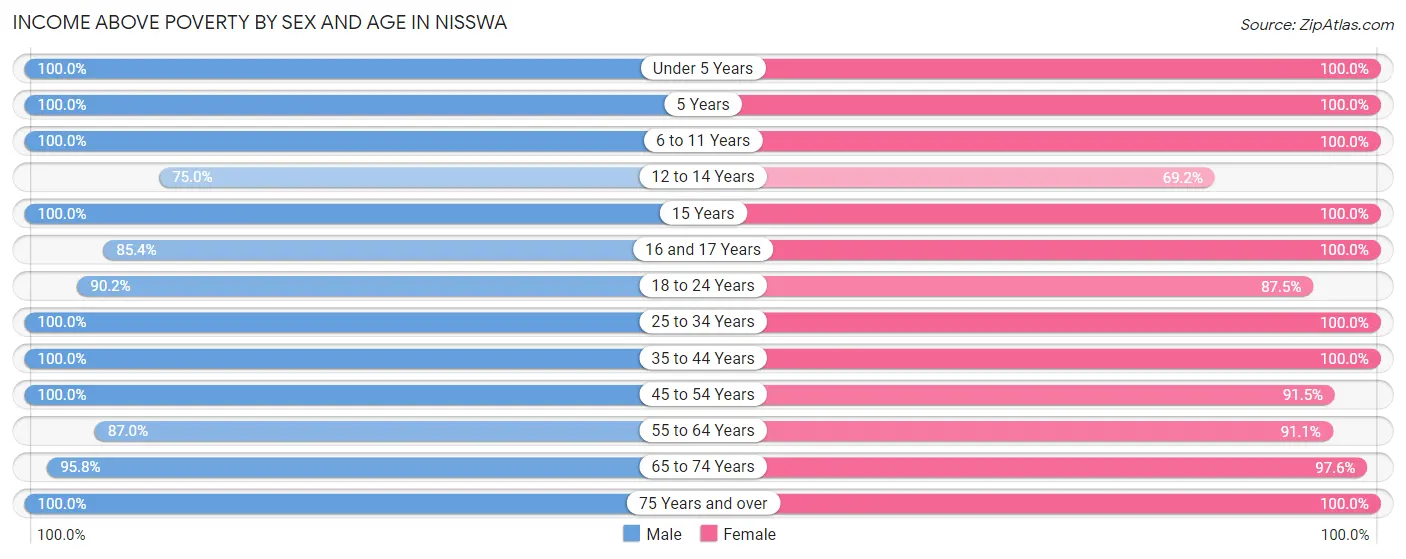
| Age Bracket | Male | Female |
| Under 5 Years | 60 (100.0%) | 21 (100.0%) |
| 5 Years | 21 (100.0%) | 7 (100.0%) |
| 6 to 11 Years | 42 (100.0%) | 42 (100.0%) |
| 12 to 14 Years | 9 (75.0%) | 9 (69.2%) |
| 15 Years | 4 (100.0%) | 4 (100.0%) |
| 16 and 17 Years | 35 (85.4%) | 8 (100.0%) |
| 18 to 24 Years | 138 (90.2%) | 42 (87.5%) |
| 25 to 34 Years | 31 (100.0%) | 37 (100.0%) |
| 35 to 44 Years | 113 (100.0%) | 82 (100.0%) |
| 45 to 54 Years | 112 (100.0%) | 108 (91.5%) |
| 55 to 64 Years | 140 (87.0%) | 164 (91.1%) |
| 65 to 74 Years | 114 (95.8%) | 120 (97.6%) |
| 75 Years and over | 85 (100.0%) | 96 (100.0%) |
| Total | 904 (94.8%) | 740 (95.0%) |
Income Below Poverty Among Married-Couple Families in Nisswa
The poverty statistics for married-couple families in Nisswa show that 4.8% or 22 of the total 456 families live below the poverty line. Families with no children have the highest poverty rate of 5.8%, comprising of 18 families. On the other hand, families with 3 or 4 children have the lowest poverty rate of 0.0%, which includes 0 families.
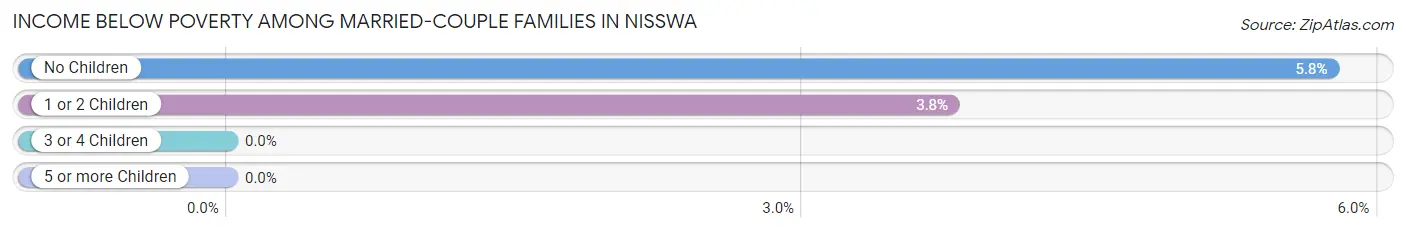
| Children | Above Poverty | Below Poverty |
| No Children | 295 (94.3%) | 18 (5.8%) |
| 1 or 2 Children | 102 (96.2%) | 4 (3.8%) |
| 3 or 4 Children | 37 (100.0%) | 0 (0.0%) |
| 5 or more Children | 0 (0.0%) | 0 (0.0%) |
| Total | 434 (95.2%) | 22 (4.8%) |
Income Below Poverty Among Single-Parent Households in Nisswa
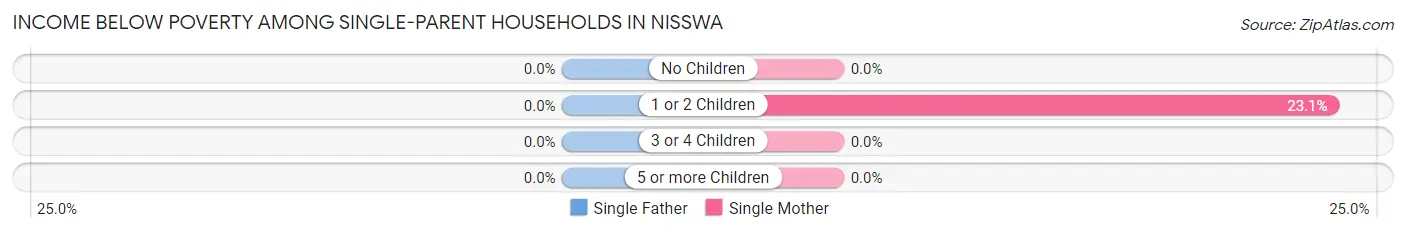
| Children | Single Father | Single Mother |
| No Children | 0 (0.0%) | 0 (0.0%) |
| 1 or 2 Children | 0 (0.0%) | 3 (23.1%) |
| 3 or 4 Children | 0 (0.0%) | 0 (0.0%) |
| 5 or more Children | 0 (0.0%) | 0 (0.0%) |
| Total | 0 (0.0%) | 3 (6.7%) |
Income Below Poverty Among Married-Couple vs Single-Parent Households in Nisswa
The poverty data for Nisswa shows that 22 of the married-couple family households (4.8%) and 3 of the single-parent households (3.8%) are living below the poverty level. Within the married-couple family households, those with no children have the highest poverty rate, with 18 households (5.8%) falling below the poverty line. Among the single-parent households, those with 1 or 2 children have the highest poverty rate, with 3 household (15.0%) living below poverty.
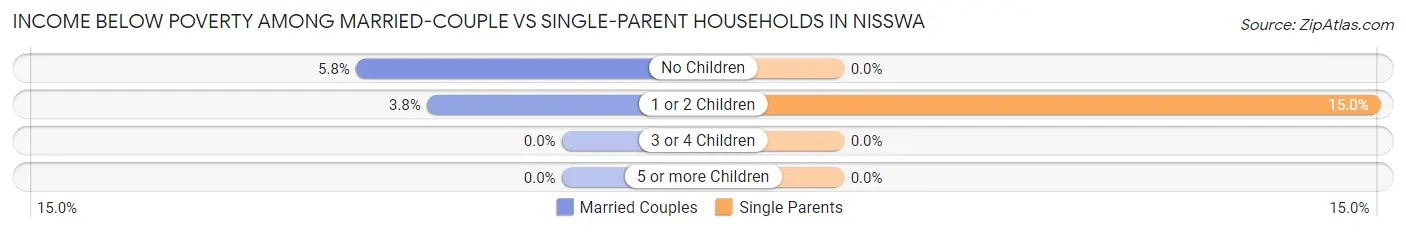
| Children | Married-Couple Families | Single-Parent Households |
| No Children | 18 (5.8%) | 0 (0.0%) |
| 1 or 2 Children | 4 (3.8%) | 3 (15.0%) |
| 3 or 4 Children | 0 (0.0%) | 0 (0.0%) |
| 5 or more Children | 0 (0.0%) | 0 (0.0%) |
| Total | 22 (4.8%) | 3 (3.8%) |
Race in Nisswa
The most populous races in Nisswa are White / Caucasian (1,619 | 93.4%), Two or more Races (80 | 4.6%), and Black / African American (30 | 1.7%).
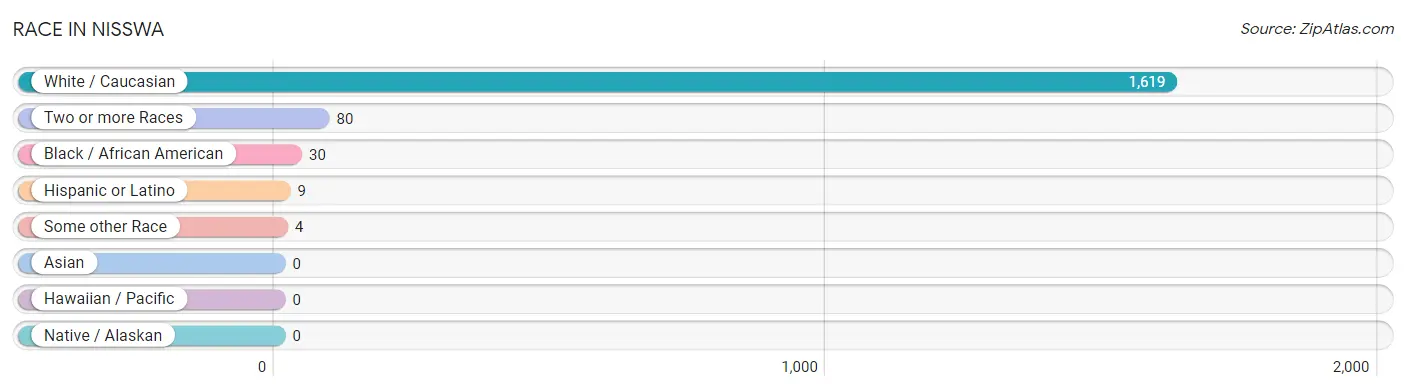
| Race | # Population | % Population |
| Asian | 0 | 0.0% |
| Black / African American | 30 | 1.7% |
| Hawaiian / Pacific | 0 | 0.0% |
| Hispanic or Latino | 9 | 0.5% |
| Native / Alaskan | 0 | 0.0% |
| White / Caucasian | 1,619 | 93.4% |
| Two or more Races | 80 | 4.6% |
| Some other Race | 4 | 0.2% |
| Total | 1,733 | 100.0% |
Ancestry in Nisswa
The most populous ancestries reported in Nisswa are German (622 | 35.9%), Norwegian (263 | 15.2%), Irish (211 | 12.2%), English (176 | 10.2%), and Swedish (124 | 7.2%), together accounting for 80.6% of all Nisswa residents.
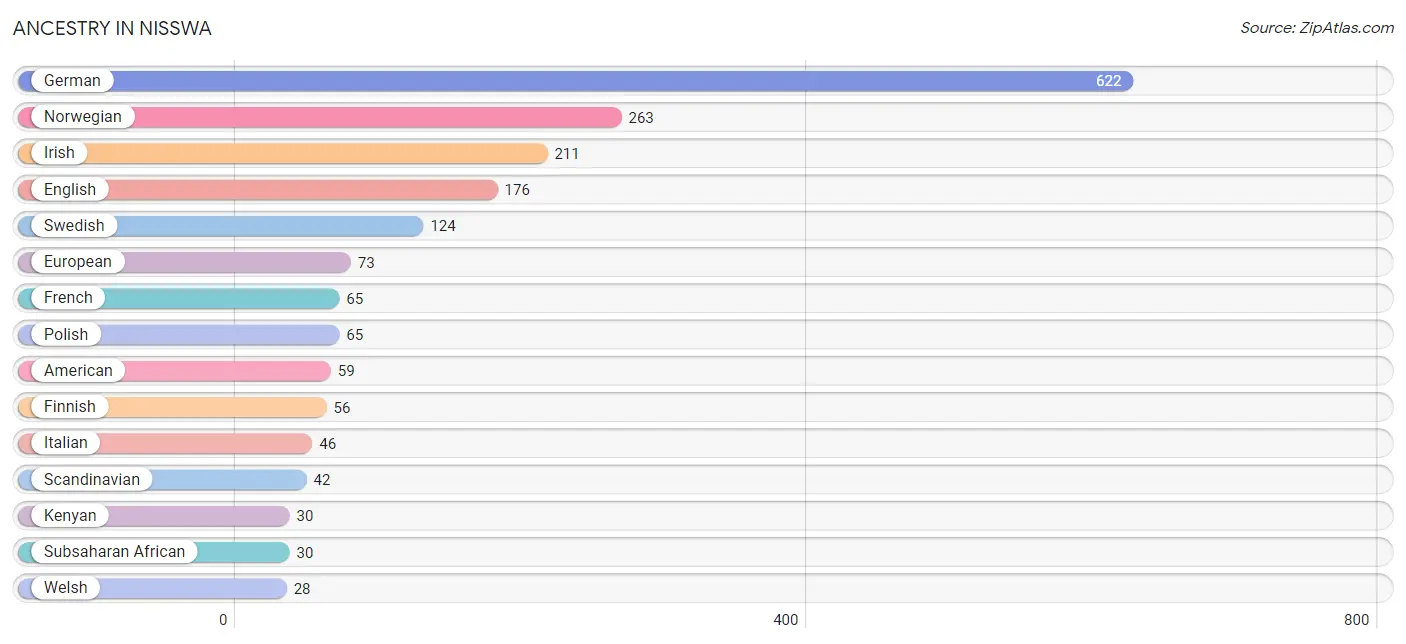
| Ancestry | # Population | % Population |
| American | 59 | 3.4% |
| British | 3 | 0.2% |
| Chippewa | 2 | 0.1% |
| Cuban | 2 | 0.1% |
| Czech | 25 | 1.4% |
| Danish | 10 | 0.6% |
| Dutch | 26 | 1.5% |
| English | 176 | 10.2% |
| European | 73 | 4.2% |
| Finnish | 56 | 3.2% |
| French | 65 | 3.7% |
| German | 622 | 35.9% |
| Hungarian | 13 | 0.7% |
| Irish | 211 | 12.2% |
| Italian | 46 | 2.6% |
| Kenyan | 30 | 1.7% |
| Mexican | 7 | 0.4% |
| Norwegian | 263 | 15.2% |
| Polish | 65 | 3.7% |
| Russian | 10 | 0.6% |
| Scandinavian | 42 | 2.4% |
| Scotch-Irish | 9 | 0.5% |
| Scottish | 19 | 1.1% |
| Serbian | 10 | 0.6% |
| Subsaharan African | 30 | 1.7% |
| Swedish | 124 | 7.2% |
| Swiss | 6 | 0.4% |
| Ukrainian | 7 | 0.4% |
| Welsh | 28 | 1.6% | View All 29 Rows |
Immigrants in Nisswa
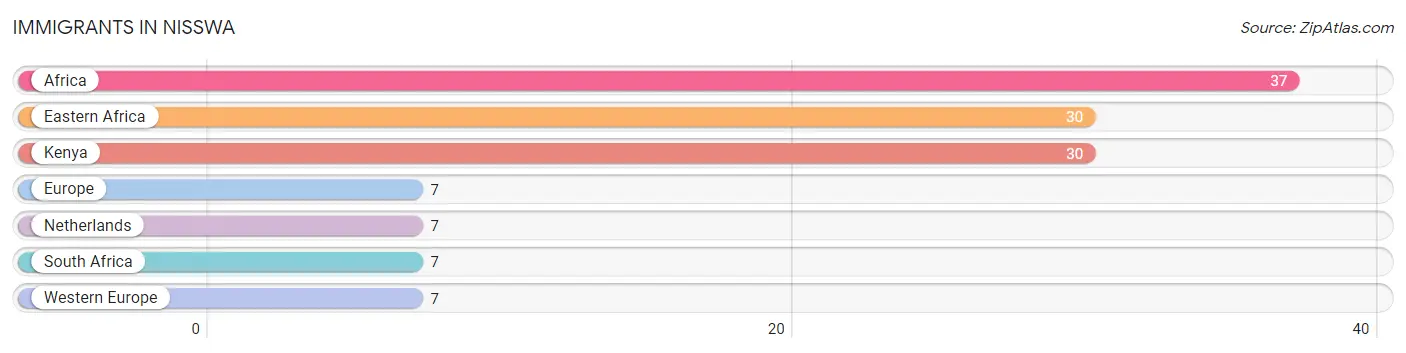
The most numerous immigrant groups reported in Nisswa came from Africa (37 | 2.1%), Eastern Africa (30 | 1.7%), Kenya (30 | 1.7%), Europe (7 | 0.4%), and Netherlands (7 | 0.4%), together accounting for 6.4% of all Nisswa residents.
| Immigration Origin | # Population | % Population |
| Africa | 37 | 2.1% |
| Eastern Africa | 30 | 1.7% |
| Europe | 7 | 0.4% |
| Kenya | 30 | 1.7% |
| Netherlands | 7 | 0.4% |
| South Africa | 7 | 0.4% |
| Western Europe | 7 | 0.4% | View All 7 Rows |
Sex and Age in Nisswa
Sex and Age in Nisswa
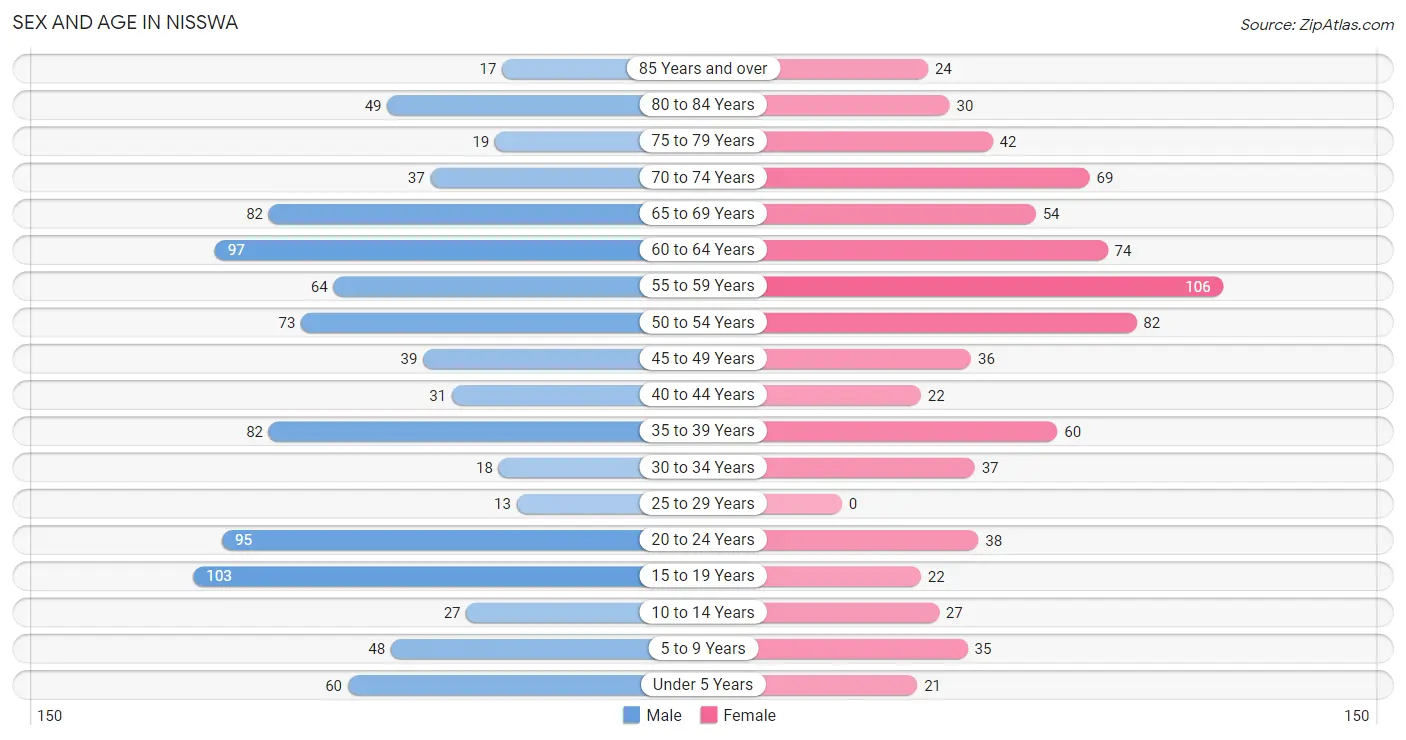
The most populous age groups in Nisswa are 15 to 19 Years (103 | 10.8%) for men and 55 to 59 Years (106 | 13.6%) for women.
| Age Bracket | Male | Female |
| Under 5 Years | 60 (6.3%) | 21 (2.7%) |
| 5 to 9 Years | 48 (5.0%) | 35 (4.5%) |
| 10 to 14 Years | 27 (2.8%) | 27 (3.5%) |
| 15 to 19 Years | 103 (10.8%) | 22 (2.8%) |
| 20 to 24 Years | 95 (10.0%) | 38 (4.9%) |
| 25 to 29 Years | 13 (1.4%) | 0 (0.0%) |
| 30 to 34 Years | 18 (1.9%) | 37 (4.8%) |
| 35 to 39 Years | 82 (8.6%) | 60 (7.7%) |
| 40 to 44 Years | 31 (3.3%) | 22 (2.8%) |
| 45 to 49 Years | 39 (4.1%) | 36 (4.6%) |
| 50 to 54 Years | 73 (7.6%) | 82 (10.5%) |
| 55 to 59 Years | 64 (6.7%) | 106 (13.6%) |
| 60 to 64 Years | 97 (10.2%) | 74 (9.5%) |
| 65 to 69 Years | 82 (8.6%) | 54 (6.9%) |
| 70 to 74 Years | 37 (3.9%) | 69 (8.9%) |
| 75 to 79 Years | 19 (2.0%) | 42 (5.4%) |
| 80 to 84 Years | 49 (5.1%) | 30 (3.8%) |
| 85 Years and over | 17 (1.8%) | 24 (3.1%) |
| Total | 954 (100.0%) | 779 (100.0%) |
Families and Households in Nisswa
Median Family Size in Nisswa
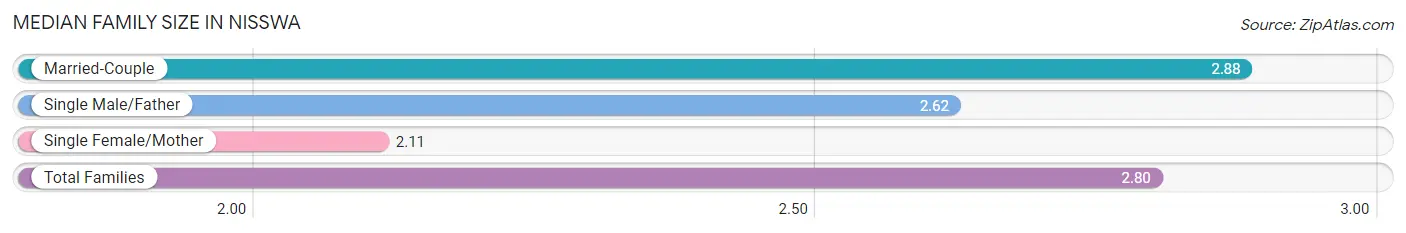
The median family size in Nisswa is 2.80 persons per family, with married-couple families (456 | 85.2%) accounting for the largest median family size of 2.88 persons per family. On the other hand, single female/mother families (45 | 8.4%) represent the smallest median family size with 2.11 persons per family.
| Family Type | # Families | Family Size |
| Married-Couple | 456 (85.2%) | 2.88 |
| Single Male/Father | 34 (6.4%) | 2.62 |
| Single Female/Mother | 45 (8.4%) | 2.11 |
| Total Families | 535 (100.0%) | 2.80 |
Median Household Size in Nisswa
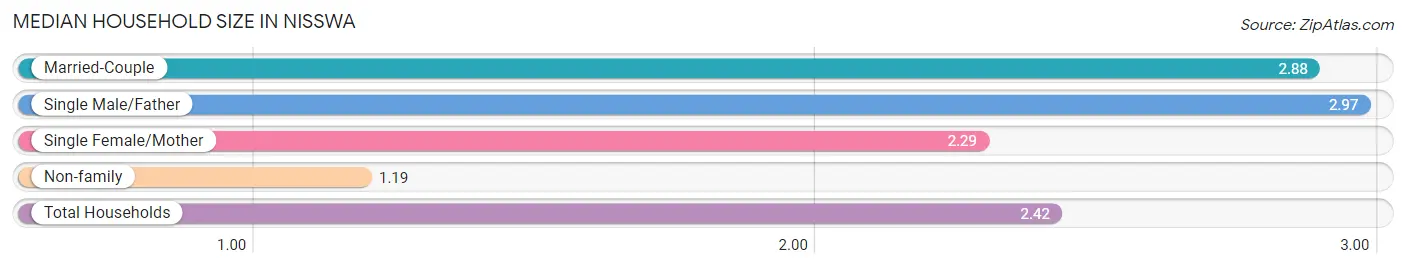
The median household size in Nisswa is 2.42 persons per household, with single male/father households (34 | 4.8%) accounting for the largest median household size of 2.97 persons per household. non-family households (180 | 25.2%) represent the smallest median household size with 1.19 persons per household.
| Household Type | # Households | Household Size |
| Married-Couple | 456 (63.8%) | 2.88 |
| Single Male/Father | 34 (4.8%) | 2.97 |
| Single Female/Mother | 45 (6.3%) | 2.29 |
| Non-family | 180 (25.2%) | 1.19 |
| Total Households | 715 (100.0%) | 2.42 |
Household Size by Marriage Status in Nisswa
Out of a total of 715 households in Nisswa, 535 (74.8%) are family households, while 180 (25.2%) are nonfamily households. The most numerous type of family households are 2-person households, comprising 275, and the most common type of nonfamily households are 1-person households, comprising 163.
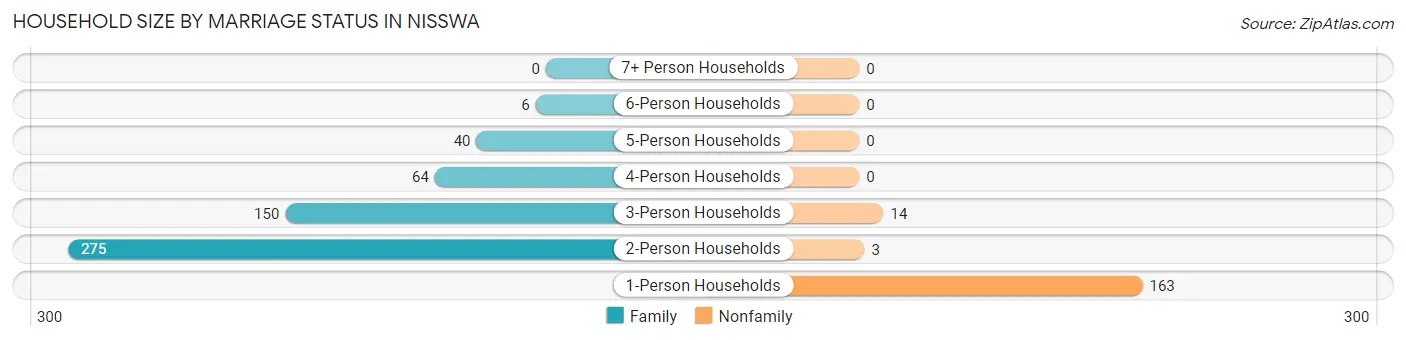
| Household Size | Family Households | Nonfamily Households |
| 1-Person Households | - | 163 (22.8%) |
| 2-Person Households | 275 (38.5%) | 3 (0.4%) |
| 3-Person Households | 150 (21.0%) | 14 (2.0%) |
| 4-Person Households | 64 (8.9%) | 0 (0.0%) |
| 5-Person Households | 40 (5.6%) | 0 (0.0%) |
| 6-Person Households | 6 (0.8%) | 0 (0.0%) |
| 7+ Person Households | 0 (0.0%) | 0 (0.0%) |
| Total | 535 (74.8%) | 180 (25.2%) |
Female Fertility in Nisswa
Fertility by Age in Nisswa
Average fertility rate in Nisswa is 118.0 births per 1,000 women. Women in the age bracket of 35 to 50 years have the highest fertility rate with 153.0 births per 1,000 women. Women in the age bracket of 35 to 50 years acount for 73.1% of all women with births.
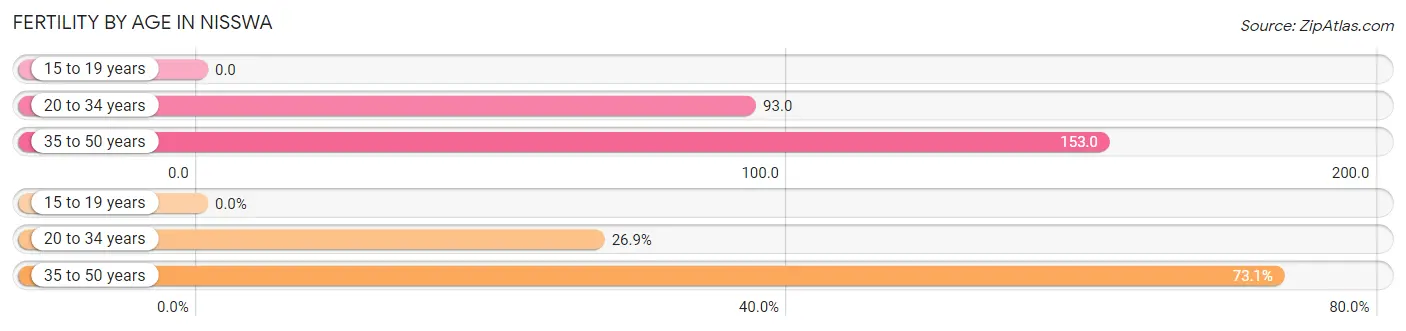
| Age Bracket | Women with Births | Births / 1,000 Women |
| 15 to 19 years | 0 (0.0%) | 0.0 |
| 20 to 34 years | 7 (26.9%) | 93.0 |
| 35 to 50 years | 19 (73.1%) | 153.0 |
| Total | 26 (100.0%) | 118.0 |
Fertility by Age by Marriage Status in Nisswa
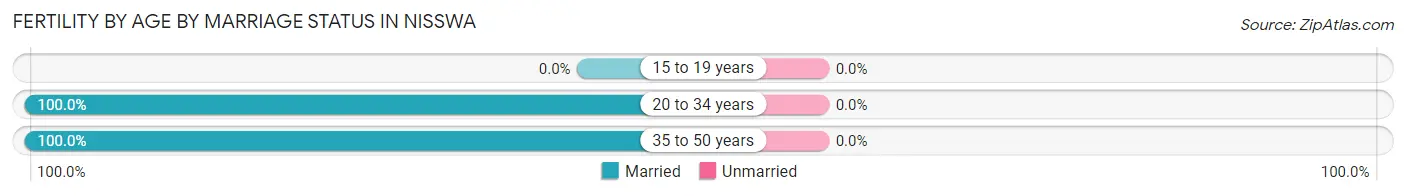
| Age Bracket | Married | Unmarried |
| 15 to 19 years | 0 (0.0%) | 0 (0.0%) |
| 20 to 34 years | 7 (100.0%) | 0 (0.0%) |
| 35 to 50 years | 19 (100.0%) | 0 (0.0%) |
| Total | 26 (100.0%) | 0 (0.0%) |
Fertility by Education in Nisswa
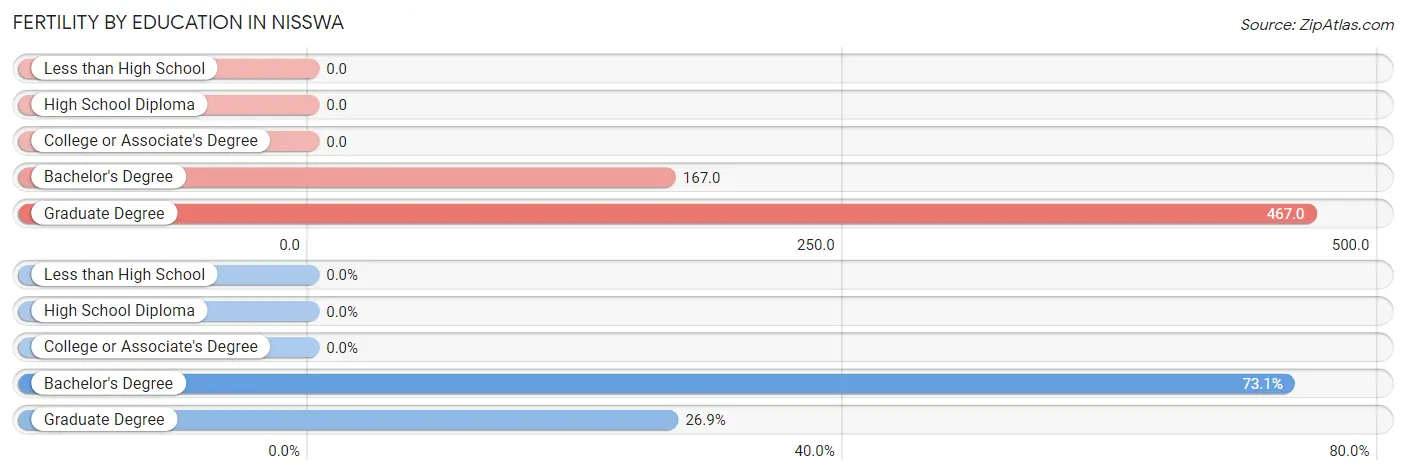
| Educational Attainment | Women with Births | Births / 1,000 Women |
| Less than High School | 0 (0.0%) | 0.0 |
| High School Diploma | 0 (0.0%) | 0.0 |
| College or Associate's Degree | 0 (0.0%) | 0.0 |
| Bachelor's Degree | 19 (73.1%) | 167.0 |
| Graduate Degree | 7 (26.9%) | 467.0 |
| Total | 26 (100.0%) | 118.0 |
Fertility by Education by Marriage Status in Nisswa
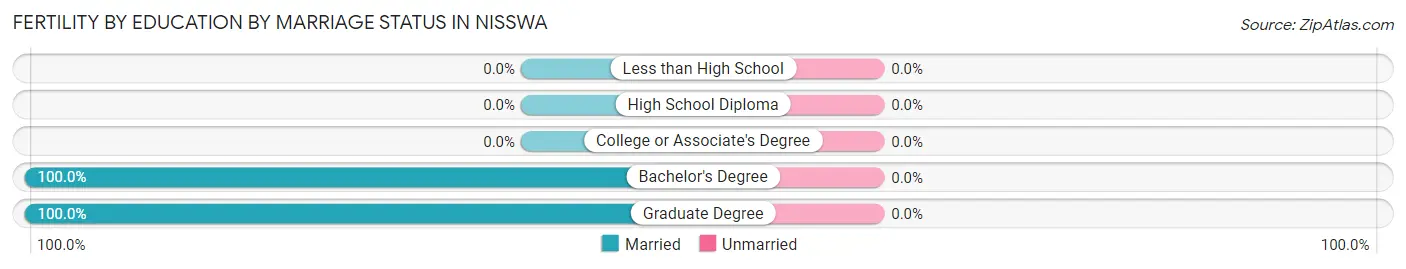
| Educational Attainment | Married | Unmarried |
| Less than High School | 0 (0.0%) | 0 (0.0%) |
| High School Diploma | 0 (0.0%) | 0 (0.0%) |
| College or Associate's Degree | 0 (0.0%) | 0 (0.0%) |
| Bachelor's Degree | 19 (100.0%) | 0 (0.0%) |
| Graduate Degree | 7 (100.0%) | 0 (0.0%) |
| Total | 26 (100.0%) | 0 (0.0%) |
Employment Characteristics in Nisswa
Employment by Class of Employer in Nisswa
Among the 958 employed individuals in Nisswa, private company employees (595 | 62.1%), not-for-profit organizations (84 | 8.8%), and self-employed (incorporated) (81 | 8.5%) make up the most common classes of employment.
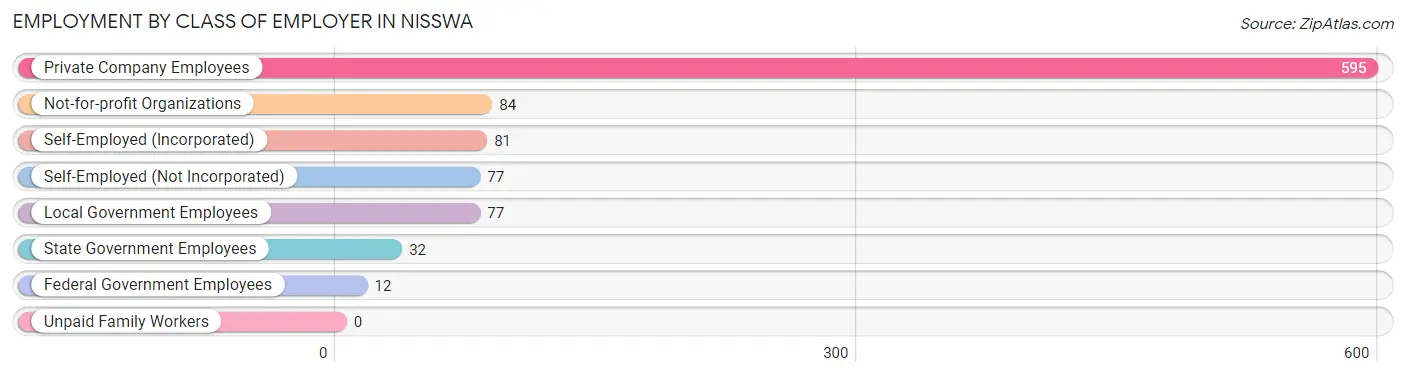
| Employer Class | # Employees | % Employees |
| Private Company Employees | 595 | 62.1% |
| Self-Employed (Incorporated) | 81 | 8.5% |
| Self-Employed (Not Incorporated) | 77 | 8.0% |
| Not-for-profit Organizations | 84 | 8.8% |
| Local Government Employees | 77 | 8.0% |
| State Government Employees | 32 | 3.3% |
| Federal Government Employees | 12 | 1.3% |
| Unpaid Family Workers | 0 | 0.0% |
| Total | 958 | 100.0% |
Employment Status by Age in Nisswa
According to the labor force statistics for Nisswa, out of the total population over 16 years of age (1,507), 64.5% or 972 individuals are in the labor force, with 1.0% or 10 of them unemployed. The age group with the highest labor force participation rate is 20 to 24 years, with 100.0% or 133 individuals in the labor force. Within the labor force, the 65 to 74 years age range has the highest percentage of unemployed individuals, with 12.3% or 7 of them being unemployed.
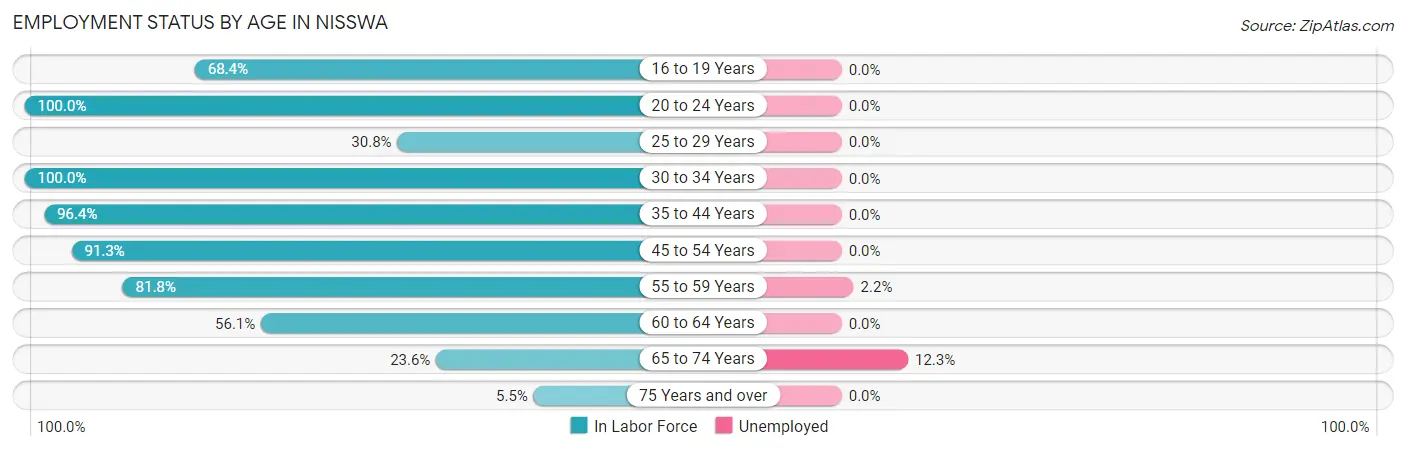
| Age Bracket | In Labor Force | Unemployed |
| 16 to 19 Years | 80 (68.4%) | 0 (0.0%) |
| 20 to 24 Years | 133 (100.0%) | 0 (0.0%) |
| 25 to 29 Years | 4 (30.8%) | 0 (0.0%) |
| 30 to 34 Years | 55 (100.0%) | 0 (0.0%) |
| 35 to 44 Years | 188 (96.4%) | 0 (0.0%) |
| 45 to 54 Years | 210 (91.3%) | 0 (0.0%) |
| 55 to 59 Years | 139 (81.8%) | 3 (2.2%) |
| 60 to 64 Years | 96 (56.1%) | 0 (0.0%) |
| 65 to 74 Years | 57 (23.6%) | 7 (12.3%) |
| 75 Years and over | 10 (5.5%) | 0 (0.0%) |
| Total | 972 (64.5%) | 10 (1.0%) |
Employment Status by Educational Attainment in Nisswa
According to labor force statistics for Nisswa, 83.0% of individuals (692) out of the total population between 25 and 64 years of age (834) are in the labor force, with 0.4% or 3 of them being unemployed. The group with the highest labor force participation rate are those with the educational attainment of high school diploma, with 93.5% or 116 individuals in the labor force. Within the labor force, individuals with less than high school education have the highest percentage of unemployment, with 100.0% or 3 of them being unemployed.
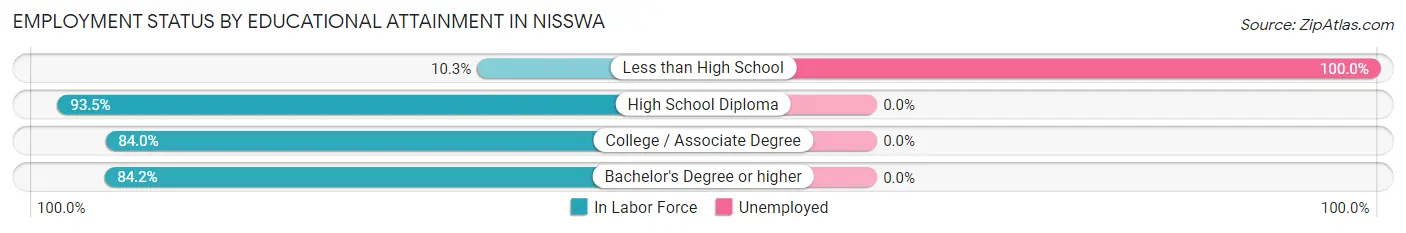
| Educational Attainment | In Labor Force | Unemployed |
| Less than High School | 3 (10.3%) | 29 (100.0%) |
| High School Diploma | 116 (93.5%) | 0 (0.0%) |
| College / Associate Degree | 194 (84.0%) | 0 (0.0%) |
| Bachelor's Degree or higher | 379 (84.2%) | 0 (0.0%) |
| Total | 692 (83.0%) | 3 (0.4%) |
Employment Occupations by Sex in Nisswa
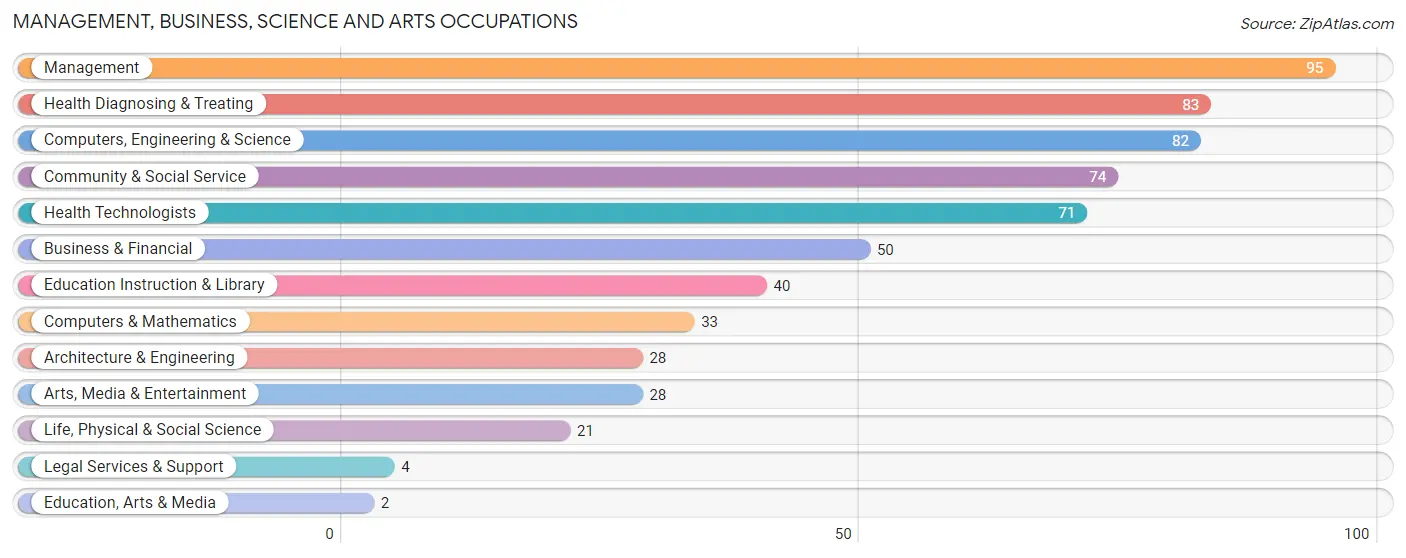
Management, Business, Science and Arts Occupations
The most common Management, Business, Science and Arts occupations in Nisswa are Management (95 | 9.9%), Health Diagnosing & Treating (83 | 8.6%), Computers, Engineering & Science (82 | 8.5%), Community & Social Service (74 | 7.7%), and Health Technologists (71 | 7.4%).
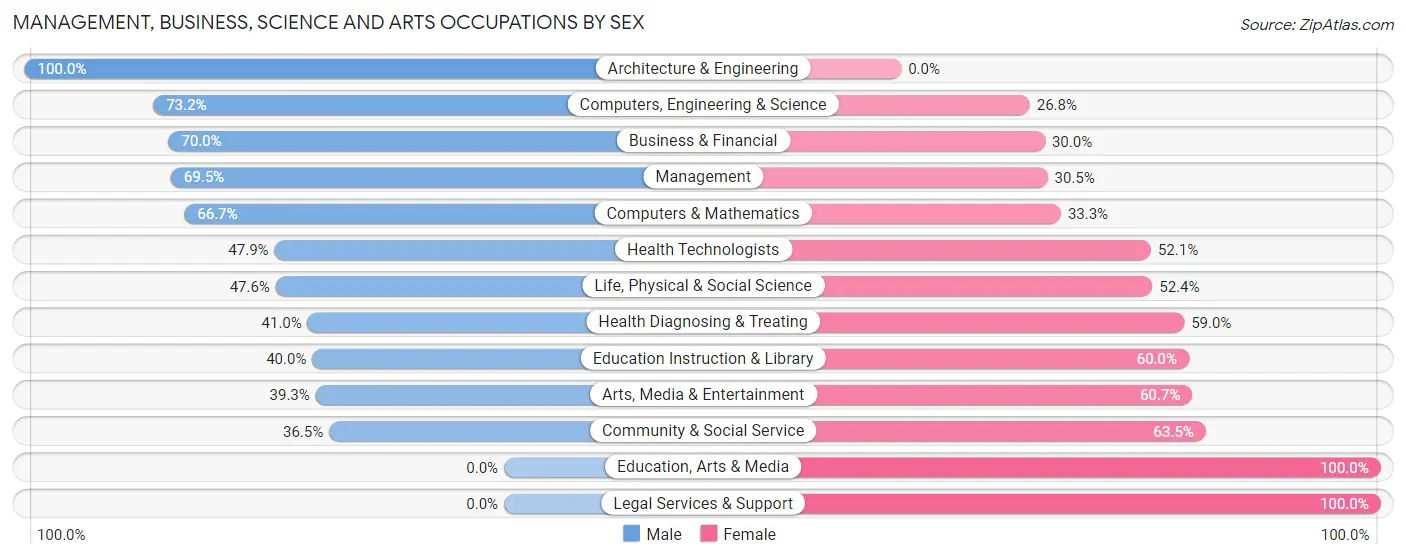
Management, Business, Science and Arts Occupations by Sex
Within the Management, Business, Science and Arts occupations in Nisswa, the most male-oriented occupations are Architecture & Engineering (100.0%), Computers, Engineering & Science (73.2%), and Business & Financial (70.0%), while the most female-oriented occupations are Education, Arts & Media (100.0%), Legal Services & Support (100.0%), and Community & Social Service (63.5%).
| Occupation | Male | Female |
| Management | 66 (69.5%) | 29 (30.5%) |
| Business & Financial | 35 (70.0%) | 15 (30.0%) |
| Computers, Engineering & Science | 60 (73.2%) | 22 (26.8%) |
| Computers & Mathematics | 22 (66.7%) | 11 (33.3%) |
| Architecture & Engineering | 28 (100.0%) | 0 (0.0%) |
| Life, Physical & Social Science | 10 (47.6%) | 11 (52.4%) |
| Community & Social Service | 27 (36.5%) | 47 (63.5%) |
| Education, Arts & Media | 0 (0.0%) | 2 (100.0%) |
| Legal Services & Support | 0 (0.0%) | 4 (100.0%) |
| Education Instruction & Library | 16 (40.0%) | 24 (60.0%) |
| Arts, Media & Entertainment | 11 (39.3%) | 17 (60.7%) |
| Health Diagnosing & Treating | 34 (41.0%) | 49 (59.0%) |
| Health Technologists | 34 (47.9%) | 37 (52.1%) |
| Total (Category) | 222 (57.8%) | 162 (42.2%) |
| Total (Overall) | 543 (56.4%) | 419 (43.6%) |
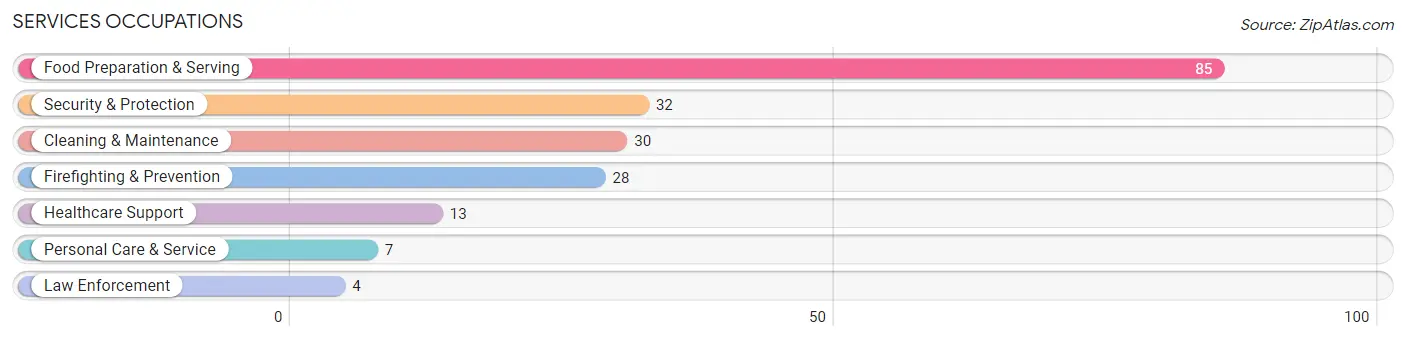
Services Occupations
The most common Services occupations in Nisswa are Food Preparation & Serving (85 | 8.8%), Security & Protection (32 | 3.3%), Cleaning & Maintenance (30 | 3.1%), Firefighting & Prevention (28 | 2.9%), and Healthcare Support (13 | 1.3%).
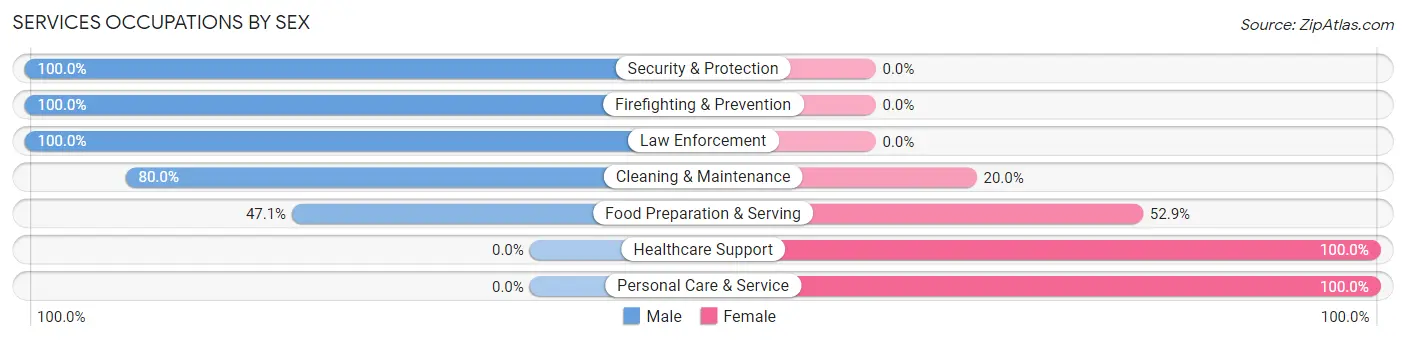
Services Occupations by Sex
Within the Services occupations in Nisswa, the most male-oriented occupations are Security & Protection (100.0%), Firefighting & Prevention (100.0%), and Law Enforcement (100.0%), while the most female-oriented occupations are Healthcare Support (100.0%), Personal Care & Service (100.0%), and Food Preparation & Serving (52.9%).
| Occupation | Male | Female |
| Healthcare Support | 0 (0.0%) | 13 (100.0%) |
| Security & Protection | 32 (100.0%) | 0 (0.0%) |
| Firefighting & Prevention | 28 (100.0%) | 0 (0.0%) |
| Law Enforcement | 4 (100.0%) | 0 (0.0%) |
| Food Preparation & Serving | 40 (47.1%) | 45 (52.9%) |
| Cleaning & Maintenance | 24 (80.0%) | 6 (20.0%) |
| Personal Care & Service | 0 (0.0%) | 7 (100.0%) |
| Total (Category) | 96 (57.5%) | 71 (42.5%) |
| Total (Overall) | 543 (56.4%) | 419 (43.6%) |
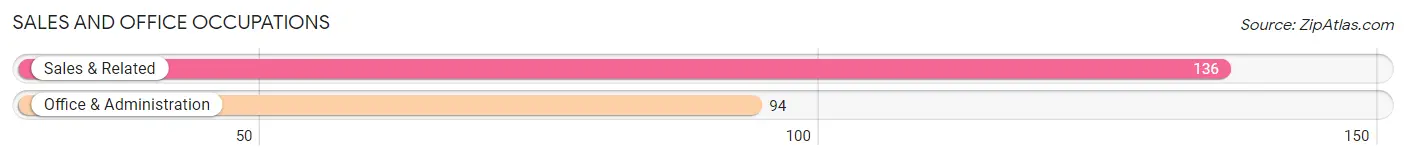
Sales and Office Occupations
The most common Sales and Office occupations in Nisswa are Sales & Related (136 | 14.1%), and Office & Administration (94 | 9.8%).
Sales and Office Occupations by Sex
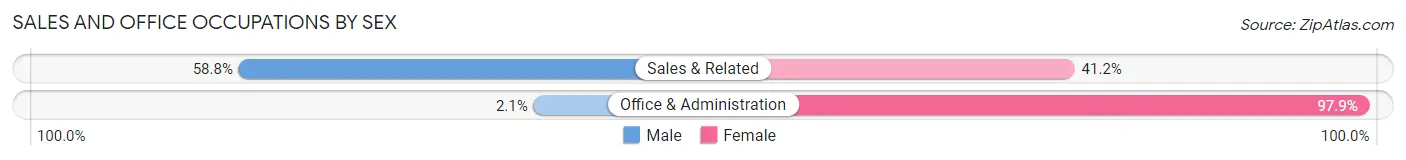
| Occupation | Male | Female |
| Sales & Related | 80 (58.8%) | 56 (41.2%) |
| Office & Administration | 2 (2.1%) | 92 (97.9%) |
| Total (Category) | 82 (35.6%) | 148 (64.3%) |
| Total (Overall) | 543 (56.4%) | 419 (43.6%) |
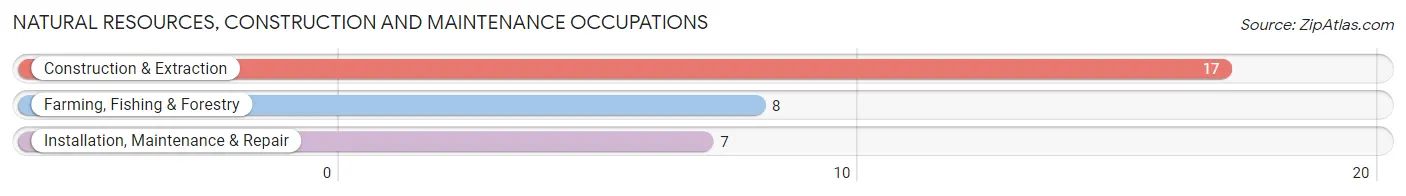
Natural Resources, Construction and Maintenance Occupations
The most common Natural Resources, Construction and Maintenance occupations in Nisswa are Construction & Extraction (17 | 1.8%), Farming, Fishing & Forestry (8 | 0.8%), and Installation, Maintenance & Repair (7 | 0.7%).
Natural Resources, Construction and Maintenance Occupations by Sex
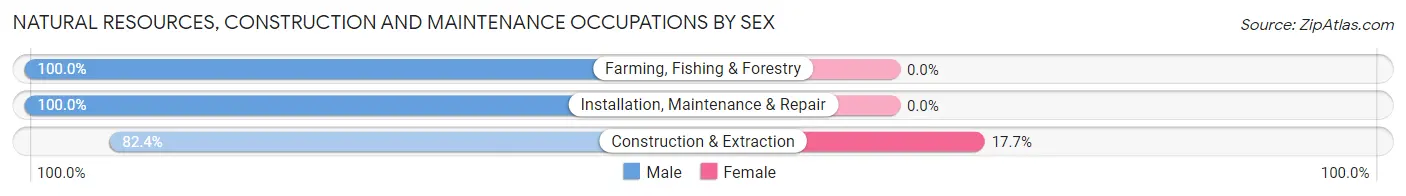
| Occupation | Male | Female |
| Farming, Fishing & Forestry | 8 (100.0%) | 0 (0.0%) |
| Construction & Extraction | 14 (82.4%) | 3 (17.6%) |
| Installation, Maintenance & Repair | 7 (100.0%) | 0 (0.0%) |
| Total (Category) | 29 (90.6%) | 3 (9.4%) |
| Total (Overall) | 543 (56.4%) | 419 (43.6%) |
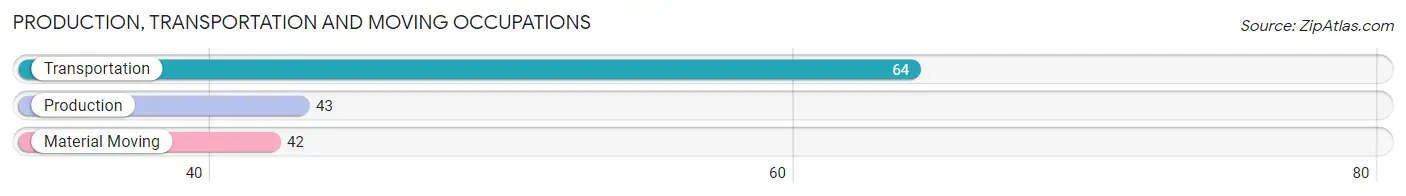
Production, Transportation and Moving Occupations
The most common Production, Transportation and Moving occupations in Nisswa are Transportation (64 | 6.7%), Production (43 | 4.5%), and Material Moving (42 | 4.4%).
Production, Transportation and Moving Occupations by Sex
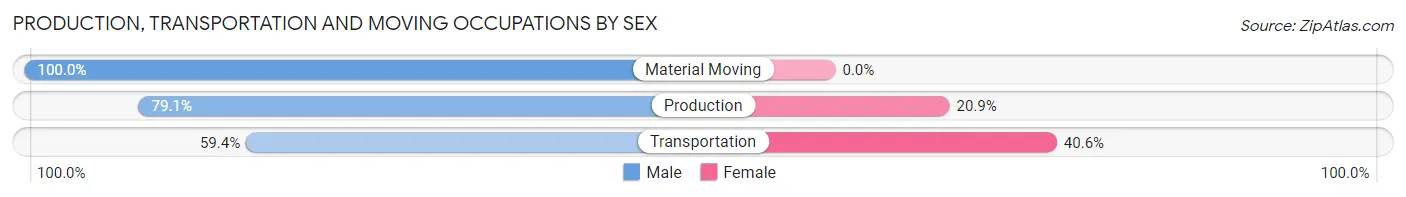
| Occupation | Male | Female |
| Production | 34 (79.1%) | 9 (20.9%) |
| Transportation | 38 (59.4%) | 26 (40.6%) |
| Material Moving | 42 (100.0%) | 0 (0.0%) |
| Total (Category) | 114 (76.5%) | 35 (23.5%) |
| Total (Overall) | 543 (56.4%) | 419 (43.6%) |
Employment Industries by Sex in Nisswa
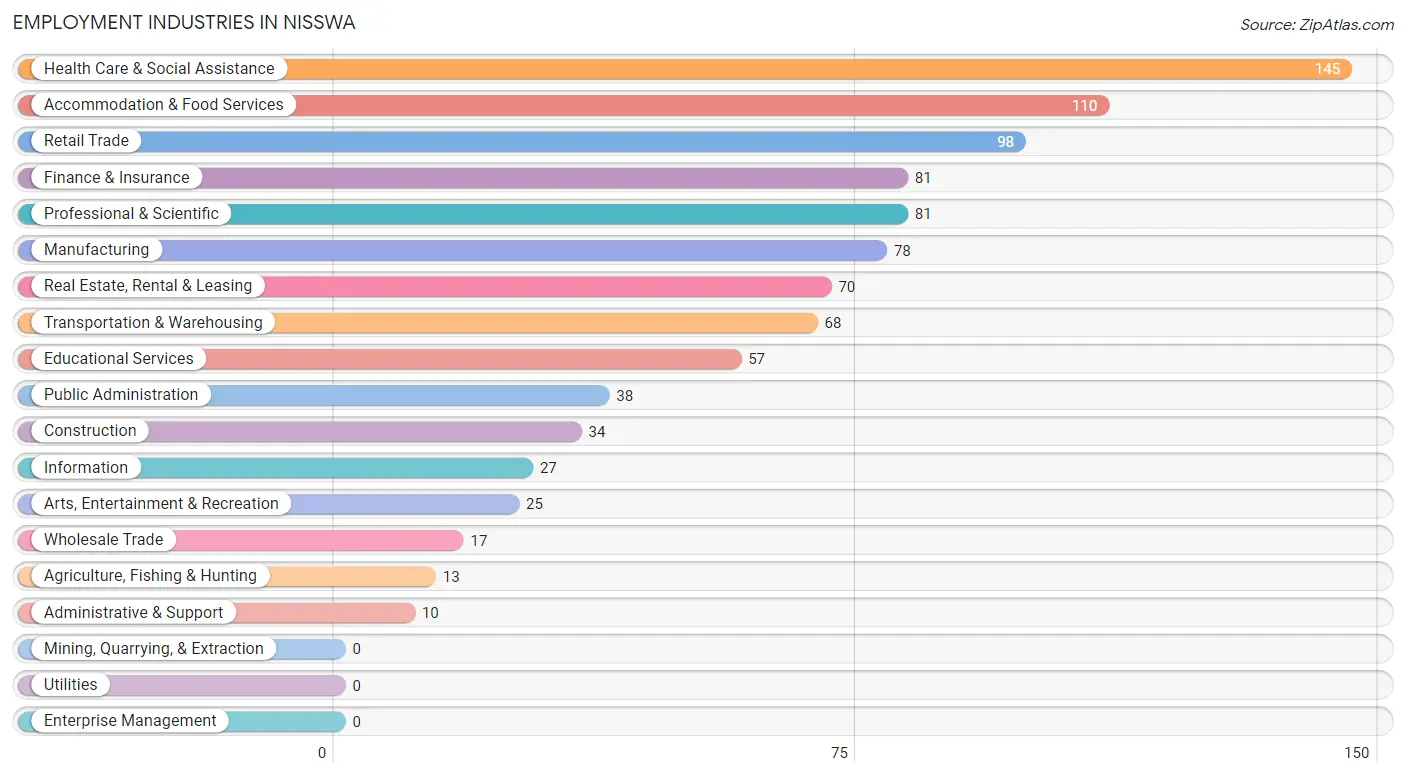
Employment Industries in Nisswa
The major employment industries in Nisswa include Health Care & Social Assistance (145 | 15.1%), Accommodation & Food Services (110 | 11.4%), Retail Trade (98 | 10.2%), Finance & Insurance (81 | 8.4%), and Professional & Scientific (81 | 8.4%).
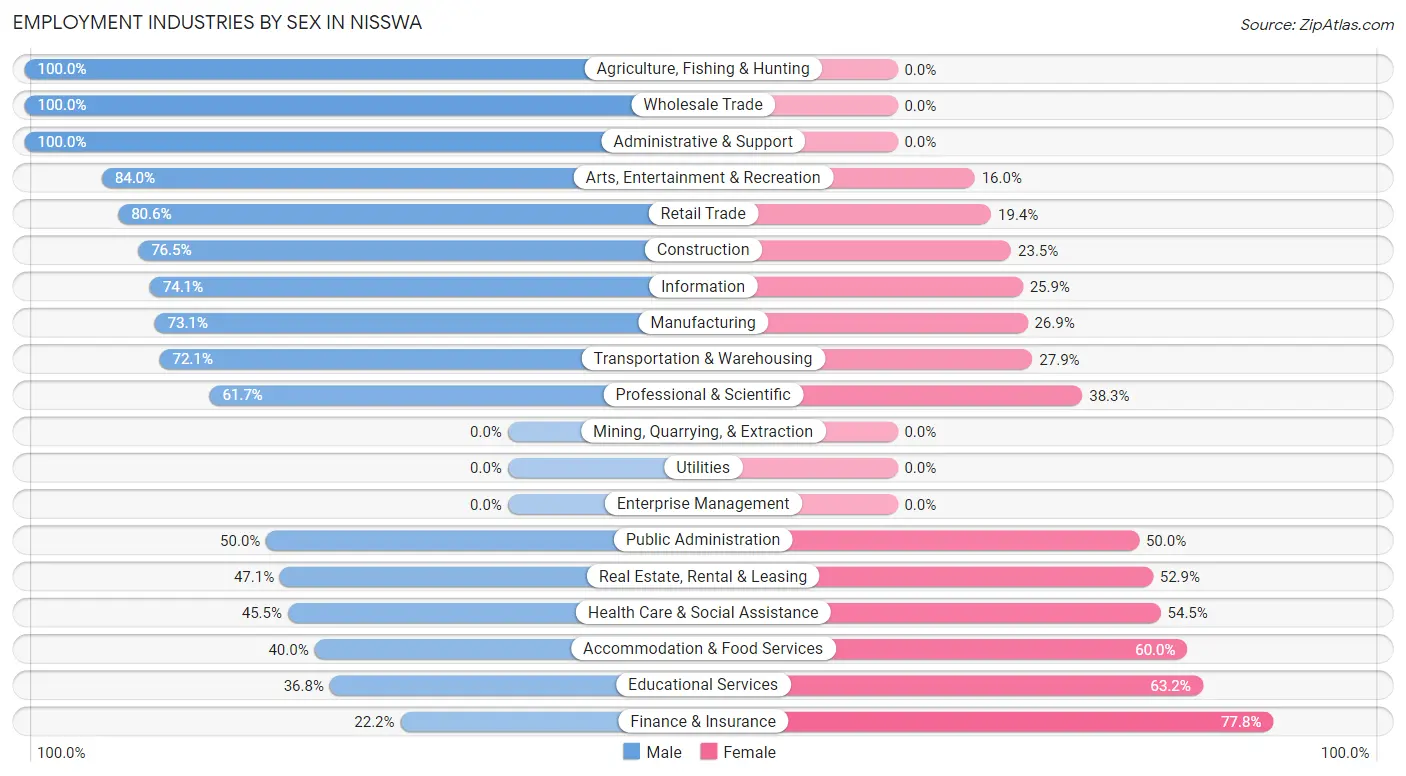
Employment Industries by Sex in Nisswa
The Nisswa industries that see more men than women are Agriculture, Fishing & Hunting (100.0%), Wholesale Trade (100.0%), and Administrative & Support (100.0%), whereas the industries that tend to have a higher number of women are Finance & Insurance (77.8%), Educational Services (63.2%), and Accommodation & Food Services (60.0%).
| Industry | Male | Female |
| Agriculture, Fishing & Hunting | 13 (100.0%) | 0 (0.0%) |
| Mining, Quarrying, & Extraction | 0 (0.0%) | 0 (0.0%) |
| Construction | 26 (76.5%) | 8 (23.5%) |
| Manufacturing | 57 (73.1%) | 21 (26.9%) |
| Wholesale Trade | 17 (100.0%) | 0 (0.0%) |
| Retail Trade | 79 (80.6%) | 19 (19.4%) |
| Transportation & Warehousing | 49 (72.1%) | 19 (27.9%) |
| Utilities | 0 (0.0%) | 0 (0.0%) |
| Information | 20 (74.1%) | 7 (25.9%) |
| Finance & Insurance | 18 (22.2%) | 63 (77.8%) |
| Real Estate, Rental & Leasing | 33 (47.1%) | 37 (52.9%) |
| Professional & Scientific | 50 (61.7%) | 31 (38.3%) |
| Enterprise Management | 0 (0.0%) | 0 (0.0%) |
| Administrative & Support | 10 (100.0%) | 0 (0.0%) |
| Educational Services | 21 (36.8%) | 36 (63.2%) |
| Health Care & Social Assistance | 66 (45.5%) | 79 (54.5%) |
| Arts, Entertainment & Recreation | 21 (84.0%) | 4 (16.0%) |
| Accommodation & Food Services | 44 (40.0%) | 66 (60.0%) |
| Public Administration | 19 (50.0%) | 19 (50.0%) |
| Total | 543 (56.4%) | 419 (43.6%) |
Education in Nisswa
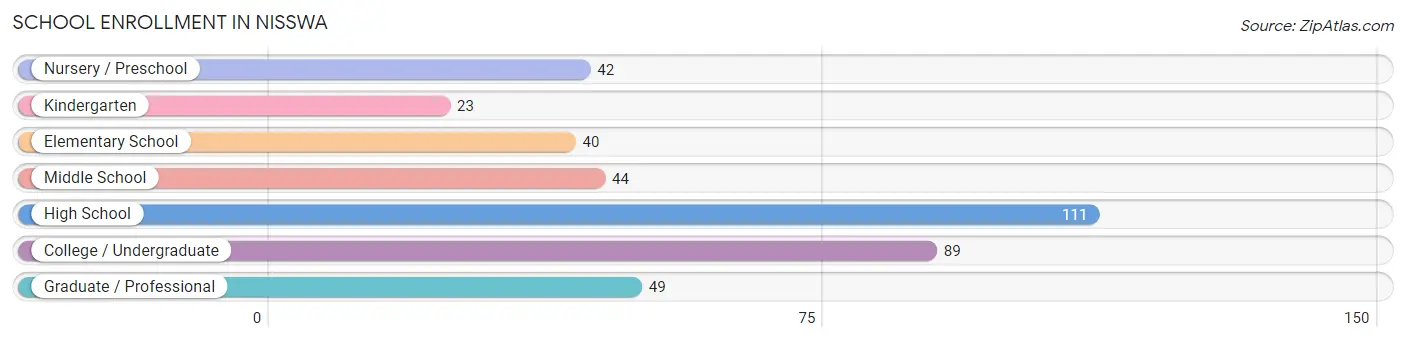
School Enrollment in Nisswa
The most common levels of schooling among the 398 students in Nisswa are high school (111 | 27.9%), college / undergraduate (89 | 22.4%), and graduate / professional (49 | 12.3%).
| School Level | # Students | % Students |
| Nursery / Preschool | 42 | 10.5% |
| Kindergarten | 23 | 5.8% |
| Elementary School | 40 | 10.1% |
| Middle School | 44 | 11.1% |
| High School | 111 | 27.9% |
| College / Undergraduate | 89 | 22.4% |
| Graduate / Professional | 49 | 12.3% |
| Total | 398 | 100.0% |
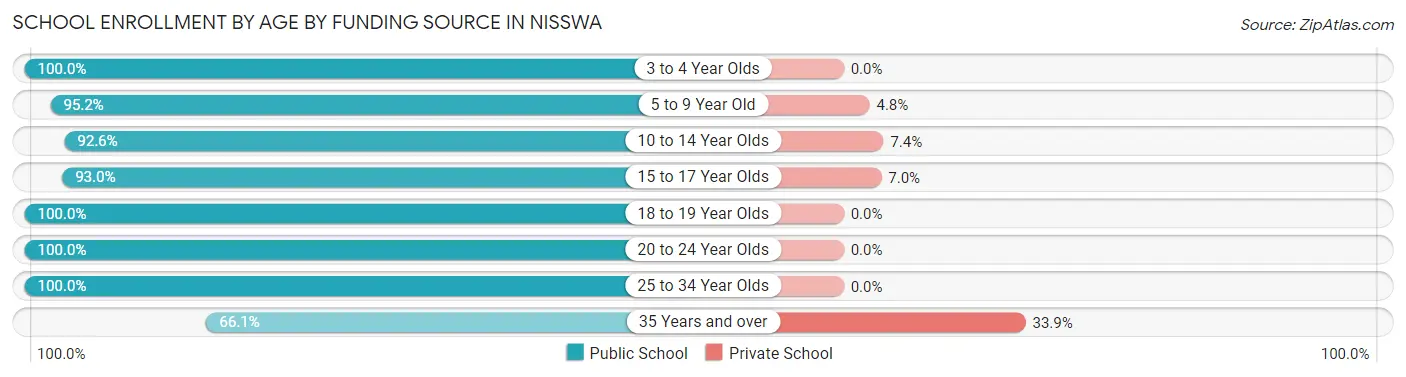
School Enrollment by Age by Funding Source in Nisswa
Out of a total of 398 students who are enrolled in schools in Nisswa, 33 (8.3%) attend a private institution, while the remaining 365 (91.7%) are enrolled in public schools. The age group of 35 years and over has the highest likelihood of being enrolled in private schools, with 21 (33.9% in the age bracket) enrolled. Conversely, the age group of 3 to 4 year olds has the lowest likelihood of being enrolled in a private school, with 14 (100.0% in the age bracket) attending a public institution.
| Age Bracket | Public School | Private School |
| 3 to 4 Year Olds | 14 (100.0%) | 0 (0.0%) |
| 5 to 9 Year Old | 79 (95.2%) | 4 (4.8%) |
| 10 to 14 Year Olds | 50 (92.6%) | 4 (7.4%) |
| 15 to 17 Year Olds | 53 (93.0%) | 4 (7.0%) |
| 18 to 19 Year Olds | 62 (100.0%) | 0 (0.0%) |
| 20 to 24 Year Olds | 56 (100.0%) | 0 (0.0%) |
| 25 to 34 Year Olds | 10 (100.0%) | 0 (0.0%) |
| 35 Years and over | 41 (66.1%) | 21 (33.9%) |
| Total | 365 (91.7%) | 33 (8.3%) |
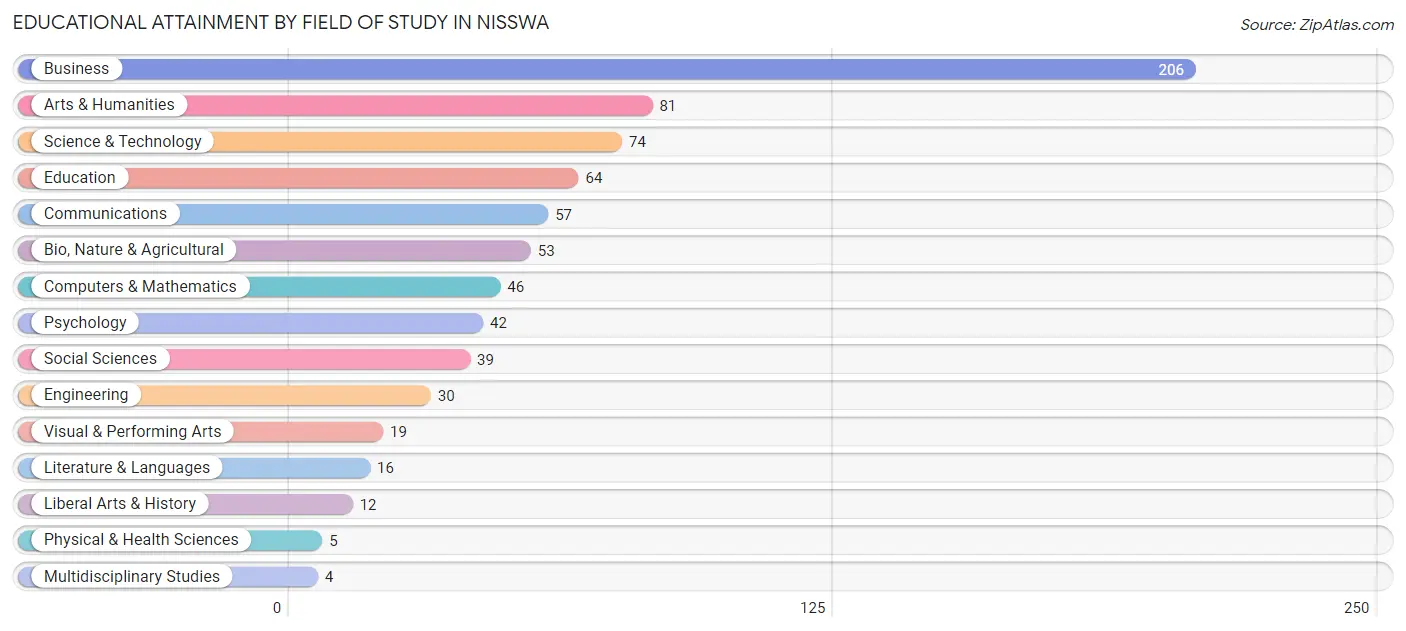
Educational Attainment by Field of Study in Nisswa
Business (206 | 27.5%), arts & humanities (81 | 10.8%), science & technology (74 | 9.9%), education (64 | 8.6%), and communications (57 | 7.6%) are the most common fields of study among 748 individuals in Nisswa who have obtained a bachelor's degree or higher.
| Field of Study | # Graduates | % Graduates |
| Computers & Mathematics | 46 | 6.1% |
| Bio, Nature & Agricultural | 53 | 7.1% |
| Physical & Health Sciences | 5 | 0.7% |
| Psychology | 42 | 5.6% |
| Social Sciences | 39 | 5.2% |
| Engineering | 30 | 4.0% |
| Multidisciplinary Studies | 4 | 0.5% |
| Science & Technology | 74 | 9.9% |
| Business | 206 | 27.5% |
| Education | 64 | 8.6% |
| Literature & Languages | 16 | 2.1% |
| Liberal Arts & History | 12 | 1.6% |
| Visual & Performing Arts | 19 | 2.5% |
| Communications | 57 | 7.6% |
| Arts & Humanities | 81 | 10.8% |
| Total | 748 | 100.0% |
Transportation & Commute in Nisswa
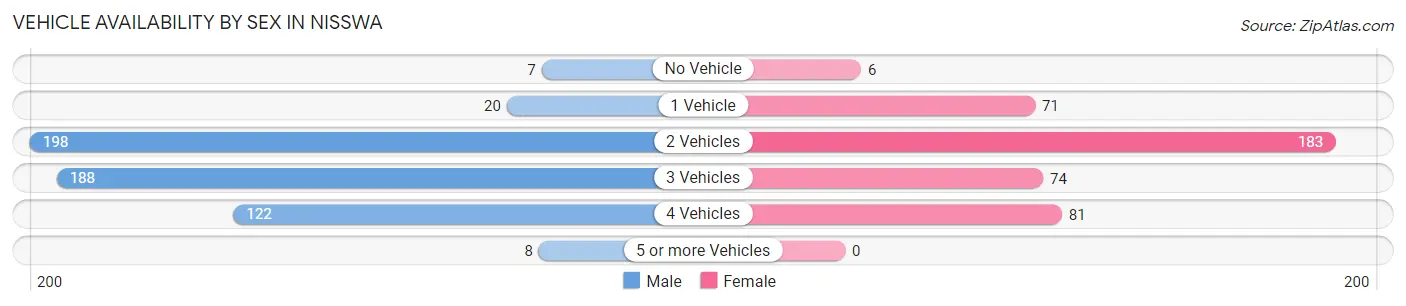
Vehicle Availability by Sex in Nisswa
The most prevalent vehicle ownership categories in Nisswa are males with 2 vehicles (198, accounting for 36.5%) and females with 2 vehicles (183, making up 47.7%).
| Vehicles Available | Male | Female |
| No Vehicle | 7 (1.3%) | 6 (1.5%) |
| 1 Vehicle | 20 (3.7%) | 71 (17.1%) |
| 2 Vehicles | 198 (36.5%) | 183 (44.1%) |
| 3 Vehicles | 188 (34.6%) | 74 (17.8%) |
| 4 Vehicles | 122 (22.5%) | 81 (19.5%) |
| 5 or more Vehicles | 8 (1.5%) | 0 (0.0%) |
| Total | 543 (100.0%) | 415 (100.0%) |
Commute Time in Nisswa
The most frequently occuring commute durations in Nisswa are 20 to 24 minutes (160 commuters, 19.3%), 5 to 9 minutes (137 commuters, 16.6%), and 10 to 14 minutes (128 commuters, 15.5%).
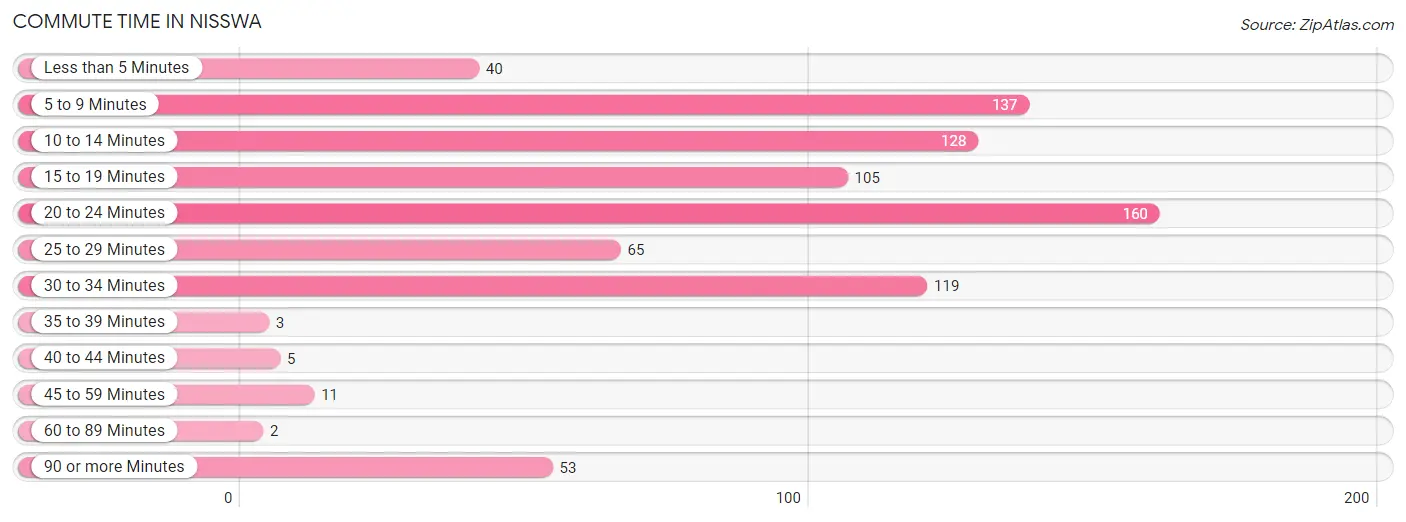
| Commute Time | # Commuters | % Commuters |
| Less than 5 Minutes | 40 | 4.8% |
| 5 to 9 Minutes | 137 | 16.6% |
| 10 to 14 Minutes | 128 | 15.5% |
| 15 to 19 Minutes | 105 | 12.7% |
| 20 to 24 Minutes | 160 | 19.3% |
| 25 to 29 Minutes | 65 | 7.9% |
| 30 to 34 Minutes | 119 | 14.4% |
| 35 to 39 Minutes | 3 | 0.4% |
| 40 to 44 Minutes | 5 | 0.6% |
| 45 to 59 Minutes | 11 | 1.3% |
| 60 to 89 Minutes | 2 | 0.2% |
| 90 or more Minutes | 53 | 6.4% |
Commute Time by Sex in Nisswa
The most common commute times in Nisswa are 20 to 24 minutes (94 commuters, 19.2%) for males and 20 to 24 minutes (66 commuters, 19.5%) for females.
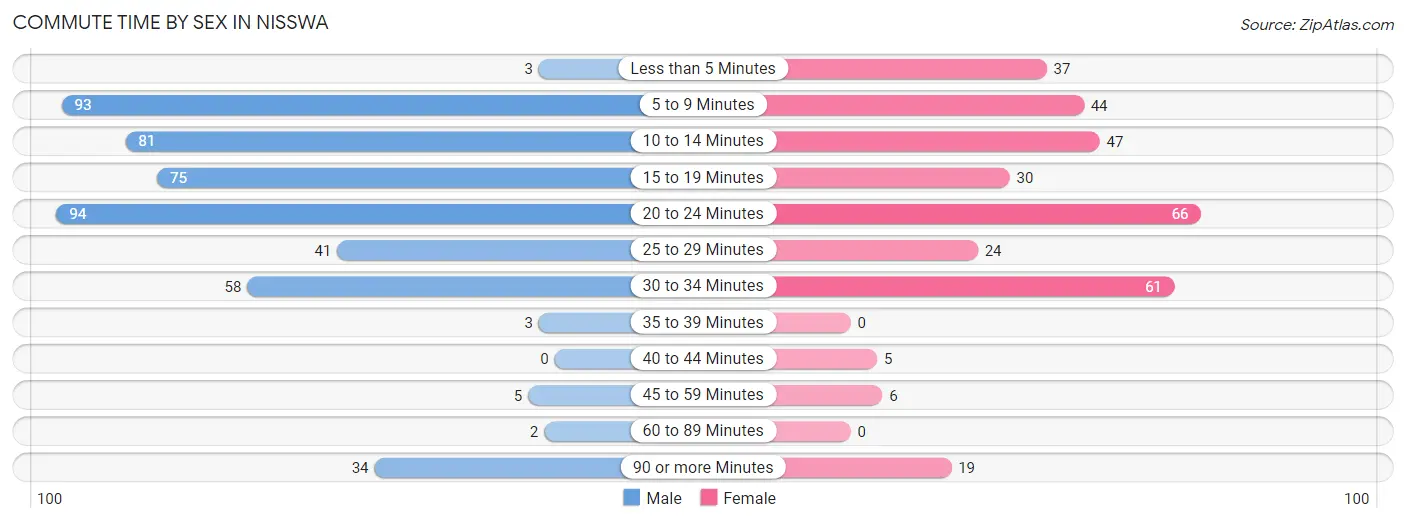
| Commute Time | Male | Female |
| Less than 5 Minutes | 3 (0.6%) | 37 (10.9%) |
| 5 to 9 Minutes | 93 (19.0%) | 44 (13.0%) |
| 10 to 14 Minutes | 81 (16.6%) | 47 (13.9%) |
| 15 to 19 Minutes | 75 (15.3%) | 30 (8.8%) |
| 20 to 24 Minutes | 94 (19.2%) | 66 (19.5%) |
| 25 to 29 Minutes | 41 (8.4%) | 24 (7.1%) |
| 30 to 34 Minutes | 58 (11.9%) | 61 (18.0%) |
| 35 to 39 Minutes | 3 (0.6%) | 0 (0.0%) |
| 40 to 44 Minutes | 0 (0.0%) | 5 (1.5%) |
| 45 to 59 Minutes | 5 (1.0%) | 6 (1.8%) |
| 60 to 89 Minutes | 2 (0.4%) | 0 (0.0%) |
| 90 or more Minutes | 34 (7.0%) | 19 (5.6%) |
Time of Departure to Work by Sex in Nisswa
The most frequent times of departure to work in Nisswa are 8:00 AM to 8:29 AM (99, 20.3%) for males and 7:00 AM to 7:29 AM (75, 22.1%) for females.
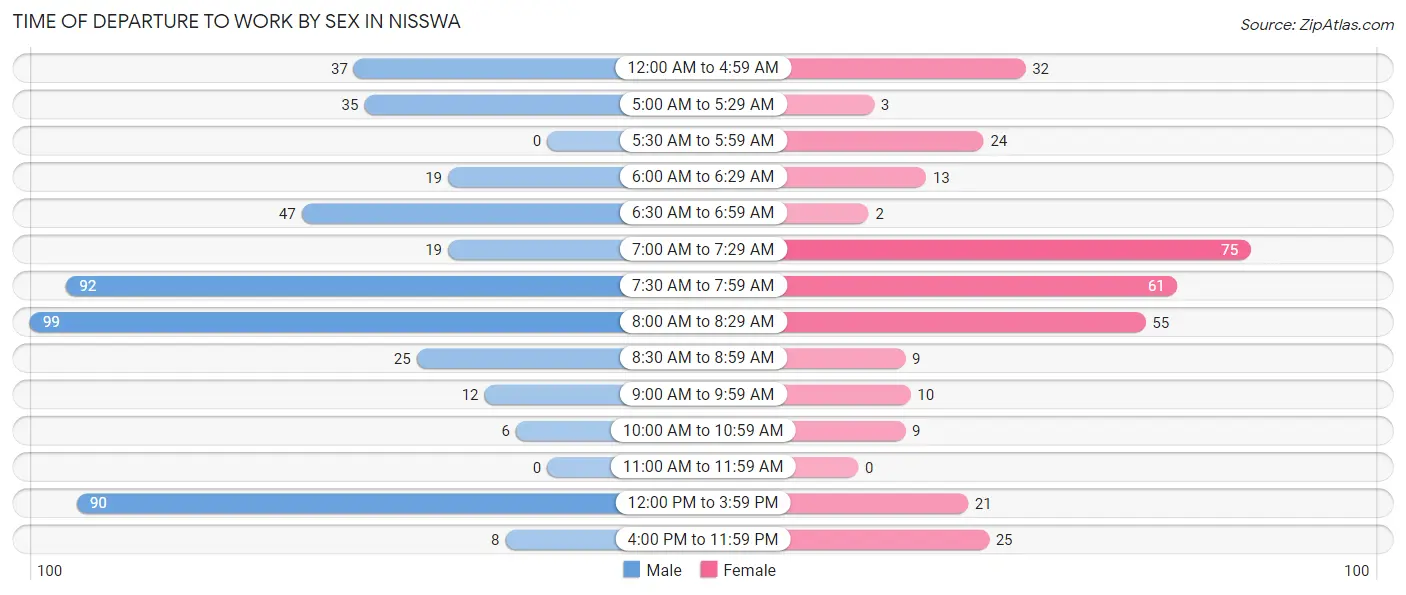
| Time of Departure | Male | Female |
| 12:00 AM to 4:59 AM | 37 (7.6%) | 32 (9.4%) |
| 5:00 AM to 5:29 AM | 35 (7.2%) | 3 (0.9%) |
| 5:30 AM to 5:59 AM | 0 (0.0%) | 24 (7.1%) |
| 6:00 AM to 6:29 AM | 19 (3.9%) | 13 (3.8%) |
| 6:30 AM to 6:59 AM | 47 (9.6%) | 2 (0.6%) |
| 7:00 AM to 7:29 AM | 19 (3.9%) | 75 (22.1%) |
| 7:30 AM to 7:59 AM | 92 (18.8%) | 61 (18.0%) |
| 8:00 AM to 8:29 AM | 99 (20.3%) | 55 (16.2%) |
| 8:30 AM to 8:59 AM | 25 (5.1%) | 9 (2.6%) |
| 9:00 AM to 9:59 AM | 12 (2.5%) | 10 (2.9%) |
| 10:00 AM to 10:59 AM | 6 (1.2%) | 9 (2.6%) |
| 11:00 AM to 11:59 AM | 0 (0.0%) | 0 (0.0%) |
| 12:00 PM to 3:59 PM | 90 (18.4%) | 21 (6.2%) |
| 4:00 PM to 11:59 PM | 8 (1.6%) | 25 (7.4%) |
| Total | 489 (100.0%) | 339 (100.0%) |
Housing Occupancy in Nisswa
Occupancy by Ownership in Nisswa
Of the total 715 dwellings in Nisswa, owner-occupied units account for 675 (94.4%), while renter-occupied units make up 40 (5.6%).
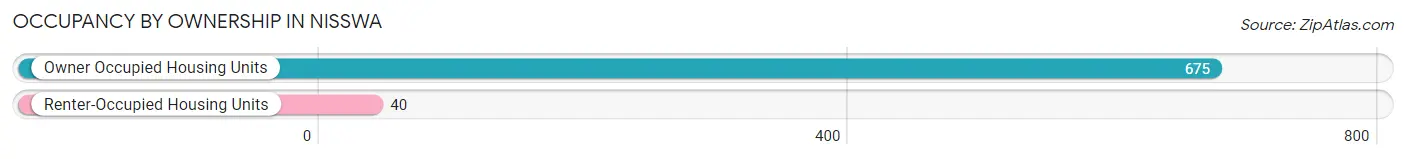
| Occupancy | # Housing Units | % Housing Units |
| Owner Occupied Housing Units | 675 | 94.4% |
| Renter-Occupied Housing Units | 40 | 5.6% |
| Total Occupied Housing Units | 715 | 100.0% |
Occupancy by Household Size in Nisswa
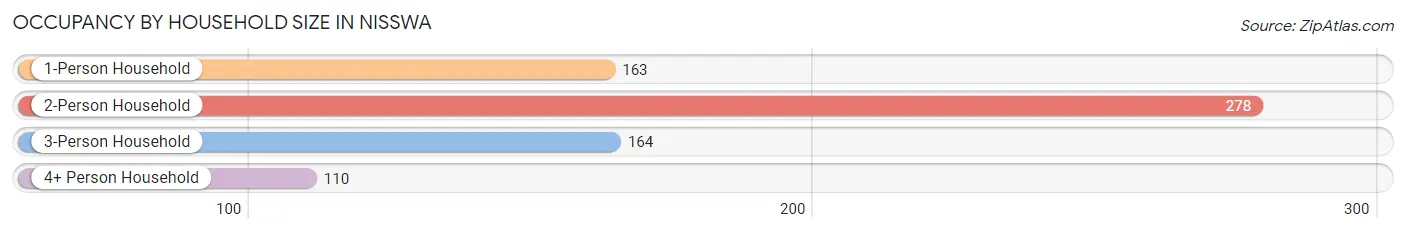
| Household Size | # Housing Units | % Housing Units |
| 1-Person Household | 163 | 22.8% |
| 2-Person Household | 278 | 38.9% |
| 3-Person Household | 164 | 22.9% |
| 4+ Person Household | 110 | 15.4% |
| Total Housing Units | 715 | 100.0% |
Occupancy by Ownership by Household Size in Nisswa
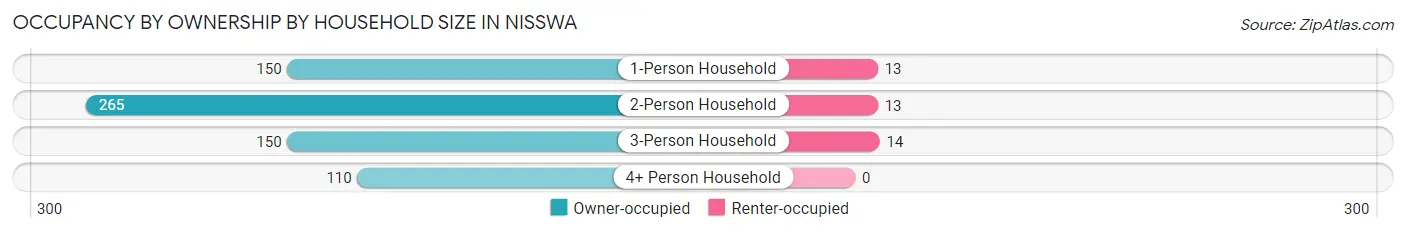
| Household Size | Owner-occupied | Renter-occupied |
| 1-Person Household | 150 (92.0%) | 13 (8.0%) |
| 2-Person Household | 265 (95.3%) | 13 (4.7%) |
| 3-Person Household | 150 (91.5%) | 14 (8.5%) |
| 4+ Person Household | 110 (100.0%) | 0 (0.0%) |
| Total Housing Units | 675 (94.4%) | 40 (5.6%) |
Occupancy by Educational Attainment in Nisswa
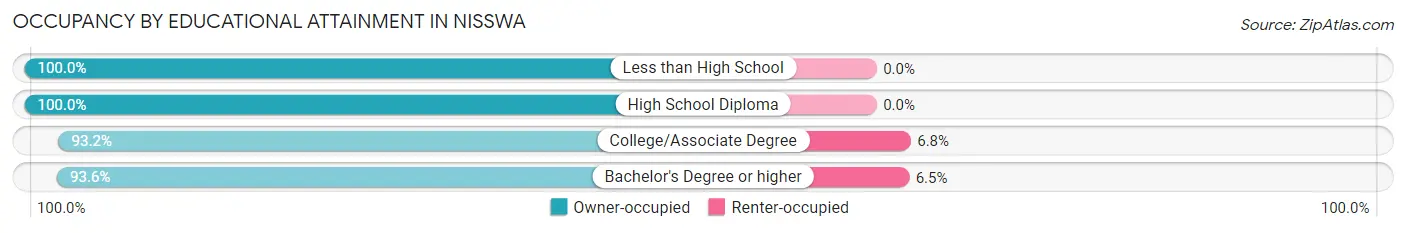
| Household Size | Owner-occupied | Renter-occupied |
| Less than High School | 13 (100.0%) | 0 (0.0%) |
| High School Diploma | 92 (100.0%) | 0 (0.0%) |
| College/Associate Degree | 193 (93.2%) | 14 (6.8%) |
| Bachelor's Degree or higher | 377 (93.5%) | 26 (6.5%) |
Occupancy by Age of Householder in Nisswa
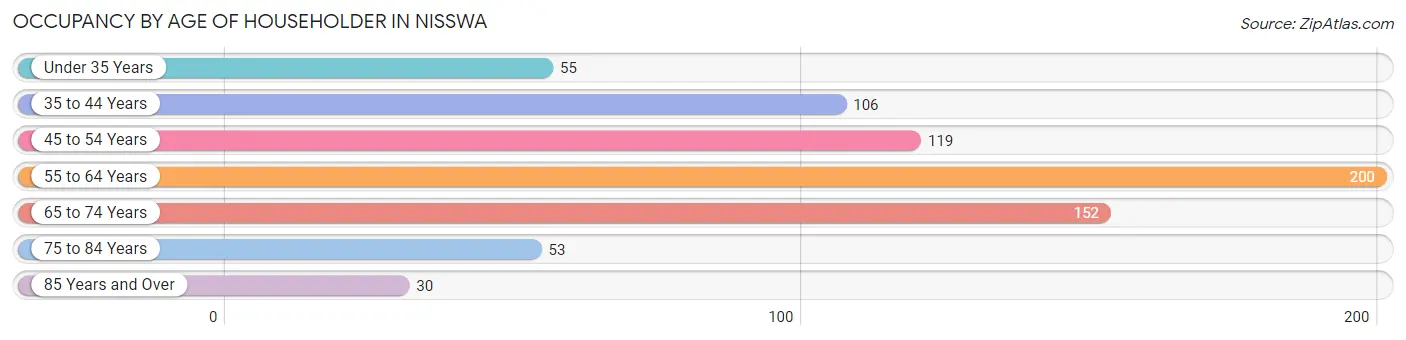
| Age Bracket | # Households | % Households |
| Under 35 Years | 55 | 7.7% |
| 35 to 44 Years | 106 | 14.8% |
| 45 to 54 Years | 119 | 16.6% |
| 55 to 64 Years | 200 | 28.0% |
| 65 to 74 Years | 152 | 21.3% |
| 75 to 84 Years | 53 | 7.4% |
| 85 Years and Over | 30 | 4.2% |
| Total | 715 | 100.0% |
Housing Finances in Nisswa
Median Income by Occupancy in Nisswa
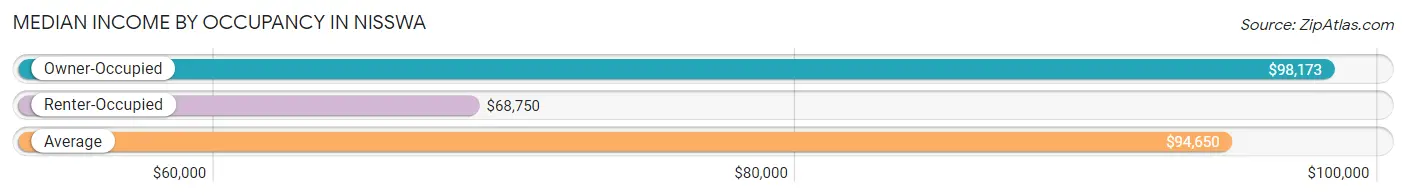
| Occupancy Type | # Households | Median Income |
| Owner-Occupied | 675 (94.4%) | $98,173 |
| Renter-Occupied | 40 (5.6%) | $68,750 |
| Average | 715 (100.0%) | $94,650 |
Occupancy by Householder Income Bracket in Nisswa
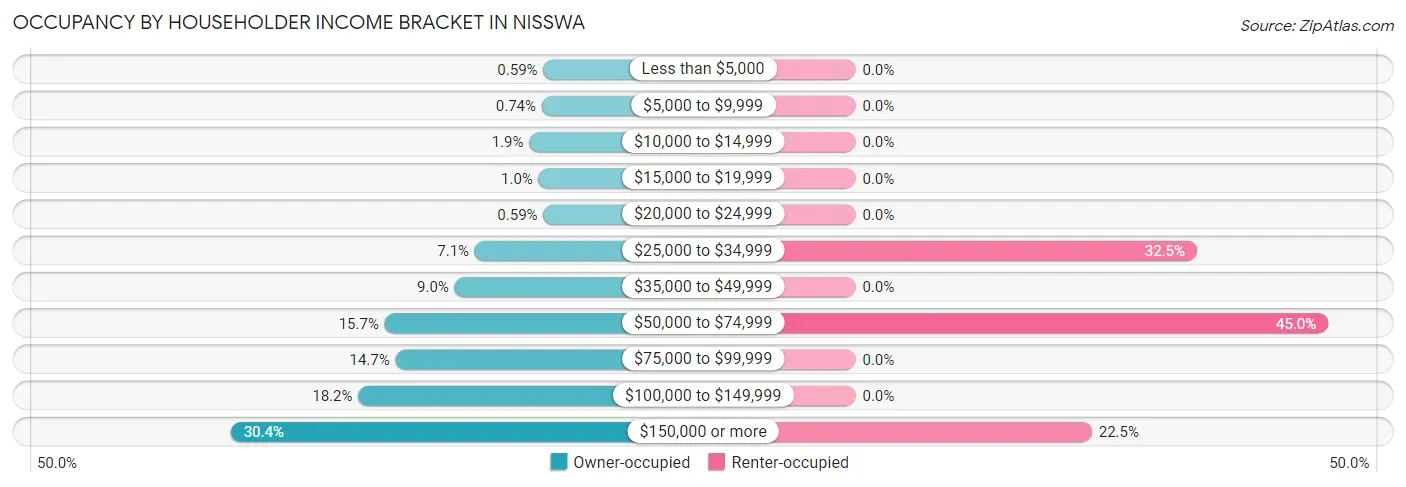
| Income Bracket | Owner-occupied | Renter-occupied |
| Less than $5,000 | 4 (0.6%) | 0 (0.0%) |
| $5,000 to $9,999 | 5 (0.7%) | 0 (0.0%) |
| $10,000 to $14,999 | 13 (1.9%) | 0 (0.0%) |
| $15,000 to $19,999 | 7 (1.0%) | 0 (0.0%) |
| $20,000 to $24,999 | 4 (0.6%) | 0 (0.0%) |
| $25,000 to $34,999 | 48 (7.1%) | 13 (32.5%) |
| $35,000 to $49,999 | 61 (9.0%) | 0 (0.0%) |
| $50,000 to $74,999 | 106 (15.7%) | 18 (45.0%) |
| $75,000 to $99,999 | 99 (14.7%) | 0 (0.0%) |
| $100,000 to $149,999 | 123 (18.2%) | 0 (0.0%) |
| $150,000 or more | 205 (30.4%) | 9 (22.5%) |
| Total | 675 (100.0%) | 40 (100.0%) |
Monthly Housing Cost Tiers in Nisswa
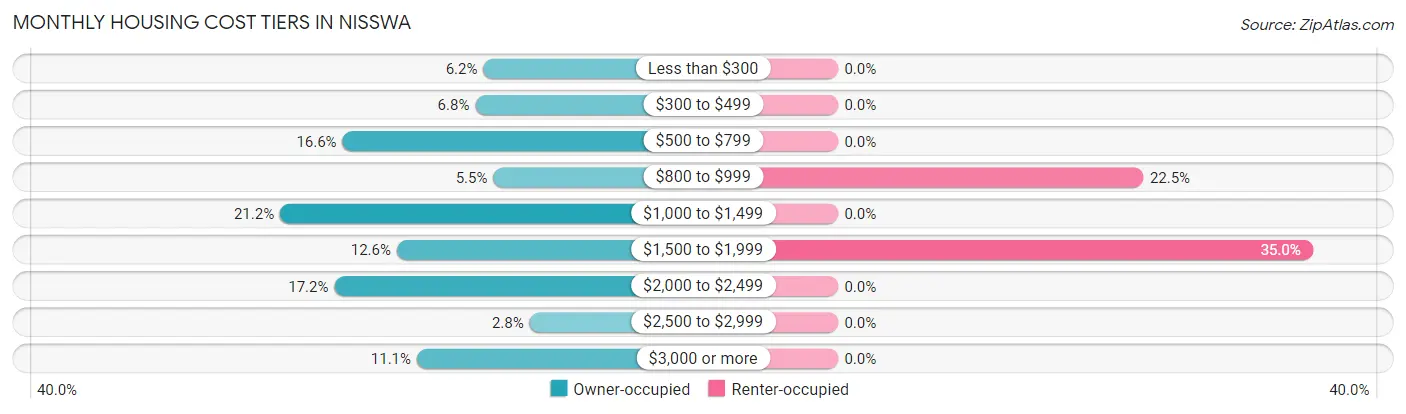
| Monthly Cost | Owner-occupied | Renter-occupied |
| Less than $300 | 42 (6.2%) | 0 (0.0%) |
| $300 to $499 | 46 (6.8%) | 0 (0.0%) |
| $500 to $799 | 112 (16.6%) | 0 (0.0%) |
| $800 to $999 | 37 (5.5%) | 9 (22.5%) |
| $1,000 to $1,499 | 143 (21.2%) | 0 (0.0%) |
| $1,500 to $1,999 | 85 (12.6%) | 14 (35.0%) |
| $2,000 to $2,499 | 116 (17.2%) | 0 (0.0%) |
| $2,500 to $2,999 | 19 (2.8%) | 0 (0.0%) |
| $3,000 or more | 75 (11.1%) | 0 (0.0%) |
| Total | 675 (100.0%) | 40 (100.0%) |
Physical Housing Characteristics in Nisswa
Housing Structures in Nisswa
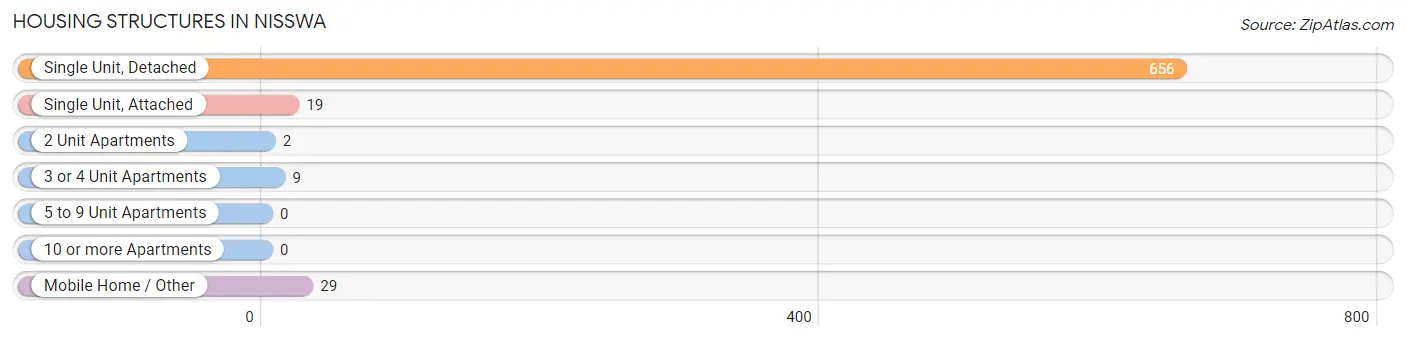
| Structure Type | # Housing Units | % Housing Units |
| Single Unit, Detached | 656 | 91.7% |
| Single Unit, Attached | 19 | 2.7% |
| 2 Unit Apartments | 2 | 0.3% |
| 3 or 4 Unit Apartments | 9 | 1.3% |
| 5 to 9 Unit Apartments | 0 | 0.0% |
| 10 or more Apartments | 0 | 0.0% |
| Mobile Home / Other | 29 | 4.1% |
| Total | 715 | 100.0% |
Housing Structures by Occupancy in Nisswa
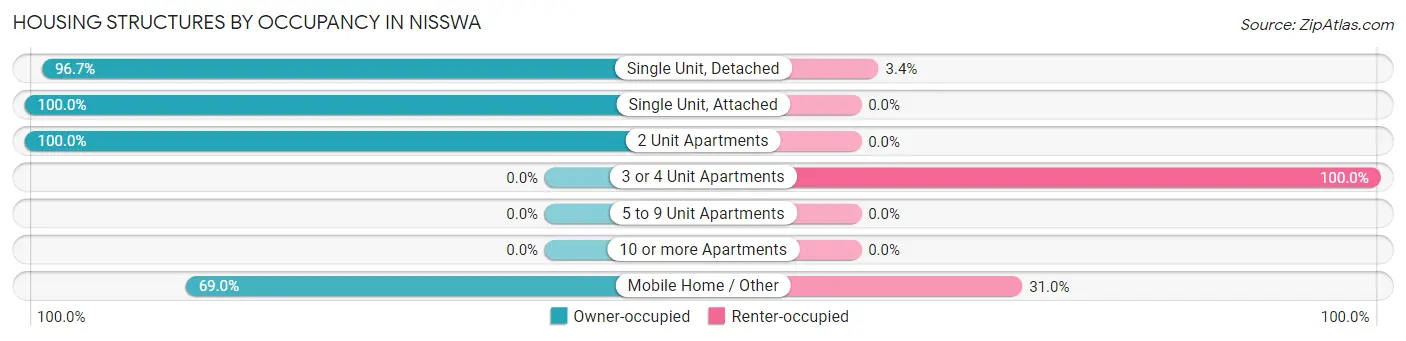
| Structure Type | Owner-occupied | Renter-occupied |
| Single Unit, Detached | 634 (96.7%) | 22 (3.4%) |
| Single Unit, Attached | 19 (100.0%) | 0 (0.0%) |
| 2 Unit Apartments | 2 (100.0%) | 0 (0.0%) |
| 3 or 4 Unit Apartments | 0 (0.0%) | 9 (100.0%) |
| 5 to 9 Unit Apartments | 0 (0.0%) | 0 (0.0%) |
| 10 or more Apartments | 0 (0.0%) | 0 (0.0%) |
| Mobile Home / Other | 20 (69.0%) | 9 (31.0%) |
| Total | 675 (94.4%) | 40 (5.6%) |
Housing Structures by Number of Rooms in Nisswa
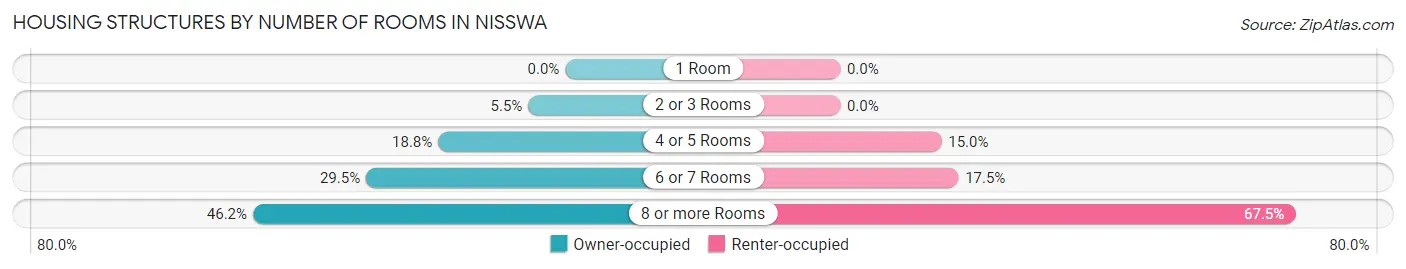
| Number of Rooms | Owner-occupied | Renter-occupied |
| 1 Room | 0 (0.0%) | 0 (0.0%) |
| 2 or 3 Rooms | 37 (5.5%) | 0 (0.0%) |
| 4 or 5 Rooms | 127 (18.8%) | 6 (15.0%) |
| 6 or 7 Rooms | 199 (29.5%) | 7 (17.5%) |
| 8 or more Rooms | 312 (46.2%) | 27 (67.5%) |
| Total | 675 (100.0%) | 40 (100.0%) |
Housing Structure by Heating Type in Nisswa
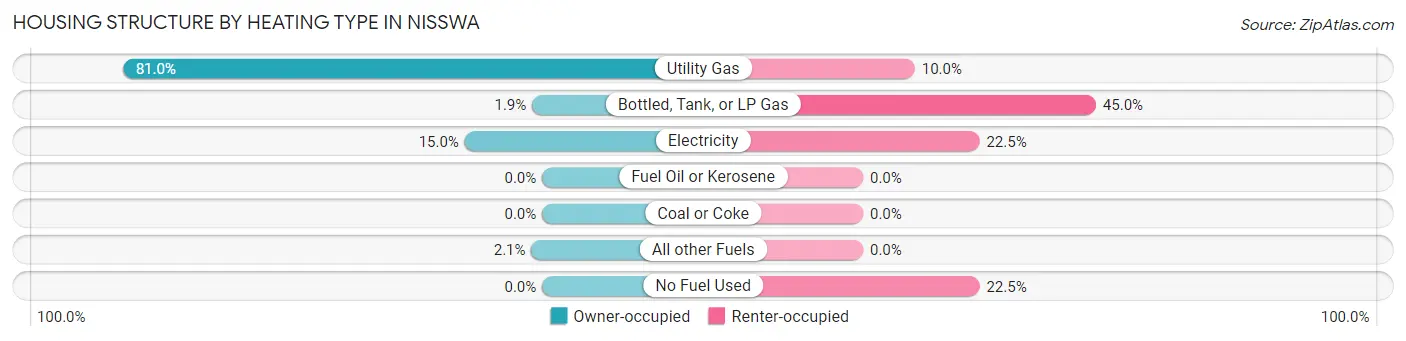
| Heating Type | Owner-occupied | Renter-occupied |
| Utility Gas | 547 (81.0%) | 4 (10.0%) |
| Bottled, Tank, or LP Gas | 13 (1.9%) | 18 (45.0%) |
| Electricity | 101 (15.0%) | 9 (22.5%) |
| Fuel Oil or Kerosene | 0 (0.0%) | 0 (0.0%) |
| Coal or Coke | 0 (0.0%) | 0 (0.0%) |
| All other Fuels | 14 (2.1%) | 0 (0.0%) |
| No Fuel Used | 0 (0.0%) | 9 (22.5%) |
| Total | 675 (100.0%) | 40 (100.0%) |
Household Vehicle Usage in Nisswa
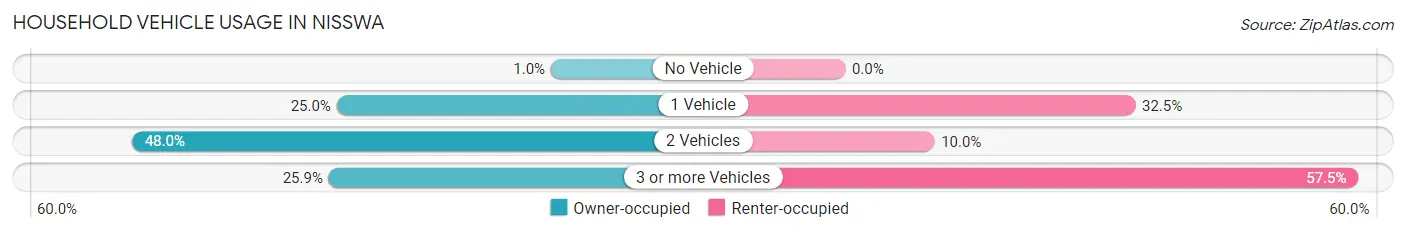
| Vehicles per Household | Owner-occupied | Renter-occupied |
| No Vehicle | 7 (1.0%) | 0 (0.0%) |
| 1 Vehicle | 169 (25.0%) | 13 (32.5%) |
| 2 Vehicles | 324 (48.0%) | 4 (10.0%) |
| 3 or more Vehicles | 175 (25.9%) | 23 (57.5%) |
| Total | 675 (100.0%) | 40 (100.0%) |
Real Estate & Mortgages in Nisswa
Real Estate and Mortgage Overview in Nisswa
| Characteristic | Without Mortgage | With Mortgage |
| Housing Units | 244 | 431 |
| Median Property Value | $392,300 | $429,500 |
| Median Household Income | $63,710 | $170 |
| Monthly Housing Costs | $636 | $75 |
| Real Estate Taxes | $3,127 | $20 |
Property Value by Mortgage Status in Nisswa
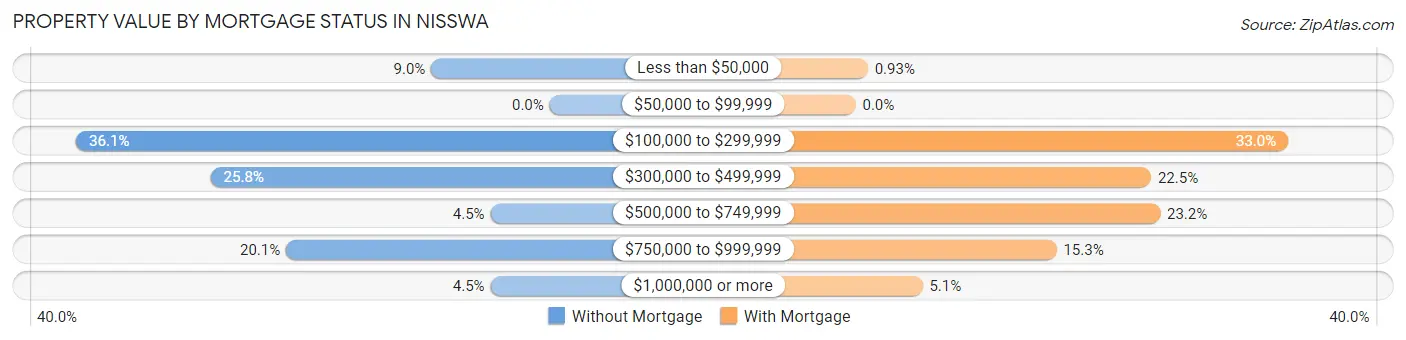
| Property Value | Without Mortgage | With Mortgage |
| Less than $50,000 | 22 (9.0%) | 4 (0.9%) |
| $50,000 to $99,999 | 0 (0.0%) | 0 (0.0%) |
| $100,000 to $299,999 | 88 (36.1%) | 142 (33.0%) |
| $300,000 to $499,999 | 63 (25.8%) | 97 (22.5%) |
| $500,000 to $749,999 | 11 (4.5%) | 100 (23.2%) |
| $750,000 to $999,999 | 49 (20.1%) | 66 (15.3%) |
| $1,000,000 or more | 11 (4.5%) | 22 (5.1%) |
| Total | 244 (100.0%) | 431 (100.0%) |
Household Income by Mortgage Status in Nisswa
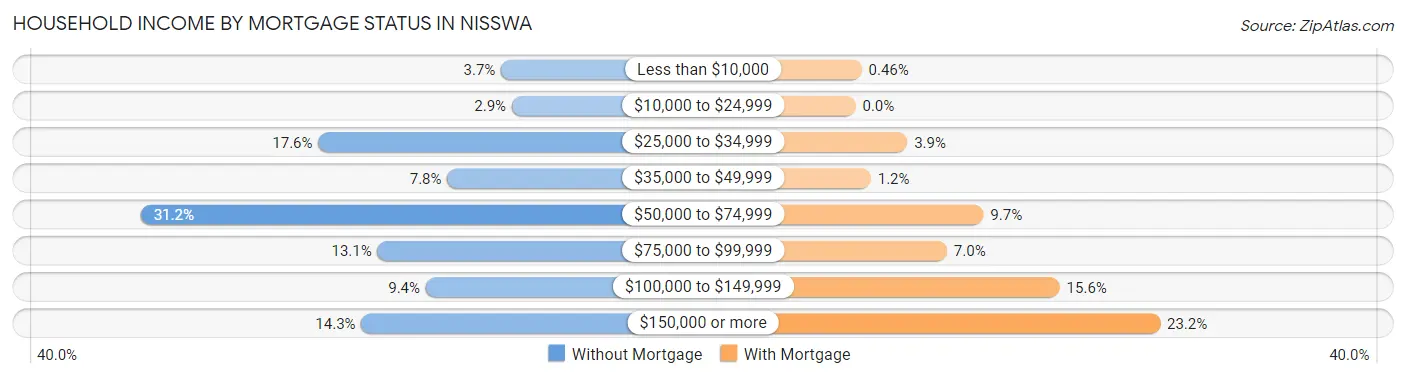
| Household Income | Without Mortgage | With Mortgage |
| Less than $10,000 | 9 (3.7%) | 2 (0.5%) |
| $10,000 to $24,999 | 7 (2.9%) | 0 (0.0%) |
| $25,000 to $34,999 | 43 (17.6%) | 17 (3.9%) |
| $35,000 to $49,999 | 19 (7.8%) | 5 (1.2%) |
| $50,000 to $74,999 | 76 (31.1%) | 42 (9.7%) |
| $75,000 to $99,999 | 32 (13.1%) | 30 (7.0%) |
| $100,000 to $149,999 | 23 (9.4%) | 67 (15.5%) |
| $150,000 or more | 35 (14.3%) | 100 (23.2%) |
| Total | 244 (100.0%) | 431 (100.0%) |
Property Value to Household Income Ratio in Nisswa
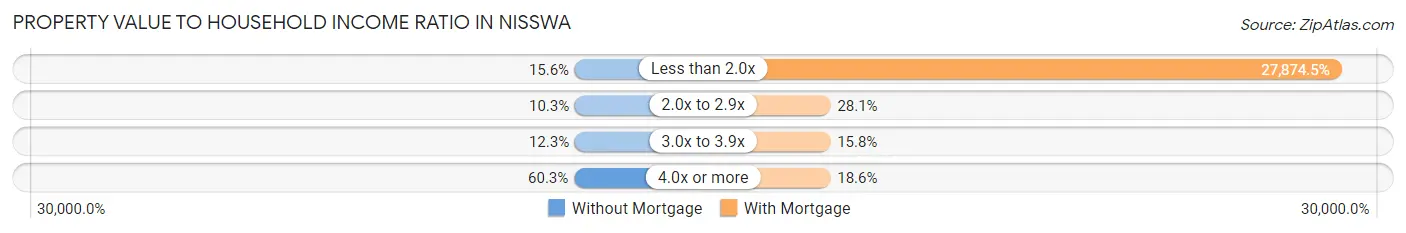
| Value-to-Income Ratio | Without Mortgage | With Mortgage |
| Less than 2.0x | 38 (15.6%) | 120,139 (27,874.5%) |
| 2.0x to 2.9x | 25 (10.2%) | 121 (28.1%) |
| 3.0x to 3.9x | 30 (12.3%) | 68 (15.8%) |
| 4.0x or more | 147 (60.3%) | 80 (18.6%) |
| Total | 244 (100.0%) | 431 (100.0%) |
Real Estate Taxes by Mortgage Status in Nisswa
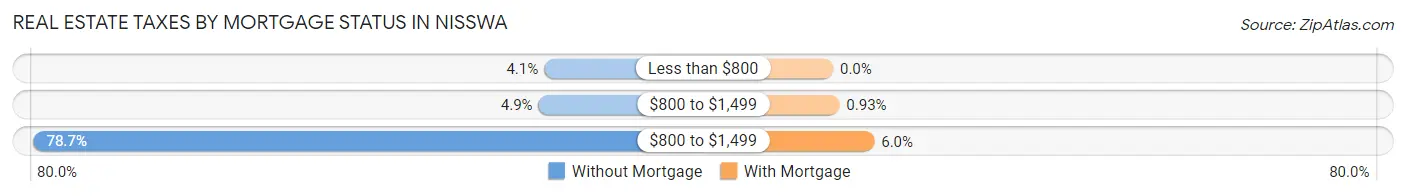
| Property Taxes | Without Mortgage | With Mortgage |
| Less than $800 | 10 (4.1%) | 0 (0.0%) |
| $800 to $1,499 | 12 (4.9%) | 4 (0.9%) |
| $800 to $1,499 | 192 (78.7%) | 26 (6.0%) |
| Total | 244 (100.0%) | 431 (100.0%) |
Health & Disability in Nisswa
Health Insurance Coverage by Age in Nisswa
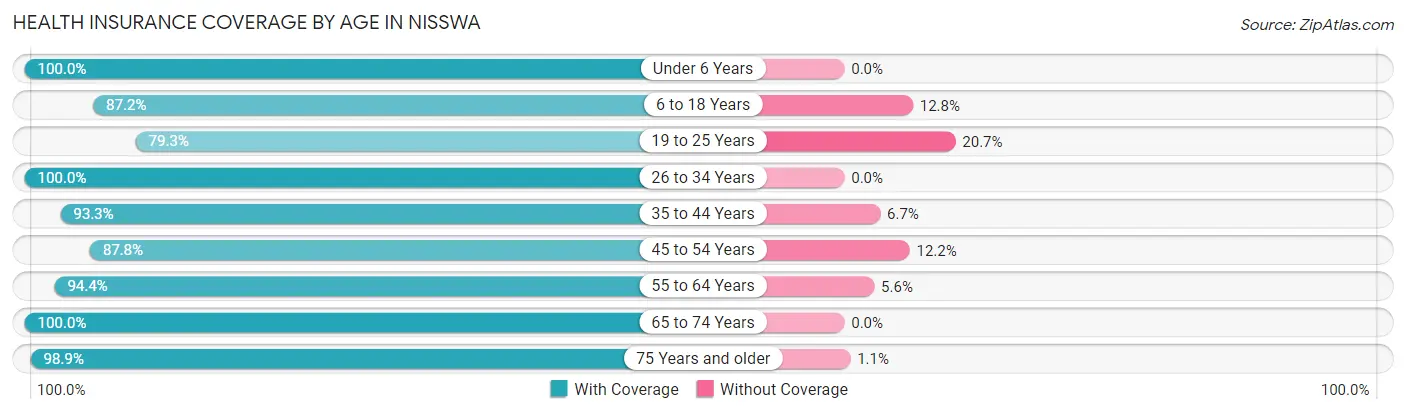
| Age Bracket | With Coverage | Without Coverage |
| Under 6 Years | 109 (100.0%) | 0 (0.0%) |
| 6 to 18 Years | 198 (87.2%) | 29 (12.8%) |
| 19 to 25 Years | 111 (79.3%) | 29 (20.7%) |
| 26 to 34 Years | 68 (100.0%) | 0 (0.0%) |
| 35 to 44 Years | 182 (93.3%) | 13 (6.7%) |
| 45 to 54 Years | 202 (87.8%) | 28 (12.2%) |
| 55 to 64 Years | 322 (94.4%) | 19 (5.6%) |
| 65 to 74 Years | 242 (100.0%) | 0 (0.0%) |
| 75 Years and older | 179 (98.9%) | 2 (1.1%) |
| Total | 1,613 (93.1%) | 120 (6.9%) |
Health Insurance Coverage by Citizenship Status in Nisswa
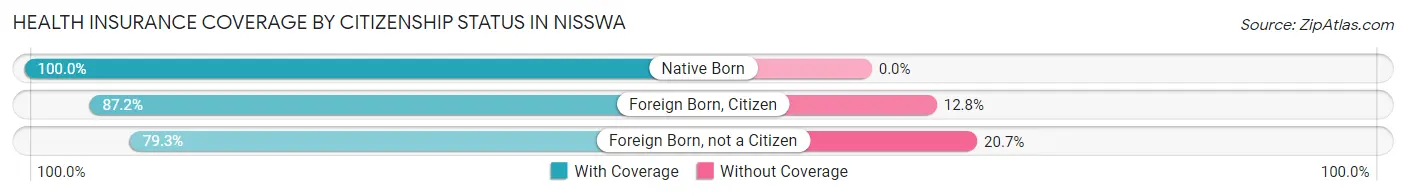
| Citizenship Status | With Coverage | Without Coverage |
| Native Born | 109 (100.0%) | 0 (0.0%) |
| Foreign Born, Citizen | 198 (87.2%) | 29 (12.8%) |
| Foreign Born, not a Citizen | 111 (79.3%) | 29 (20.7%) |
Health Insurance Coverage by Household Income in Nisswa
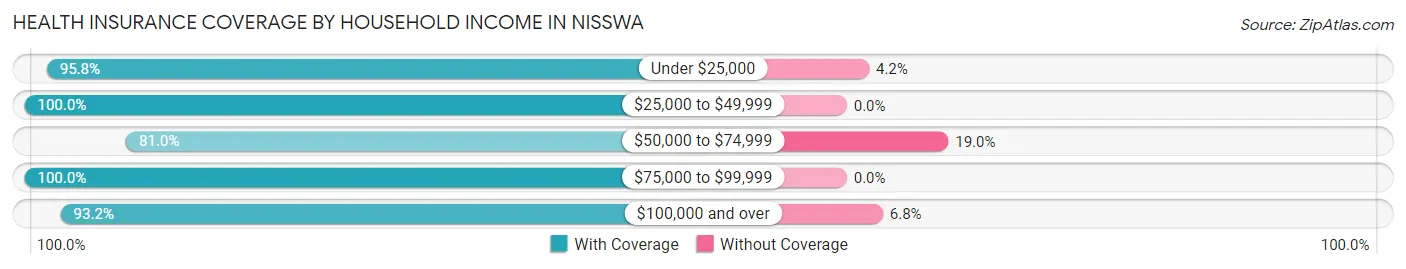
| Household Income | With Coverage | Without Coverage |
| Under $25,000 | 69 (95.8%) | 3 (4.2%) |
| $25,000 to $49,999 | 183 (100.0%) | 0 (0.0%) |
| $50,000 to $74,999 | 213 (81.0%) | 50 (19.0%) |
| $75,000 to $99,999 | 224 (100.0%) | 0 (0.0%) |
| $100,000 and over | 924 (93.2%) | 67 (6.8%) |
Public vs Private Health Insurance Coverage by Age in Nisswa
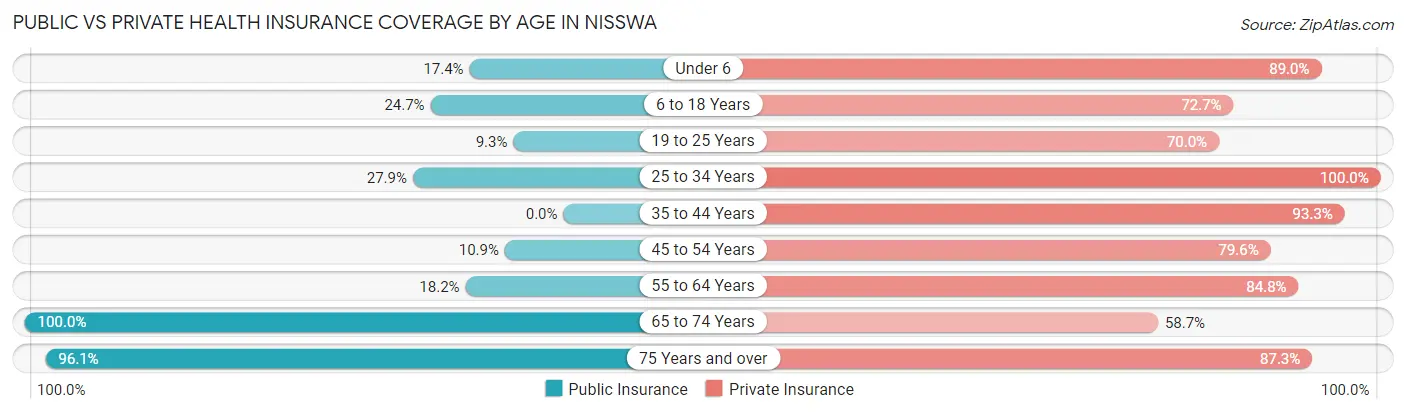
| Age Bracket | Public Insurance | Private Insurance |
| Under 6 | 19 (17.4%) | 97 (89.0%) |
| 6 to 18 Years | 56 (24.7%) | 165 (72.7%) |
| 19 to 25 Years | 13 (9.3%) | 98 (70.0%) |
| 25 to 34 Years | 19 (27.9%) | 68 (100.0%) |
| 35 to 44 Years | 0 (0.0%) | 182 (93.3%) |
| 45 to 54 Years | 25 (10.9%) | 183 (79.6%) |
| 55 to 64 Years | 62 (18.2%) | 289 (84.8%) |
| 65 to 74 Years | 242 (100.0%) | 142 (58.7%) |
| 75 Years and over | 174 (96.1%) | 158 (87.3%) |
| Total | 610 (35.2%) | 1,382 (79.7%) |
Disability Status by Sex by Age in Nisswa
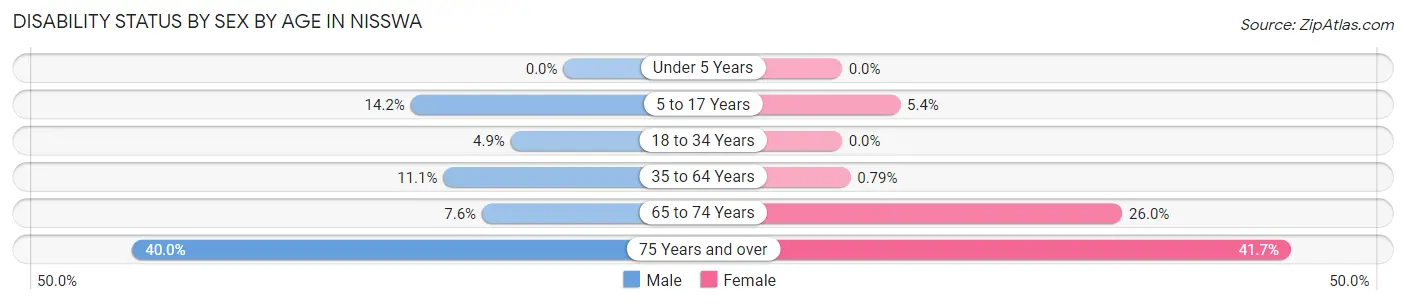
| Age Bracket | Male | Female |
| Under 5 Years | 0 (0.0%) | 0 (0.0%) |
| 5 to 17 Years | 17 (14.2%) | 4 (5.4%) |
| 18 to 34 Years | 9 (4.9%) | 0 (0.0%) |
| 35 to 64 Years | 43 (11.1%) | 3 (0.8%) |
| 65 to 74 Years | 9 (7.6%) | 32 (26.0%) |
| 75 Years and over | 34 (40.0%) | 40 (41.7%) |
Disability Class by Sex by Age in Nisswa
Disability Class: Hearing Difficulty
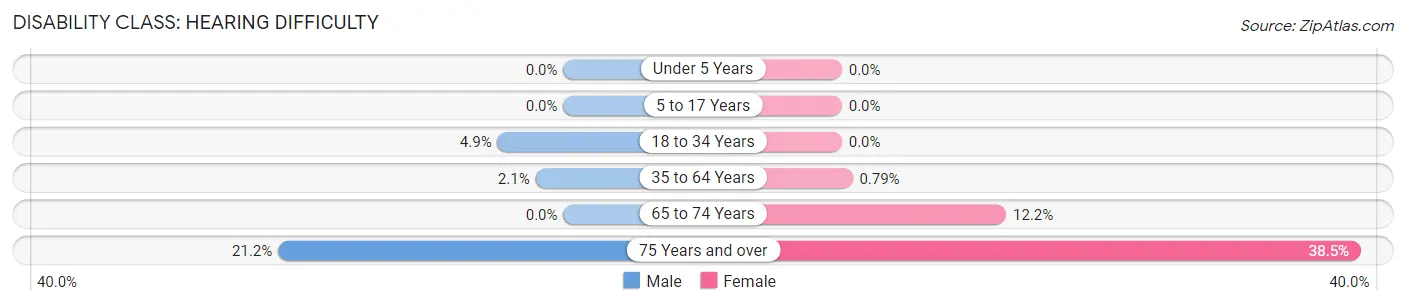
| Age Bracket | Male | Female |
| Under 5 Years | 0 (0.0%) | 0 (0.0%) |
| 5 to 17 Years | 0 (0.0%) | 0 (0.0%) |
| 18 to 34 Years | 9 (4.9%) | 0 (0.0%) |
| 35 to 64 Years | 8 (2.1%) | 3 (0.8%) |
| 65 to 74 Years | 0 (0.0%) | 15 (12.2%) |
| 75 Years and over | 18 (21.2%) | 37 (38.5%) |
Disability Class: Vision Difficulty
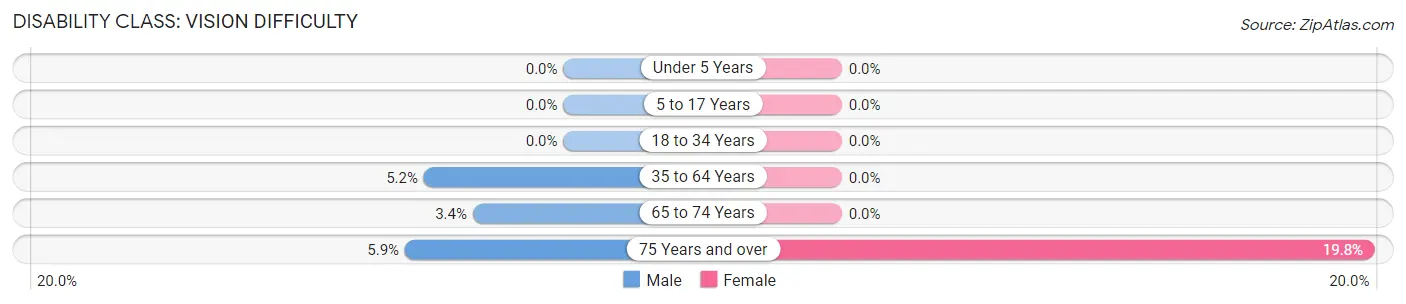
| Age Bracket | Male | Female |
| Under 5 Years | 0 (0.0%) | 0 (0.0%) |
| 5 to 17 Years | 0 (0.0%) | 0 (0.0%) |
| 18 to 34 Years | 0 (0.0%) | 0 (0.0%) |
| 35 to 64 Years | 20 (5.2%) | 0 (0.0%) |
| 65 to 74 Years | 4 (3.4%) | 0 (0.0%) |
| 75 Years and over | 5 (5.9%) | 19 (19.8%) |
Disability Class: Cognitive Difficulty
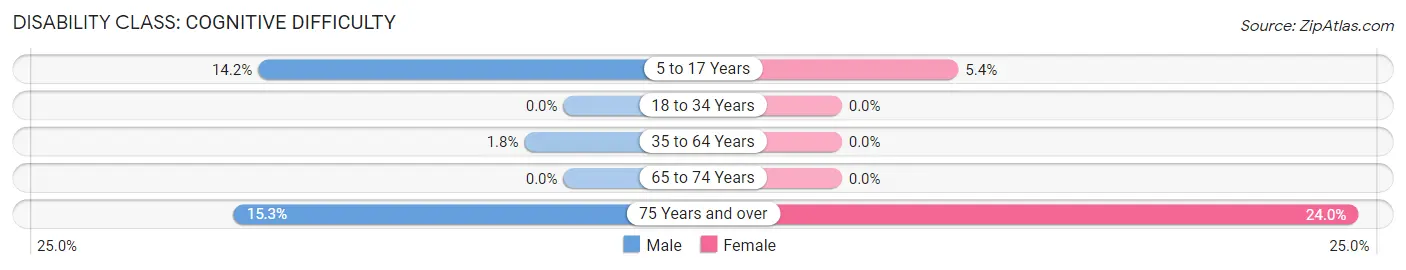
| Age Bracket | Male | Female |
| 5 to 17 Years | 17 (14.2%) | 4 (5.4%) |
| 18 to 34 Years | 0 (0.0%) | 0 (0.0%) |
| 35 to 64 Years | 7 (1.8%) | 0 (0.0%) |
| 65 to 74 Years | 0 (0.0%) | 0 (0.0%) |
| 75 Years and over | 13 (15.3%) | 23 (24.0%) |
Disability Class: Ambulatory Difficulty
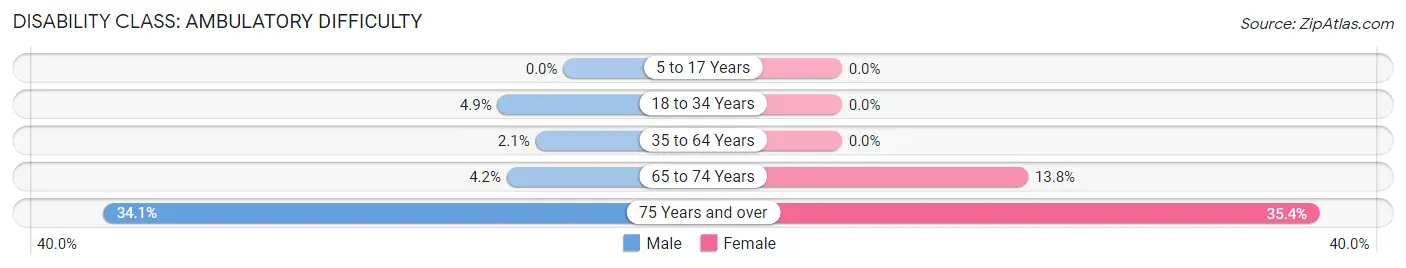
| Age Bracket | Male | Female |
| 5 to 17 Years | 0 (0.0%) | 0 (0.0%) |
| 18 to 34 Years | 9 (4.9%) | 0 (0.0%) |
| 35 to 64 Years | 8 (2.1%) | 0 (0.0%) |
| 65 to 74 Years | 5 (4.2%) | 17 (13.8%) |
| 75 Years and over | 29 (34.1%) | 34 (35.4%) |
Disability Class: Self-Care Difficulty
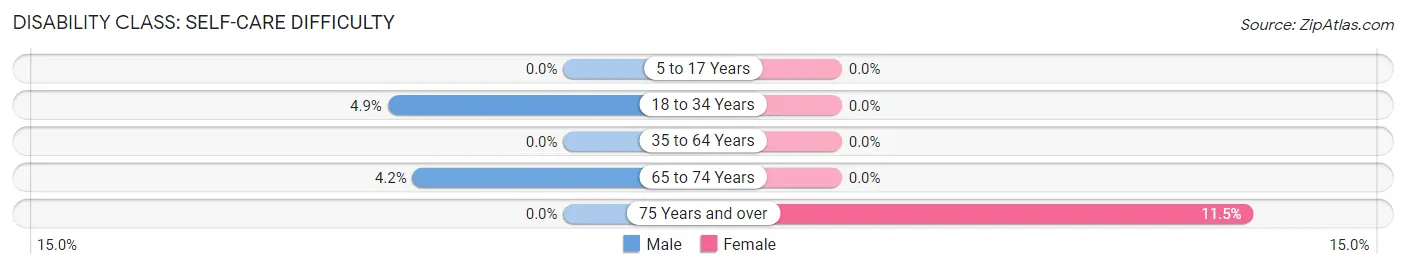
| Age Bracket | Male | Female |
| 5 to 17 Years | 0 (0.0%) | 0 (0.0%) |
| 18 to 34 Years | 9 (4.9%) | 0 (0.0%) |
| 35 to 64 Years | 0 (0.0%) | 0 (0.0%) |
| 65 to 74 Years | 5 (4.2%) | 0 (0.0%) |
| 75 Years and over | 0 (0.0%) | 11 (11.5%) |
Technology Access in Nisswa
Computing Device Access in Nisswa
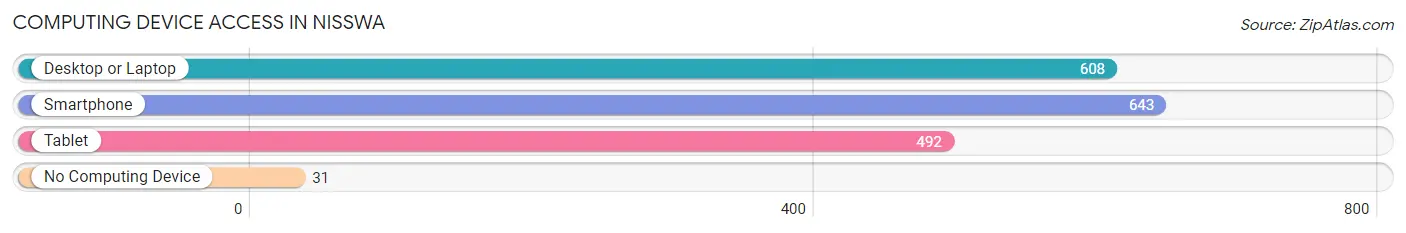
| Device Type | # Households | % Households |
| Desktop or Laptop | 608 | 85.0% |
| Smartphone | 643 | 89.9% |
| Tablet | 492 | 68.8% |
| No Computing Device | 31 | 4.3% |
| Total | 715 | 100.0% |
Internet Access in Nisswa
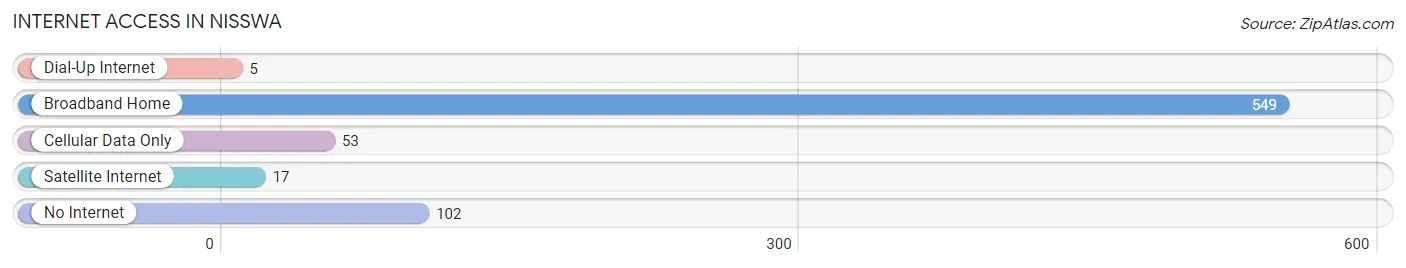
| Internet Type | # Households | % Households |
| Dial-Up Internet | 5 | 0.7% |
| Broadband Home | 549 | 76.8% |
| Cellular Data Only | 53 | 7.4% |
| Satellite Internet | 17 | 2.4% |
| No Internet | 102 | 14.3% |
| Total | 715 | 100.0% |
Nisswa Summary
Nisswa is a city located in Crow Wing County, Minnesota, United States. The population was 2,521 at the 2010 census. It is part of the Brainerd Micropolitan Statistical Area.
History
The area that is now Nisswa was first settled in the late 1800s by Scandinavian immigrants. The city was named after the Nisswa River, which was named after the Ojibwe word for “little lake”. The city was incorporated in 1906.
In the early 1900s, Nisswa was a logging and farming community. The city was also known for its resorts, which attracted tourists from all over the Midwest. The resorts were popular for fishing, boating, and swimming.
In the 1950s, Nisswa began to develop into a tourist destination. The city was home to several resorts, including the Nisswa Inn, which was built in 1952. The city also had a number of restaurants, shops, and other businesses.
In the 1970s, Nisswa began to experience a decline in tourism. The city was hit hard by the recession of the 1980s and many of the resorts and businesses closed.
In the 1990s, Nisswa began to experience a resurgence in tourism. The city was home to several new resorts, restaurants, and shops. The city also began to attract more visitors from the Twin Cities area.
Geography
Nisswa is located in central Minnesota, about 30 miles north of Brainerd. The city is situated on the Nisswa River, which flows into Gull Lake. The city is surrounded by several lakes, including Gull Lake, Round Lake, and Lake Hubert.
The city has a total area of 2.2 square miles, all of which is land. The city is located in a hilly area, with elevations ranging from 1,100 to 1,400 feet above sea level.
Economy
The economy of Nisswa is largely based on tourism. The city is home to several resorts, restaurants, and shops. The city also has a number of outdoor recreation opportunities, including fishing, boating, and swimming.
The city is also home to several manufacturing companies, including Nisswa Industries, which produces plastic products.
Demographics
As of the 2010 census, there were 2,521 people, 1,072 households, and 690 families living in the city. The population density was 1,133.3 people per square mile. The racial makeup of the city was 97.2% White, 0.4% African American, 0.4% Native American, 0.4% Asian, 0.2% from other races, and 1.4% from two or more races. Hispanic or Latino of any race were 1.2% of the population.
The median age in the city was 48.2 years. 22.2% of residents were under the age of 18; 5.7% were between the ages of 18 and 24; 19.2% were from 25 to 44; 33.2% were from 45 to 64; and 19.7% were 65 years of age or older. The gender makeup of the city was 48.7% male and 51.3% female.
The median income for a household in the city was $45,938, and the median income for a family was $54,375. Males had a median income of $41,250 versus $27,500 for females. The per capita income for the city was $25,945. About 4.2% of families and 6.2% of the population were below the poverty line, including 8.2% of those under age 18 and 4.2% of those age 65 or over.
Common Questions
What is Per Capita Income in Nisswa?
Per Capita income in Nisswa is $58,024.
What is the Median Family Income in Nisswa?
Median Family Income in Nisswa is $110,313.
What is the Median Household income in Nisswa?
Median Household Income in Nisswa is $94,650.
What is Income or Wage Gap in Nisswa?
Income or Wage Gap in Nisswa is 11.5%.
Women in Nisswa earn 88.5 cents for every dollar earned by a man.
What is Inequality or Gini Index in Nisswa?
Inequality or Gini Index in Nisswa is 0.45.
What is the Total Population of Nisswa?
Total Population of Nisswa is 1,733.
What is the Total Male Population of Nisswa?
Total Male Population of Nisswa is 954.
What is the Total Female Population of Nisswa?
Total Female Population of Nisswa is 779.
What is the Ratio of Males per 100 Females in Nisswa?
There are 122.46 Males per 100 Females in Nisswa.
What is the Ratio of Females per 100 Males in Nisswa?
There are 81.66 Females per 100 Males in Nisswa.
What is the Median Population Age in Nisswa?
Median Population Age in Nisswa is 52.3 Years.
What is the Average Family Size in Nisswa
Average Family Size in Nisswa is 2.8 People.
What is the Average Household Size in Nisswa
Average Household Size in Nisswa is 2.4 People.
How Large is the Labor Force in Nisswa?
There are 972 People in the Labor Forcein in Nisswa.
What is the Percentage of People in the Labor Force in Nisswa?
64.5% of People are in the Labor Force in Nisswa.
What is the Unemployment Rate in Nisswa?
Unemployment Rate in Nisswa is 1.0%.