Madison, MN Map & Demographics
Madison Map
Madison Overview
$30,755
PER CAPITA INCOME
$65,000
AVG FAMILY INCOME
$49,063
AVG HOUSEHOLD INCOME
62.3%
WAGE / INCOME GAP [ % ]
37.7¢/ $1
WAGE / INCOME GAP [ $ ]
0.42
INEQUALITY / GINI INDEX
1,566
TOTAL POPULATION
730
MALE POPULATION
836
FEMALE POPULATION
87.32
MALES / 100 FEMALES
114.52
FEMALES / 100 MALES
56.5
MEDIAN AGE
2.6
AVG FAMILY SIZE
2.0
AVG HOUSEHOLD SIZE
662
LABOR FORCE [ PEOPLE ]
50.0%
PERCENT IN LABOR FORCE
0.6%
UNEMPLOYMENT RATE
Madison Zip Codes
Madison Area Codes
Income in Madison
Income Overview in Madison
Per Capita Income in Madison is $30,755, while median incomes of families and households are $65,000 and $49,063 respectively.
| Characteristic | Number | Measure |
| Per Capita Income | 1,566 | $30,755 |
| Median Family Income | 396 | $65,000 |
| Mean Family Income | 396 | $74,813 |
| Median Household Income | 750 | $49,063 |
| Mean Household Income | 750 | $61,244 |
| Income Deficit | 396 | $0 |
| Wage / Income Gap (%) | 1,566 | 62.30% |
| Wage / Income Gap ($) | 1,566 | 37.70¢ per $1 |
| Gini / Inequality Index | 1,566 | 0.42 |
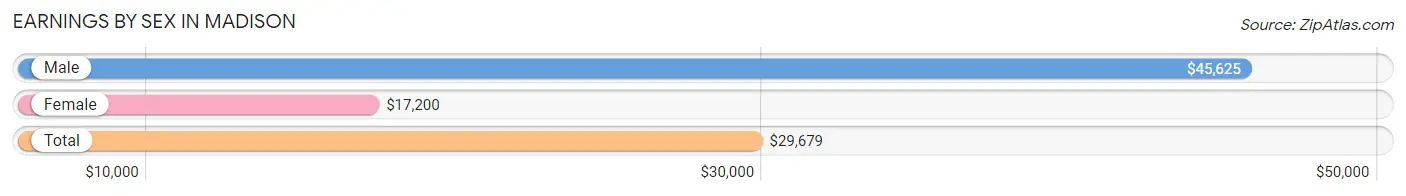
Earnings by Sex in Madison
Average Earnings in Madison are $29,679, $45,625 for men and $17,200 for women, a difference of 62.3%.
| Sex | Number | Average Earnings |
| Male | 368 (52.7%) | $45,625 |
| Female | 330 (47.3%) | $17,200 |
| Total | 698 (100.0%) | $29,679 |
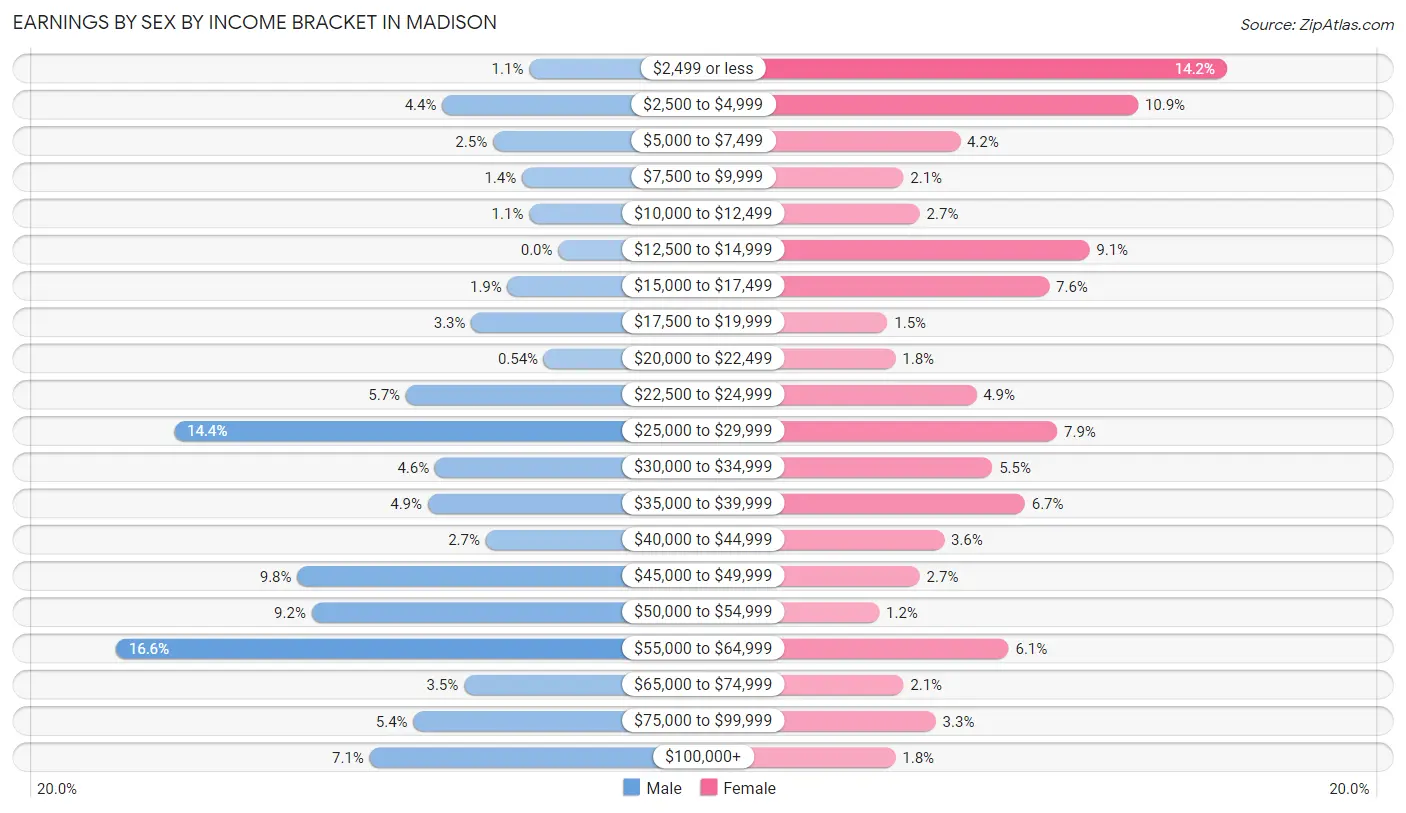
Earnings by Sex by Income Bracket in Madison
The most common earnings brackets in Madison are $55,000 to $64,999 for men (61 | 16.6%) and $2,499 or less for women (47 | 14.2%).
| Income | Male | Female |
| $2,499 or less | 4 (1.1%) | 47 (14.2%) |
| $2,500 to $4,999 | 16 (4.3%) | 36 (10.9%) |
| $5,000 to $7,499 | 9 (2.5%) | 14 (4.2%) |
| $7,500 to $9,999 | 5 (1.4%) | 7 (2.1%) |
| $10,000 to $12,499 | 4 (1.1%) | 9 (2.7%) |
| $12,500 to $14,999 | 0 (0.0%) | 30 (9.1%) |
| $15,000 to $17,499 | 7 (1.9%) | 25 (7.6%) |
| $17,500 to $19,999 | 12 (3.3%) | 5 (1.5%) |
| $20,000 to $22,499 | 2 (0.5%) | 6 (1.8%) |
| $22,500 to $24,999 | 21 (5.7%) | 16 (4.9%) |
| $25,000 to $29,999 | 53 (14.4%) | 26 (7.9%) |
| $30,000 to $34,999 | 17 (4.6%) | 18 (5.4%) |
| $35,000 to $39,999 | 18 (4.9%) | 22 (6.7%) |
| $40,000 to $44,999 | 10 (2.7%) | 12 (3.6%) |
| $45,000 to $49,999 | 36 (9.8%) | 9 (2.7%) |
| $50,000 to $54,999 | 34 (9.2%) | 4 (1.2%) |
| $55,000 to $64,999 | 61 (16.6%) | 20 (6.1%) |
| $65,000 to $74,999 | 13 (3.5%) | 7 (2.1%) |
| $75,000 to $99,999 | 20 (5.4%) | 11 (3.3%) |
| $100,000+ | 26 (7.1%) | 6 (1.8%) |
| Total | 368 (100.0%) | 330 (100.0%) |
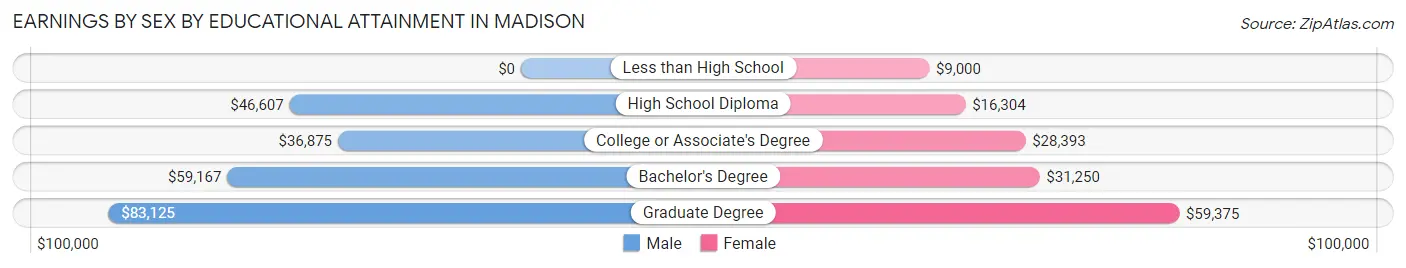
Earnings by Sex by Educational Attainment in Madison
Average earnings in Madison are $46,302 for men and $25,521 for women, a difference of 44.9%. Men with an educational attainment of graduate degree enjoy the highest average annual earnings of $83,125, while those with college or associate's degree education earn the least with $36,875. Women with an educational attainment of graduate degree earn the most with the average annual earnings of $59,375, while those with less than high school education have the smallest earnings of $9,000.
| Educational Attainment | Male Income | Female Income |
| Less than High School | - | - |
| High School Diploma | $46,607 | $16,304 |
| College or Associate's Degree | $36,875 | $28,393 |
| Bachelor's Degree | $59,167 | $31,250 |
| Graduate Degree | $83,125 | $59,375 |
| Total | $46,302 | $25,521 |
Family Income in Madison
Family Income Brackets in Madison
According to the Madison family income data, there are 108 families falling into the $50,000 to $74,999 income range, which is the most common income bracket and makes up 27.3% of all families. Conversely, the $10,000 to $14,999 income bracket is the least frequent group with only 4 families (1.0%) belonging to this category.
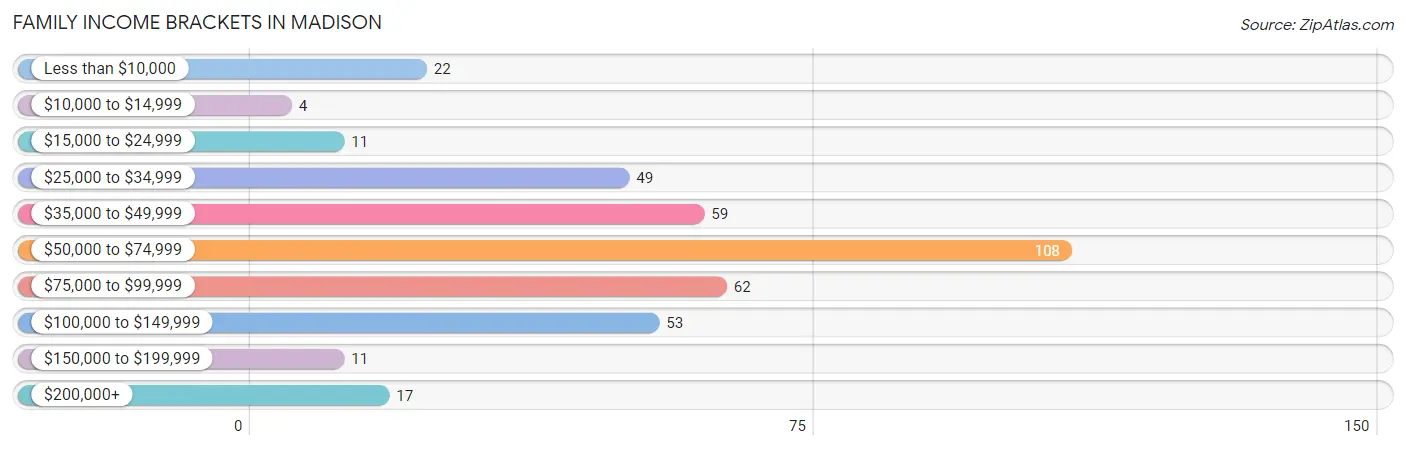
| Income Bracket | # Families | % Families |
| Less than $10,000 | 22 | 5.6% |
| $10,000 to $14,999 | 4 | 1.0% |
| $15,000 to $24,999 | 11 | 2.8% |
| $25,000 to $34,999 | 49 | 12.4% |
| $35,000 to $49,999 | 59 | 14.9% |
| $50,000 to $74,999 | 108 | 27.3% |
| $75,000 to $99,999 | 62 | 15.7% |
| $100,000 to $149,999 | 53 | 13.4% |
| $150,000 to $199,999 | 11 | 2.8% |
| $200,000+ | 17 | 4.3% |
Family Income by Famaliy Size in Madison
5-person families (18 | 4.5%) account for the highest median family income in Madison with $118,750 per family, while 2-person families (263 | 66.4%) have the highest median income of $33,125 per family member.
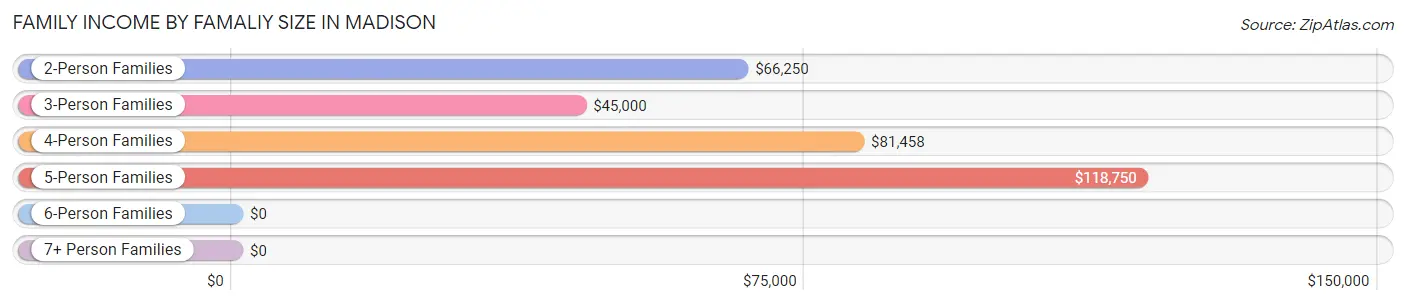
| Income Bracket | # Families | Median Income |
| 2-Person Families | 263 (66.4%) | $66,250 |
| 3-Person Families | 80 (20.2%) | $45,000 |
| 4-Person Families | 35 (8.8%) | $81,458 |
| 5-Person Families | 18 (4.5%) | $118,750 |
| 6-Person Families | 0 (0.0%) | $0 |
| 7+ Person Families | 0 (0.0%) | $0 |
| Total | 396 (100.0%) | $65,000 |
Family Income by Number of Earners in Madison
The median family income in Madison is $65,000, with families comprising 3+ earners (10) having the highest median family income of $145,000, while families with 1 earner (136) have the lowest median family income of $46,167, accounting for 2.5% and 34.3% of families, respectively.
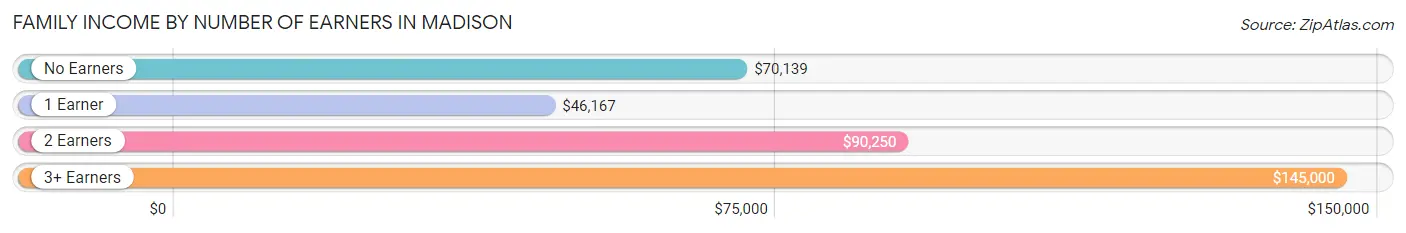
| Number of Earners | # Families | Median Income |
| No Earners | 117 (29.5%) | $70,139 |
| 1 Earner | 136 (34.3%) | $46,167 |
| 2 Earners | 133 (33.6%) | $90,250 |
| 3+ Earners | 10 (2.5%) | $145,000 |
| Total | 396 (100.0%) | $65,000 |
Household Income in Madison
Household Income Brackets in Madison
With 161 households falling in the category, the $50,000 to $74,999 income range is the most frequent in Madison, accounting for 21.5% of all households. In contrast, only 18 households (2.4%) fall into the $150,000 to $199,999 income bracket, making it the least populous group.
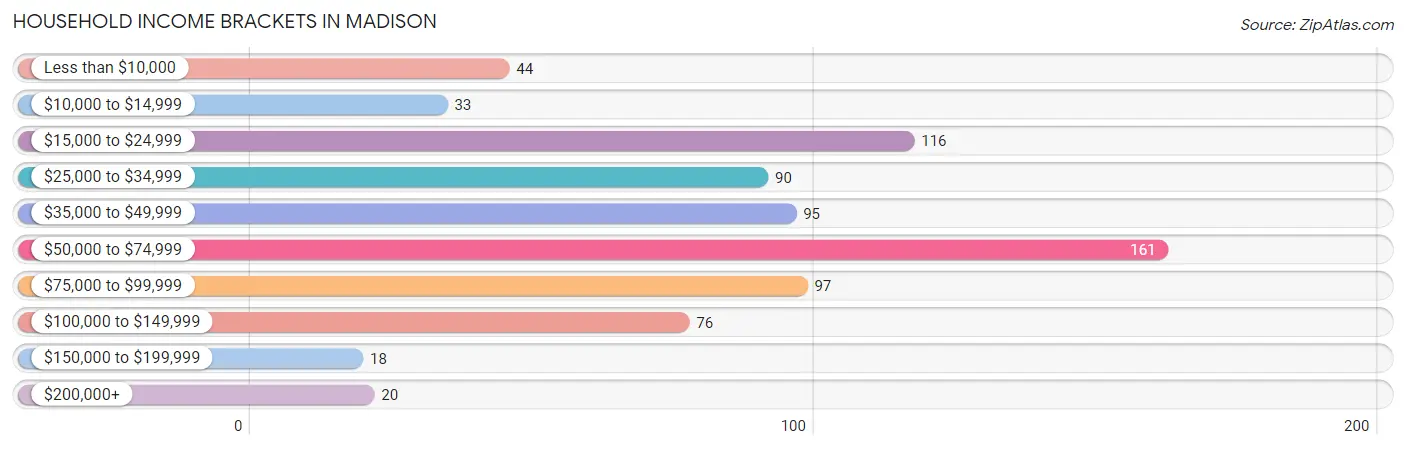
| Income Bracket | # Households | % Households |
| Less than $10,000 | 44 | 5.9% |
| $10,000 to $14,999 | 33 | 4.4% |
| $15,000 to $24,999 | 116 | 15.5% |
| $25,000 to $34,999 | 90 | 12.0% |
| $35,000 to $49,999 | 95 | 12.7% |
| $50,000 to $74,999 | 161 | 21.5% |
| $75,000 to $99,999 | 97 | 12.9% |
| $100,000 to $149,999 | 76 | 10.1% |
| $150,000 to $199,999 | 18 | 2.4% |
| $200,000+ | 20 | 2.7% |
Household Income by Householder Age in Madison
The median household income in Madison is $49,063, with the highest median household income of $57,212 found in the 45 to 64 years age bracket for the primary householder. A total of 213 households (28.4%) fall into this category. Meanwhile, the 65+ years age bracket for the primary householder has the lowest median household income of $37,396, with 355 households (47.3%) in this group.
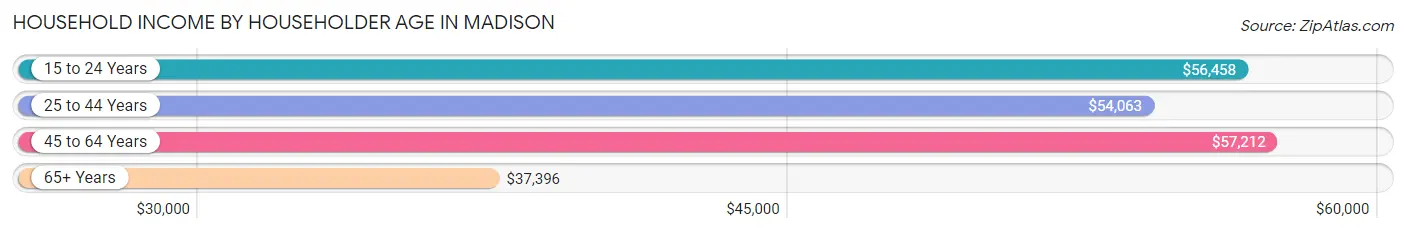
| Income Bracket | # Households | Median Income |
| 15 to 24 Years | 13 (1.7%) | $56,458 |
| 25 to 44 Years | 169 (22.5%) | $54,063 |
| 45 to 64 Years | 213 (28.4%) | $57,212 |
| 65+ Years | 355 (47.3%) | $37,396 |
| Total | 750 (100.0%) | $49,063 |
Poverty in Madison
Income Below Poverty by Sex and Age in Madison
With 9.0% poverty level for males and 18.3% for females among the residents of Madison, 6 to 11 year old males and 15 year old females are the most vulnerable to poverty, with 11 males (39.3%) and 3 females (100.0%) in their respective age groups living below the poverty level.
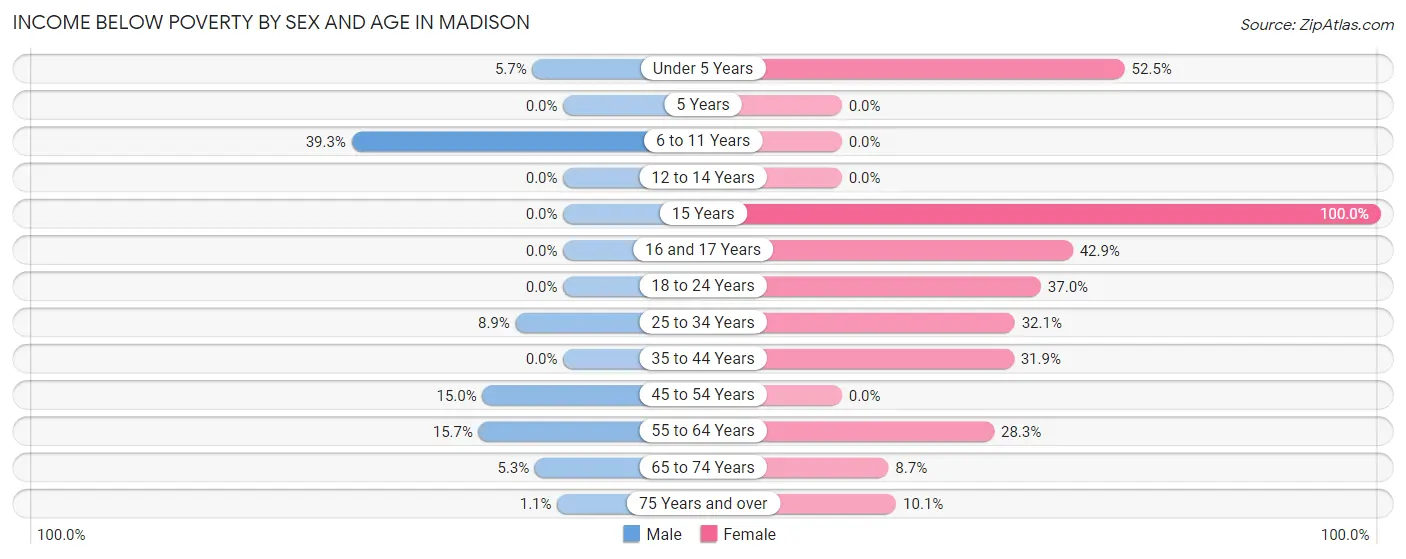
| Age Bracket | Male | Female |
| Under 5 Years | 2 (5.7%) | 21 (52.5%) |
| 5 Years | 0 (0.0%) | 0 (0.0%) |
| 6 to 11 Years | 11 (39.3%) | 0 (0.0%) |
| 12 to 14 Years | 0 (0.0%) | 0 (0.0%) |
| 15 Years | 0 (0.0%) | 3 (100.0%) |
| 16 and 17 Years | 0 (0.0%) | 9 (42.9%) |
| 18 to 24 Years | 0 (0.0%) | 17 (37.0%) |
| 25 to 34 Years | 7 (8.9%) | 26 (32.1%) |
| 35 to 44 Years | 0 (0.0%) | 15 (31.9%) |
| 45 to 54 Years | 12 (15.0%) | 0 (0.0%) |
| 55 to 64 Years | 24 (15.7%) | 26 (28.3%) |
| 65 to 74 Years | 5 (5.3%) | 9 (8.6%) |
| 75 Years and over | 1 (1.1%) | 22 (10.1%) |
| Total | 62 (9.0%) | 148 (18.3%) |
Income Above Poverty by Sex and Age in Madison
According to the poverty statistics in Madison, males aged 5 years and females aged 5 years are the age groups that are most secure financially, with 100.0% of males and 100.0% of females in these age groups living above the poverty line.
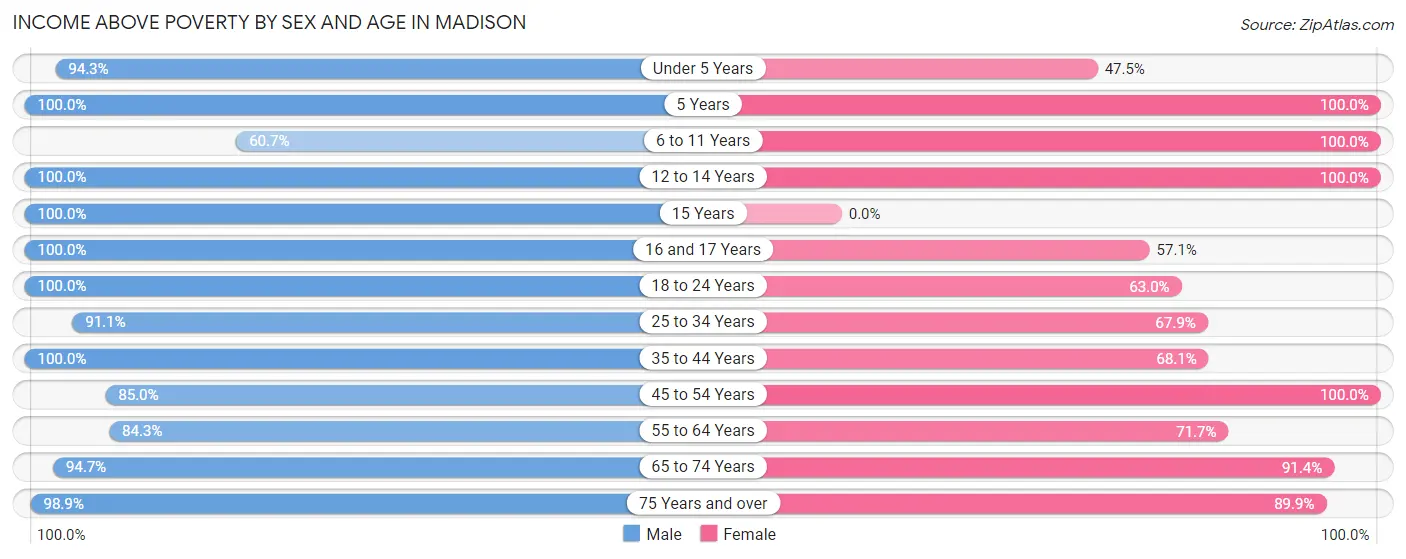
| Age Bracket | Male | Female |
| Under 5 Years | 33 (94.3%) | 19 (47.5%) |
| 5 Years | 11 (100.0%) | 5 (100.0%) |
| 6 to 11 Years | 17 (60.7%) | 53 (100.0%) |
| 12 to 14 Years | 27 (100.0%) | 30 (100.0%) |
| 15 Years | 9 (100.0%) | 0 (0.0%) |
| 16 and 17 Years | 7 (100.0%) | 12 (57.1%) |
| 18 to 24 Years | 24 (100.0%) | 29 (63.0%) |
| 25 to 34 Years | 72 (91.1%) | 55 (67.9%) |
| 35 to 44 Years | 49 (100.0%) | 32 (68.1%) |
| 45 to 54 Years | 68 (85.0%) | 70 (100.0%) |
| 55 to 64 Years | 129 (84.3%) | 66 (71.7%) |
| 65 to 74 Years | 90 (94.7%) | 95 (91.3%) |
| 75 Years and over | 89 (98.9%) | 196 (89.9%) |
| Total | 625 (91.0%) | 662 (81.7%) |
Income Below Poverty Among Married-Couple Families in Madison
The poverty statistics for married-couple families in Madison show that 1.7% or 5 of the total 296 families live below the poverty line. Families with 1 or 2 children have the highest poverty rate of 3.9%, comprising of 2 families. On the other hand, families with 3 or 4 children have the lowest poverty rate of 0.0%, which includes 0 families.
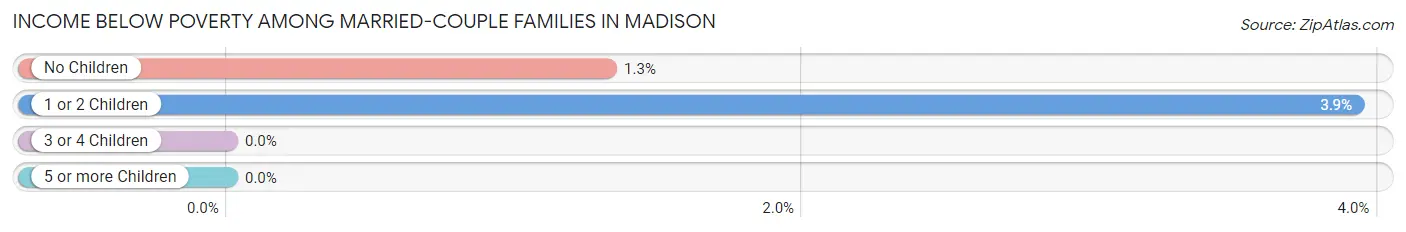
| Children | Above Poverty | Below Poverty |
| No Children | 224 (98.7%) | 3 (1.3%) |
| 1 or 2 Children | 49 (96.1%) | 2 (3.9%) |
| 3 or 4 Children | 18 (100.0%) | 0 (0.0%) |
| 5 or more Children | 0 (0.0%) | 0 (0.0%) |
| Total | 291 (98.3%) | 5 (1.7%) |
Income Below Poverty Among Single-Parent Households in Madison
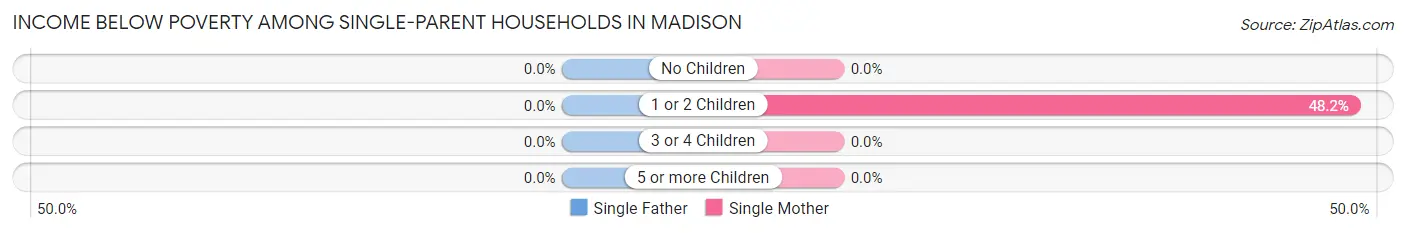
| Children | Single Father | Single Mother |
| No Children | 0 (0.0%) | 0 (0.0%) |
| 1 or 2 Children | 0 (0.0%) | 26 (48.1%) |
| 3 or 4 Children | 0 (0.0%) | 0 (0.0%) |
| 5 or more Children | 0 (0.0%) | 0 (0.0%) |
| Total | 0 (0.0%) | 26 (44.1%) |
Income Below Poverty Among Married-Couple vs Single-Parent Households in Madison
The poverty data for Madison shows that 5 of the married-couple family households (1.7%) and 26 of the single-parent households (26.0%) are living below the poverty level. Within the married-couple family households, those with 1 or 2 children have the highest poverty rate, with 2 households (3.9%) falling below the poverty line. Among the single-parent households, those with 1 or 2 children have the highest poverty rate, with 26 household (33.3%) living below poverty.
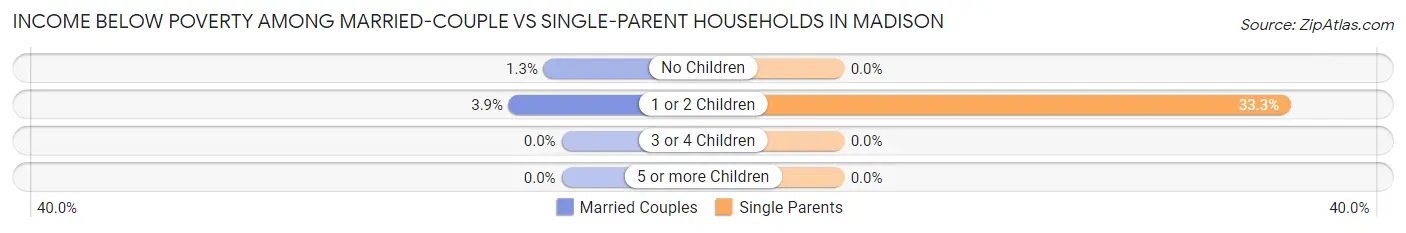
| Children | Married-Couple Families | Single-Parent Households |
| No Children | 3 (1.3%) | 0 (0.0%) |
| 1 or 2 Children | 2 (3.9%) | 26 (33.3%) |
| 3 or 4 Children | 0 (0.0%) | 0 (0.0%) |
| 5 or more Children | 0 (0.0%) | 0 (0.0%) |
| Total | 5 (1.7%) | 26 (26.0%) |
Race in Madison
The most populous races in Madison are White / Caucasian (1,522 | 97.2%), Asian (26 | 1.7%), and Hispanic or Latino (12 | 0.8%).
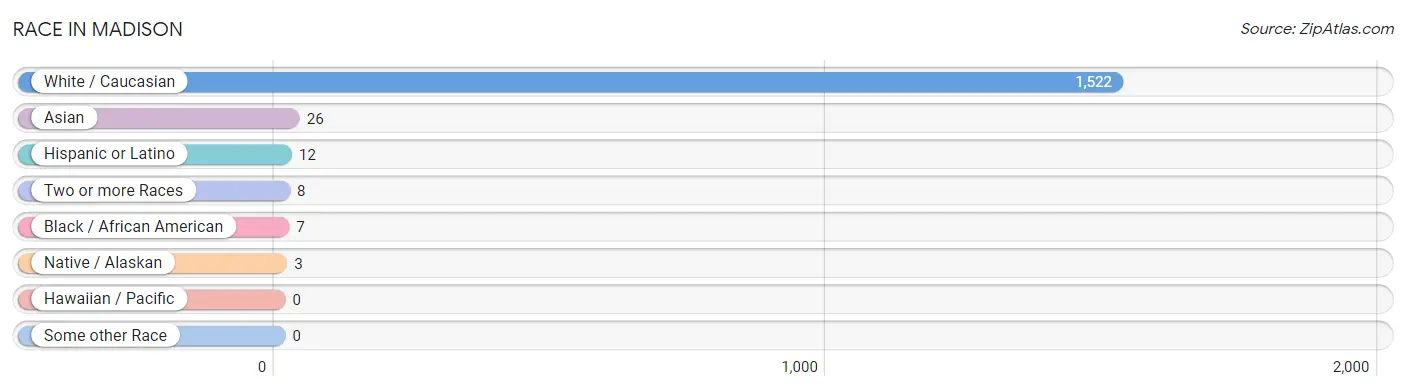
| Race | # Population | % Population |
| Asian | 26 | 1.7% |
| Black / African American | 7 | 0.4% |
| Hawaiian / Pacific | 0 | 0.0% |
| Hispanic or Latino | 12 | 0.8% |
| Native / Alaskan | 3 | 0.2% |
| White / Caucasian | 1,522 | 97.2% |
| Two or more Races | 8 | 0.5% |
| Some other Race | 0 | 0.0% |
| Total | 1,566 | 100.0% |
Ancestry in Madison
The most populous ancestries reported in Madison are German (703 | 44.9%), Norwegian (523 | 33.4%), Swedish (108 | 6.9%), English (70 | 4.5%), and Irish (70 | 4.5%), together accounting for 94.1% of all Madison residents.
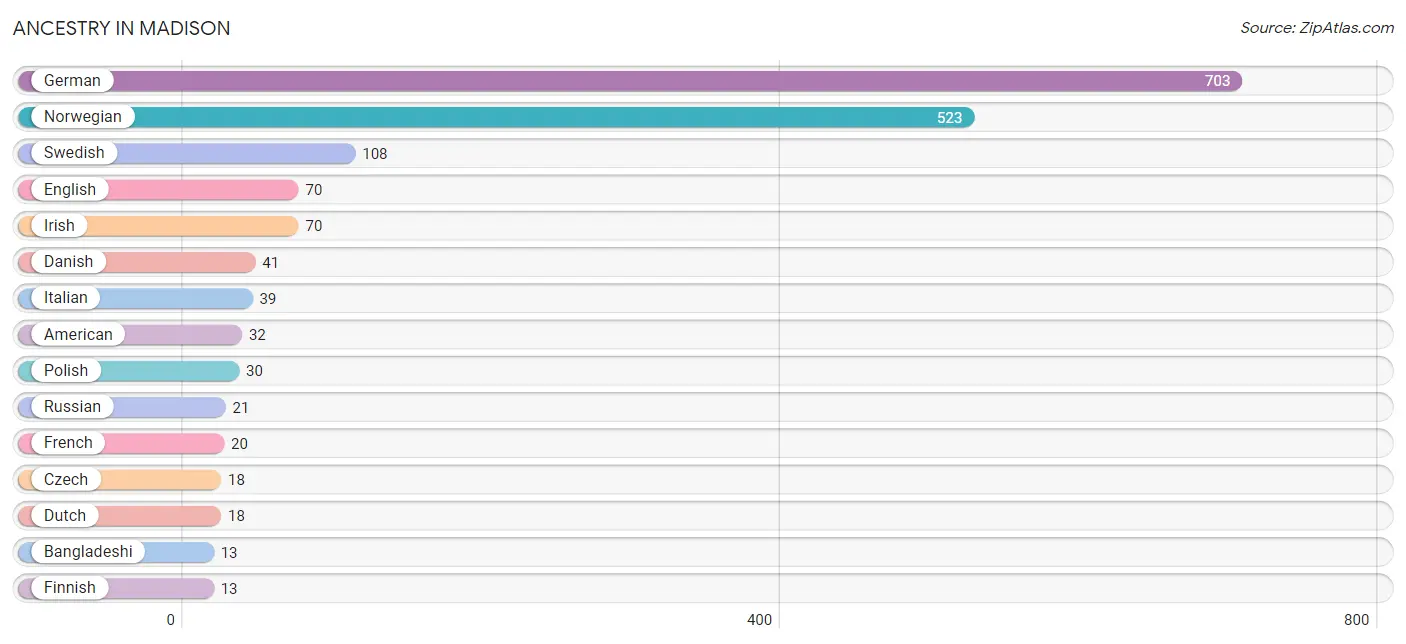
| Ancestry | # Population | % Population |
| American | 32 | 2.0% |
| Bangladeshi | 13 | 0.8% |
| Belgian | 10 | 0.6% |
| Bhutanese | 5 | 0.3% |
| Chippewa | 1 | 0.1% |
| Colombian | 5 | 0.3% |
| Czech | 18 | 1.1% |
| Danish | 41 | 2.6% |
| Dutch | 18 | 1.1% |
| English | 70 | 4.5% |
| European | 4 | 0.3% |
| Finnish | 13 | 0.8% |
| French | 20 | 1.3% |
| French Canadian | 13 | 0.8% |
| German | 703 | 44.9% |
| Icelander | 3 | 0.2% |
| Irish | 70 | 4.5% |
| Italian | 39 | 2.5% |
| Korean | 4 | 0.3% |
| Mexican | 7 | 0.4% |
| Norwegian | 523 | 33.4% |
| Pakistani | 4 | 0.3% |
| Polish | 30 | 1.9% |
| Russian | 21 | 1.3% |
| Scandinavian | 12 | 0.8% |
| Sioux | 2 | 0.1% |
| Somali | 1 | 0.1% |
| South American | 5 | 0.3% |
| Subsaharan African | 1 | 0.1% |
| Swedish | 108 | 6.9% | View All 30 Rows |
Immigrants in Madison
The most numerous immigrant groups reported in Madison came from Asia (18 | 1.1%), South Eastern Asia (18 | 1.1%), Laos (10 | 0.6%), Latin America (6 | 0.4%), and Canada (5 | 0.3%), together accounting for 3.6% of all Madison residents.
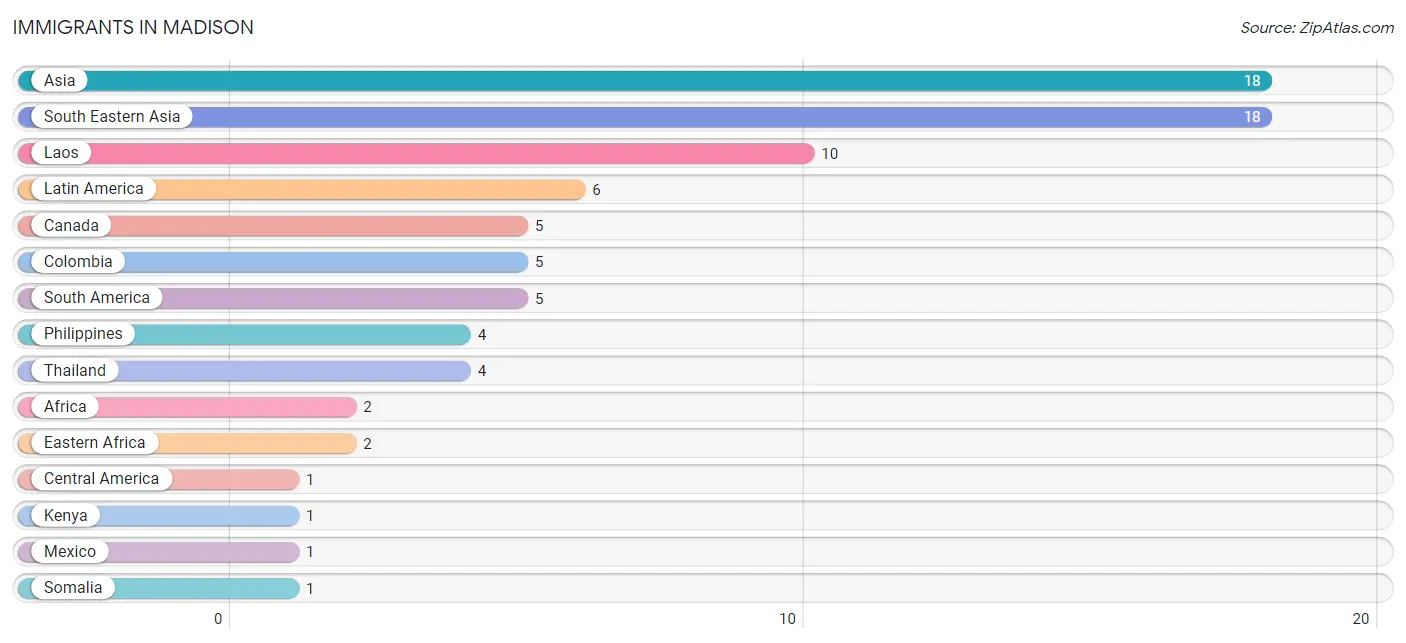
| Immigration Origin | # Population | % Population |
| Africa | 2 | 0.1% |
| Asia | 18 | 1.1% |
| Canada | 5 | 0.3% |
| Central America | 1 | 0.1% |
| Colombia | 5 | 0.3% |
| Eastern Africa | 2 | 0.1% |
| Kenya | 1 | 0.1% |
| Laos | 10 | 0.6% |
| Latin America | 6 | 0.4% |
| Mexico | 1 | 0.1% |
| Philippines | 4 | 0.3% |
| Somalia | 1 | 0.1% |
| South America | 5 | 0.3% |
| South Eastern Asia | 18 | 1.1% |
| Thailand | 4 | 0.3% | View All 15 Rows |
Sex and Age in Madison
Sex and Age in Madison
The most populous age groups in Madison are 60 to 64 Years (119 | 16.3%) for men and 85 Years and over (94 | 11.2%) for women.
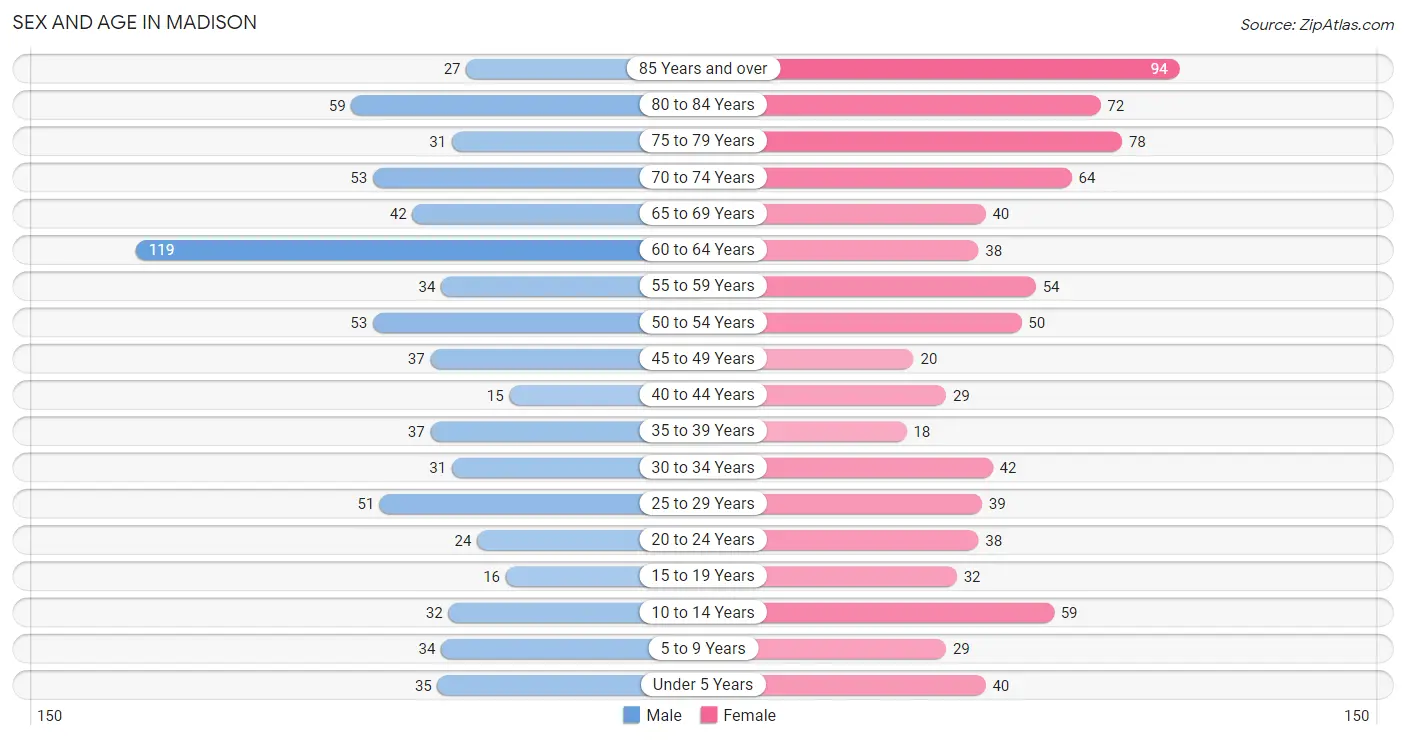
| Age Bracket | Male | Female |
| Under 5 Years | 35 (4.8%) | 40 (4.8%) |
| 5 to 9 Years | 34 (4.7%) | 29 (3.5%) |
| 10 to 14 Years | 32 (4.4%) | 59 (7.1%) |
| 15 to 19 Years | 16 (2.2%) | 32 (3.8%) |
| 20 to 24 Years | 24 (3.3%) | 38 (4.5%) |
| 25 to 29 Years | 51 (7.0%) | 39 (4.7%) |
| 30 to 34 Years | 31 (4.3%) | 42 (5.0%) |
| 35 to 39 Years | 37 (5.1%) | 18 (2.1%) |
| 40 to 44 Years | 15 (2.1%) | 29 (3.5%) |
| 45 to 49 Years | 37 (5.1%) | 20 (2.4%) |
| 50 to 54 Years | 53 (7.3%) | 50 (6.0%) |
| 55 to 59 Years | 34 (4.7%) | 54 (6.5%) |
| 60 to 64 Years | 119 (16.3%) | 38 (4.5%) |
| 65 to 69 Years | 42 (5.8%) | 40 (4.8%) |
| 70 to 74 Years | 53 (7.3%) | 64 (7.7%) |
| 75 to 79 Years | 31 (4.3%) | 78 (9.3%) |
| 80 to 84 Years | 59 (8.1%) | 72 (8.6%) |
| 85 Years and over | 27 (3.7%) | 94 (11.2%) |
| Total | 730 (100.0%) | 836 (100.0%) |
Families and Households in Madison
Median Family Size in Madison
The median family size in Madison is 2.56 persons per family, with single female/mother families (59 | 14.9%) accounting for the largest median family size of 2.86 persons per family. On the other hand, married-couple families (296 | 74.8%) represent the smallest median family size with 2.50 persons per family.
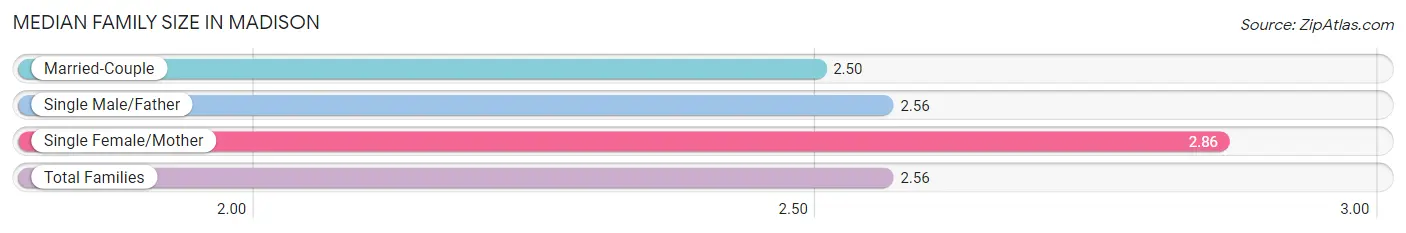
| Family Type | # Families | Family Size |
| Married-Couple | 296 (74.8%) | 2.50 |
| Single Male/Father | 41 (10.3%) | 2.56 |
| Single Female/Mother | 59 (14.9%) | 2.86 |
| Total Families | 396 (100.0%) | 2.56 |
Median Household Size in Madison
The median household size in Madison is 1.99 persons per household, with single male/father households (41 | 5.5%) accounting for the largest median household size of 3.76 persons per household. non-family households (354 | 47.2%) represent the smallest median household size with 1.17 persons per household.
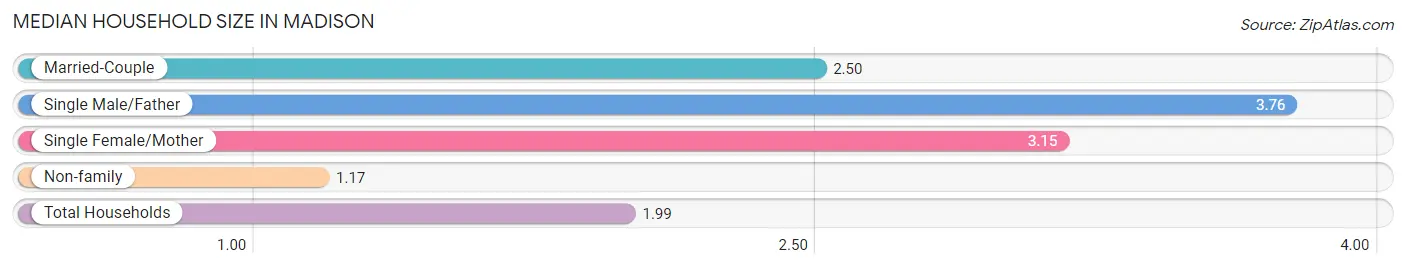
| Household Type | # Households | Household Size |
| Married-Couple | 296 (39.5%) | 2.50 |
| Single Male/Father | 41 (5.5%) | 3.76 |
| Single Female/Mother | 59 (7.9%) | 3.15 |
| Non-family | 354 (47.2%) | 1.17 |
| Total Households | 750 (100.0%) | 1.99 |
Household Size by Marriage Status in Madison
Out of a total of 750 households in Madison, 396 (52.8%) are family households, while 354 (47.2%) are nonfamily households. The most numerous type of family households are 2-person households, comprising 244, and the most common type of nonfamily households are 1-person households, comprising 314.
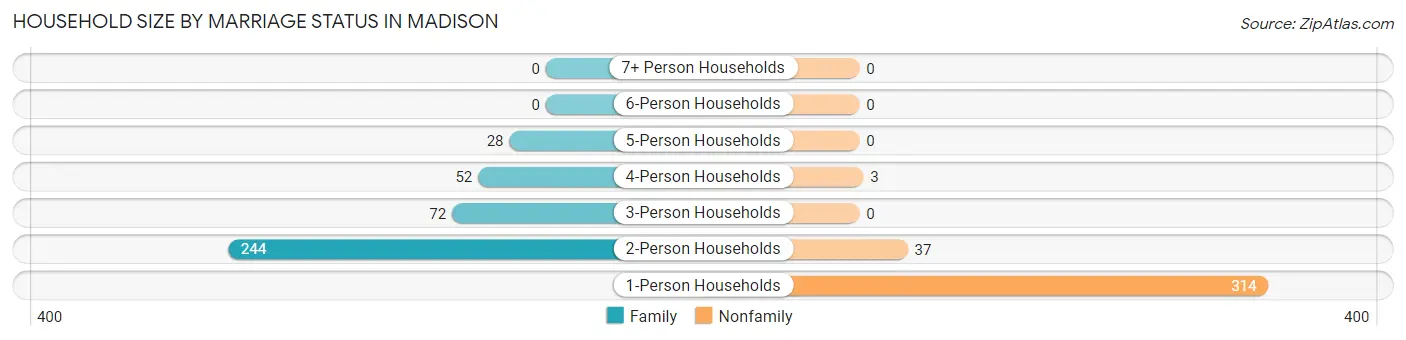
| Household Size | Family Households | Nonfamily Households |
| 1-Person Households | - | 314 (41.9%) |
| 2-Person Households | 244 (32.5%) | 37 (4.9%) |
| 3-Person Households | 72 (9.6%) | 0 (0.0%) |
| 4-Person Households | 52 (6.9%) | 3 (0.4%) |
| 5-Person Households | 28 (3.7%) | 0 (0.0%) |
| 6-Person Households | 0 (0.0%) | 0 (0.0%) |
| 7+ Person Households | 0 (0.0%) | 0 (0.0%) |
| Total | 396 (52.8%) | 354 (47.2%) |
Female Fertility in Madison
Fertility by Age in Madison
Average fertility rate in Madison is 77.0 births per 1,000 women. Women in the age bracket of 20 to 34 years have the highest fertility rate with 134.0 births per 1,000 women. Women in the age bracket of 20 to 34 years acount for 88.9% of all women with births.
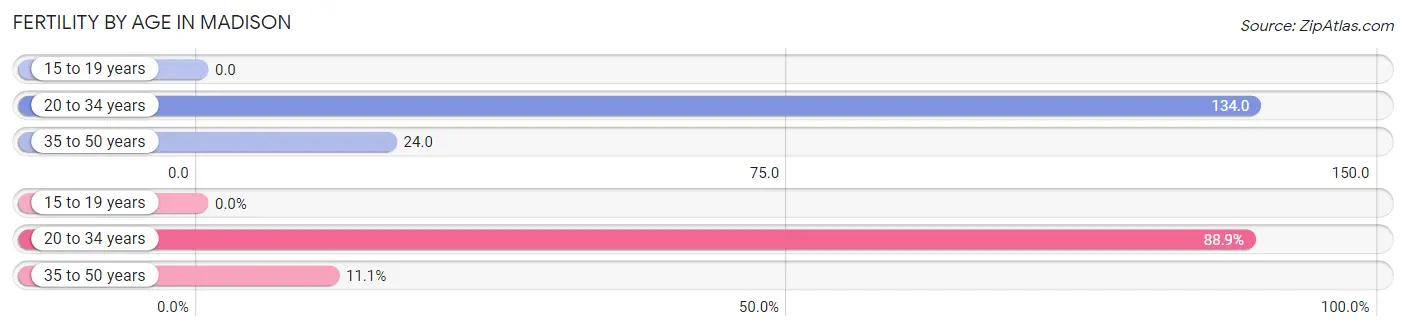
| Age Bracket | Women with Births | Births / 1,000 Women |
| 15 to 19 years | 0 (0.0%) | 0.0 |
| 20 to 34 years | 16 (88.9%) | 134.0 |
| 35 to 50 years | 2 (11.1%) | 24.0 |
| Total | 18 (100.0%) | 77.0 |
Fertility by Age by Marriage Status in Madison
33.3% of women with births (18) in Madison are married. The highest percentage of unmarried women with births falls into 20 to 34 years age bracket with 75.0% of them unmarried at the time of birth, while the lowest percentage of unmarried women with births belong to 35 to 50 years age bracket with 0.0% of them unmarried.
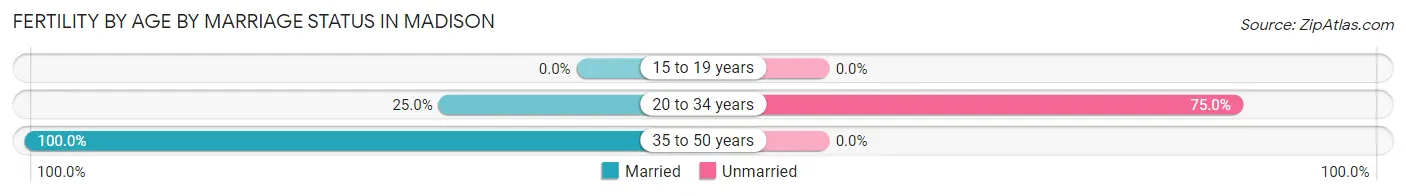
| Age Bracket | Married | Unmarried |
| 15 to 19 years | 0 (0.0%) | 0 (0.0%) |
| 20 to 34 years | 4 (25.0%) | 12 (75.0%) |
| 35 to 50 years | 2 (100.0%) | 0 (0.0%) |
| Total | 6 (33.3%) | 12 (66.7%) |
Fertility by Education in Madison
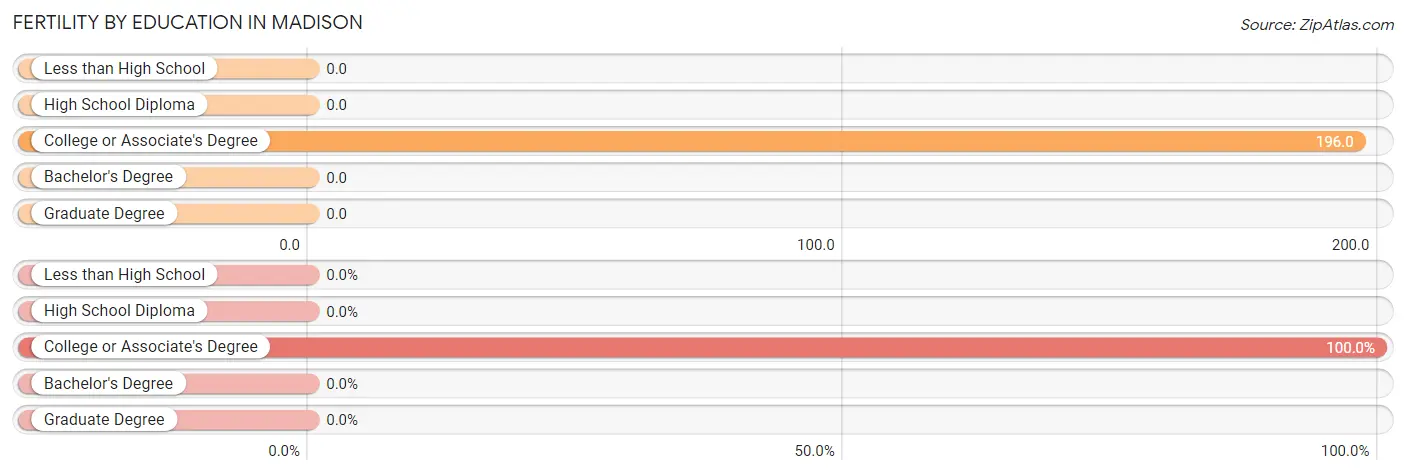
| Educational Attainment | Women with Births | Births / 1,000 Women |
| Less than High School | 0 (0.0%) | 0.0 |
| High School Diploma | 0 (0.0%) | 0.0 |
| College or Associate's Degree | 18 (100.0%) | 196.0 |
| Bachelor's Degree | 0 (0.0%) | 0.0 |
| Graduate Degree | 0 (0.0%) | 0.0 |
| Total | 18 (100.0%) | 77.0 |
Fertility by Education by Marriage Status in Madison
66.7% of women with births in Madison are unmarried. Women with the educational attainment of college or associate's degree are most likely to be married with 33.3% of them married at childbirth, while women with the educational attainment of college or associate's degree are least likely to be married with 66.7% of them unmarried at childbirth.
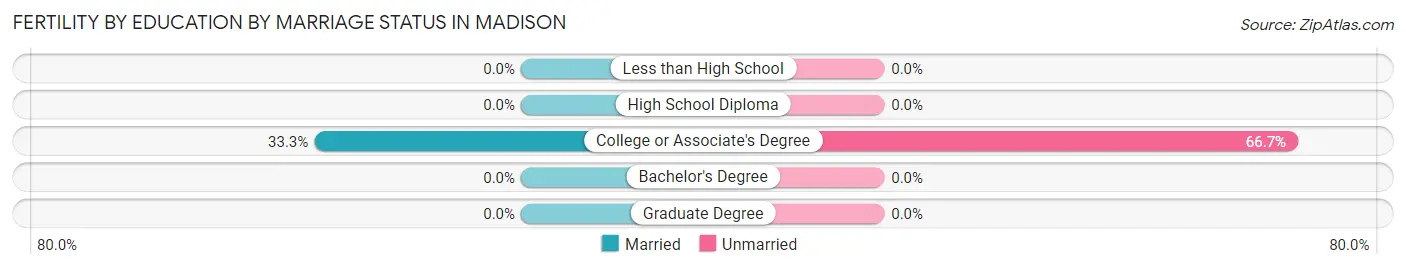
| Educational Attainment | Married | Unmarried |
| Less than High School | 0 (0.0%) | 0 (0.0%) |
| High School Diploma | 0 (0.0%) | 0 (0.0%) |
| College or Associate's Degree | 6 (33.3%) | 12 (66.7%) |
| Bachelor's Degree | 0 (0.0%) | 0 (0.0%) |
| Graduate Degree | 0 (0.0%) | 0 (0.0%) |
| Total | 6 (33.3%) | 12 (66.7%) |
Employment Characteristics in Madison
Employment by Class of Employer in Madison
Among the 643 employed individuals in Madison, private company employees (348 | 54.1%), not-for-profit organizations (129 | 20.1%), and local government employees (74 | 11.5%) make up the most common classes of employment.
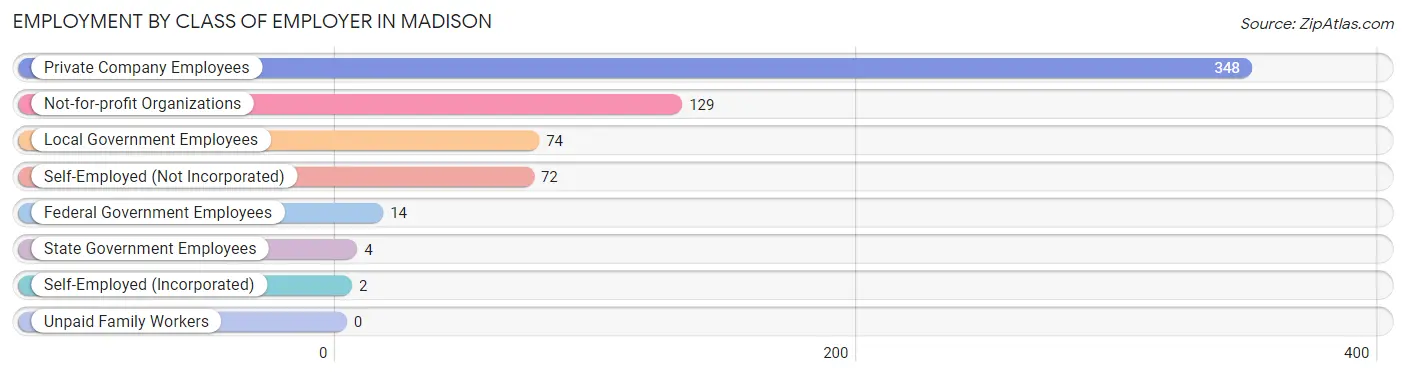
| Employer Class | # Employees | % Employees |
| Private Company Employees | 348 | 54.1% |
| Self-Employed (Incorporated) | 2 | 0.3% |
| Self-Employed (Not Incorporated) | 72 | 11.2% |
| Not-for-profit Organizations | 129 | 20.1% |
| Local Government Employees | 74 | 11.5% |
| State Government Employees | 4 | 0.6% |
| Federal Government Employees | 14 | 2.2% |
| Unpaid Family Workers | 0 | 0.0% |
| Total | 643 | 100.0% |
Employment Status by Age in Madison
According to the labor force statistics for Madison, out of the total population over 16 years of age (1,325), 50.0% or 662 individuals are in the labor force, with 0.6% or 4 of them unemployed. The age group with the highest labor force participation rate is 20 to 24 years, with 100.0% or 62 individuals in the labor force. Within the labor force, the 30 to 34 years age range has the highest percentage of unemployed individuals, with 3.0% or 2 of them being unemployed.
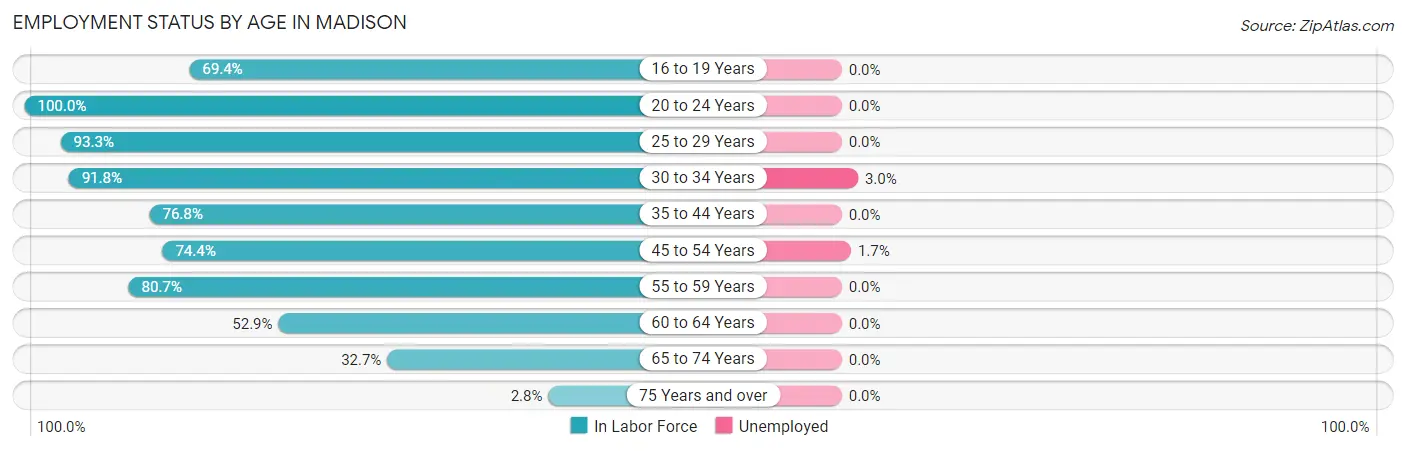
| Age Bracket | In Labor Force | Unemployed |
| 16 to 19 Years | 25 (69.4%) | 0 (0.0%) |
| 20 to 24 Years | 62 (100.0%) | 0 (0.0%) |
| 25 to 29 Years | 84 (93.3%) | 0 (0.0%) |
| 30 to 34 Years | 67 (91.8%) | 2 (3.0%) |
| 35 to 44 Years | 76 (76.8%) | 0 (0.0%) |
| 45 to 54 Years | 119 (74.4%) | 2 (1.7%) |
| 55 to 59 Years | 71 (80.7%) | 0 (0.0%) |
| 60 to 64 Years | 83 (52.9%) | 0 (0.0%) |
| 65 to 74 Years | 65 (32.7%) | 0 (0.0%) |
| 75 Years and over | 10 (2.8%) | 0 (0.0%) |
| Total | 662 (50.0%) | 4 (0.6%) |
Employment Status by Educational Attainment in Madison
According to labor force statistics for Madison, 75.0% of individuals (500) out of the total population between 25 and 64 years of age (667) are in the labor force, with 0.8% or 4 of them being unemployed. The group with the highest labor force participation rate are those with the educational attainment of college / associate degree, with 82.3% or 218 individuals in the labor force. Within the labor force, individuals with high school diploma education have the highest percentage of unemployment, with 1.3% or 2 of them being unemployed.
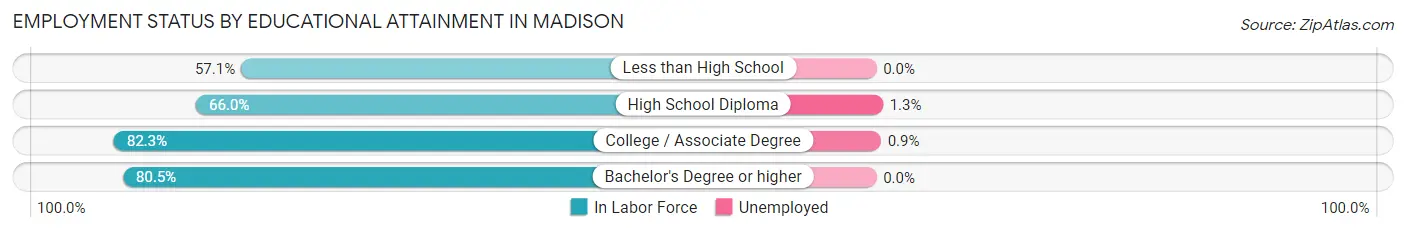
| Educational Attainment | In Labor Force | Unemployed |
| Less than High School | 16 (57.1%) | 0 (0.0%) |
| High School Diploma | 159 (66.0%) | 3 (1.3%) |
| College / Associate Degree | 218 (82.3%) | 2 (0.9%) |
| Bachelor's Degree or higher | 107 (80.5%) | 0 (0.0%) |
| Total | 500 (75.0%) | 5 (0.8%) |
Employment Occupations by Sex in Madison
Management, Business, Science and Arts Occupations
The most common Management, Business, Science and Arts occupations in Madison are Management (72 | 10.9%), Community & Social Service (69 | 10.5%), Health Diagnosing & Treating (54 | 8.2%), Education Instruction & Library (51 | 7.7%), and Health Technologists (27 | 4.1%).
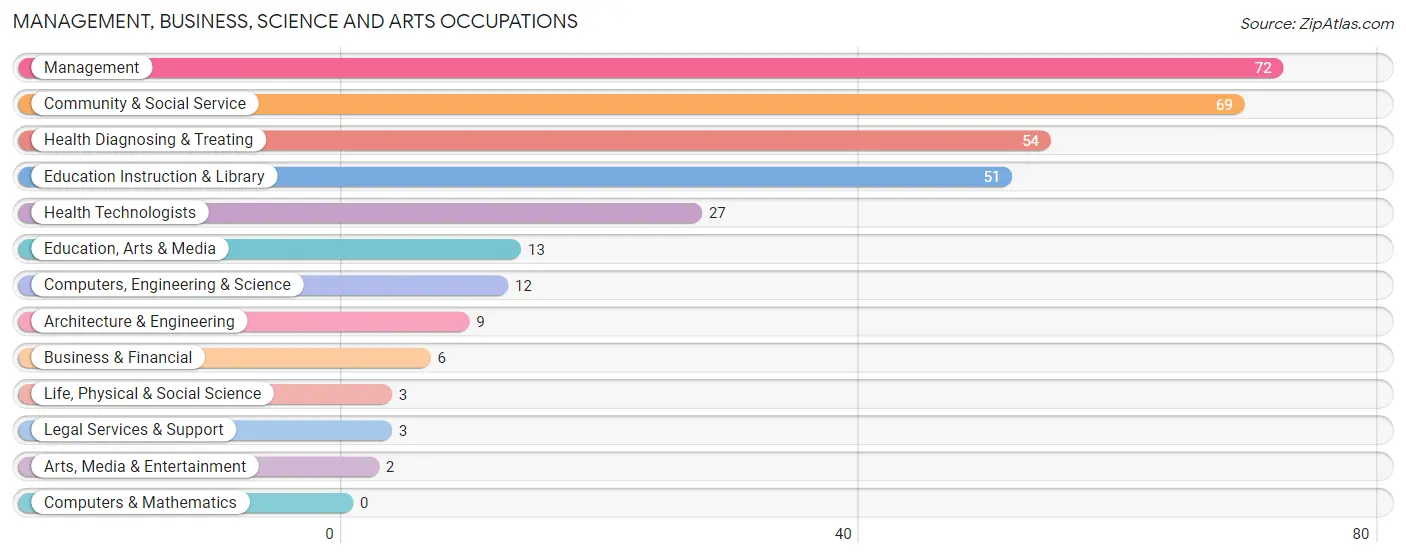
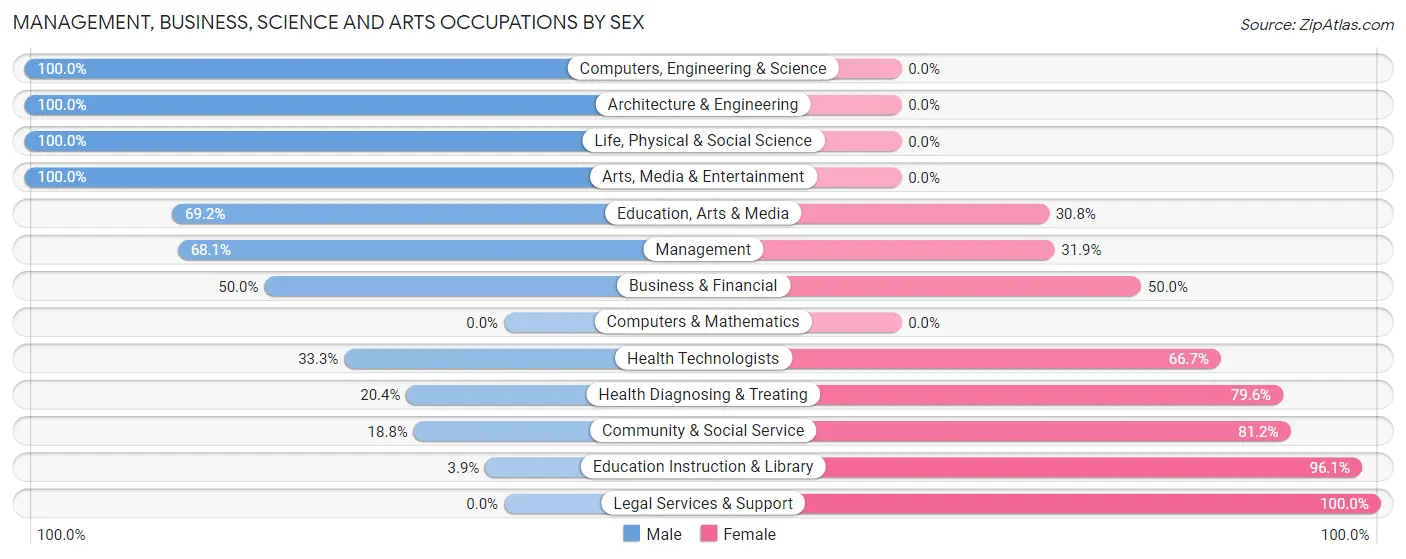
Management, Business, Science and Arts Occupations by Sex
Within the Management, Business, Science and Arts occupations in Madison, the most male-oriented occupations are Computers, Engineering & Science (100.0%), Architecture & Engineering (100.0%), and Life, Physical & Social Science (100.0%), while the most female-oriented occupations are Legal Services & Support (100.0%), Education Instruction & Library (96.1%), and Community & Social Service (81.2%).
| Occupation | Male | Female |
| Management | 49 (68.1%) | 23 (31.9%) |
| Business & Financial | 3 (50.0%) | 3 (50.0%) |
| Computers, Engineering & Science | 12 (100.0%) | 0 (0.0%) |
| Computers & Mathematics | 0 (0.0%) | 0 (0.0%) |
| Architecture & Engineering | 9 (100.0%) | 0 (0.0%) |
| Life, Physical & Social Science | 3 (100.0%) | 0 (0.0%) |
| Community & Social Service | 13 (18.8%) | 56 (81.2%) |
| Education, Arts & Media | 9 (69.2%) | 4 (30.8%) |
| Legal Services & Support | 0 (0.0%) | 3 (100.0%) |
| Education Instruction & Library | 2 (3.9%) | 49 (96.1%) |
| Arts, Media & Entertainment | 2 (100.0%) | 0 (0.0%) |
| Health Diagnosing & Treating | 11 (20.4%) | 43 (79.6%) |
| Health Technologists | 9 (33.3%) | 18 (66.7%) |
| Total (Category) | 88 (41.3%) | 125 (58.7%) |
| Total (Overall) | 348 (52.9%) | 310 (47.1%) |
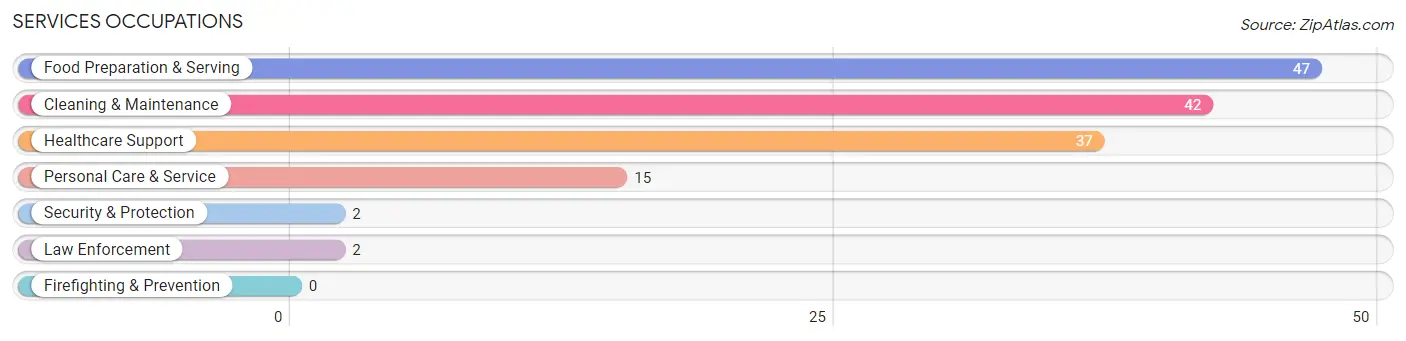
Services Occupations
The most common Services occupations in Madison are Food Preparation & Serving (47 | 7.1%), Cleaning & Maintenance (42 | 6.4%), Healthcare Support (37 | 5.6%), Personal Care & Service (15 | 2.3%), and Security & Protection (2 | 0.3%).
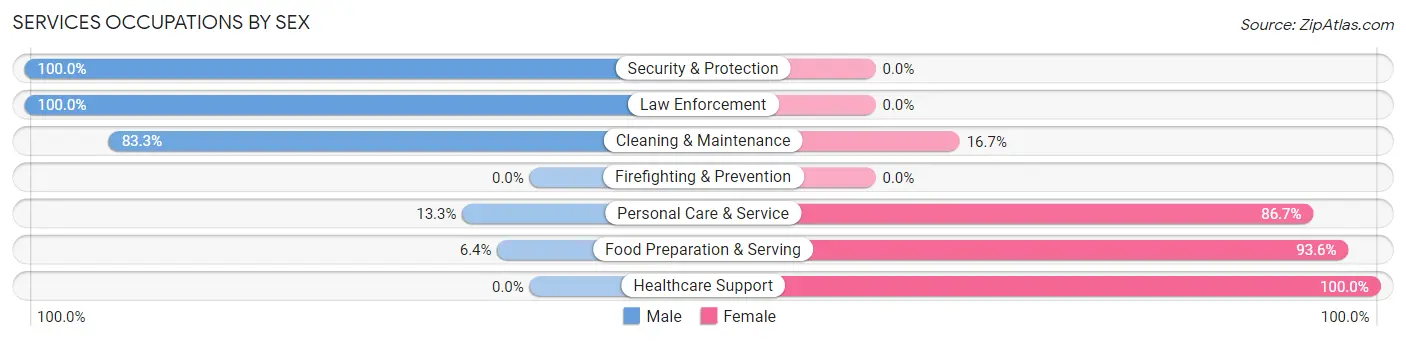
Services Occupations by Sex
Within the Services occupations in Madison, the most male-oriented occupations are Security & Protection (100.0%), Law Enforcement (100.0%), and Cleaning & Maintenance (83.3%), while the most female-oriented occupations are Healthcare Support (100.0%), Food Preparation & Serving (93.6%), and Personal Care & Service (86.7%).
| Occupation | Male | Female |
| Healthcare Support | 0 (0.0%) | 37 (100.0%) |
| Security & Protection | 2 (100.0%) | 0 (0.0%) |
| Firefighting & Prevention | 0 (0.0%) | 0 (0.0%) |
| Law Enforcement | 2 (100.0%) | 0 (0.0%) |
| Food Preparation & Serving | 3 (6.4%) | 44 (93.6%) |
| Cleaning & Maintenance | 35 (83.3%) | 7 (16.7%) |
| Personal Care & Service | 2 (13.3%) | 13 (86.7%) |
| Total (Category) | 42 (29.4%) | 101 (70.6%) |
| Total (Overall) | 348 (52.9%) | 310 (47.1%) |
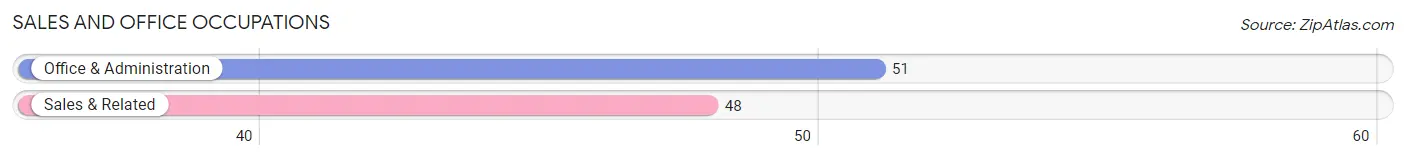
Sales and Office Occupations
The most common Sales and Office occupations in Madison are Office & Administration (51 | 7.7%), and Sales & Related (48 | 7.3%).
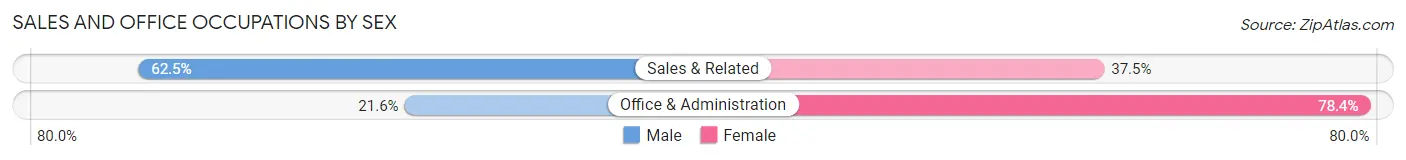
Sales and Office Occupations by Sex
| Occupation | Male | Female |
| Sales & Related | 30 (62.5%) | 18 (37.5%) |
| Office & Administration | 11 (21.6%) | 40 (78.4%) |
| Total (Category) | 41 (41.4%) | 58 (58.6%) |
| Total (Overall) | 348 (52.9%) | 310 (47.1%) |
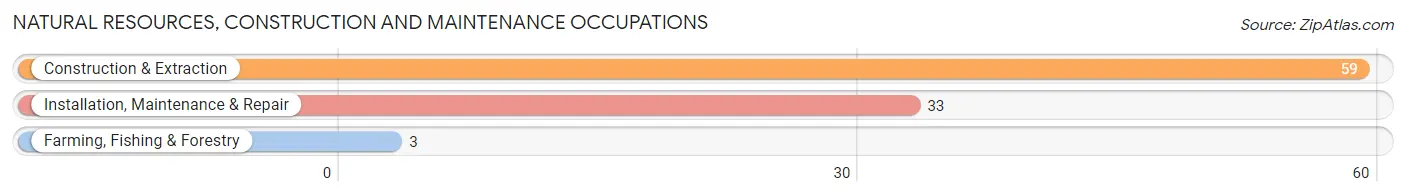
Natural Resources, Construction and Maintenance Occupations
The most common Natural Resources, Construction and Maintenance occupations in Madison are Construction & Extraction (59 | 9.0%), Installation, Maintenance & Repair (33 | 5.0%), and Farming, Fishing & Forestry (3 | 0.5%).
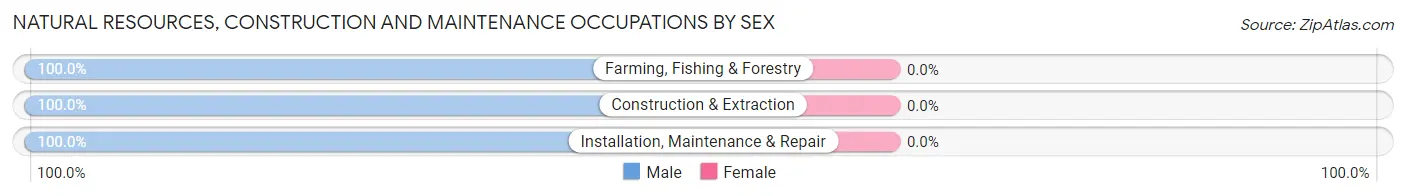
Natural Resources, Construction and Maintenance Occupations by Sex
| Occupation | Male | Female |
| Farming, Fishing & Forestry | 3 (100.0%) | 0 (0.0%) |
| Construction & Extraction | 59 (100.0%) | 0 (0.0%) |
| Installation, Maintenance & Repair | 33 (100.0%) | 0 (0.0%) |
| Total (Category) | 95 (100.0%) | 0 (0.0%) |
| Total (Overall) | 348 (52.9%) | 310 (47.1%) |
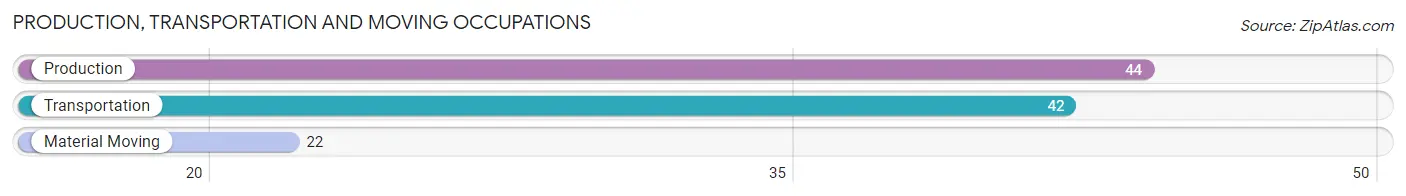
Production, Transportation and Moving Occupations
The most common Production, Transportation and Moving occupations in Madison are Production (44 | 6.7%), Transportation (42 | 6.4%), and Material Moving (22 | 3.3%).
Production, Transportation and Moving Occupations by Sex
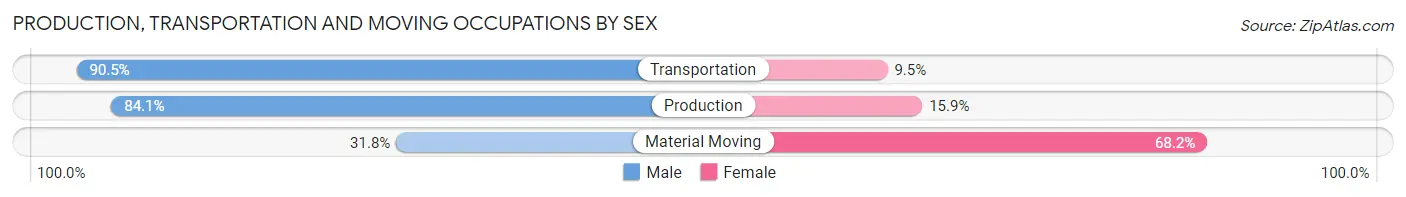
| Occupation | Male | Female |
| Production | 37 (84.1%) | 7 (15.9%) |
| Transportation | 38 (90.5%) | 4 (9.5%) |
| Material Moving | 7 (31.8%) | 15 (68.2%) |
| Total (Category) | 82 (75.9%) | 26 (24.1%) |
| Total (Overall) | 348 (52.9%) | 310 (47.1%) |
Employment Industries by Sex in Madison
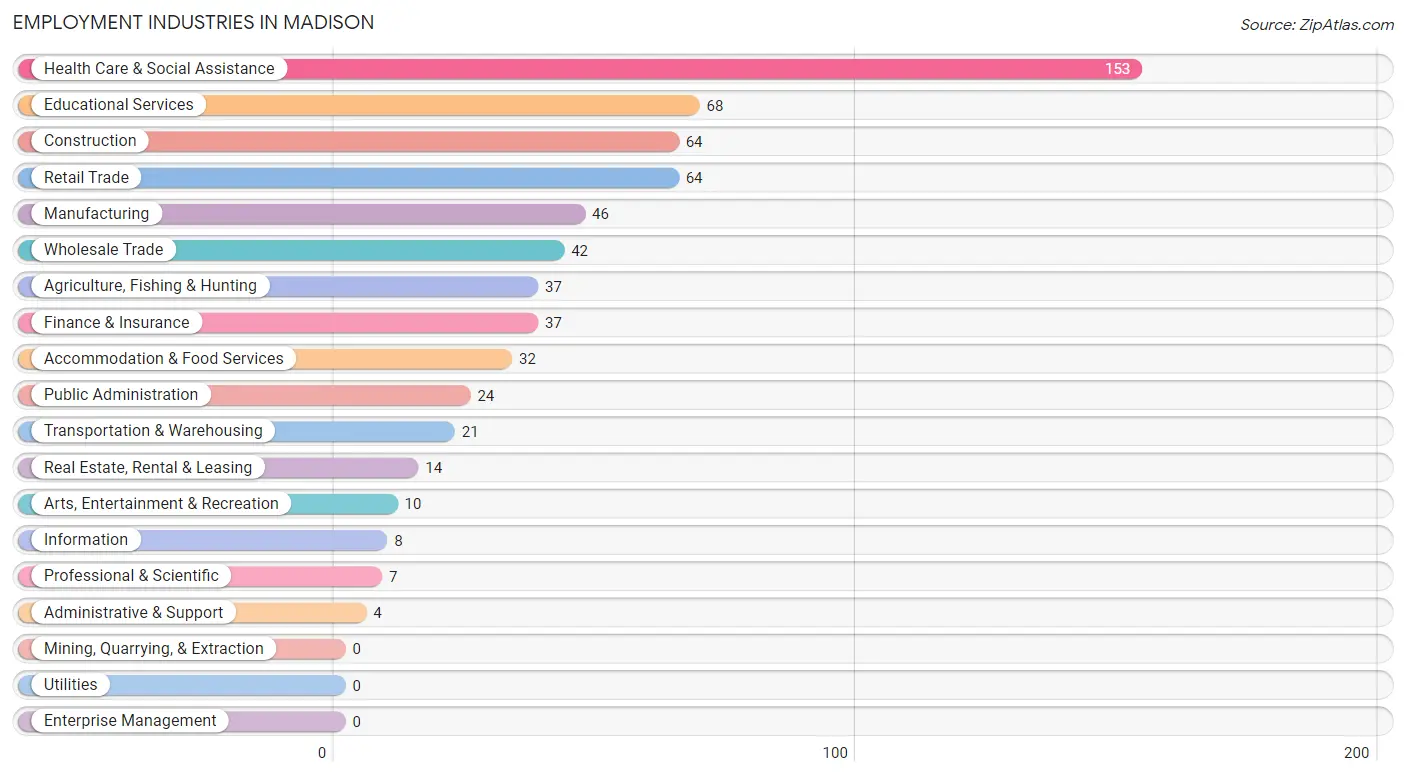
Employment Industries in Madison
The major employment industries in Madison include Health Care & Social Assistance (153 | 23.3%), Educational Services (68 | 10.3%), Construction (64 | 9.7%), Retail Trade (64 | 9.7%), and Manufacturing (46 | 7.0%).
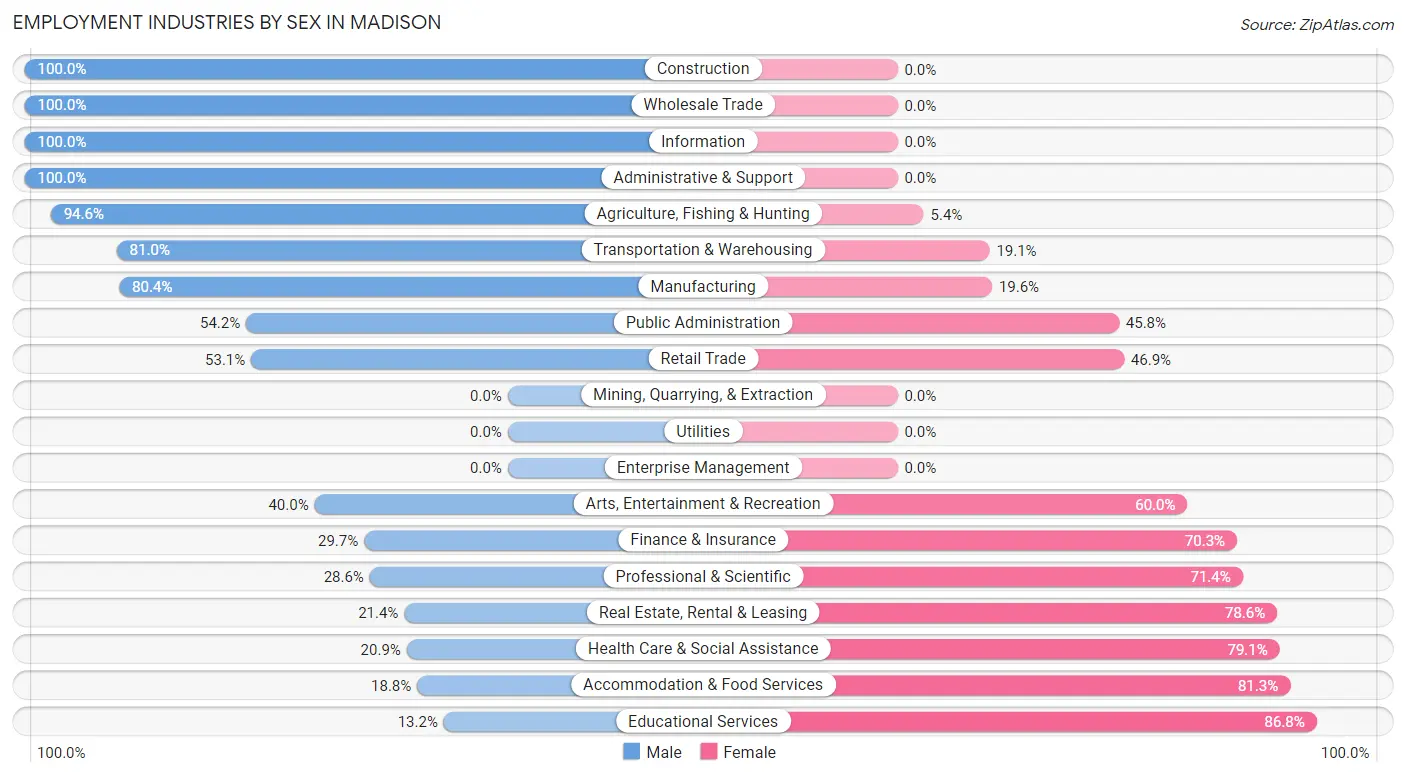
Employment Industries by Sex in Madison
The Madison industries that see more men than women are Construction (100.0%), Wholesale Trade (100.0%), and Information (100.0%), whereas the industries that tend to have a higher number of women are Educational Services (86.8%), Accommodation & Food Services (81.2%), and Health Care & Social Assistance (79.1%).
| Industry | Male | Female |
| Agriculture, Fishing & Hunting | 35 (94.6%) | 2 (5.4%) |
| Mining, Quarrying, & Extraction | 0 (0.0%) | 0 (0.0%) |
| Construction | 64 (100.0%) | 0 (0.0%) |
| Manufacturing | 37 (80.4%) | 9 (19.6%) |
| Wholesale Trade | 42 (100.0%) | 0 (0.0%) |
| Retail Trade | 34 (53.1%) | 30 (46.9%) |
| Transportation & Warehousing | 17 (80.9%) | 4 (19.1%) |
| Utilities | 0 (0.0%) | 0 (0.0%) |
| Information | 8 (100.0%) | 0 (0.0%) |
| Finance & Insurance | 11 (29.7%) | 26 (70.3%) |
| Real Estate, Rental & Leasing | 3 (21.4%) | 11 (78.6%) |
| Professional & Scientific | 2 (28.6%) | 5 (71.4%) |
| Enterprise Management | 0 (0.0%) | 0 (0.0%) |
| Administrative & Support | 4 (100.0%) | 0 (0.0%) |
| Educational Services | 9 (13.2%) | 59 (86.8%) |
| Health Care & Social Assistance | 32 (20.9%) | 121 (79.1%) |
| Arts, Entertainment & Recreation | 4 (40.0%) | 6 (60.0%) |
| Accommodation & Food Services | 6 (18.8%) | 26 (81.2%) |
| Public Administration | 13 (54.2%) | 11 (45.8%) |
| Total | 348 (52.9%) | 310 (47.1%) |
Education in Madison
School Enrollment in Madison
The most common levels of schooling among the 255 students in Madison are middle school (73 | 28.6%), high school (56 | 22.0%), and elementary school (39 | 15.3%).
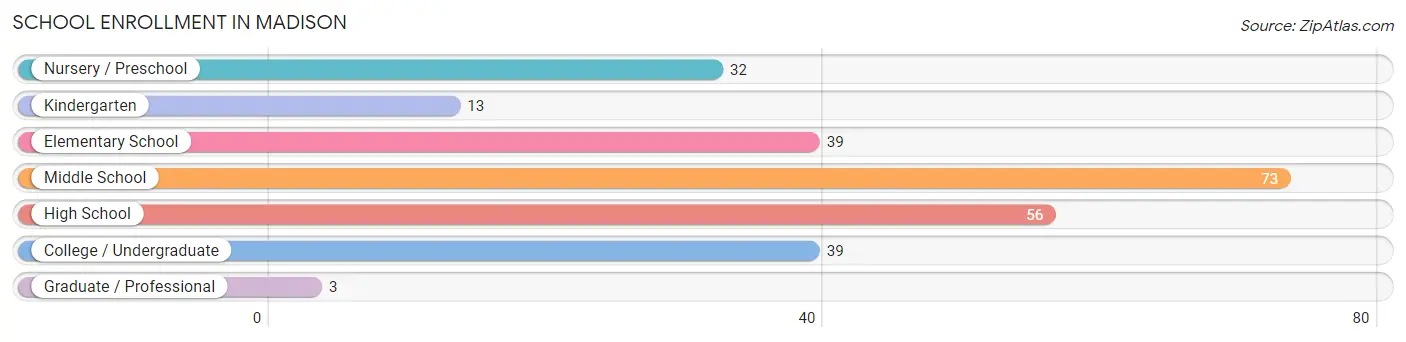
| School Level | # Students | % Students |
| Nursery / Preschool | 32 | 12.6% |
| Kindergarten | 13 | 5.1% |
| Elementary School | 39 | 15.3% |
| Middle School | 73 | 28.6% |
| High School | 56 | 22.0% |
| College / Undergraduate | 39 | 15.3% |
| Graduate / Professional | 3 | 1.2% |
| Total | 255 | 100.0% |
School Enrollment by Age by Funding Source in Madison
Out of a total of 255 students who are enrolled in schools in Madison, 37 (14.5%) attend a private institution, while the remaining 218 (85.5%) are enrolled in public schools. The age group of 10 to 14 year olds has the highest likelihood of being enrolled in private schools, with 26 (31.3% in the age bracket) enrolled. Conversely, the age group of 3 to 4 year olds has the lowest likelihood of being enrolled in a private school, with 19 (100.0% in the age bracket) attending a public institution.
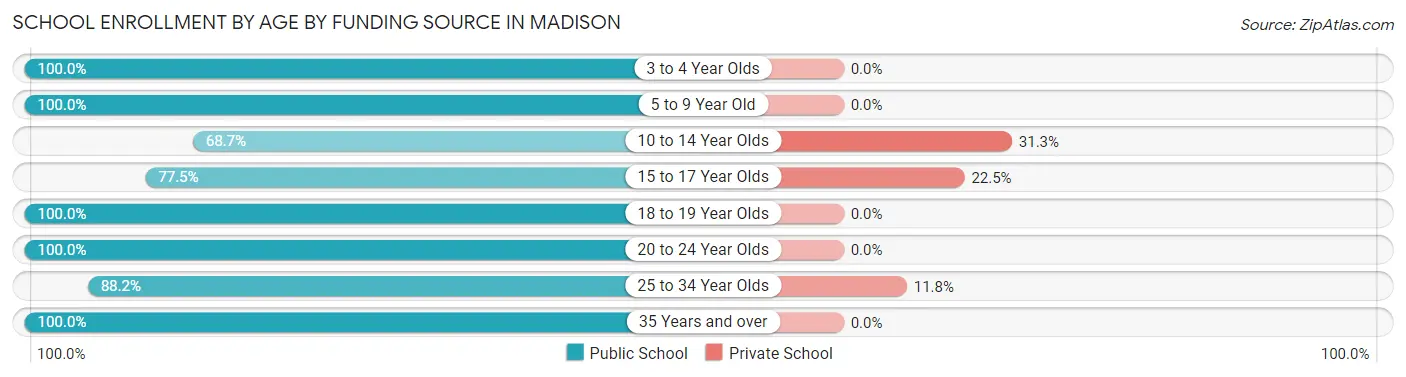
| Age Bracket | Public School | Private School |
| 3 to 4 Year Olds | 19 (100.0%) | 0 (0.0%) |
| 5 to 9 Year Old | 63 (100.0%) | 0 (0.0%) |
| 10 to 14 Year Olds | 57 (68.7%) | 26 (31.3%) |
| 15 to 17 Year Olds | 31 (77.5%) | 9 (22.5%) |
| 18 to 19 Year Olds | 8 (100.0%) | 0 (0.0%) |
| 20 to 24 Year Olds | 20 (100.0%) | 0 (0.0%) |
| 25 to 34 Year Olds | 15 (88.2%) | 2 (11.8%) |
| 35 Years and over | 5 (100.0%) | 0 (0.0%) |
| Total | 218 (85.5%) | 37 (14.5%) |
Educational Attainment by Field of Study in Madison
Education (76 | 31.1%), business (35 | 14.3%), science & technology (21 | 8.6%), bio, nature & agricultural (20 | 8.2%), and physical & health sciences (19 | 7.8%) are the most common fields of study among 244 individuals in Madison who have obtained a bachelor's degree or higher.
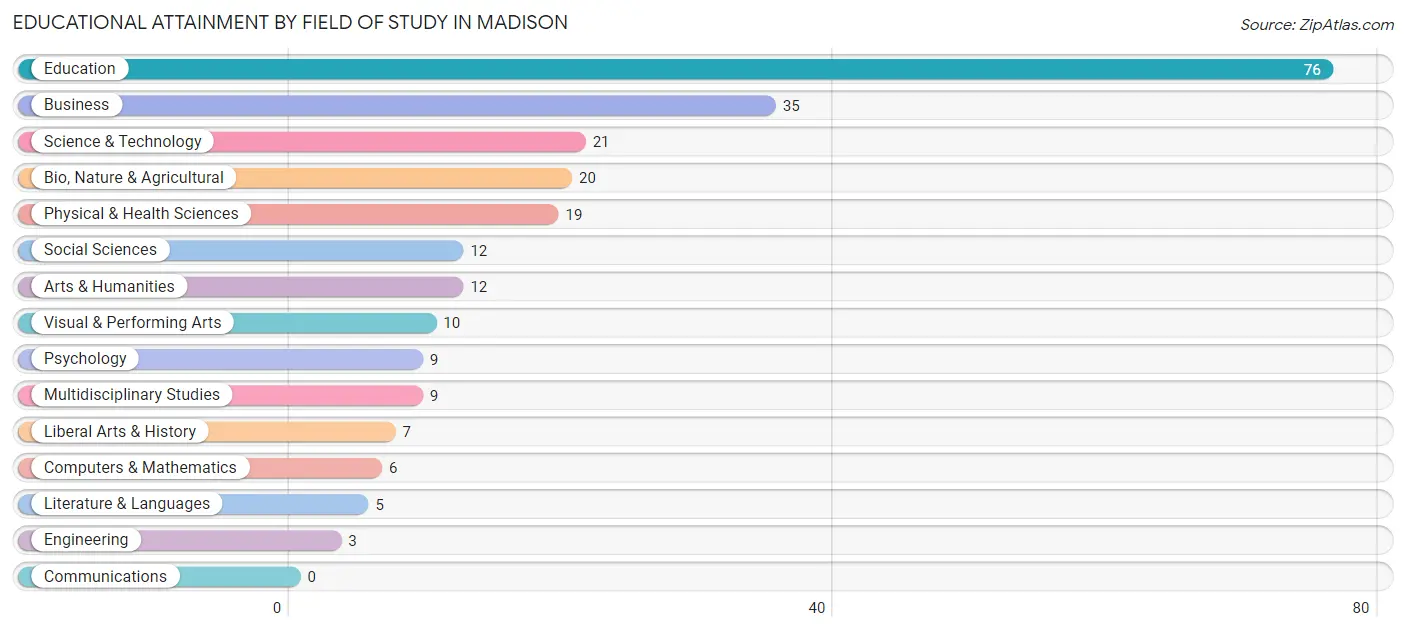
| Field of Study | # Graduates | % Graduates |
| Computers & Mathematics | 6 | 2.5% |
| Bio, Nature & Agricultural | 20 | 8.2% |
| Physical & Health Sciences | 19 | 7.8% |
| Psychology | 9 | 3.7% |
| Social Sciences | 12 | 4.9% |
| Engineering | 3 | 1.2% |
| Multidisciplinary Studies | 9 | 3.7% |
| Science & Technology | 21 | 8.6% |
| Business | 35 | 14.3% |
| Education | 76 | 31.1% |
| Literature & Languages | 5 | 2.1% |
| Liberal Arts & History | 7 | 2.9% |
| Visual & Performing Arts | 10 | 4.1% |
| Communications | 0 | 0.0% |
| Arts & Humanities | 12 | 4.9% |
| Total | 244 | 100.0% |
Transportation & Commute in Madison
Vehicle Availability by Sex in Madison
The most prevalent vehicle ownership categories in Madison are males with 2 vehicles (160, accounting for 46.1%) and females with 2 vehicles (127, making up 54.2%).
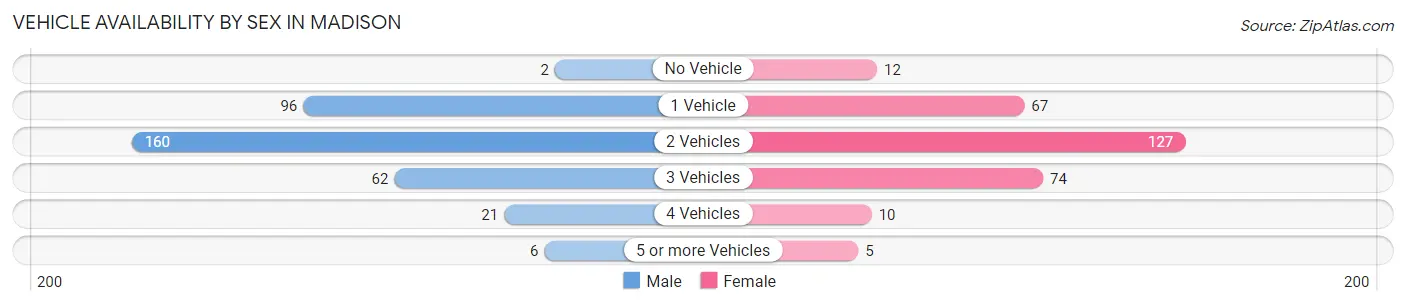
| Vehicles Available | Male | Female |
| No Vehicle | 2 (0.6%) | 12 (4.1%) |
| 1 Vehicle | 96 (27.7%) | 67 (22.7%) |
| 2 Vehicles | 160 (46.1%) | 127 (43.0%) |
| 3 Vehicles | 62 (17.9%) | 74 (25.1%) |
| 4 Vehicles | 21 (6.0%) | 10 (3.4%) |
| 5 or more Vehicles | 6 (1.7%) | 5 (1.7%) |
| Total | 347 (100.0%) | 295 (100.0%) |
Commute Time in Madison
The most frequently occuring commute durations in Madison are 5 to 9 minutes (157 commuters, 25.7%), less than 5 minutes (135 commuters, 22.1%), and 10 to 14 minutes (79 commuters, 13.0%).
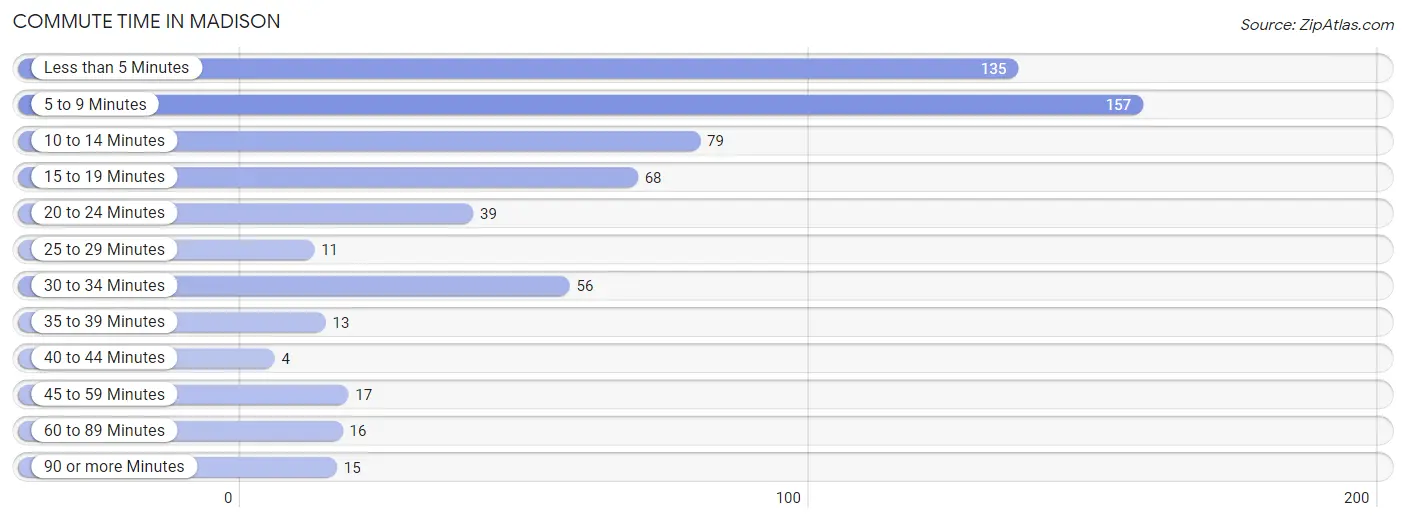
| Commute Time | # Commuters | % Commuters |
| Less than 5 Minutes | 135 | 22.1% |
| 5 to 9 Minutes | 157 | 25.7% |
| 10 to 14 Minutes | 79 | 13.0% |
| 15 to 19 Minutes | 68 | 11.2% |
| 20 to 24 Minutes | 39 | 6.4% |
| 25 to 29 Minutes | 11 | 1.8% |
| 30 to 34 Minutes | 56 | 9.2% |
| 35 to 39 Minutes | 13 | 2.1% |
| 40 to 44 Minutes | 4 | 0.7% |
| 45 to 59 Minutes | 17 | 2.8% |
| 60 to 89 Minutes | 16 | 2.6% |
| 90 or more Minutes | 15 | 2.5% |
Commute Time by Sex in Madison
The most common commute times in Madison are 5 to 9 minutes (100 commuters, 29.8%) for males and less than 5 minutes (65 commuters, 23.7%) for females.
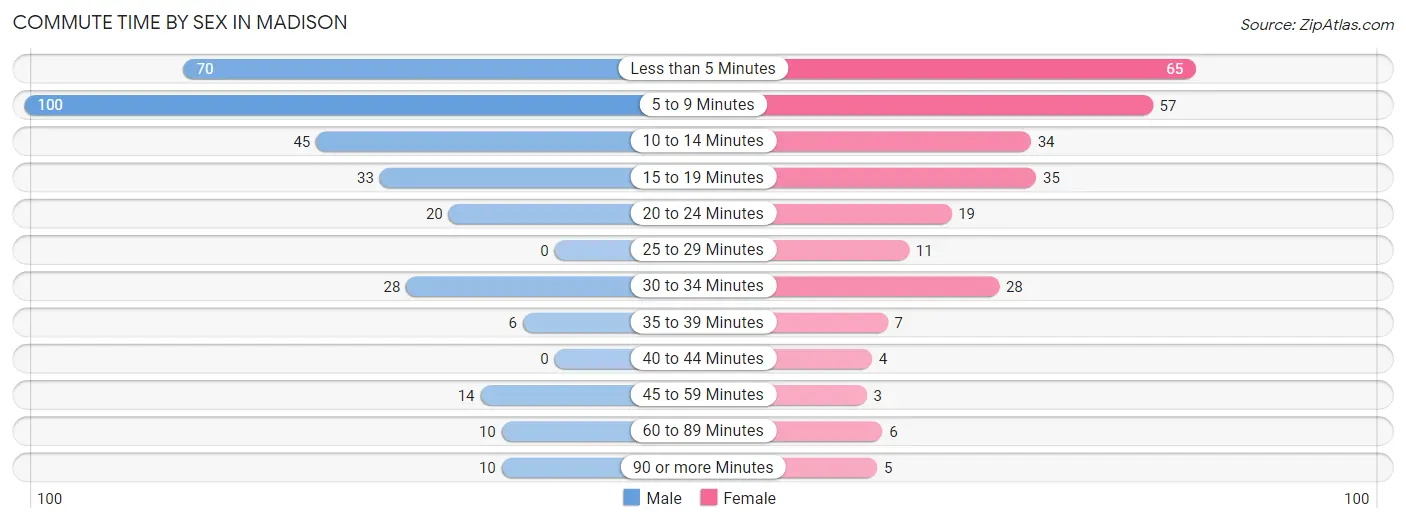
| Commute Time | Male | Female |
| Less than 5 Minutes | 70 (20.8%) | 65 (23.7%) |
| 5 to 9 Minutes | 100 (29.8%) | 57 (20.8%) |
| 10 to 14 Minutes | 45 (13.4%) | 34 (12.4%) |
| 15 to 19 Minutes | 33 (9.8%) | 35 (12.8%) |
| 20 to 24 Minutes | 20 (5.9%) | 19 (6.9%) |
| 25 to 29 Minutes | 0 (0.0%) | 11 (4.0%) |
| 30 to 34 Minutes | 28 (8.3%) | 28 (10.2%) |
| 35 to 39 Minutes | 6 (1.8%) | 7 (2.5%) |
| 40 to 44 Minutes | 0 (0.0%) | 4 (1.5%) |
| 45 to 59 Minutes | 14 (4.2%) | 3 (1.1%) |
| 60 to 89 Minutes | 10 (3.0%) | 6 (2.2%) |
| 90 or more Minutes | 10 (3.0%) | 5 (1.8%) |
Time of Departure to Work by Sex in Madison
The most frequent times of departure to work in Madison are 7:30 AM to 7:59 AM (76, 22.6%) for males and 7:30 AM to 7:59 AM (104, 38.0%) for females.
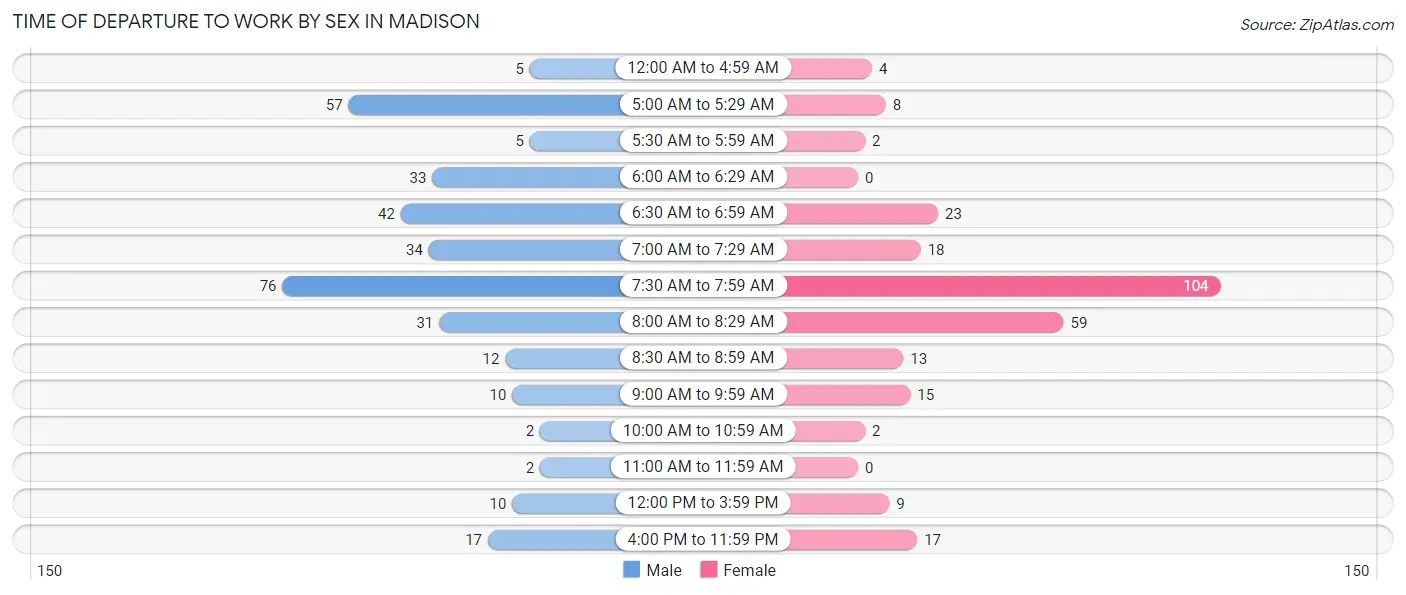
| Time of Departure | Male | Female |
| 12:00 AM to 4:59 AM | 5 (1.5%) | 4 (1.5%) |
| 5:00 AM to 5:29 AM | 57 (17.0%) | 8 (2.9%) |
| 5:30 AM to 5:59 AM | 5 (1.5%) | 2 (0.7%) |
| 6:00 AM to 6:29 AM | 33 (9.8%) | 0 (0.0%) |
| 6:30 AM to 6:59 AM | 42 (12.5%) | 23 (8.4%) |
| 7:00 AM to 7:29 AM | 34 (10.1%) | 18 (6.6%) |
| 7:30 AM to 7:59 AM | 76 (22.6%) | 104 (38.0%) |
| 8:00 AM to 8:29 AM | 31 (9.2%) | 59 (21.5%) |
| 8:30 AM to 8:59 AM | 12 (3.6%) | 13 (4.7%) |
| 9:00 AM to 9:59 AM | 10 (3.0%) | 15 (5.5%) |
| 10:00 AM to 10:59 AM | 2 (0.6%) | 2 (0.7%) |
| 11:00 AM to 11:59 AM | 2 (0.6%) | 0 (0.0%) |
| 12:00 PM to 3:59 PM | 10 (3.0%) | 9 (3.3%) |
| 4:00 PM to 11:59 PM | 17 (5.1%) | 17 (6.2%) |
| Total | 336 (100.0%) | 274 (100.0%) |
Housing Occupancy in Madison
Occupancy by Ownership in Madison
Of the total 750 dwellings in Madison, owner-occupied units account for 544 (72.5%), while renter-occupied units make up 206 (27.5%).
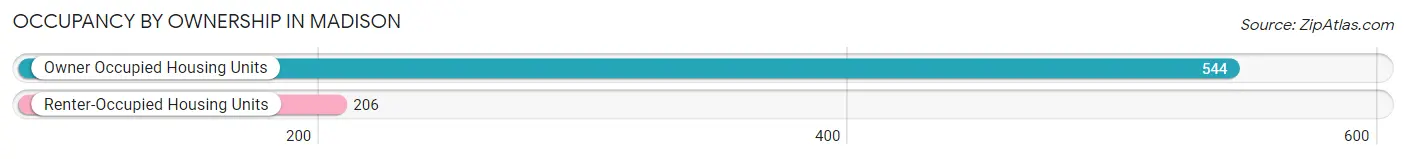
| Occupancy | # Housing Units | % Housing Units |
| Owner Occupied Housing Units | 544 | 72.5% |
| Renter-Occupied Housing Units | 206 | 27.5% |
| Total Occupied Housing Units | 750 | 100.0% |
Occupancy by Household Size in Madison
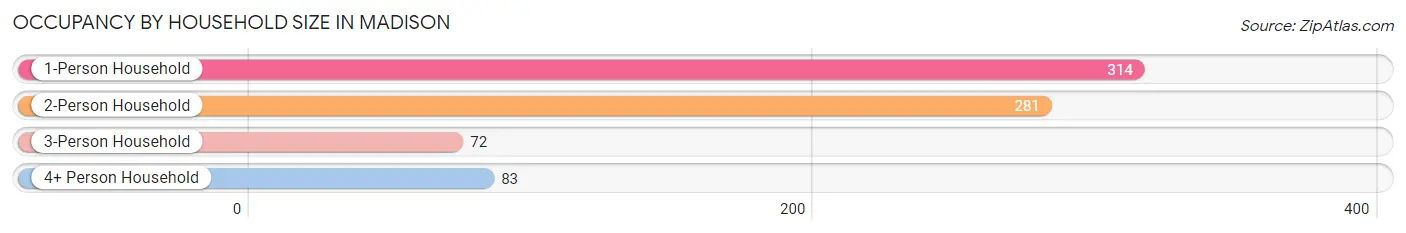
| Household Size | # Housing Units | % Housing Units |
| 1-Person Household | 314 | 41.9% |
| 2-Person Household | 281 | 37.5% |
| 3-Person Household | 72 | 9.6% |
| 4+ Person Household | 83 | 11.1% |
| Total Housing Units | 750 | 100.0% |
Occupancy by Ownership by Household Size in Madison
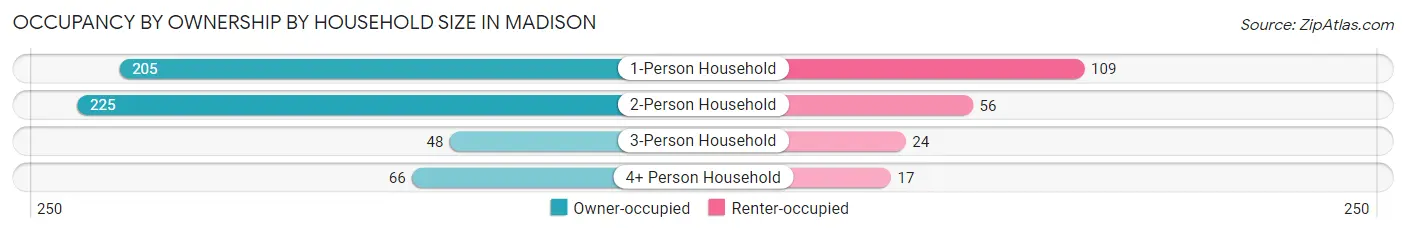
| Household Size | Owner-occupied | Renter-occupied |
| 1-Person Household | 205 (65.3%) | 109 (34.7%) |
| 2-Person Household | 225 (80.1%) | 56 (19.9%) |
| 3-Person Household | 48 (66.7%) | 24 (33.3%) |
| 4+ Person Household | 66 (79.5%) | 17 (20.5%) |
| Total Housing Units | 544 (72.5%) | 206 (27.5%) |
Occupancy by Educational Attainment in Madison
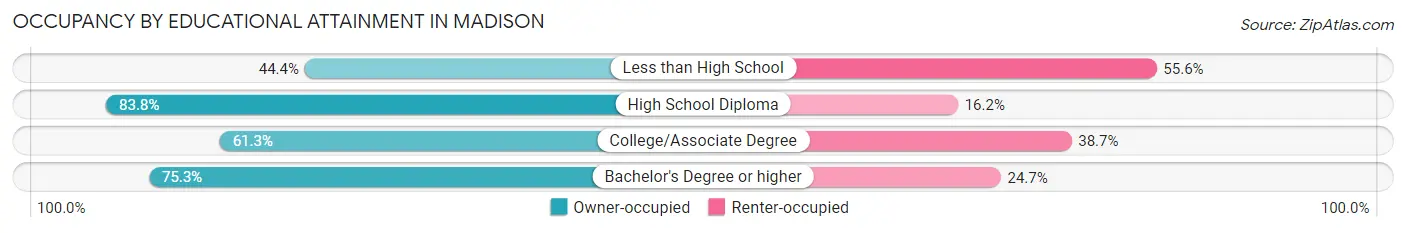
| Household Size | Owner-occupied | Renter-occupied |
| Less than High School | 12 (44.4%) | 15 (55.6%) |
| High School Diploma | 254 (83.8%) | 49 (16.2%) |
| College/Associate Degree | 168 (61.3%) | 106 (38.7%) |
| Bachelor's Degree or higher | 110 (75.3%) | 36 (24.7%) |
Occupancy by Age of Householder in Madison
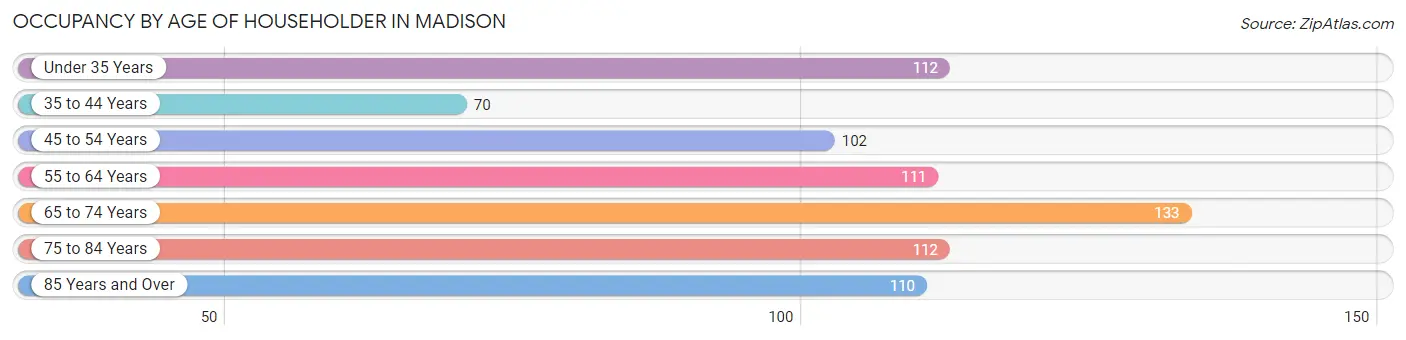
| Age Bracket | # Households | % Households |
| Under 35 Years | 112 | 14.9% |
| 35 to 44 Years | 70 | 9.3% |
| 45 to 54 Years | 102 | 13.6% |
| 55 to 64 Years | 111 | 14.8% |
| 65 to 74 Years | 133 | 17.7% |
| 75 to 84 Years | 112 | 14.9% |
| 85 Years and Over | 110 | 14.7% |
| Total | 750 | 100.0% |
Housing Finances in Madison
Median Income by Occupancy in Madison
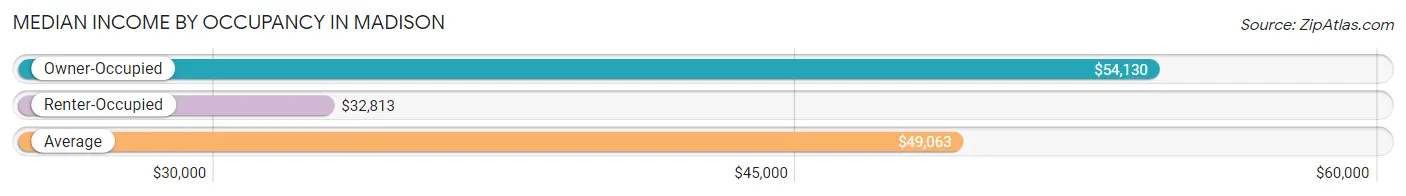
| Occupancy Type | # Households | Median Income |
| Owner-Occupied | 544 (72.5%) | $54,130 |
| Renter-Occupied | 206 (27.5%) | $32,813 |
| Average | 750 (100.0%) | $49,063 |
Occupancy by Householder Income Bracket in Madison
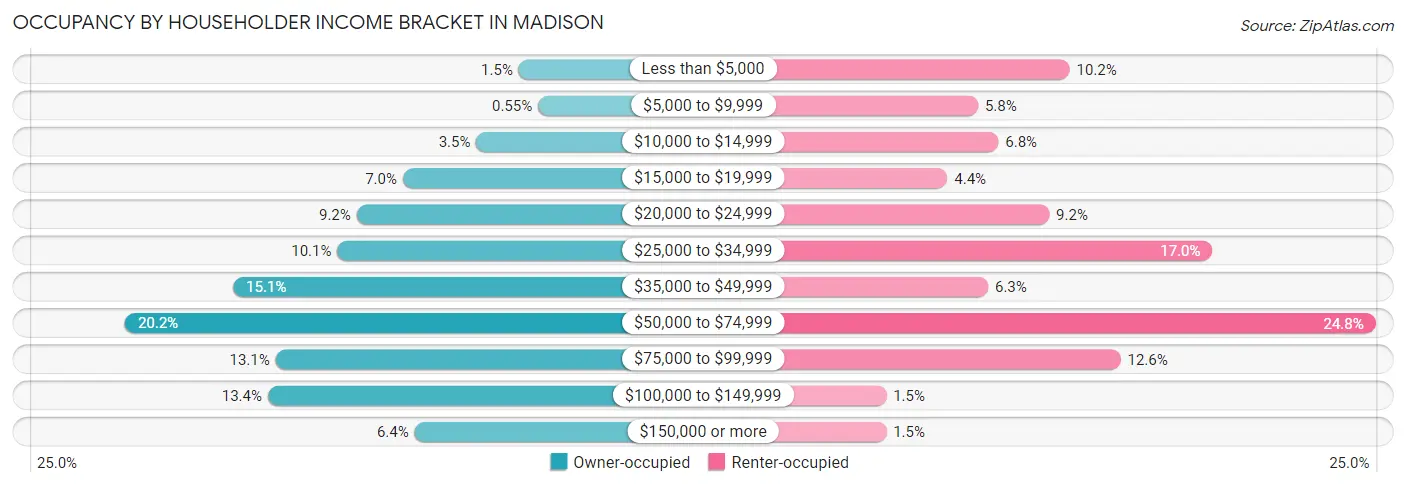
| Income Bracket | Owner-occupied | Renter-occupied |
| Less than $5,000 | 8 (1.5%) | 21 (10.2%) |
| $5,000 to $9,999 | 3 (0.5%) | 12 (5.8%) |
| $10,000 to $14,999 | 19 (3.5%) | 14 (6.8%) |
| $15,000 to $19,999 | 38 (7.0%) | 9 (4.4%) |
| $20,000 to $24,999 | 50 (9.2%) | 19 (9.2%) |
| $25,000 to $34,999 | 55 (10.1%) | 35 (17.0%) |
| $35,000 to $49,999 | 82 (15.1%) | 13 (6.3%) |
| $50,000 to $74,999 | 110 (20.2%) | 51 (24.8%) |
| $75,000 to $99,999 | 71 (13.1%) | 26 (12.6%) |
| $100,000 to $149,999 | 73 (13.4%) | 3 (1.5%) |
| $150,000 or more | 35 (6.4%) | 3 (1.5%) |
| Total | 544 (100.0%) | 206 (100.0%) |
Monthly Housing Cost Tiers in Madison
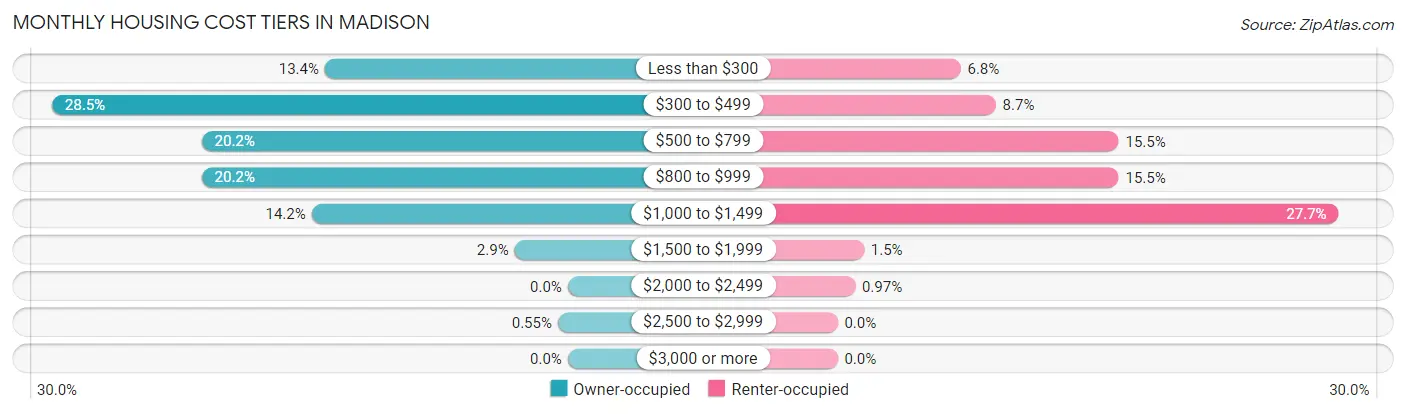
| Monthly Cost | Owner-occupied | Renter-occupied |
| Less than $300 | 73 (13.4%) | 14 (6.8%) |
| $300 to $499 | 155 (28.5%) | 18 (8.7%) |
| $500 to $799 | 110 (20.2%) | 32 (15.5%) |
| $800 to $999 | 110 (20.2%) | 32 (15.5%) |
| $1,000 to $1,499 | 77 (14.1%) | 57 (27.7%) |
| $1,500 to $1,999 | 16 (2.9%) | 3 (1.5%) |
| $2,000 to $2,499 | 0 (0.0%) | 2 (1.0%) |
| $2,500 to $2,999 | 3 (0.5%) | 0 (0.0%) |
| $3,000 or more | 0 (0.0%) | 0 (0.0%) |
| Total | 544 (100.0%) | 206 (100.0%) |
Physical Housing Characteristics in Madison
Housing Structures in Madison
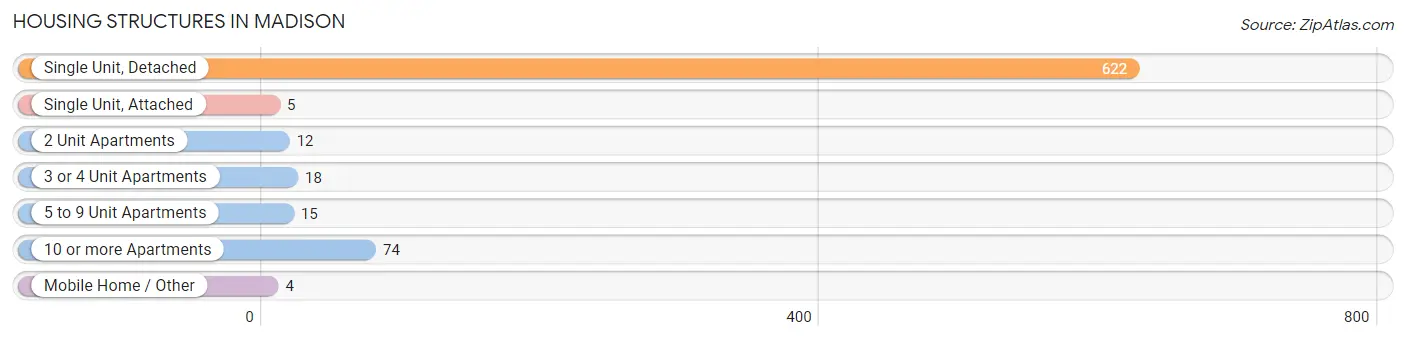
| Structure Type | # Housing Units | % Housing Units |
| Single Unit, Detached | 622 | 82.9% |
| Single Unit, Attached | 5 | 0.7% |
| 2 Unit Apartments | 12 | 1.6% |
| 3 or 4 Unit Apartments | 18 | 2.4% |
| 5 to 9 Unit Apartments | 15 | 2.0% |
| 10 or more Apartments | 74 | 9.9% |
| Mobile Home / Other | 4 | 0.5% |
| Total | 750 | 100.0% |
Housing Structures by Occupancy in Madison
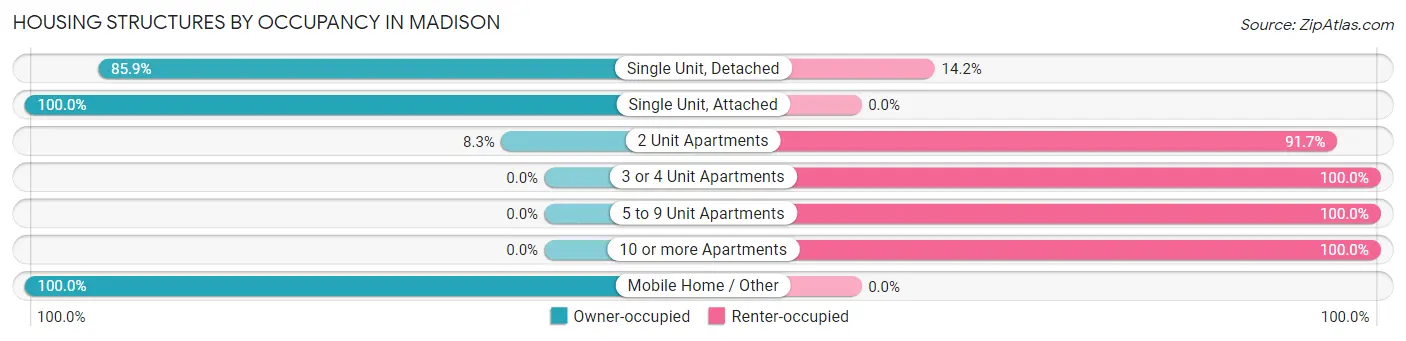
| Structure Type | Owner-occupied | Renter-occupied |
| Single Unit, Detached | 534 (85.9%) | 88 (14.1%) |
| Single Unit, Attached | 5 (100.0%) | 0 (0.0%) |
| 2 Unit Apartments | 1 (8.3%) | 11 (91.7%) |
| 3 or 4 Unit Apartments | 0 (0.0%) | 18 (100.0%) |
| 5 to 9 Unit Apartments | 0 (0.0%) | 15 (100.0%) |
| 10 or more Apartments | 0 (0.0%) | 74 (100.0%) |
| Mobile Home / Other | 4 (100.0%) | 0 (0.0%) |
| Total | 544 (72.5%) | 206 (27.5%) |
Housing Structures by Number of Rooms in Madison
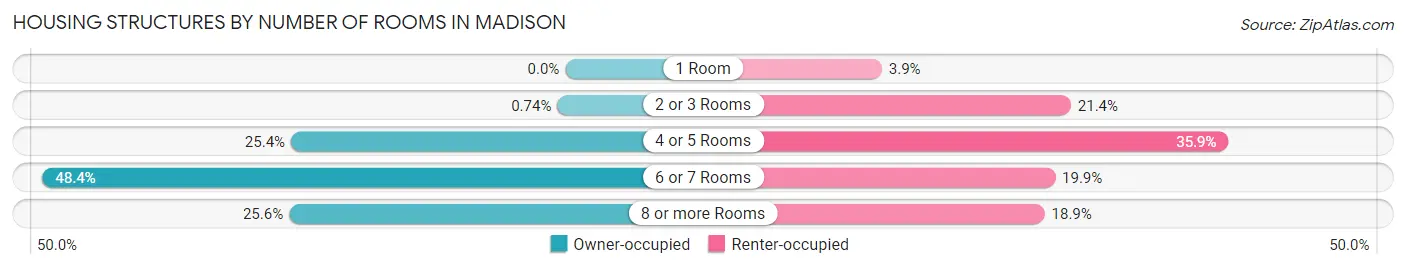
| Number of Rooms | Owner-occupied | Renter-occupied |
| 1 Room | 0 (0.0%) | 8 (3.9%) |
| 2 or 3 Rooms | 4 (0.7%) | 44 (21.4%) |
| 4 or 5 Rooms | 138 (25.4%) | 74 (35.9%) |
| 6 or 7 Rooms | 263 (48.3%) | 41 (19.9%) |
| 8 or more Rooms | 139 (25.6%) | 39 (18.9%) |
| Total | 544 (100.0%) | 206 (100.0%) |
Housing Structure by Heating Type in Madison
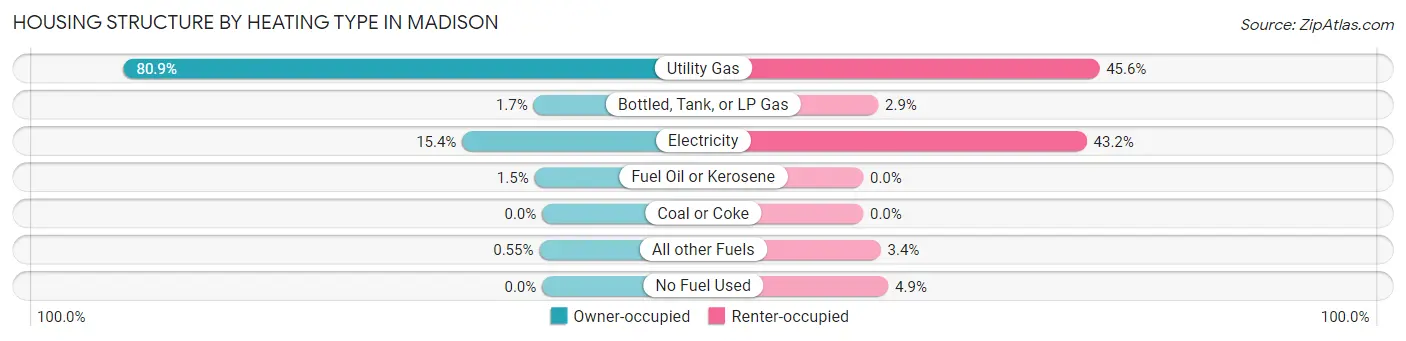
| Heating Type | Owner-occupied | Renter-occupied |
| Utility Gas | 440 (80.9%) | 94 (45.6%) |
| Bottled, Tank, or LP Gas | 9 (1.7%) | 6 (2.9%) |
| Electricity | 84 (15.4%) | 89 (43.2%) |
| Fuel Oil or Kerosene | 8 (1.5%) | 0 (0.0%) |
| Coal or Coke | 0 (0.0%) | 0 (0.0%) |
| All other Fuels | 3 (0.5%) | 7 (3.4%) |
| No Fuel Used | 0 (0.0%) | 10 (4.9%) |
| Total | 544 (100.0%) | 206 (100.0%) |
Household Vehicle Usage in Madison
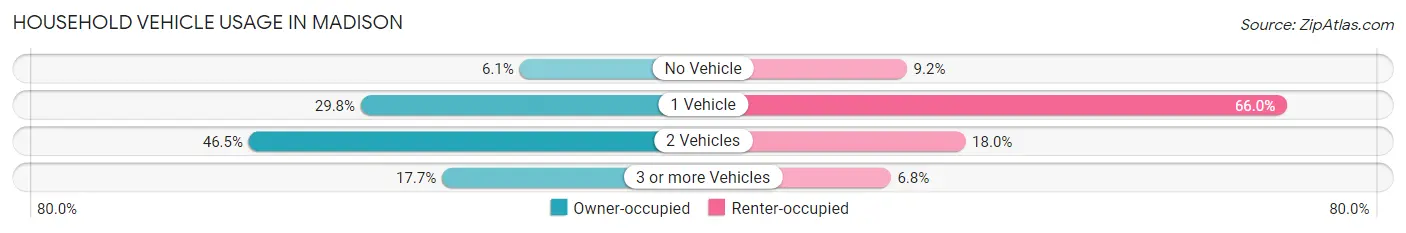
| Vehicles per Household | Owner-occupied | Renter-occupied |
| No Vehicle | 33 (6.1%) | 19 (9.2%) |
| 1 Vehicle | 162 (29.8%) | 136 (66.0%) |
| 2 Vehicles | 253 (46.5%) | 37 (18.0%) |
| 3 or more Vehicles | 96 (17.6%) | 14 (6.8%) |
| Total | 544 (100.0%) | 206 (100.0%) |
Real Estate & Mortgages in Madison
Real Estate and Mortgage Overview in Madison
| Characteristic | Without Mortgage | With Mortgage |
| Housing Units | 306 | 238 |
| Median Property Value | $93,300 | $86,500 |
| Median Household Income | $55,000 | $11 |
| Monthly Housing Costs | $416 | $0 |
| Real Estate Taxes | $1,084 | $0 |
Property Value by Mortgage Status in Madison
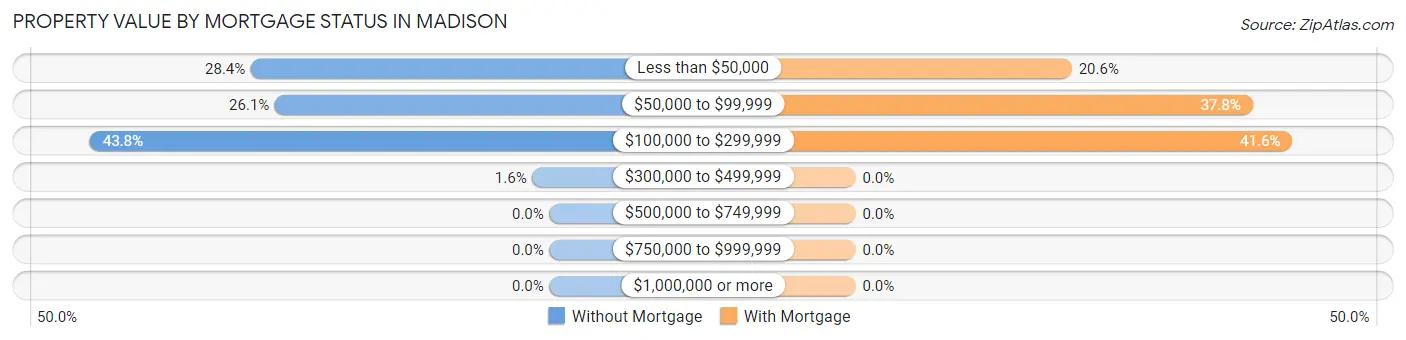
| Property Value | Without Mortgage | With Mortgage |
| Less than $50,000 | 87 (28.4%) | 49 (20.6%) |
| $50,000 to $99,999 | 80 (26.1%) | 90 (37.8%) |
| $100,000 to $299,999 | 134 (43.8%) | 99 (41.6%) |
| $300,000 to $499,999 | 5 (1.6%) | 0 (0.0%) |
| $500,000 to $749,999 | 0 (0.0%) | 0 (0.0%) |
| $750,000 to $999,999 | 0 (0.0%) | 0 (0.0%) |
| $1,000,000 or more | 0 (0.0%) | 0 (0.0%) |
| Total | 306 (100.0%) | 238 (100.0%) |
Household Income by Mortgage Status in Madison
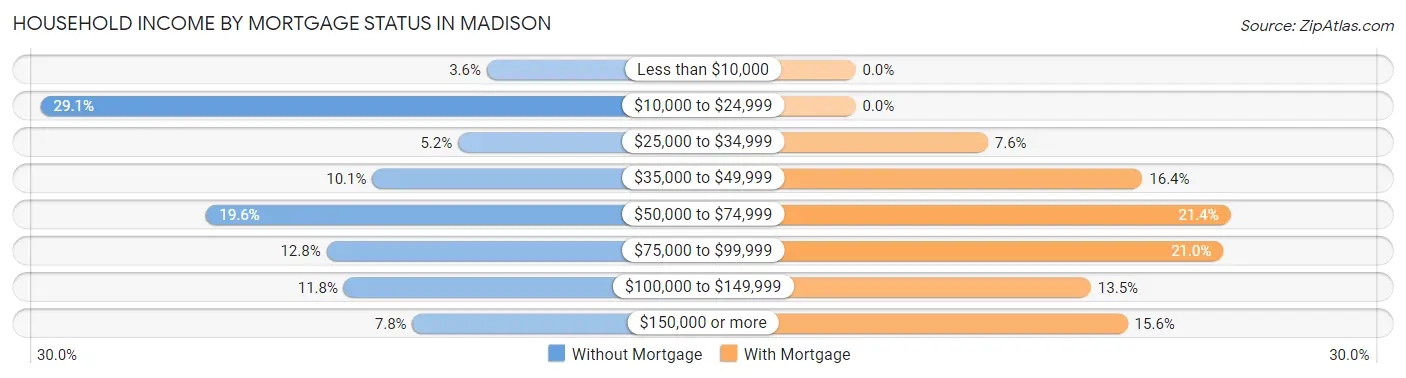
| Household Income | Without Mortgage | With Mortgage |
| Less than $10,000 | 11 (3.6%) | 0 (0.0%) |
| $10,000 to $24,999 | 89 (29.1%) | 0 (0.0%) |
| $25,000 to $34,999 | 16 (5.2%) | 18 (7.6%) |
| $35,000 to $49,999 | 31 (10.1%) | 39 (16.4%) |
| $50,000 to $74,999 | 60 (19.6%) | 51 (21.4%) |
| $75,000 to $99,999 | 39 (12.8%) | 50 (21.0%) |
| $100,000 to $149,999 | 36 (11.8%) | 32 (13.5%) |
| $150,000 or more | 24 (7.8%) | 37 (15.5%) |
| Total | 306 (100.0%) | 238 (100.0%) |
Property Value to Household Income Ratio in Madison
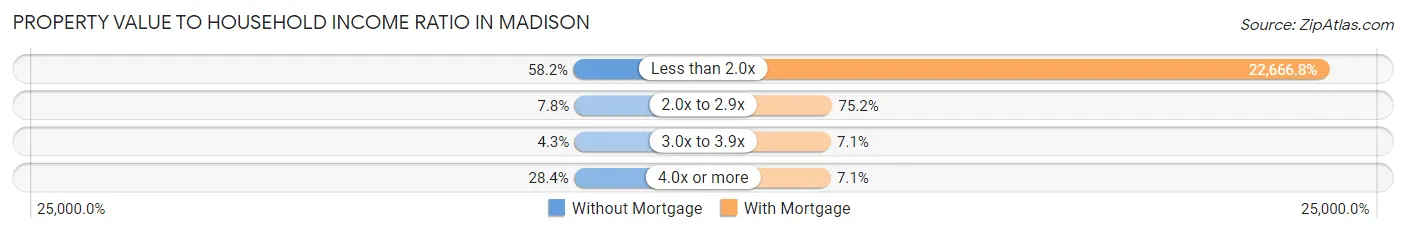
| Value-to-Income Ratio | Without Mortgage | With Mortgage |
| Less than 2.0x | 178 (58.2%) | 53,947 (22,666.8%) |
| 2.0x to 2.9x | 24 (7.8%) | 179 (75.2%) |
| 3.0x to 3.9x | 13 (4.3%) | 17 (7.1%) |
| 4.0x or more | 87 (28.4%) | 17 (7.1%) |
| Total | 306 (100.0%) | 238 (100.0%) |
Real Estate Taxes by Mortgage Status in Madison
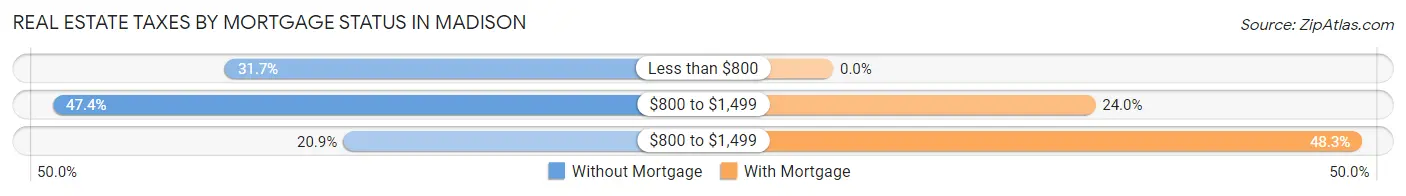
| Property Taxes | Without Mortgage | With Mortgage |
| Less than $800 | 97 (31.7%) | 0 (0.0%) |
| $800 to $1,499 | 145 (47.4%) | 57 (23.9%) |
| $800 to $1,499 | 64 (20.9%) | 115 (48.3%) |
| Total | 306 (100.0%) | 238 (100.0%) |
Health & Disability in Madison
Health Insurance Coverage by Age in Madison
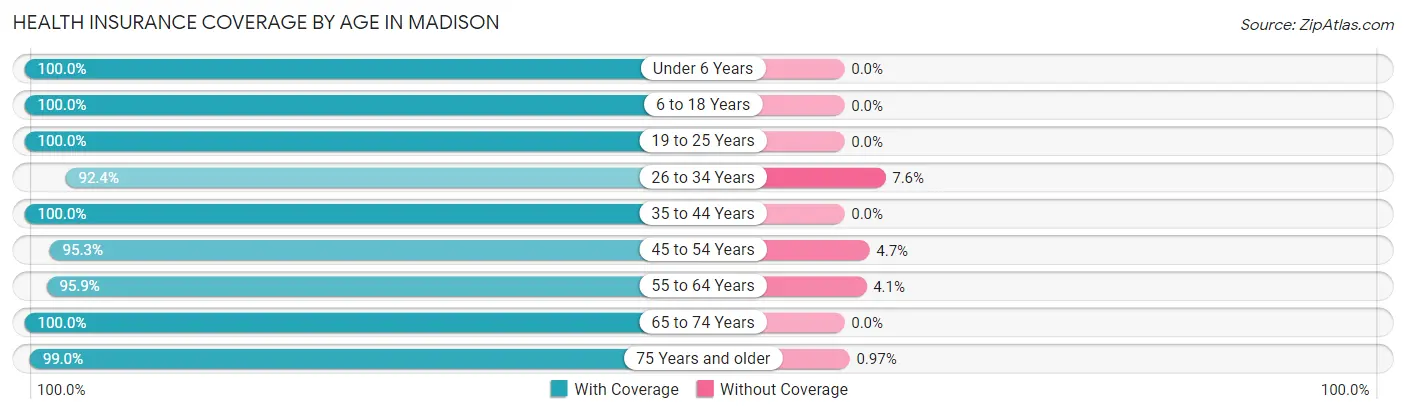
| Age Bracket | With Coverage | Without Coverage |
| Under 6 Years | 91 (100.0%) | 0 (0.0%) |
| 6 to 18 Years | 186 (100.0%) | 0 (0.0%) |
| 19 to 25 Years | 65 (100.0%) | 0 (0.0%) |
| 26 to 34 Years | 145 (92.4%) | 12 (7.6%) |
| 35 to 44 Years | 96 (100.0%) | 0 (0.0%) |
| 45 to 54 Years | 143 (95.3%) | 7 (4.7%) |
| 55 to 64 Years | 235 (95.9%) | 10 (4.1%) |
| 65 to 74 Years | 199 (100.0%) | 0 (0.0%) |
| 75 Years and older | 305 (99.0%) | 3 (1.0%) |
| Total | 1,465 (97.9%) | 32 (2.1%) |
Health Insurance Coverage by Citizenship Status in Madison
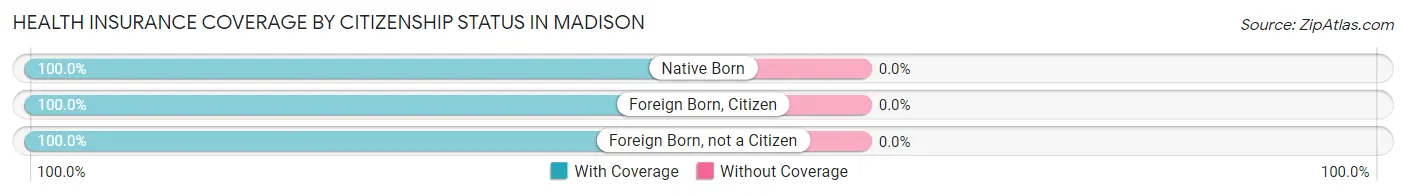
| Citizenship Status | With Coverage | Without Coverage |
| Native Born | 91 (100.0%) | 0 (0.0%) |
| Foreign Born, Citizen | 186 (100.0%) | 0 (0.0%) |
| Foreign Born, not a Citizen | 65 (100.0%) | 0 (0.0%) |
Health Insurance Coverage by Household Income in Madison
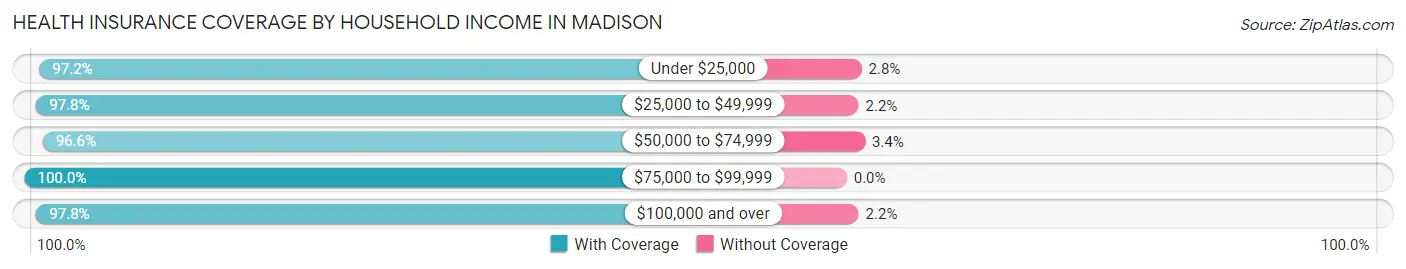
| Household Income | With Coverage | Without Coverage |
| Under $25,000 | 245 (97.2%) | 7 (2.8%) |
| $25,000 to $49,999 | 310 (97.8%) | 7 (2.2%) |
| $50,000 to $74,999 | 284 (96.6%) | 10 (3.4%) |
| $75,000 to $99,999 | 269 (100.0%) | 0 (0.0%) |
| $100,000 and over | 353 (97.8%) | 8 (2.2%) |
Public vs Private Health Insurance Coverage by Age in Madison
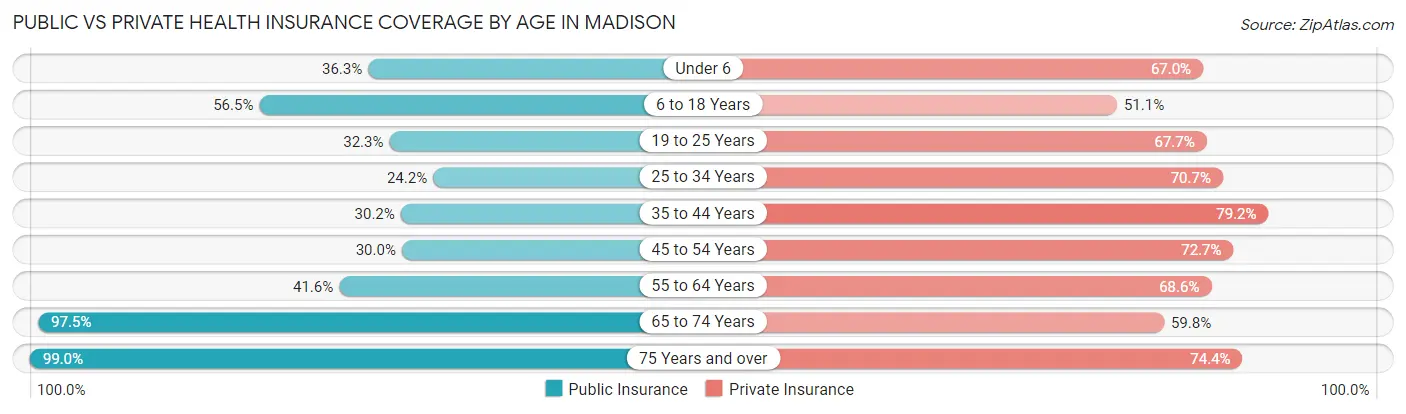
| Age Bracket | Public Insurance | Private Insurance |
| Under 6 | 33 (36.3%) | 61 (67.0%) |
| 6 to 18 Years | 105 (56.5%) | 95 (51.1%) |
| 19 to 25 Years | 21 (32.3%) | 44 (67.7%) |
| 25 to 34 Years | 38 (24.2%) | 111 (70.7%) |
| 35 to 44 Years | 29 (30.2%) | 76 (79.2%) |
| 45 to 54 Years | 45 (30.0%) | 109 (72.7%) |
| 55 to 64 Years | 102 (41.6%) | 168 (68.6%) |
| 65 to 74 Years | 194 (97.5%) | 119 (59.8%) |
| 75 Years and over | 305 (99.0%) | 229 (74.4%) |
| Total | 872 (58.3%) | 1,012 (67.6%) |
Disability Status by Sex by Age in Madison
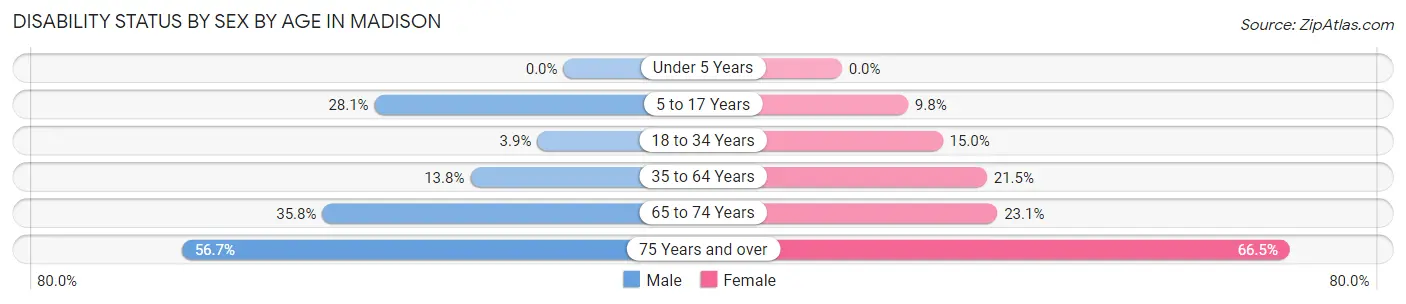
| Age Bracket | Male | Female |
| Under 5 Years | 0 (0.0%) | 0 (0.0%) |
| 5 to 17 Years | 23 (28.1%) | 11 (9.8%) |
| 18 to 34 Years | 4 (3.9%) | 19 (15.0%) |
| 35 to 64 Years | 39 (13.8%) | 45 (21.5%) |
| 65 to 74 Years | 34 (35.8%) | 24 (23.1%) |
| 75 Years and over | 51 (56.7%) | 145 (66.5%) |
Disability Class by Sex by Age in Madison
Disability Class: Hearing Difficulty
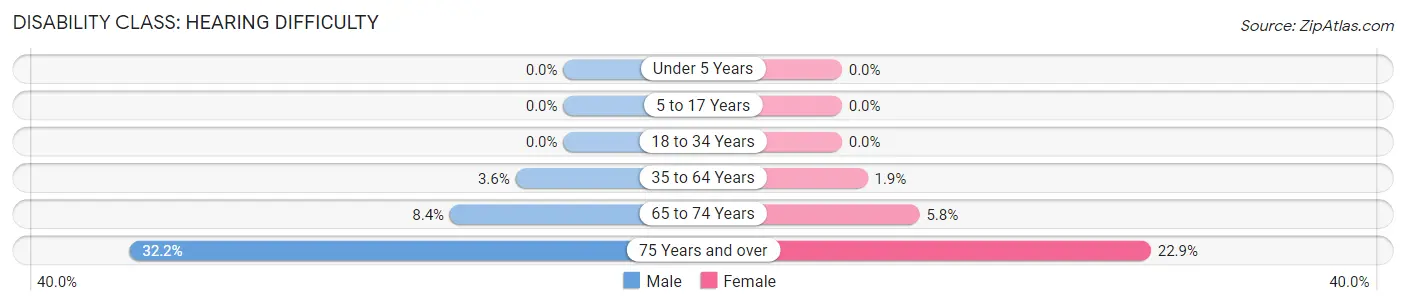
| Age Bracket | Male | Female |
| Under 5 Years | 0 (0.0%) | 0 (0.0%) |
| 5 to 17 Years | 0 (0.0%) | 0 (0.0%) |
| 18 to 34 Years | 0 (0.0%) | 0 (0.0%) |
| 35 to 64 Years | 10 (3.5%) | 4 (1.9%) |
| 65 to 74 Years | 8 (8.4%) | 6 (5.8%) |
| 75 Years and over | 29 (32.2%) | 50 (22.9%) |
Disability Class: Vision Difficulty
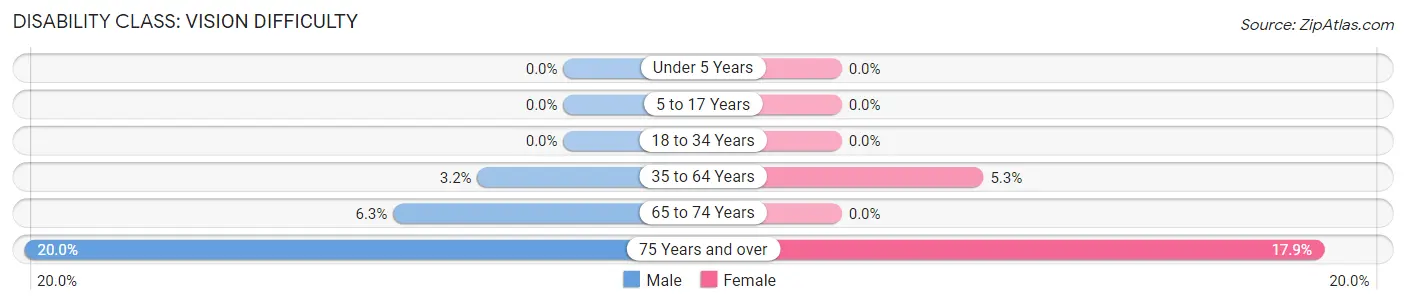
| Age Bracket | Male | Female |
| Under 5 Years | 0 (0.0%) | 0 (0.0%) |
| 5 to 17 Years | 0 (0.0%) | 0 (0.0%) |
| 18 to 34 Years | 0 (0.0%) | 0 (0.0%) |
| 35 to 64 Years | 9 (3.2%) | 11 (5.3%) |
| 65 to 74 Years | 6 (6.3%) | 0 (0.0%) |
| 75 Years and over | 18 (20.0%) | 39 (17.9%) |
Disability Class: Cognitive Difficulty
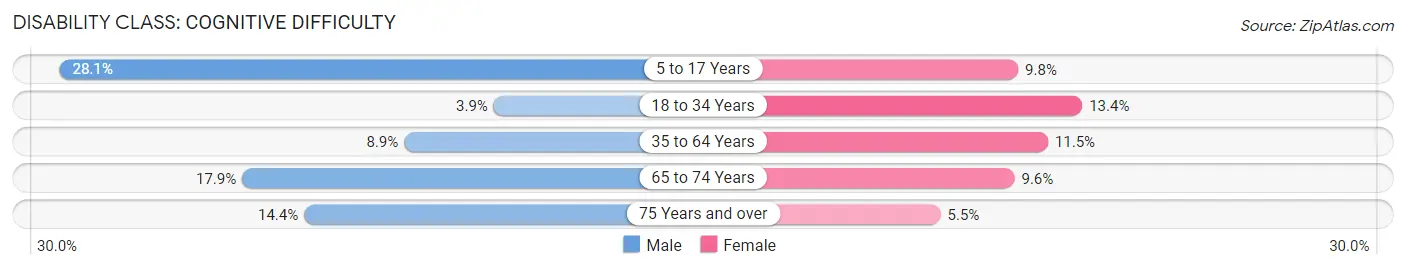
| Age Bracket | Male | Female |
| 5 to 17 Years | 23 (28.1%) | 11 (9.8%) |
| 18 to 34 Years | 4 (3.9%) | 17 (13.4%) |
| 35 to 64 Years | 25 (8.9%) | 24 (11.5%) |
| 65 to 74 Years | 17 (17.9%) | 10 (9.6%) |
| 75 Years and over | 13 (14.4%) | 12 (5.5%) |
Disability Class: Ambulatory Difficulty
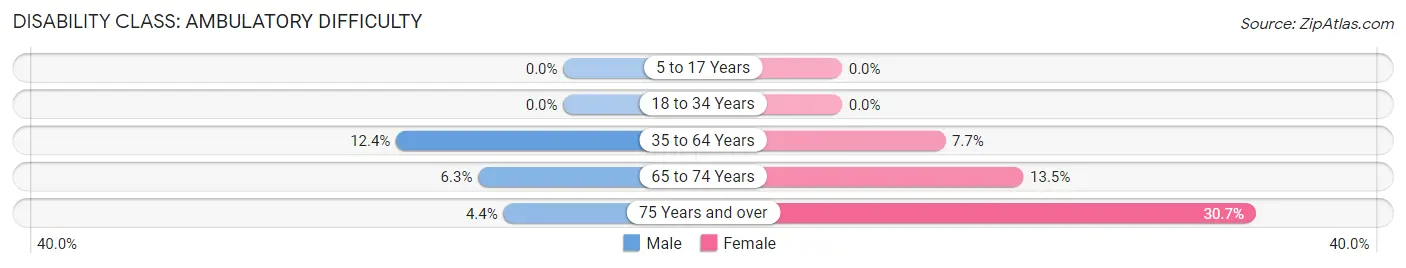
| Age Bracket | Male | Female |
| 5 to 17 Years | 0 (0.0%) | 0 (0.0%) |
| 18 to 34 Years | 0 (0.0%) | 0 (0.0%) |
| 35 to 64 Years | 35 (12.4%) | 16 (7.7%) |
| 65 to 74 Years | 6 (6.3%) | 14 (13.5%) |
| 75 Years and over | 4 (4.4%) | 67 (30.7%) |
Disability Class: Self-Care Difficulty
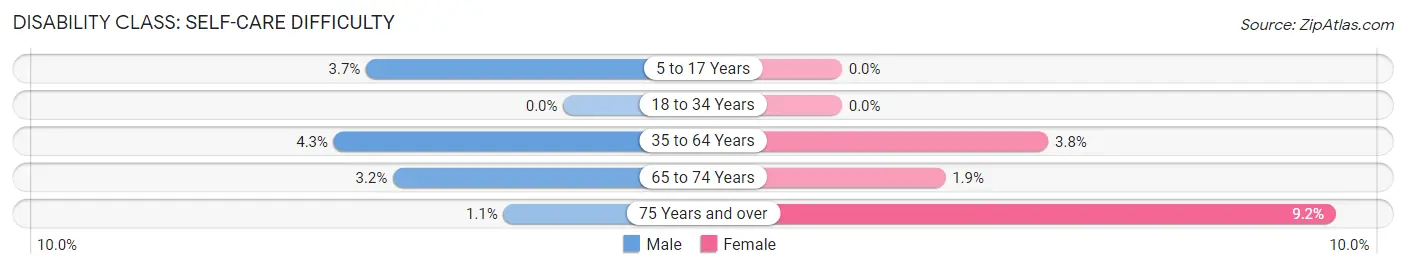
| Age Bracket | Male | Female |
| 5 to 17 Years | 3 (3.7%) | 0 (0.0%) |
| 18 to 34 Years | 0 (0.0%) | 0 (0.0%) |
| 35 to 64 Years | 12 (4.3%) | 8 (3.8%) |
| 65 to 74 Years | 3 (3.2%) | 2 (1.9%) |
| 75 Years and over | 1 (1.1%) | 20 (9.2%) |
Technology Access in Madison
Computing Device Access in Madison
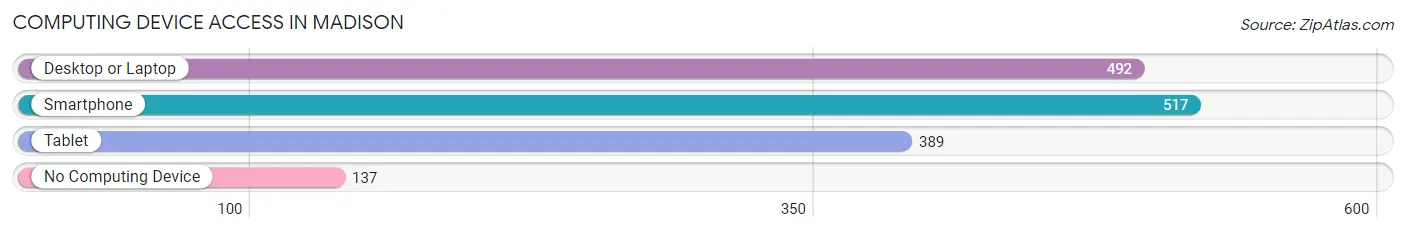
| Device Type | # Households | % Households |
| Desktop or Laptop | 492 | 65.6% |
| Smartphone | 517 | 68.9% |
| Tablet | 389 | 51.9% |
| No Computing Device | 137 | 18.3% |
| Total | 750 | 100.0% |
Internet Access in Madison
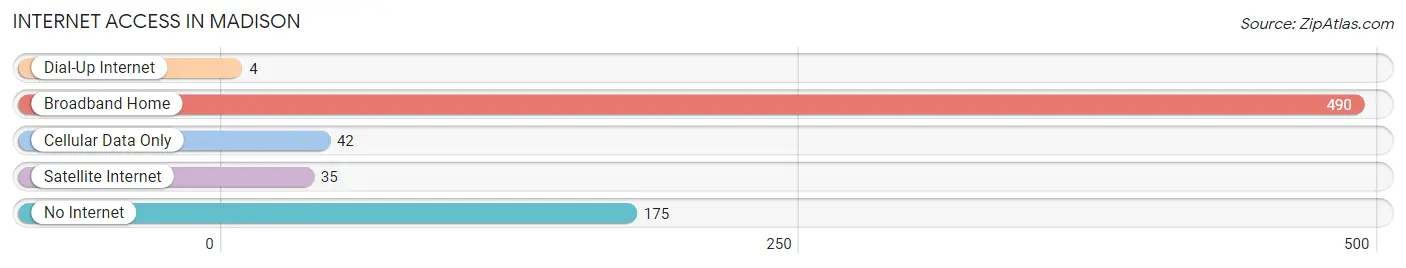
| Internet Type | # Households | % Households |
| Dial-Up Internet | 4 | 0.5% |
| Broadband Home | 490 | 65.3% |
| Cellular Data Only | 42 | 5.6% |
| Satellite Internet | 35 | 4.7% |
| No Internet | 175 | 23.3% |
| Total | 750 | 100.0% |
Madison Summary
Madison, Minnesota is a small city located in the southwestern corner of the state, just north of the Iowa border. It is part of the Mankato-North Mankato metropolitan area and is home to a population of approximately 2,500 people. The city is known for its strong agricultural roots, its vibrant downtown, and its friendly, welcoming atmosphere.
Geography
Madison is located in the southwestern corner of Minnesota, just north of the Iowa border. It is situated in the Minnesota River Valley, which is part of the larger Minnesota River Basin. The city is surrounded by rolling hills and is located near the confluence of the Minnesota and Blue Earth Rivers. The city is located at an elevation of 1,072 feet above sea level.
The city is located in Blue Earth County and is part of the Mankato-North Mankato metropolitan area. It is approximately 90 miles southwest of Minneapolis and St. Paul.
History
Madison was founded in 1856 by settlers from Wisconsin. The city was named after James Madison, the fourth President of the United States. The city was originally a farming community and was known for its production of wheat, oats, and corn.
In the late 19th century, the city began to grow and develop. The first railroad line was built in 1872, connecting Madison to Mankato. This allowed for the transportation of goods and people, and helped to spur the city’s growth.
In the early 20th century, Madison began to diversify its economy. The city became a center for manufacturing, with several factories opening in the area. The city also became a center for education, with the opening of the Madison Normal School in 1910.
Economy
Madison’s economy is largely based on agriculture and manufacturing. The city is home to several large farms, which produce a variety of crops, including corn, soybeans, and wheat. The city is also home to several manufacturing companies, which produce a variety of products, including furniture, plastics, and automotive parts.
The city is also home to several small businesses, including restaurants, retail stores, and service providers. The city is also home to several educational institutions, including the Madison Normal School and the University of Minnesota-Mankato.
Demographics
As of the 2010 census, Madison had a population of 2,500 people. The racial makeup of the city was 95.2% White, 0.8% African American, 0.4% Native American, 0.4% Asian, 0.2% Pacific Islander, and 2.8% from two or more races. The median household income was $45,000, and the median family income was $50,000.
Conclusion
Madison, Minnesota is a small city located in the southwestern corner of the state, just north of the Iowa border. It is part of the Mankato-North Mankato metropolitan area and is home to a population of approximately 2,500 people. The city is known for its strong agricultural roots, its vibrant downtown, and its friendly, welcoming atmosphere. The city’s economy is largely based on agriculture and manufacturing, and it is home to several small businesses, educational institutions, and manufacturing companies. The city’s population is largely white, with a small percentage of African American, Native American, Asian, and Pacific Islander residents.
Common Questions
What is Per Capita Income in Madison?
Per Capita income in Madison is $30,755.
What is the Median Family Income in Madison?
Median Family Income in Madison is $65,000.
What is the Median Household income in Madison?
Median Household Income in Madison is $49,063.
What is Income or Wage Gap in Madison?
Income or Wage Gap in Madison is 62.3%.
Women in Madison earn 37.7 cents for every dollar earned by a man.
What is Inequality or Gini Index in Madison?
Inequality or Gini Index in Madison is 0.42.
What is the Total Population of Madison?
Total Population of Madison is 1,566.
What is the Total Male Population of Madison?
Total Male Population of Madison is 730.
What is the Total Female Population of Madison?
Total Female Population of Madison is 836.
What is the Ratio of Males per 100 Females in Madison?
There are 87.32 Males per 100 Females in Madison.
What is the Ratio of Females per 100 Males in Madison?
There are 114.52 Females per 100 Males in Madison.
What is the Median Population Age in Madison?
Median Population Age in Madison is 56.5 Years.
What is the Average Family Size in Madison
Average Family Size in Madison is 2.6 People.
What is the Average Household Size in Madison
Average Household Size in Madison is 2.0 People.
How Large is the Labor Force in Madison?
There are 662 People in the Labor Forcein in Madison.
What is the Percentage of People in the Labor Force in Madison?
50.0% of People are in the Labor Force in Madison.
What is the Unemployment Rate in Madison?
Unemployment Rate in Madison is 0.6%.