Rogers, MN Map & Demographics
Rogers Map
Rogers Overview
$54,080
PER CAPITA INCOME
$164,009
AVG FAMILY INCOME
$154,611
AVG HOUSEHOLD INCOME
29.7%
WAGE / INCOME GAP [ % ]
70.3¢/ $1
WAGE / INCOME GAP [ $ ]
0.36
INEQUALITY / GINI INDEX
13,283
TOTAL POPULATION
6,710
MALE POPULATION
6,573
FEMALE POPULATION
102.08
MALES / 100 FEMALES
97.96
FEMALES / 100 MALES
37.2
MEDIAN AGE
3.3
AVG FAMILY SIZE
3.0
AVG HOUSEHOLD SIZE
7,006
LABOR FORCE [ PEOPLE ]
72.8%
PERCENT IN LABOR FORCE
1.3%
UNEMPLOYMENT RATE
Rogers Zip Codes
Rogers Area Codes
Income in Rogers
Income Overview in Rogers
Per Capita Income in Rogers is $54,080, while median incomes of families and households are $164,009 and $154,611 respectively.
| Characteristic | Number | Measure |
| Per Capita Income | 13,283 | $54,080 |
| Median Family Income | 3,636 | $164,009 |
| Mean Family Income | 3,636 | $176,402 |
| Median Household Income | 4,406 | $154,611 |
| Mean Household Income | 4,406 | $161,567 |
| Income Deficit | 3,636 | $0 |
| Wage / Income Gap (%) | 13,283 | 29.74% |
| Wage / Income Gap ($) | 13,283 | 70.26¢ per $1 |
| Gini / Inequality Index | 13,283 | 0.36 |
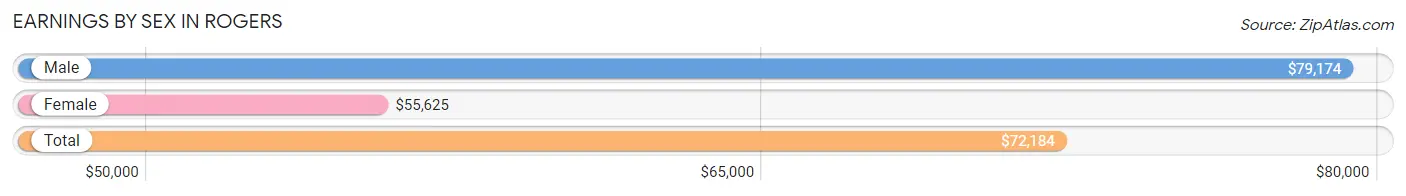
Earnings by Sex in Rogers
Average Earnings in Rogers are $72,184, $79,174 for men and $55,625 for women, a difference of 29.7%.
| Sex | Number | Average Earnings |
| Male | 3,899 (52.1%) | $79,174 |
| Female | 3,589 (47.9%) | $55,625 |
| Total | 7,488 (100.0%) | $72,184 |
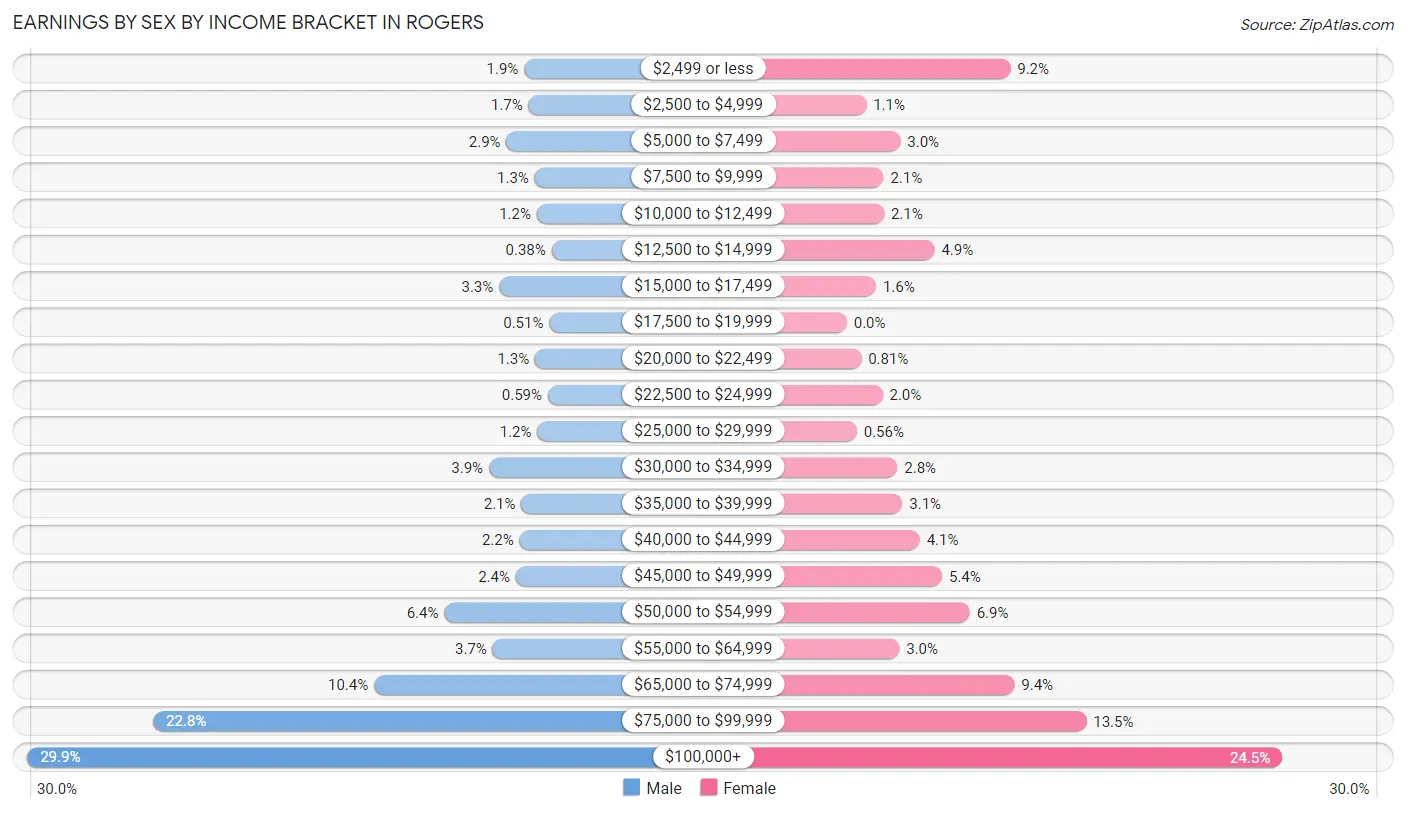
Earnings by Sex by Income Bracket in Rogers
The most common earnings brackets in Rogers are $100,000+ for men (1,164 | 29.8%) and $100,000+ for women (878 | 24.5%).
| Income | Male | Female |
| $2,499 or less | 75 (1.9%) | 330 (9.2%) |
| $2,500 to $4,999 | 65 (1.7%) | 39 (1.1%) |
| $5,000 to $7,499 | 114 (2.9%) | 108 (3.0%) |
| $7,500 to $9,999 | 52 (1.3%) | 74 (2.1%) |
| $10,000 to $12,499 | 47 (1.2%) | 75 (2.1%) |
| $12,500 to $14,999 | 15 (0.4%) | 177 (4.9%) |
| $15,000 to $17,499 | 130 (3.3%) | 59 (1.6%) |
| $17,500 to $19,999 | 20 (0.5%) | 0 (0.0%) |
| $20,000 to $22,499 | 51 (1.3%) | 29 (0.8%) |
| $22,500 to $24,999 | 23 (0.6%) | 72 (2.0%) |
| $25,000 to $29,999 | 46 (1.2%) | 20 (0.6%) |
| $30,000 to $34,999 | 152 (3.9%) | 102 (2.8%) |
| $35,000 to $39,999 | 81 (2.1%) | 112 (3.1%) |
| $40,000 to $44,999 | 85 (2.2%) | 147 (4.1%) |
| $45,000 to $49,999 | 93 (2.4%) | 192 (5.3%) |
| $50,000 to $54,999 | 250 (6.4%) | 248 (6.9%) |
| $55,000 to $64,999 | 144 (3.7%) | 106 (2.9%) |
| $65,000 to $74,999 | 404 (10.4%) | 338 (9.4%) |
| $75,000 to $99,999 | 888 (22.8%) | 483 (13.5%) |
| $100,000+ | 1,164 (29.8%) | 878 (24.5%) |
| Total | 3,899 (100.0%) | 3,589 (100.0%) |
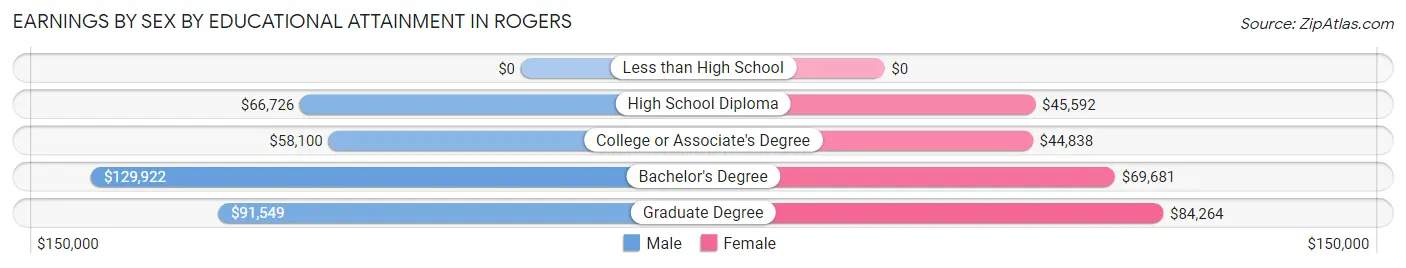
Earnings by Sex by Educational Attainment in Rogers
Average earnings in Rogers are $86,356 for men and $72,632 for women, a difference of 15.9%. Men with an educational attainment of bachelor's degree enjoy the highest average annual earnings of $129,922, while those with college or associate's degree education earn the least with $58,100. Women with an educational attainment of graduate degree earn the most with the average annual earnings of $84,264, while those with college or associate's degree education have the smallest earnings of $44,838.
| Educational Attainment | Male Income | Female Income |
| Less than High School | - | - |
| High School Diploma | $66,726 | $45,592 |
| College or Associate's Degree | $58,100 | $44,838 |
| Bachelor's Degree | $129,922 | $69,681 |
| Graduate Degree | $91,549 | $84,264 |
| Total | $86,356 | $72,632 |
Family Income in Rogers
Family Income Brackets in Rogers
According to the Rogers family income data, there are 1,044 families falling into the $200,000+ income range, which is the most common income bracket and makes up 28.7% of all families.
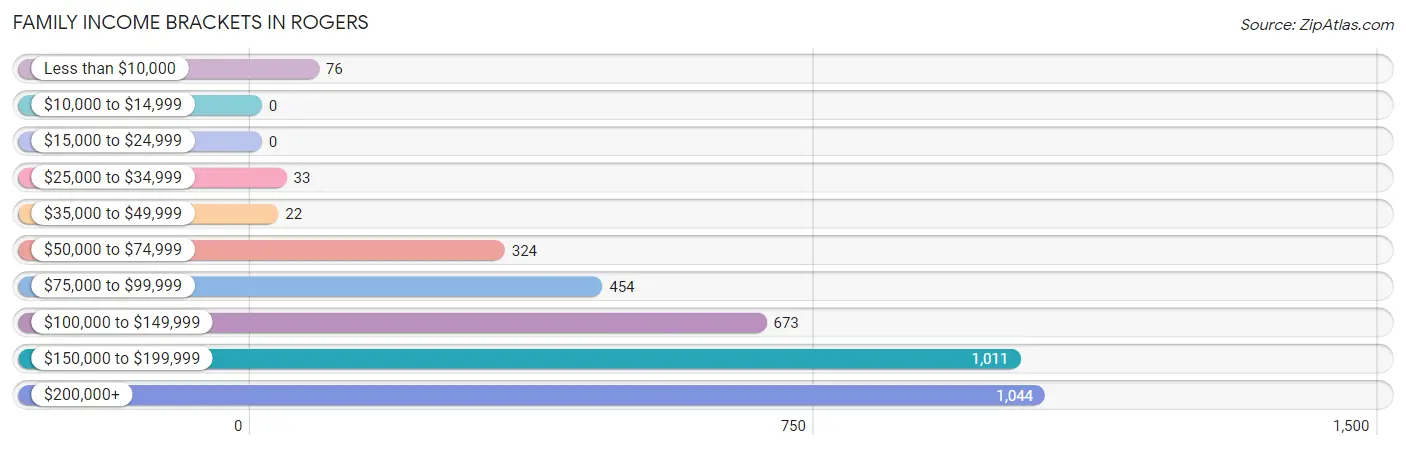
| Income Bracket | # Families | % Families |
| Less than $10,000 | 76 | 2.1% |
| $10,000 to $14,999 | 0 | 0.0% |
| $15,000 to $24,999 | 0 | 0.0% |
| $25,000 to $34,999 | 33 | 0.9% |
| $35,000 to $49,999 | 22 | 0.6% |
| $50,000 to $74,999 | 324 | 8.9% |
| $75,000 to $99,999 | 454 | 12.5% |
| $100,000 to $149,999 | 673 | 18.5% |
| $150,000 to $199,999 | 1,011 | 27.8% |
| $200,000+ | 1,044 | 28.7% |
Family Income by Famaliy Size in Rogers
5-person families (449 | 12.3%) account for the highest median family income in Rogers with $205,486 per family, while 4-person families (1,062 | 29.2%) have the highest median income of $47,287 per family member.
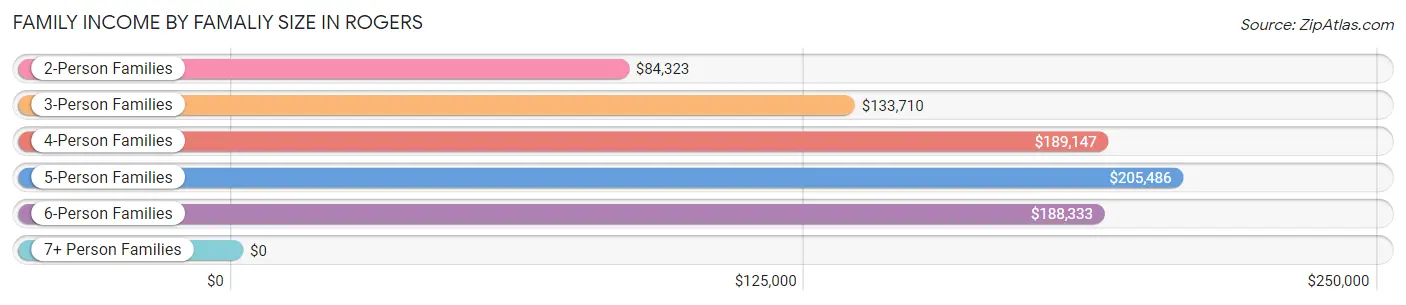
| Income Bracket | # Families | Median Income |
| 2-Person Families | 1,105 (30.4%) | $84,323 |
| 3-Person Families | 894 (24.6%) | $133,710 |
| 4-Person Families | 1,062 (29.2%) | $189,147 |
| 5-Person Families | 449 (12.3%) | $205,486 |
| 6-Person Families | 126 (3.5%) | $188,333 |
| 7+ Person Families | 0 (0.0%) | $0 |
| Total | 3,636 (100.0%) | $164,009 |
Family Income by Number of Earners in Rogers
The median family income in Rogers is $164,009, with families comprising 3+ earners (493) having the highest median family income of $217,574, while families with no earners (351) have the lowest median family income of $64,880, accounting for 13.6% and 9.7% of families, respectively.
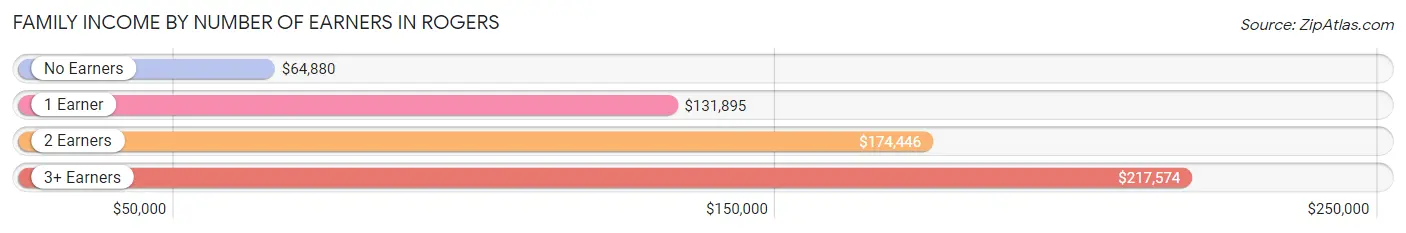
| Number of Earners | # Families | Median Income |
| No Earners | 351 (9.7%) | $64,880 |
| 1 Earner | 679 (18.7%) | $131,895 |
| 2 Earners | 2,113 (58.1%) | $174,446 |
| 3+ Earners | 493 (13.6%) | $217,574 |
| Total | 3,636 (100.0%) | $164,009 |
Household Income in Rogers
Household Income Brackets in Rogers
With 1,190 households falling in the category, the $200,000+ income range is the most frequent in Rogers, accounting for 27.0% of all households. In contrast, only 13 households (0.3%) fall into the $10,000 to $14,999 income bracket, making it the least populous group.
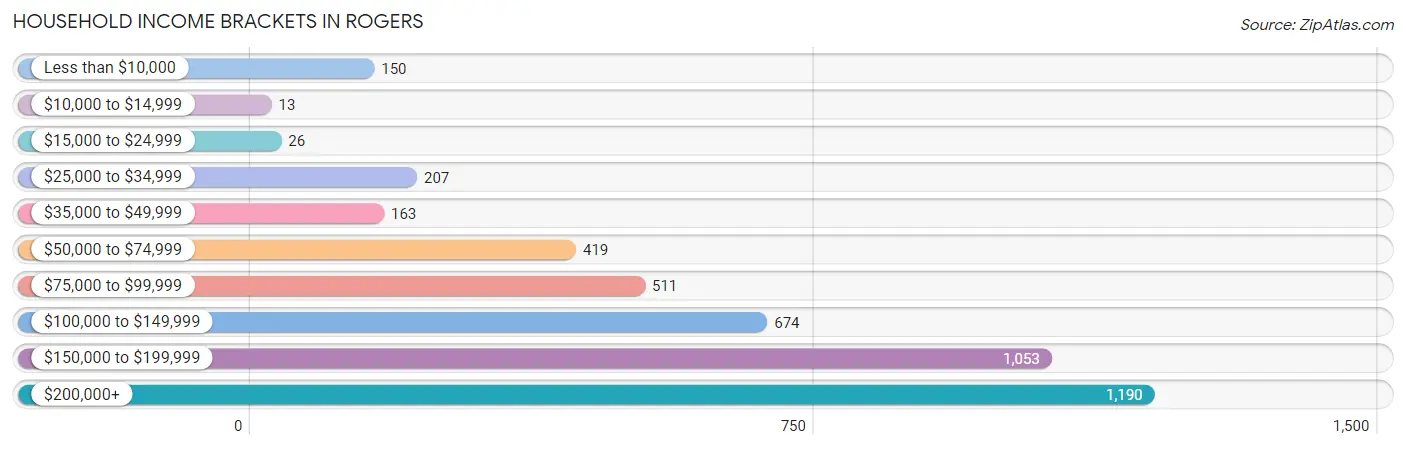
| Income Bracket | # Households | % Households |
| Less than $10,000 | 150 | 3.4% |
| $10,000 to $14,999 | 13 | 0.3% |
| $15,000 to $24,999 | 26 | 0.6% |
| $25,000 to $34,999 | 207 | 4.7% |
| $35,000 to $49,999 | 163 | 3.7% |
| $50,000 to $74,999 | 419 | 9.5% |
| $75,000 to $99,999 | 511 | 11.6% |
| $100,000 to $149,999 | 674 | 15.3% |
| $150,000 to $199,999 | 1,053 | 23.9% |
| $200,000+ | 1,190 | 27.0% |
Household Income by Householder Age in Rogers
The median household income in Rogers is $154,611, with the highest median household income of $187,721 found in the 25 to 44 years age bracket for the primary householder. A total of 1,417 households (32.2%) fall into this category. Meanwhile, the 15 to 24 years age bracket for the primary householder has the lowest median household income of $0, with 113 households (2.6%) in this group.
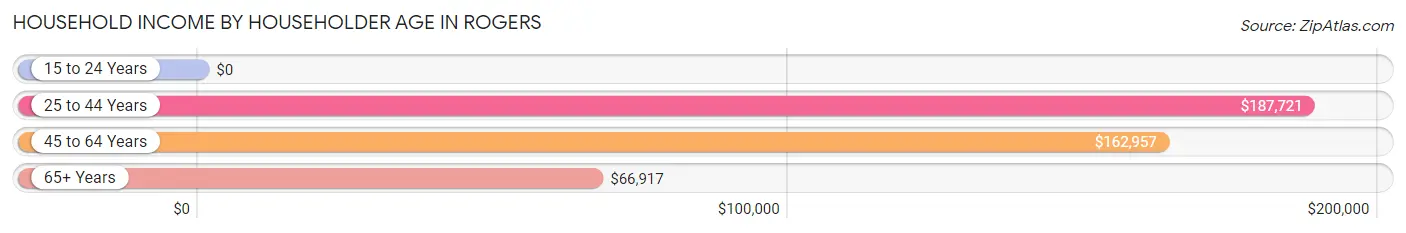
| Income Bracket | # Households | Median Income |
| 15 to 24 Years | 113 (2.6%) | $0 |
| 25 to 44 Years | 1,417 (32.2%) | $187,721 |
| 45 to 64 Years | 2,136 (48.5%) | $162,957 |
| 65+ Years | 740 (16.8%) | $66,917 |
| Total | 4,406 (100.0%) | $154,611 |
Poverty in Rogers
Income Below Poverty by Sex and Age in Rogers
With 2.4% poverty level for males and 2.9% for females among the residents of Rogers, 12 to 14 year old males and 18 to 24 year old females are the most vulnerable to poverty, with 36 males (16.0%) and 28 females (8.3%) in their respective age groups living below the poverty level.
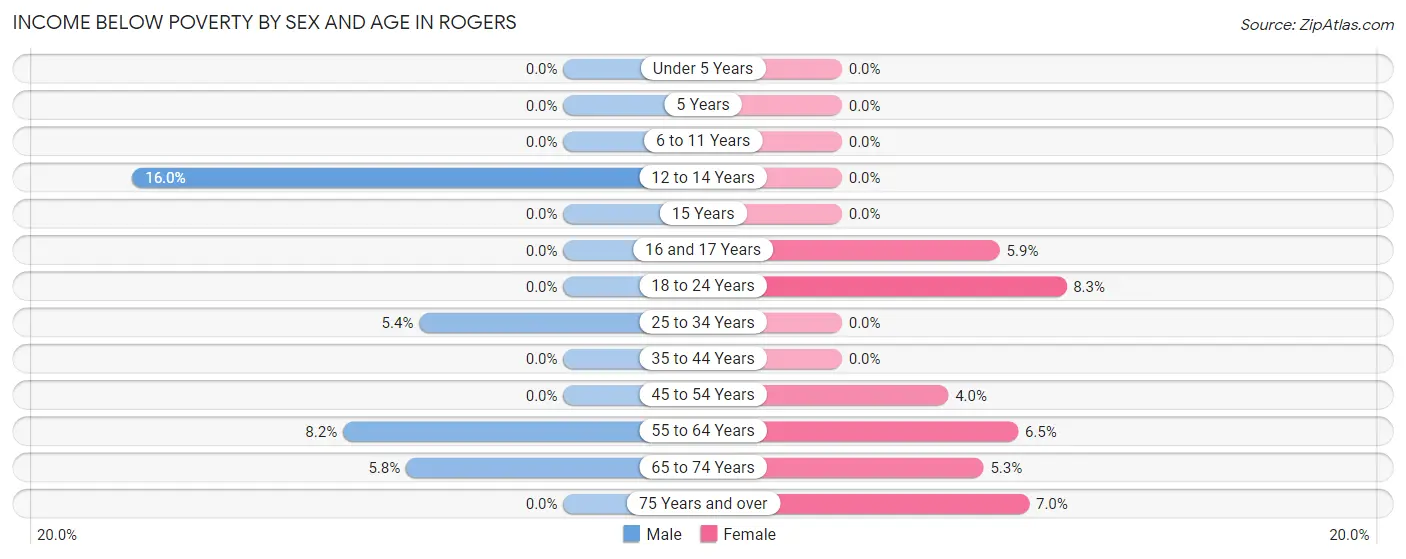
| Age Bracket | Male | Female |
| Under 5 Years | 0 (0.0%) | 0 (0.0%) |
| 5 Years | 0 (0.0%) | 0 (0.0%) |
| 6 to 11 Years | 0 (0.0%) | 0 (0.0%) |
| 12 to 14 Years | 36 (16.0%) | 0 (0.0%) |
| 15 Years | 0 (0.0%) | 0 (0.0%) |
| 16 and 17 Years | 0 (0.0%) | 15 (5.9%) |
| 18 to 24 Years | 0 (0.0%) | 28 (8.3%) |
| 25 to 34 Years | 33 (5.3%) | 0 (0.0%) |
| 35 to 44 Years | 0 (0.0%) | 0 (0.0%) |
| 45 to 54 Years | 0 (0.0%) | 49 (4.0%) |
| 55 to 64 Years | 73 (8.2%) | 56 (6.5%) |
| 65 to 74 Years | 15 (5.8%) | 15 (5.3%) |
| 75 Years and over | 0 (0.0%) | 26 (7.0%) |
| Total | 157 (2.4%) | 189 (2.9%) |
Income Above Poverty by Sex and Age in Rogers
According to the poverty statistics in Rogers, males aged under 5 years and females aged under 5 years are the age groups that are most secure financially, with 100.0% of males and 100.0% of females in these age groups living above the poverty line.
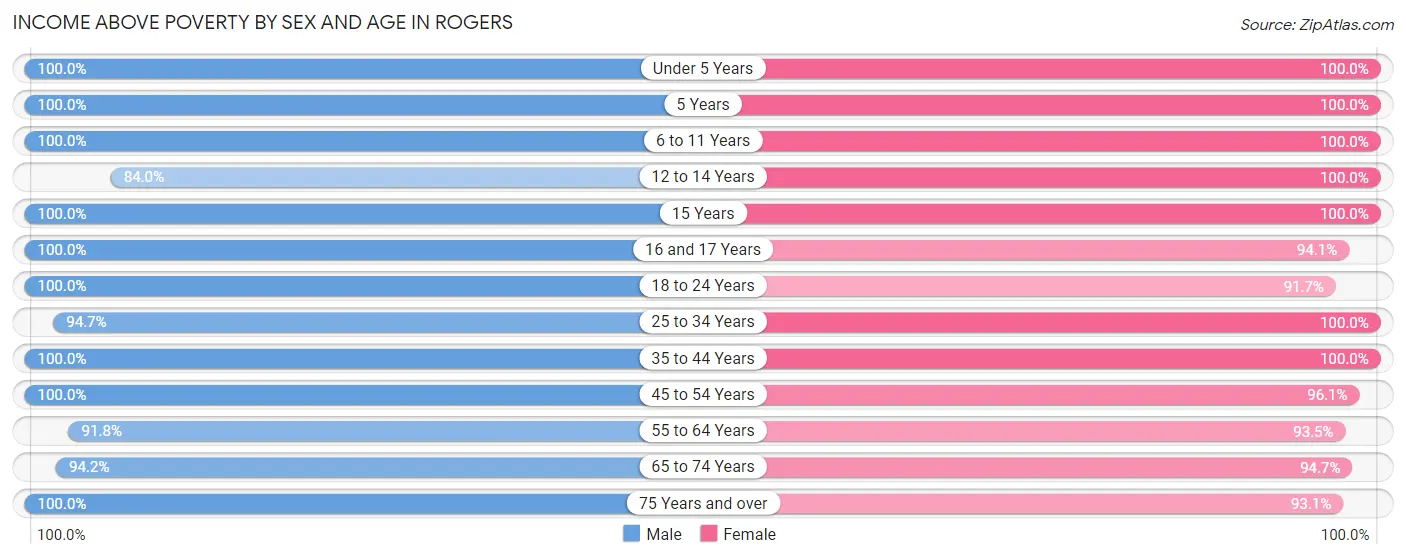
| Age Bracket | Male | Female |
| Under 5 Years | 541 (100.0%) | 702 (100.0%) |
| 5 Years | 156 (100.0%) | 192 (100.0%) |
| 6 to 11 Years | 893 (100.0%) | 420 (100.0%) |
| 12 to 14 Years | 189 (84.0%) | 324 (100.0%) |
| 15 Years | 51 (100.0%) | 156 (100.0%) |
| 16 and 17 Years | 290 (100.0%) | 241 (94.1%) |
| 18 to 24 Years | 432 (100.0%) | 308 (91.7%) |
| 25 to 34 Years | 584 (94.7%) | 422 (100.0%) |
| 35 to 44 Years | 694 (100.0%) | 954 (100.0%) |
| 45 to 54 Years | 1,325 (100.0%) | 1,191 (96.1%) |
| 55 to 64 Years | 819 (91.8%) | 800 (93.5%) |
| 65 to 74 Years | 242 (94.2%) | 270 (94.7%) |
| 75 Years and over | 301 (100.0%) | 348 (93.0%) |
| Total | 6,517 (97.7%) | 6,328 (97.1%) |
Income Below Poverty Among Married-Couple Families in Rogers
The poverty statistics for married-couple families in Rogers show that 1.3% or 42 of the total 3,246 families live below the poverty line. Families with no children have the highest poverty rate of 3.2%, comprising of 42 families. On the other hand, families with 1 or 2 children have the lowest poverty rate of 0.0%, which includes 0 families.
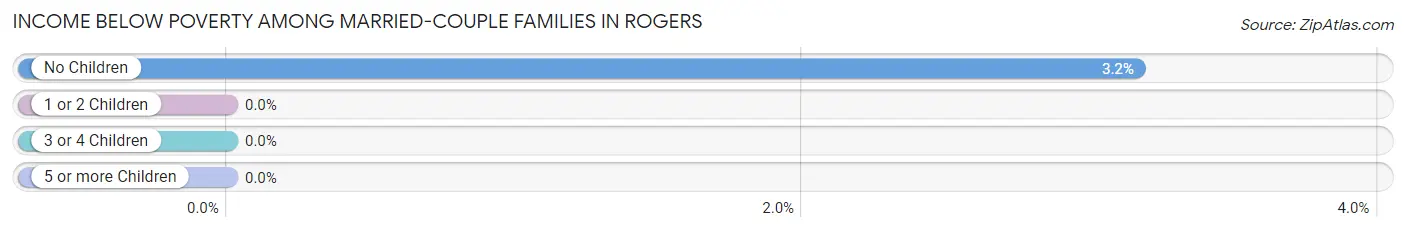
| Children | Above Poverty | Below Poverty |
| No Children | 1,287 (96.8%) | 42 (3.2%) |
| 1 or 2 Children | 1,401 (100.0%) | 0 (0.0%) |
| 3 or 4 Children | 516 (100.0%) | 0 (0.0%) |
| 5 or more Children | 0 (0.0%) | 0 (0.0%) |
| Total | 3,204 (98.7%) | 42 (1.3%) |
Income Below Poverty Among Single-Parent Households in Rogers
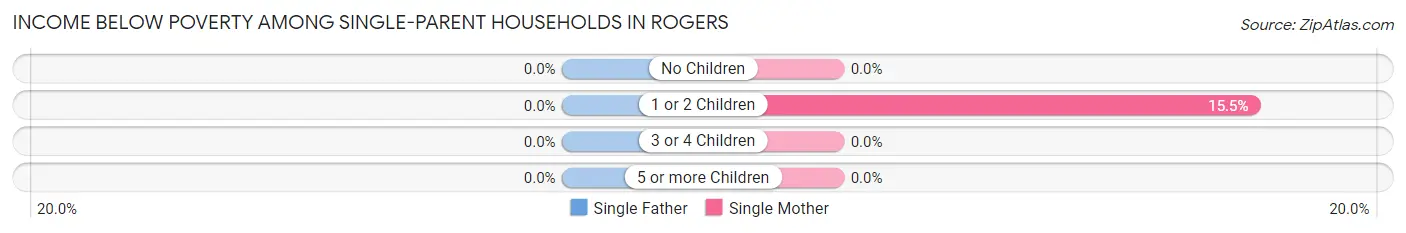
| Children | Single Father | Single Mother |
| No Children | 0 (0.0%) | 0 (0.0%) |
| 1 or 2 Children | 0 (0.0%) | 36 (15.5%) |
| 3 or 4 Children | 0 (0.0%) | 0 (0.0%) |
| 5 or more Children | 0 (0.0%) | 0 (0.0%) |
| Total | 0 (0.0%) | 36 (12.6%) |
Income Below Poverty Among Married-Couple vs Single-Parent Households in Rogers
The poverty data for Rogers shows that 42 of the married-couple family households (1.3%) and 36 of the single-parent households (9.2%) are living below the poverty level. Within the married-couple family households, those with no children have the highest poverty rate, with 42 households (3.2%) falling below the poverty line. Among the single-parent households, those with 1 or 2 children have the highest poverty rate, with 36 household (11.5%) living below poverty.
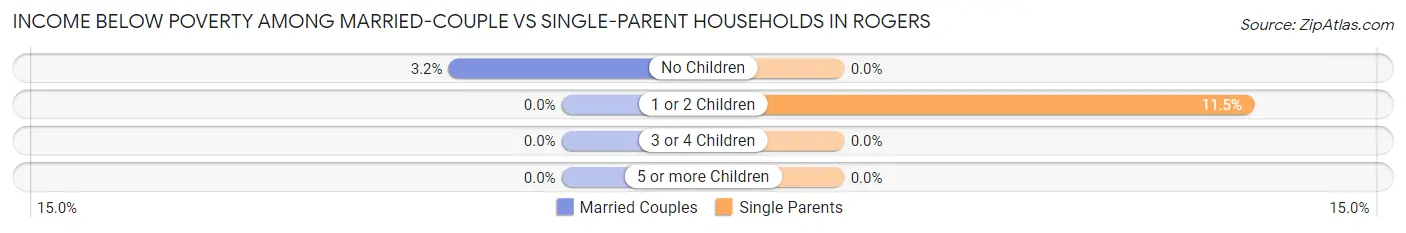
| Children | Married-Couple Families | Single-Parent Households |
| No Children | 42 (3.2%) | 0 (0.0%) |
| 1 or 2 Children | 0 (0.0%) | 36 (11.5%) |
| 3 or 4 Children | 0 (0.0%) | 0 (0.0%) |
| 5 or more Children | 0 (0.0%) | 0 (0.0%) |
| Total | 42 (1.3%) | 36 (9.2%) |
Race in Rogers
The most populous races in Rogers are White / Caucasian (12,455 | 93.8%), Two or more Races (470 | 3.5%), and Black / African American (151 | 1.1%).
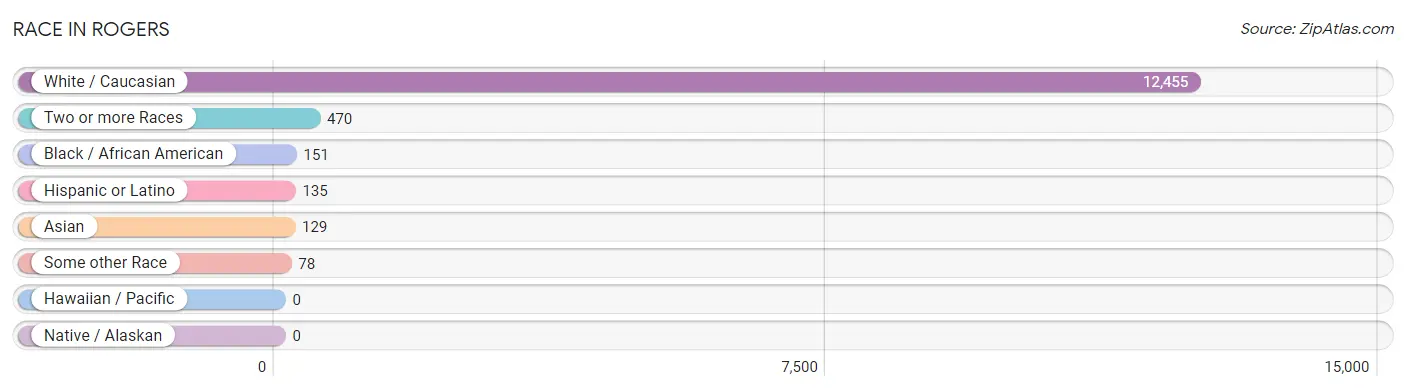
| Race | # Population | % Population |
| Asian | 129 | 1.0% |
| Black / African American | 151 | 1.1% |
| Hawaiian / Pacific | 0 | 0.0% |
| Hispanic or Latino | 135 | 1.0% |
| Native / Alaskan | 0 | 0.0% |
| White / Caucasian | 12,455 | 93.8% |
| Two or more Races | 470 | 3.5% |
| Some other Race | 78 | 0.6% |
| Total | 13,283 | 100.0% |
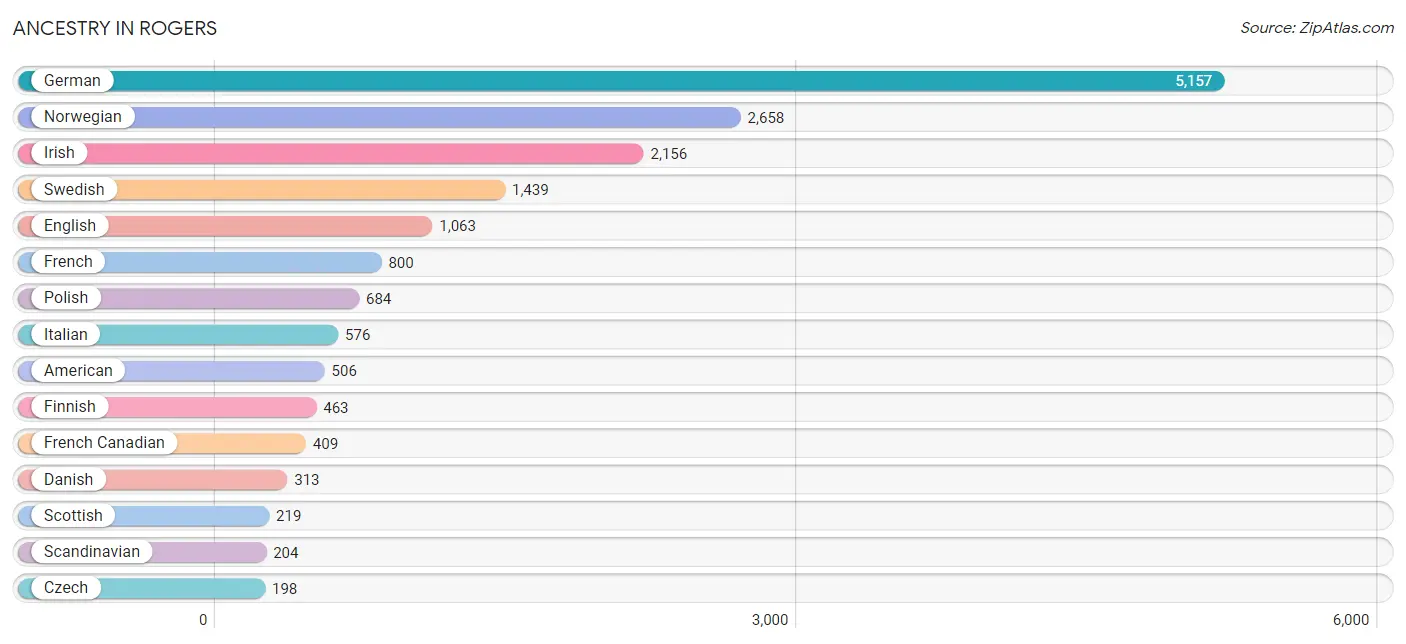
Ancestry in Rogers
The most populous ancestries reported in Rogers are German (5,157 | 38.8%), Norwegian (2,658 | 20.0%), Irish (2,156 | 16.2%), Swedish (1,439 | 10.8%), and English (1,063 | 8.0%), together accounting for 93.9% of all Rogers residents.
| Ancestry | # Population | % Population |
| African | 16 | 0.1% |
| American | 506 | 3.8% |
| Bhutanese | 111 | 0.8% |
| British | 141 | 1.1% |
| Burmese | 190 | 1.4% |
| Canadian | 59 | 0.4% |
| Central American | 30 | 0.2% |
| Central American Indian | 30 | 0.2% |
| Chippewa | 19 | 0.1% |
| Czech | 198 | 1.5% |
| Czechoslovakian | 7 | 0.1% |
| Danish | 313 | 2.4% |
| Dutch | 112 | 0.8% |
| Eastern European | 36 | 0.3% |
| English | 1,063 | 8.0% |
| European | 72 | 0.5% |
| Finnish | 463 | 3.5% |
| French | 800 | 6.0% |
| French Canadian | 409 | 3.1% |
| German | 5,157 | 38.8% |
| Guamanian / Chamorro | 26 | 0.2% |
| Guatemalan | 30 | 0.2% |
| Indian (Asian) | 124 | 0.9% |
| Irish | 2,156 | 16.2% |
| Italian | 576 | 4.3% |
| Kenyan | 54 | 0.4% |
| Lithuanian | 29 | 0.2% |
| Mexican | 65 | 0.5% |
| Northern European | 27 | 0.2% |
| Norwegian | 2,658 | 20.0% |
| Polish | 684 | 5.1% |
| Romanian | 23 | 0.2% |
| Russian | 115 | 0.9% |
| Scandinavian | 204 | 1.5% |
| Scotch-Irish | 49 | 0.4% |
| Scottish | 219 | 1.7% |
| Sioux | 34 | 0.3% |
| Slovak | 28 | 0.2% |
| Slovene | 15 | 0.1% |
| Subsaharan African | 70 | 0.5% |
| Swedish | 1,439 | 10.8% |
| Ukrainian | 35 | 0.3% |
| Welsh | 73 | 0.5% | View All 43 Rows |
Immigrants in Rogers
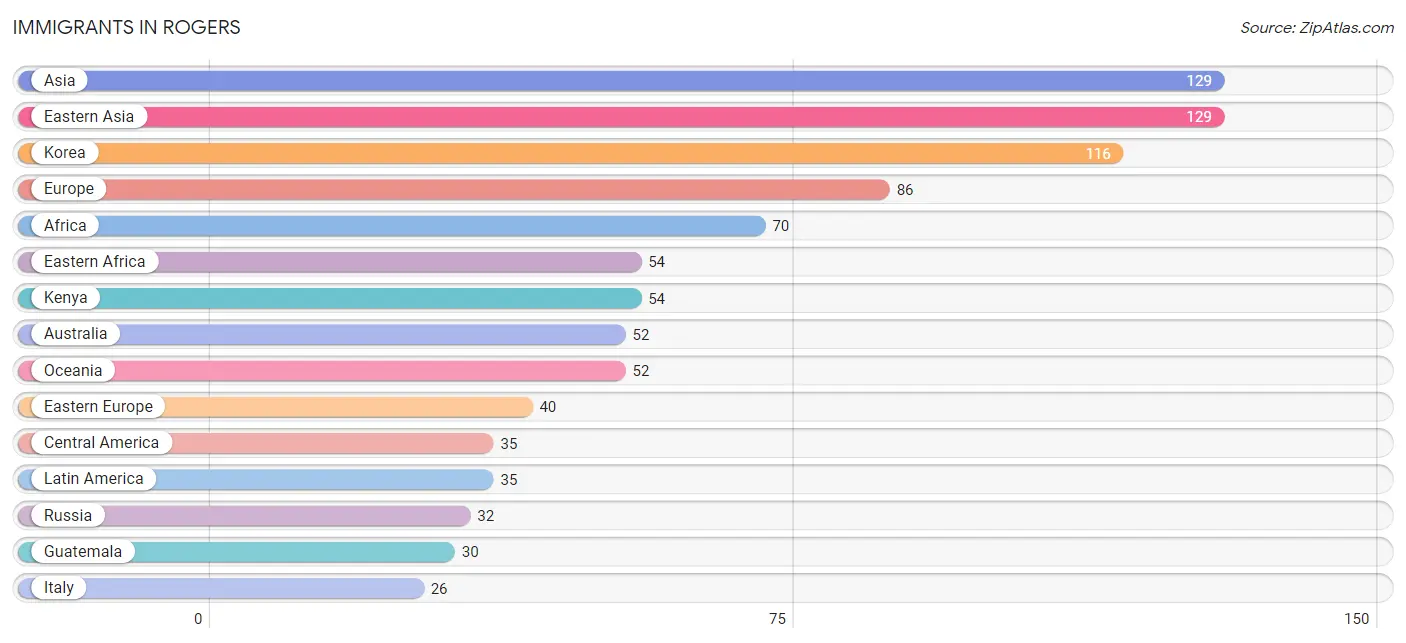
The most numerous immigrant groups reported in Rogers came from Asia (129 | 1.0%), Eastern Asia (129 | 1.0%), Korea (116 | 0.9%), Europe (86 | 0.6%), and Africa (70 | 0.5%), together accounting for 4.0% of all Rogers residents.
| Immigration Origin | # Population | % Population |
| Africa | 70 | 0.5% |
| Asia | 129 | 1.0% |
| Australia | 52 | 0.4% |
| Canada | 15 | 0.1% |
| Central America | 35 | 0.3% |
| Eastern Africa | 54 | 0.4% |
| Eastern Asia | 129 | 1.0% |
| Eastern Europe | 40 | 0.3% |
| Europe | 86 | 0.6% |
| Germany | 20 | 0.2% |
| Guatemala | 30 | 0.2% |
| Italy | 26 | 0.2% |
| Japan | 13 | 0.1% |
| Kenya | 54 | 0.4% |
| Korea | 116 | 0.9% |
| Latin America | 35 | 0.3% |
| Liberia | 16 | 0.1% |
| Mexico | 5 | 0.0% |
| Oceania | 52 | 0.4% |
| Romania | 8 | 0.1% |
| Russia | 32 | 0.2% |
| Southern Europe | 26 | 0.2% |
| Western Africa | 16 | 0.1% |
| Western Europe | 20 | 0.2% | View All 24 Rows |
Sex and Age in Rogers
Sex and Age in Rogers
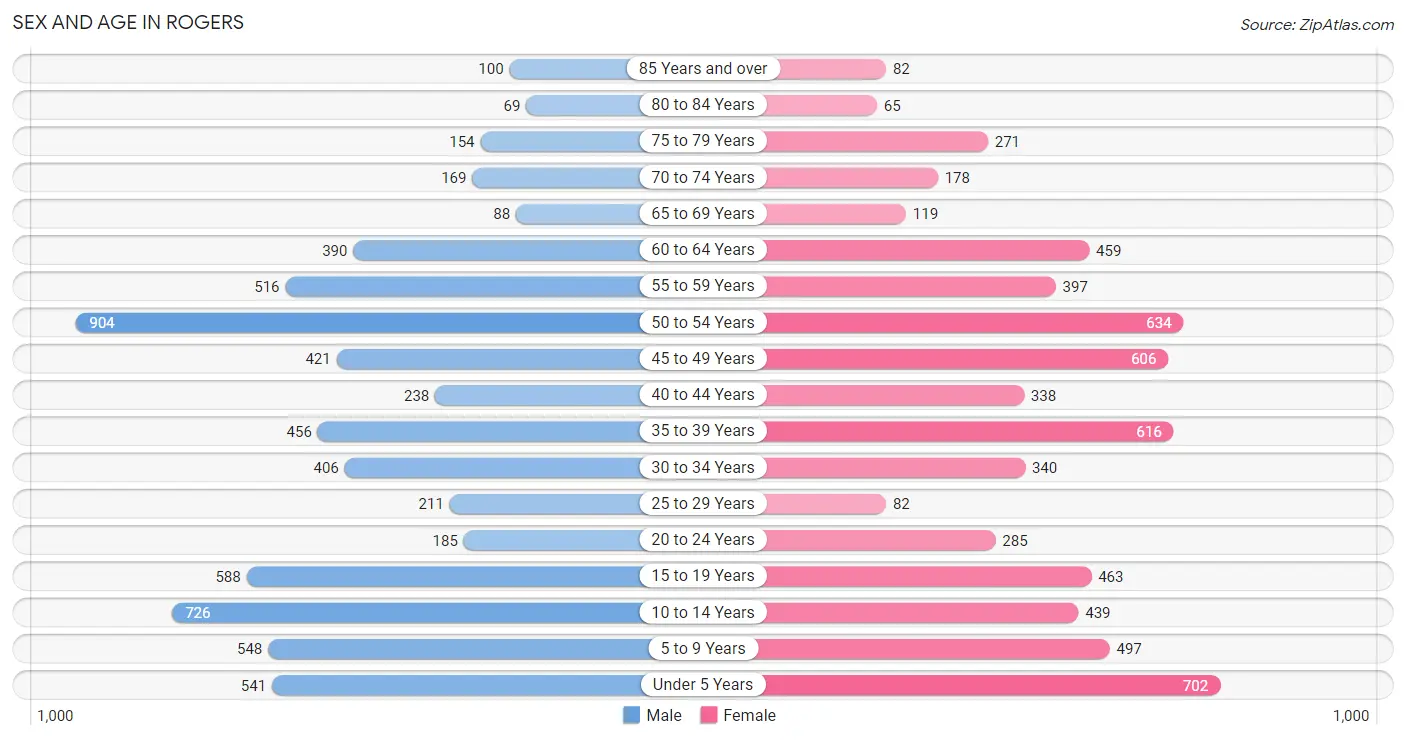
The most populous age groups in Rogers are 50 to 54 Years (904 | 13.5%) for men and Under 5 Years (702 | 10.7%) for women.
| Age Bracket | Male | Female |
| Under 5 Years | 541 (8.1%) | 702 (10.7%) |
| 5 to 9 Years | 548 (8.2%) | 497 (7.6%) |
| 10 to 14 Years | 726 (10.8%) | 439 (6.7%) |
| 15 to 19 Years | 588 (8.8%) | 463 (7.0%) |
| 20 to 24 Years | 185 (2.8%) | 285 (4.3%) |
| 25 to 29 Years | 211 (3.1%) | 82 (1.3%) |
| 30 to 34 Years | 406 (6.0%) | 340 (5.2%) |
| 35 to 39 Years | 456 (6.8%) | 616 (9.4%) |
| 40 to 44 Years | 238 (3.5%) | 338 (5.1%) |
| 45 to 49 Years | 421 (6.3%) | 606 (9.2%) |
| 50 to 54 Years | 904 (13.5%) | 634 (9.7%) |
| 55 to 59 Years | 516 (7.7%) | 397 (6.0%) |
| 60 to 64 Years | 390 (5.8%) | 459 (7.0%) |
| 65 to 69 Years | 88 (1.3%) | 119 (1.8%) |
| 70 to 74 Years | 169 (2.5%) | 178 (2.7%) |
| 75 to 79 Years | 154 (2.3%) | 271 (4.1%) |
| 80 to 84 Years | 69 (1.0%) | 65 (1.0%) |
| 85 Years and over | 100 (1.5%) | 82 (1.3%) |
| Total | 6,710 (100.0%) | 6,573 (100.0%) |
Families and Households in Rogers
Median Family Size in Rogers
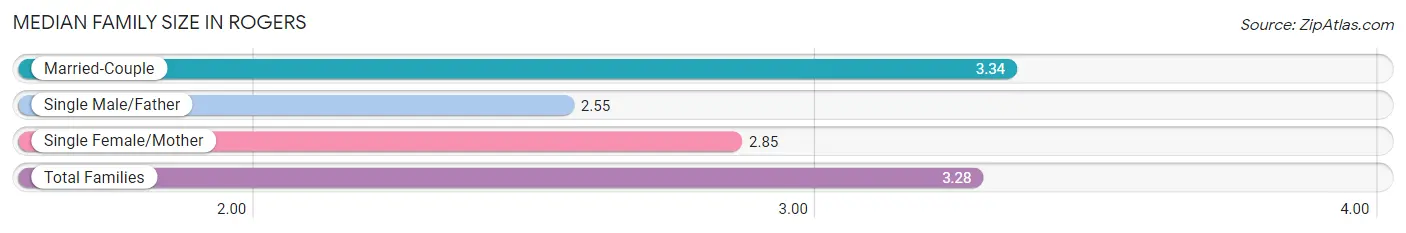
The median family size in Rogers is 3.28 persons per family, with married-couple families (3,246 | 89.3%) accounting for the largest median family size of 3.34 persons per family. On the other hand, single male/father families (105 | 2.9%) represent the smallest median family size with 2.55 persons per family.
| Family Type | # Families | Family Size |
| Married-Couple | 3,246 (89.3%) | 3.34 |
| Single Male/Father | 105 (2.9%) | 2.55 |
| Single Female/Mother | 285 (7.8%) | 2.85 |
| Total Families | 3,636 (100.0%) | 3.28 |
Median Household Size in Rogers
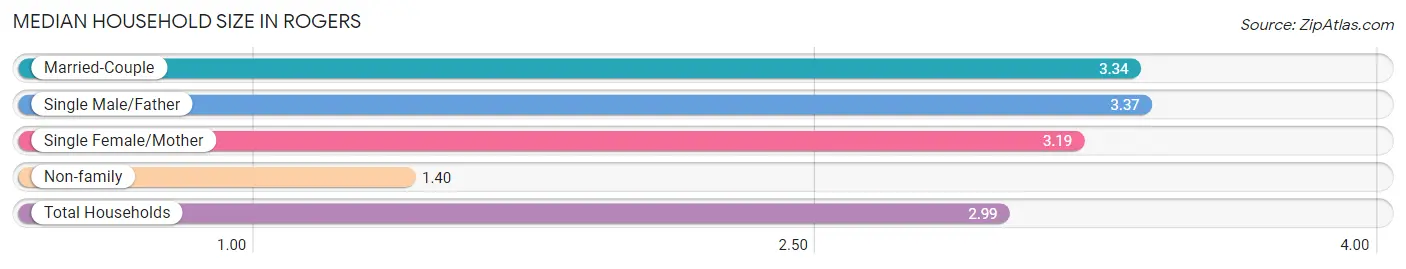
The median household size in Rogers is 2.99 persons per household, with single male/father households (105 | 2.4%) accounting for the largest median household size of 3.37 persons per household. non-family households (770 | 17.5%) represent the smallest median household size with 1.40 persons per household.
| Household Type | # Households | Household Size |
| Married-Couple | 3,246 (73.7%) | 3.34 |
| Single Male/Father | 105 (2.4%) | 3.37 |
| Single Female/Mother | 285 (6.5%) | 3.19 |
| Non-family | 770 (17.5%) | 1.40 |
| Total Households | 4,406 (100.0%) | 2.99 |
Household Size by Marriage Status in Rogers
Out of a total of 4,406 households in Rogers, 3,636 (82.5%) are family households, while 770 (17.5%) are nonfamily households. The most numerous type of family households are 2-person households, comprising 1,105, and the most common type of nonfamily households are 1-person households, comprising 536.
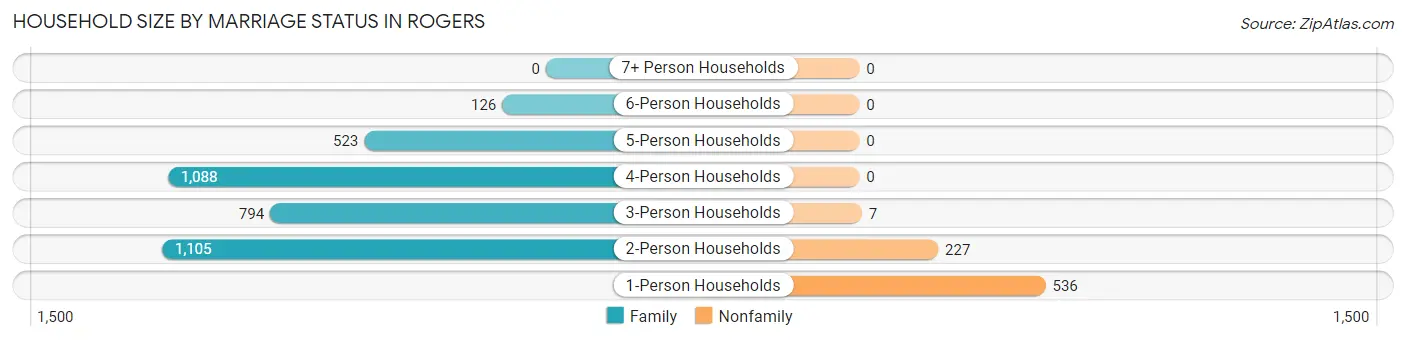
| Household Size | Family Households | Nonfamily Households |
| 1-Person Households | - | 536 (12.2%) |
| 2-Person Households | 1,105 (25.1%) | 227 (5.1%) |
| 3-Person Households | 794 (18.0%) | 7 (0.2%) |
| 4-Person Households | 1,088 (24.7%) | 0 (0.0%) |
| 5-Person Households | 523 (11.9%) | 0 (0.0%) |
| 6-Person Households | 126 (2.9%) | 0 (0.0%) |
| 7+ Person Households | 0 (0.0%) | 0 (0.0%) |
| Total | 3,636 (82.5%) | 770 (17.5%) |
Female Fertility in Rogers
Fertility by Age in Rogers
Average fertility rate in Rogers is 86.0 births per 1,000 women. Women in the age bracket of 20 to 34 years have the highest fertility rate with 345.0 births per 1,000 women. Women in the age bracket of 20 to 34 years acount for 98.0% of all women with births.
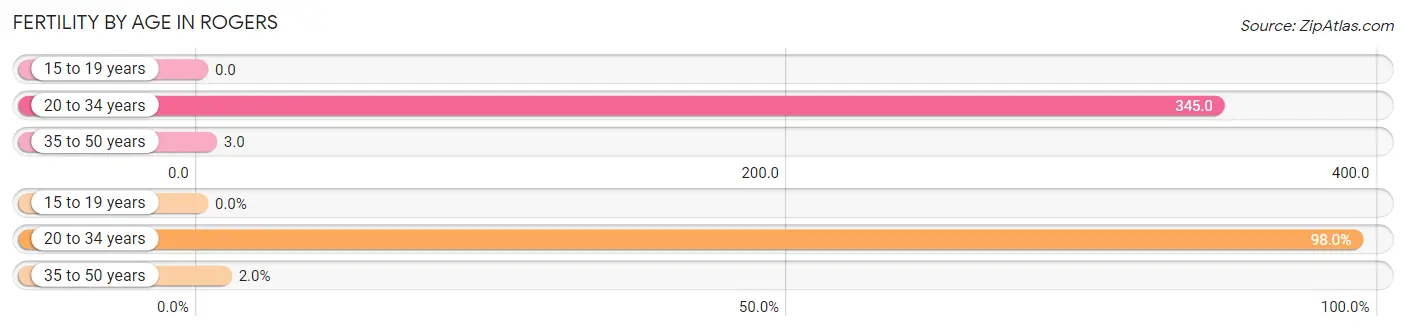
| Age Bracket | Women with Births | Births / 1,000 Women |
| 15 to 19 years | 0 (0.0%) | 0.0 |
| 20 to 34 years | 244 (98.0%) | 345.0 |
| 35 to 50 years | 5 (2.0%) | 3.0 |
| Total | 249 (100.0%) | 86.0 |
Fertility by Age by Marriage Status in Rogers
71.5% of women with births (249) in Rogers are married. The highest percentage of unmarried women with births falls into 20 to 34 years age bracket with 29.1% of them unmarried at the time of birth, while the lowest percentage of unmarried women with births belong to 35 to 50 years age bracket with 0.0% of them unmarried.
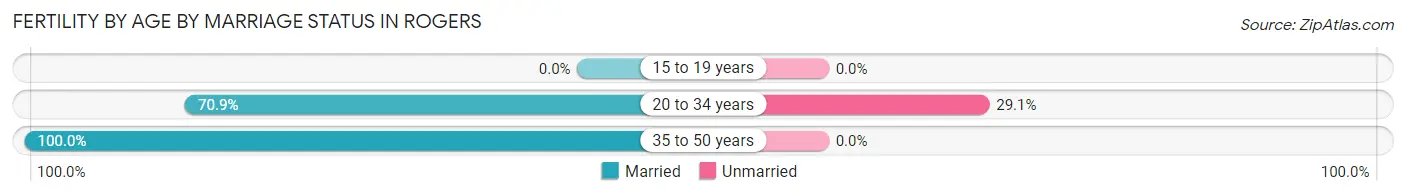
| Age Bracket | Married | Unmarried |
| 15 to 19 years | 0 (0.0%) | 0 (0.0%) |
| 20 to 34 years | 173 (70.9%) | 71 (29.1%) |
| 35 to 50 years | 5 (100.0%) | 0 (0.0%) |
| Total | 178 (71.5%) | 71 (28.5%) |
Fertility by Education in Rogers
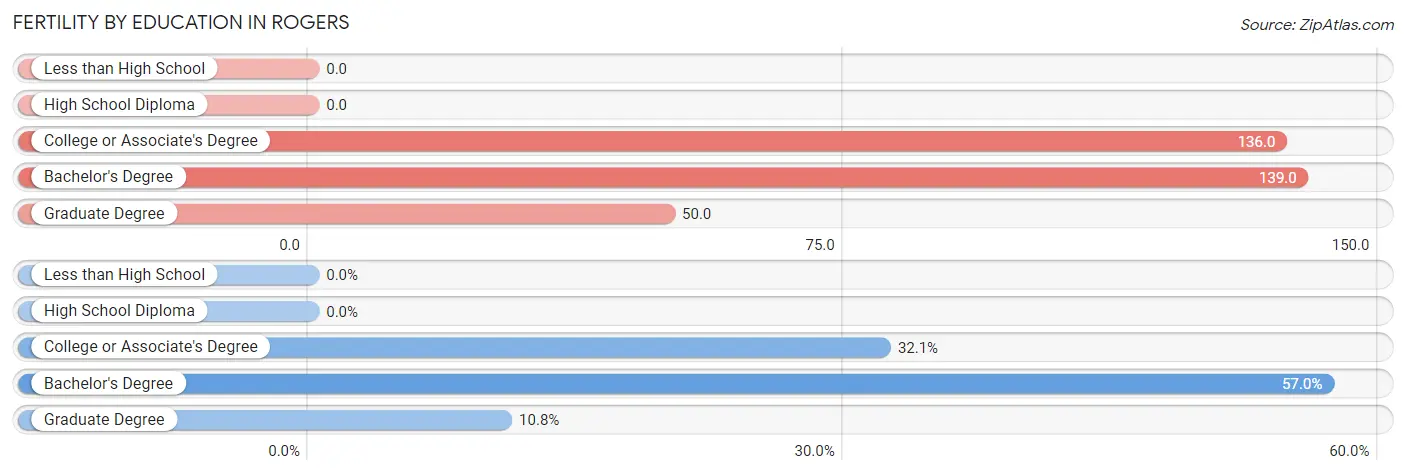
| Educational Attainment | Women with Births | Births / 1,000 Women |
| Less than High School | 0 (0.0%) | 0.0 |
| High School Diploma | 0 (0.0%) | 0.0 |
| College or Associate's Degree | 80 (32.1%) | 136.0 |
| Bachelor's Degree | 142 (57.0%) | 139.0 |
| Graduate Degree | 27 (10.8%) | 50.0 |
| Total | 249 (100.0%) | 86.0 |
Fertility by Education by Marriage Status in Rogers
28.5% of women with births in Rogers are unmarried. Women with the educational attainment of graduate degree are most likely to be married with 100.0% of them married at childbirth, while women with the educational attainment of college or associate's degree are least likely to be married with 48.7% of them unmarried at childbirth.
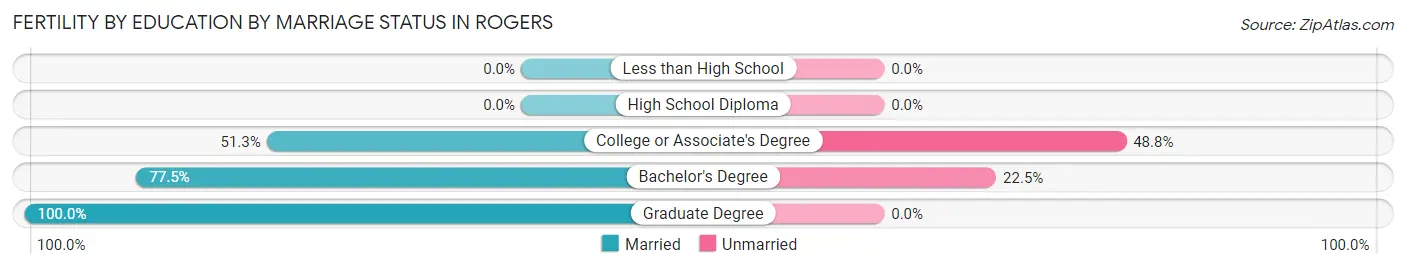
| Educational Attainment | Married | Unmarried |
| Less than High School | 0 (0.0%) | 0 (0.0%) |
| High School Diploma | 0 (0.0%) | 0 (0.0%) |
| College or Associate's Degree | 41 (51.2%) | 39 (48.7%) |
| Bachelor's Degree | 110 (77.5%) | 32 (22.5%) |
| Graduate Degree | 27 (100.0%) | 0 (0.0%) |
| Total | 178 (71.5%) | 71 (28.5%) |
Employment Characteristics in Rogers
Employment by Class of Employer in Rogers
Among the 6,533 employed individuals in Rogers, private company employees (5,206 | 79.7%), local government employees (375 | 5.7%), and not-for-profit organizations (279 | 4.3%) make up the most common classes of employment.
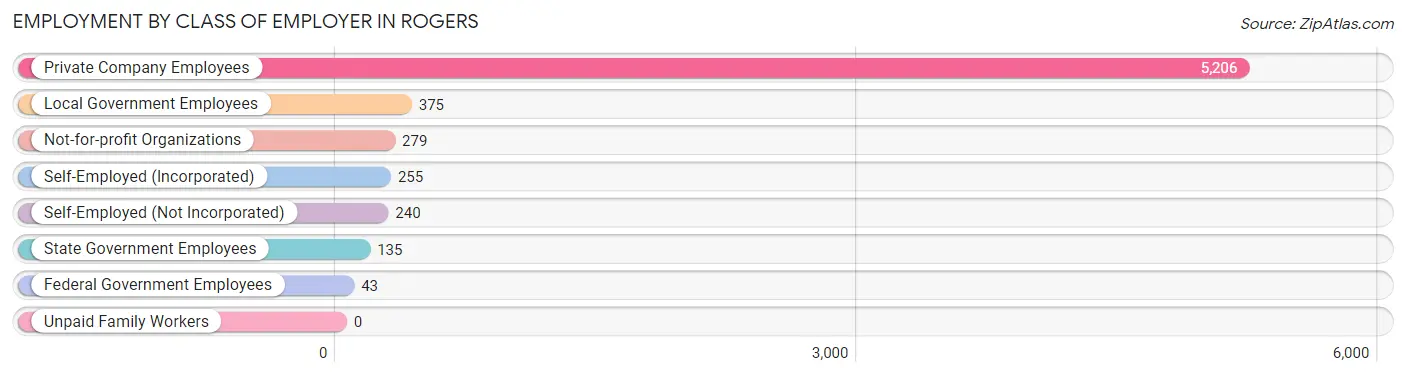
| Employer Class | # Employees | % Employees |
| Private Company Employees | 5,206 | 79.7% |
| Self-Employed (Incorporated) | 255 | 3.9% |
| Self-Employed (Not Incorporated) | 240 | 3.7% |
| Not-for-profit Organizations | 279 | 4.3% |
| Local Government Employees | 375 | 5.7% |
| State Government Employees | 135 | 2.1% |
| Federal Government Employees | 43 | 0.7% |
| Unpaid Family Workers | 0 | 0.0% |
| Total | 6,533 | 100.0% |
Employment Status by Age in Rogers
According to the labor force statistics for Rogers, out of the total population over 16 years of age (9,623), 72.8% or 7,006 individuals are in the labor force, with 1.3% or 91 of them unemployed. The age group with the highest labor force participation rate is 25 to 29 years, with 100.0% or 293 individuals in the labor force. Within the labor force, the 55 to 59 years age range has the highest percentage of unemployed individuals, with 4.6% or 37 of them being unemployed.
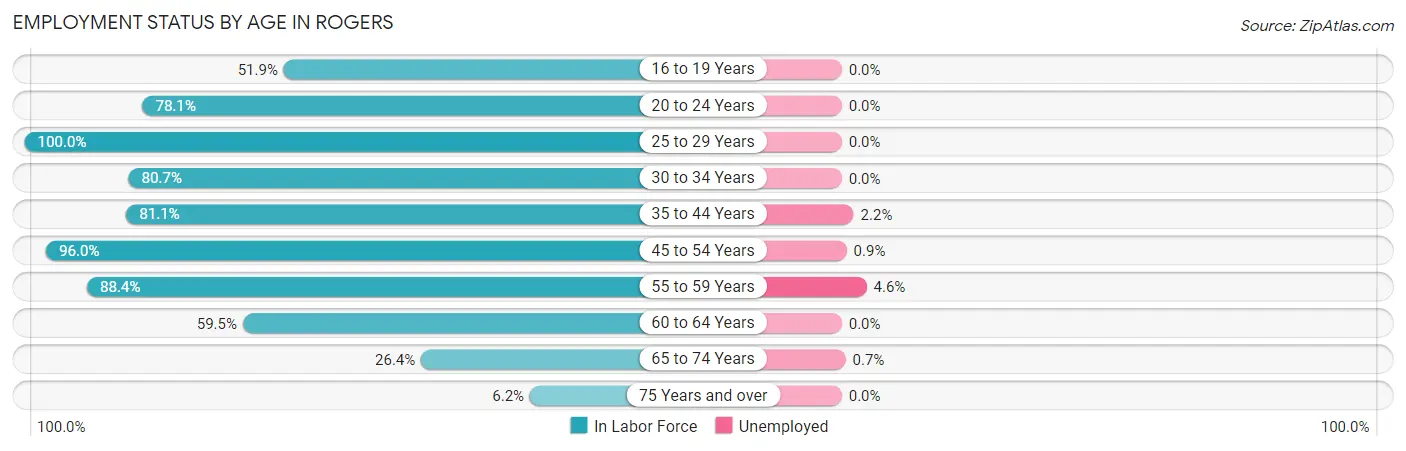
| Age Bracket | In Labor Force | Unemployed |
| 16 to 19 Years | 438 (51.9%) | 0 (0.0%) |
| 20 to 24 Years | 367 (78.1%) | 0 (0.0%) |
| 25 to 29 Years | 293 (100.0%) | 0 (0.0%) |
| 30 to 34 Years | 602 (80.7%) | 0 (0.0%) |
| 35 to 44 Years | 1,337 (81.1%) | 29 (2.2%) |
| 45 to 54 Years | 2,462 (96.0%) | 22 (0.9%) |
| 55 to 59 Years | 807 (88.4%) | 37 (4.6%) |
| 60 to 64 Years | 505 (59.5%) | 0 (0.0%) |
| 65 to 74 Years | 146 (26.4%) | 1 (0.7%) |
| 75 Years and over | 46 (6.2%) | 0 (0.0%) |
| Total | 7,006 (72.8%) | 91 (1.3%) |
Employment Status by Educational Attainment in Rogers
According to labor force statistics for Rogers, 85.6% of individuals (6,004) out of the total population between 25 and 64 years of age (7,014) are in the labor force, with 1.5% or 90 of them being unemployed. The group with the highest labor force participation rate are those with the educational attainment of bachelor's degree or higher, with 89.0% or 3,615 individuals in the labor force. Within the labor force, individuals with high school diploma education have the highest percentage of unemployment, with 6.1% or 52 of them being unemployed.
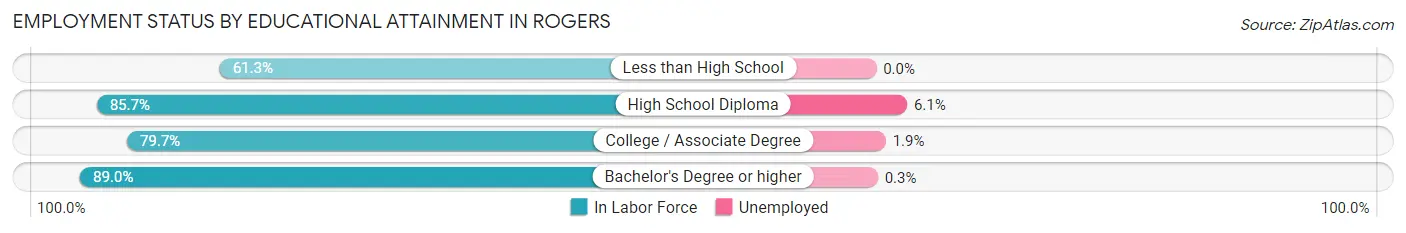
| Educational Attainment | In Labor Force | Unemployed |
| Less than High School | 84 (61.3%) | 0 (0.0%) |
| High School Diploma | 854 (85.7%) | 61 (6.1%) |
| College / Associate Degree | 1,450 (79.7%) | 35 (1.9%) |
| Bachelor's Degree or higher | 3,615 (89.0%) | 12 (0.3%) |
| Total | 6,004 (85.6%) | 105 (1.5%) |
Employment Occupations by Sex in Rogers
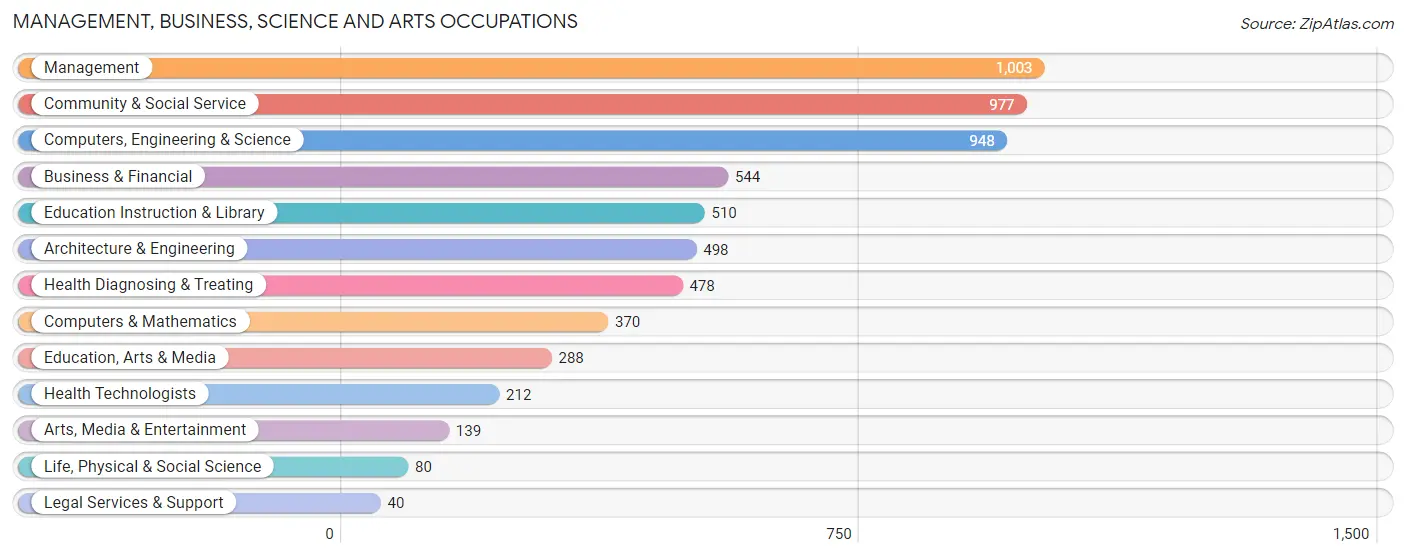
Management, Business, Science and Arts Occupations
The most common Management, Business, Science and Arts occupations in Rogers are Management (1,003 | 14.5%), Community & Social Service (977 | 14.1%), Computers, Engineering & Science (948 | 13.7%), Business & Financial (544 | 7.9%), and Education Instruction & Library (510 | 7.4%).
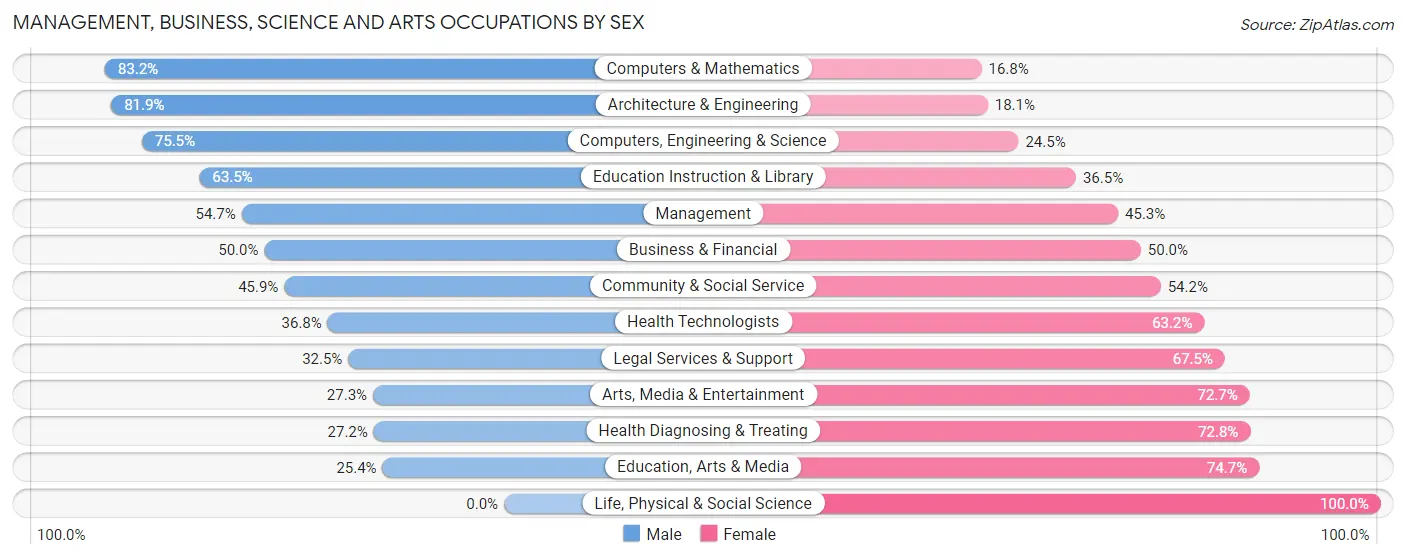
Management, Business, Science and Arts Occupations by Sex
Within the Management, Business, Science and Arts occupations in Rogers, the most male-oriented occupations are Computers & Mathematics (83.2%), Architecture & Engineering (81.9%), and Computers, Engineering & Science (75.5%), while the most female-oriented occupations are Life, Physical & Social Science (100.0%), Education, Arts & Media (74.7%), and Health Diagnosing & Treating (72.8%).
| Occupation | Male | Female |
| Management | 549 (54.7%) | 454 (45.3%) |
| Business & Financial | 272 (50.0%) | 272 (50.0%) |
| Computers, Engineering & Science | 716 (75.5%) | 232 (24.5%) |
| Computers & Mathematics | 308 (83.2%) | 62 (16.8%) |
| Architecture & Engineering | 408 (81.9%) | 90 (18.1%) |
| Life, Physical & Social Science | 0 (0.0%) | 80 (100.0%) |
| Community & Social Service | 448 (45.9%) | 529 (54.1%) |
| Education, Arts & Media | 73 (25.4%) | 215 (74.7%) |
| Legal Services & Support | 13 (32.5%) | 27 (67.5%) |
| Education Instruction & Library | 324 (63.5%) | 186 (36.5%) |
| Arts, Media & Entertainment | 38 (27.3%) | 101 (72.7%) |
| Health Diagnosing & Treating | 130 (27.2%) | 348 (72.8%) |
| Health Technologists | 78 (36.8%) | 134 (63.2%) |
| Total (Category) | 2,115 (53.5%) | 1,835 (46.5%) |
| Total (Overall) | 3,767 (54.5%) | 3,145 (45.5%) |
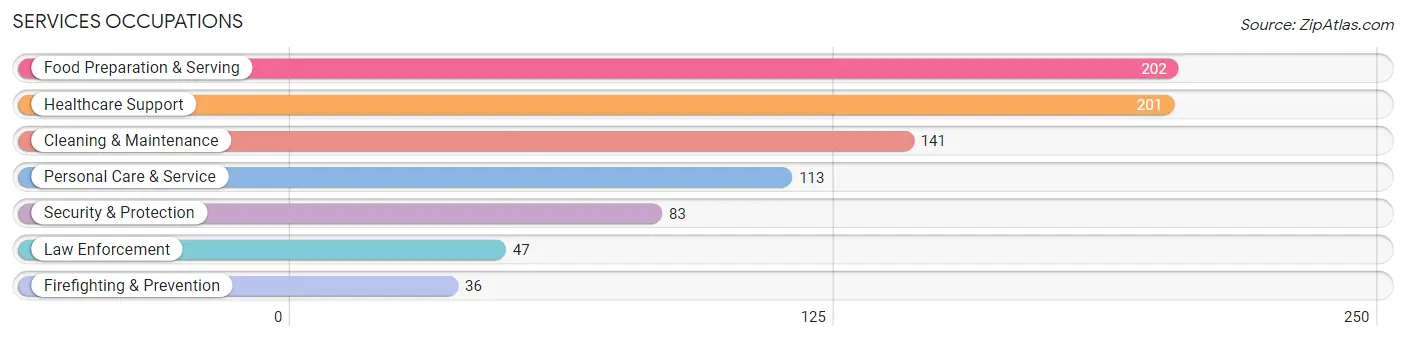
Services Occupations
The most common Services occupations in Rogers are Food Preparation & Serving (202 | 2.9%), Healthcare Support (201 | 2.9%), Cleaning & Maintenance (141 | 2.0%), Personal Care & Service (113 | 1.6%), and Security & Protection (83 | 1.2%).
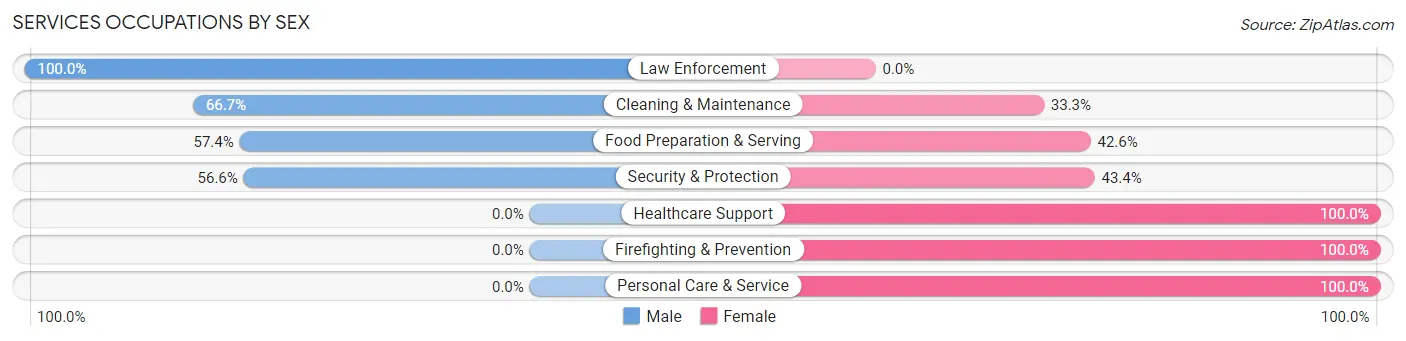
Services Occupations by Sex
Within the Services occupations in Rogers, the most male-oriented occupations are Law Enforcement (100.0%), Cleaning & Maintenance (66.7%), and Food Preparation & Serving (57.4%), while the most female-oriented occupations are Healthcare Support (100.0%), Firefighting & Prevention (100.0%), and Personal Care & Service (100.0%).
| Occupation | Male | Female |
| Healthcare Support | 0 (0.0%) | 201 (100.0%) |
| Security & Protection | 47 (56.6%) | 36 (43.4%) |
| Firefighting & Prevention | 0 (0.0%) | 36 (100.0%) |
| Law Enforcement | 47 (100.0%) | 0 (0.0%) |
| Food Preparation & Serving | 116 (57.4%) | 86 (42.6%) |
| Cleaning & Maintenance | 94 (66.7%) | 47 (33.3%) |
| Personal Care & Service | 0 (0.0%) | 113 (100.0%) |
| Total (Category) | 257 (34.7%) | 483 (65.3%) |
| Total (Overall) | 3,767 (54.5%) | 3,145 (45.5%) |
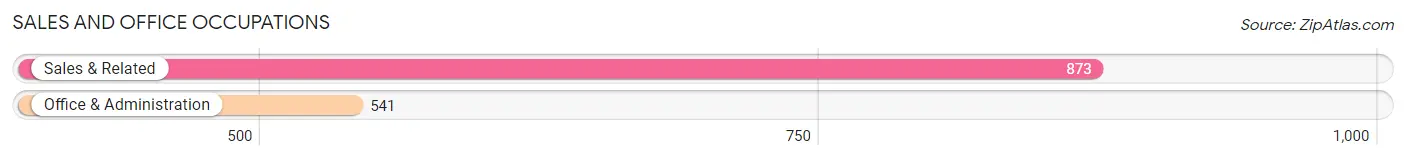
Sales and Office Occupations
The most common Sales and Office occupations in Rogers are Sales & Related (873 | 12.6%), and Office & Administration (541 | 7.8%).
Sales and Office Occupations by Sex
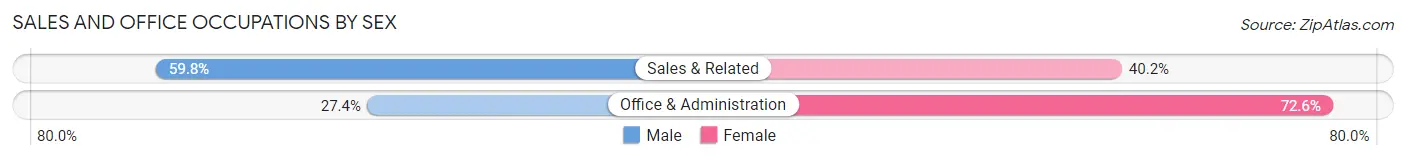
| Occupation | Male | Female |
| Sales & Related | 522 (59.8%) | 351 (40.2%) |
| Office & Administration | 148 (27.4%) | 393 (72.6%) |
| Total (Category) | 670 (47.4%) | 744 (52.6%) |
| Total (Overall) | 3,767 (54.5%) | 3,145 (45.5%) |
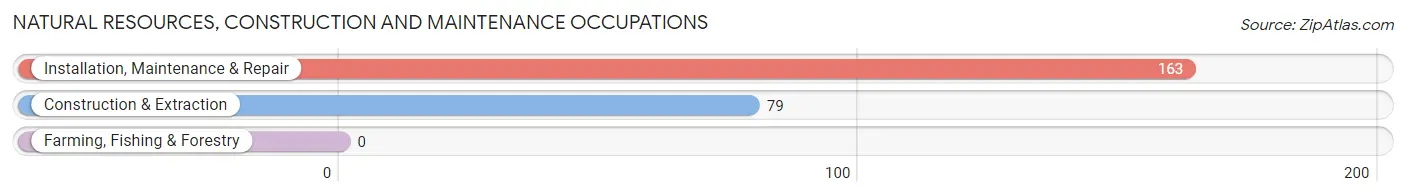
Natural Resources, Construction and Maintenance Occupations
The most common Natural Resources, Construction and Maintenance occupations in Rogers are Installation, Maintenance & Repair (163 | 2.4%), and Construction & Extraction (79 | 1.1%).
Natural Resources, Construction and Maintenance Occupations by Sex
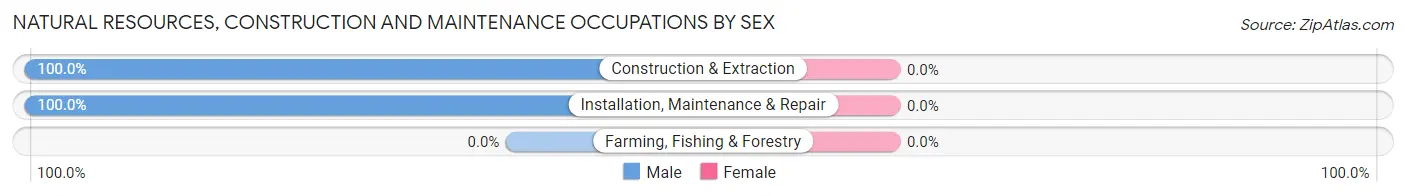
| Occupation | Male | Female |
| Farming, Fishing & Forestry | 0 (0.0%) | 0 (0.0%) |
| Construction & Extraction | 79 (100.0%) | 0 (0.0%) |
| Installation, Maintenance & Repair | 163 (100.0%) | 0 (0.0%) |
| Total (Category) | 242 (100.0%) | 0 (0.0%) |
| Total (Overall) | 3,767 (54.5%) | 3,145 (45.5%) |
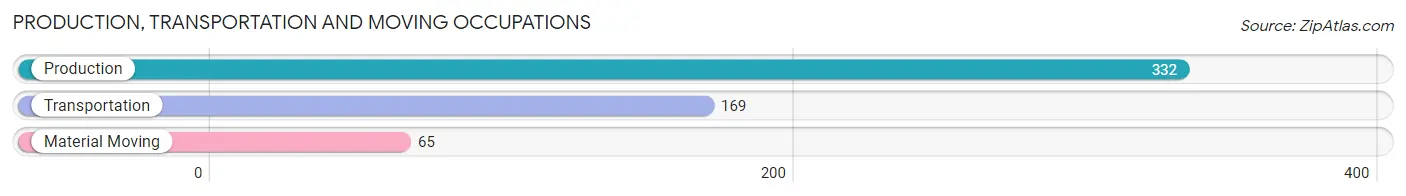
Production, Transportation and Moving Occupations
The most common Production, Transportation and Moving occupations in Rogers are Production (332 | 4.8%), Transportation (169 | 2.5%), and Material Moving (65 | 0.9%).
Production, Transportation and Moving Occupations by Sex
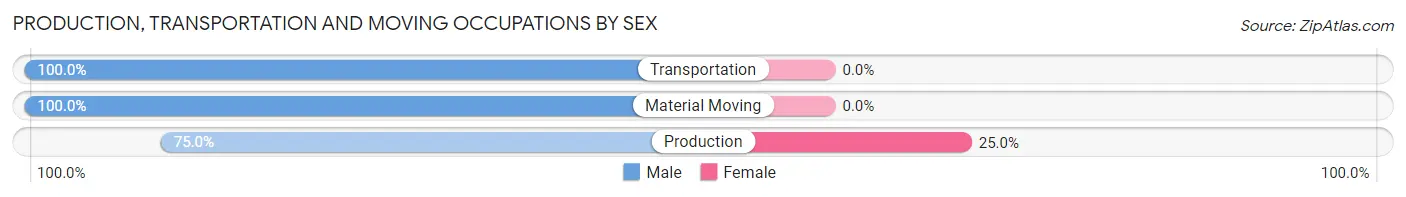
| Occupation | Male | Female |
| Production | 249 (75.0%) | 83 (25.0%) |
| Transportation | 169 (100.0%) | 0 (0.0%) |
| Material Moving | 65 (100.0%) | 0 (0.0%) |
| Total (Category) | 483 (85.3%) | 83 (14.7%) |
| Total (Overall) | 3,767 (54.5%) | 3,145 (45.5%) |
Employment Industries by Sex in Rogers
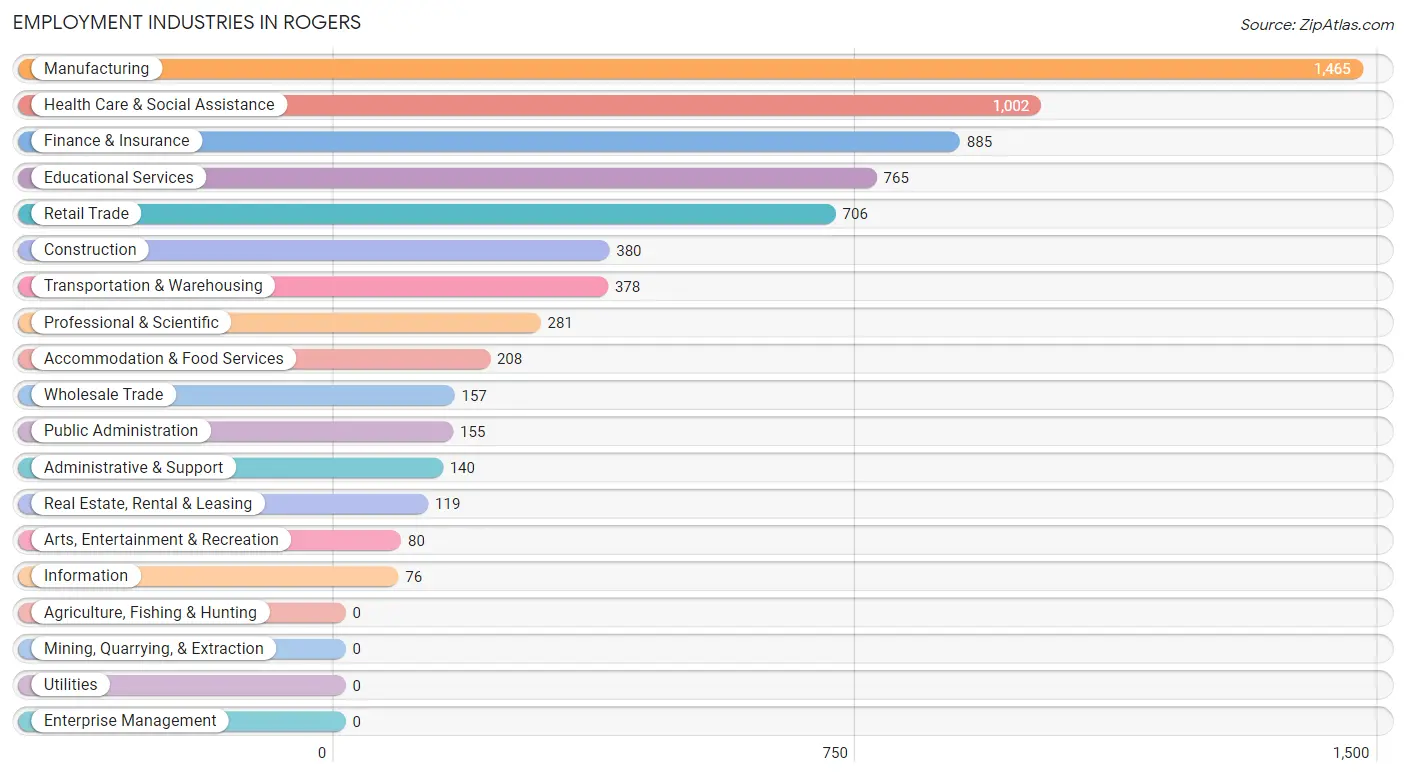
Employment Industries in Rogers
The major employment industries in Rogers include Manufacturing (1,465 | 21.2%), Health Care & Social Assistance (1,002 | 14.5%), Finance & Insurance (885 | 12.8%), Educational Services (765 | 11.1%), and Retail Trade (706 | 10.2%).
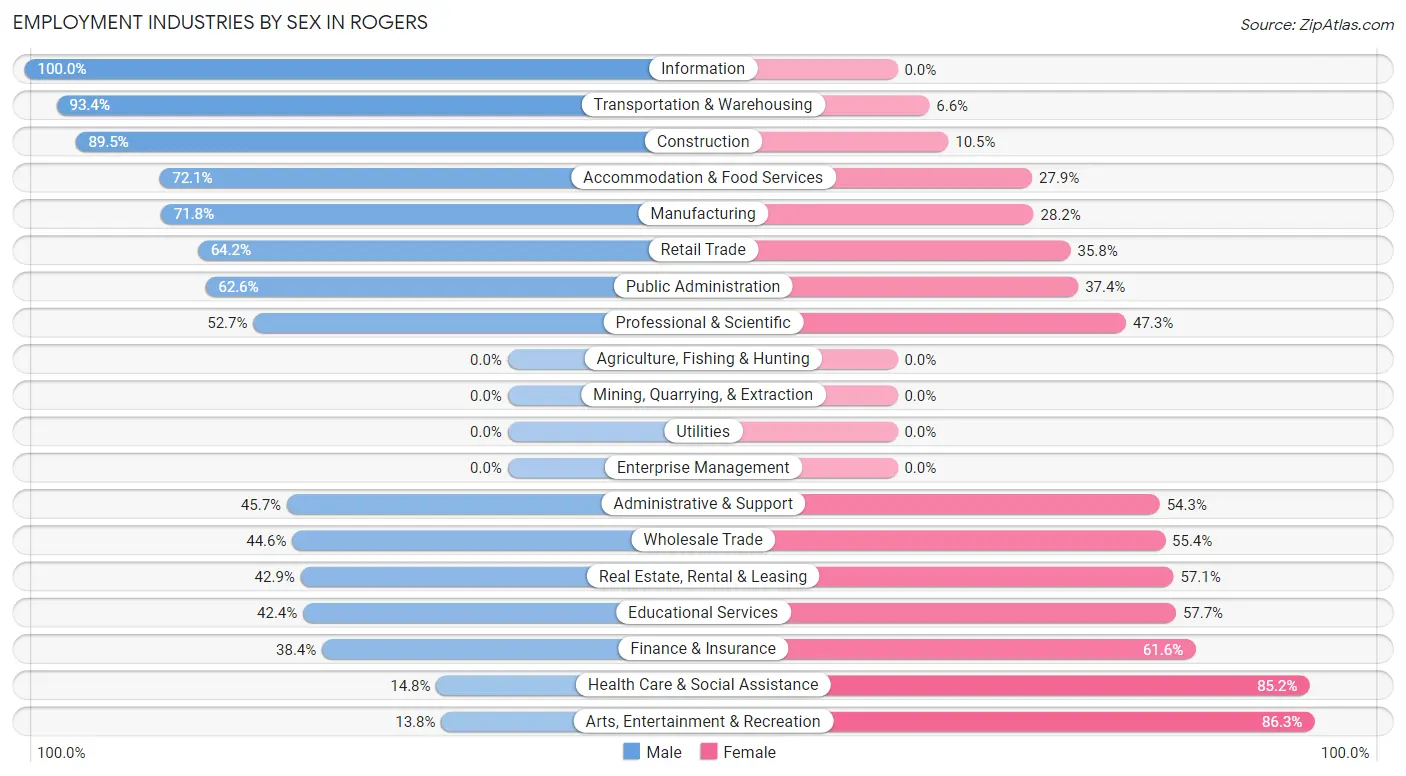
Employment Industries by Sex in Rogers
The Rogers industries that see more men than women are Information (100.0%), Transportation & Warehousing (93.4%), and Construction (89.5%), whereas the industries that tend to have a higher number of women are Arts, Entertainment & Recreation (86.3%), Health Care & Social Assistance (85.2%), and Finance & Insurance (61.6%).
| Industry | Male | Female |
| Agriculture, Fishing & Hunting | 0 (0.0%) | 0 (0.0%) |
| Mining, Quarrying, & Extraction | 0 (0.0%) | 0 (0.0%) |
| Construction | 340 (89.5%) | 40 (10.5%) |
| Manufacturing | 1,052 (71.8%) | 413 (28.2%) |
| Wholesale Trade | 70 (44.6%) | 87 (55.4%) |
| Retail Trade | 453 (64.2%) | 253 (35.8%) |
| Transportation & Warehousing | 353 (93.4%) | 25 (6.6%) |
| Utilities | 0 (0.0%) | 0 (0.0%) |
| Information | 76 (100.0%) | 0 (0.0%) |
| Finance & Insurance | 340 (38.4%) | 545 (61.6%) |
| Real Estate, Rental & Leasing | 51 (42.9%) | 68 (57.1%) |
| Professional & Scientific | 148 (52.7%) | 133 (47.3%) |
| Enterprise Management | 0 (0.0%) | 0 (0.0%) |
| Administrative & Support | 64 (45.7%) | 76 (54.3%) |
| Educational Services | 324 (42.3%) | 441 (57.7%) |
| Health Care & Social Assistance | 148 (14.8%) | 854 (85.2%) |
| Arts, Entertainment & Recreation | 11 (13.8%) | 69 (86.3%) |
| Accommodation & Food Services | 150 (72.1%) | 58 (27.9%) |
| Public Administration | 97 (62.6%) | 58 (37.4%) |
| Total | 3,767 (54.5%) | 3,145 (45.5%) |
Education in Rogers
School Enrollment in Rogers
The most common levels of schooling among the 3,516 students in Rogers are middle school (981 | 27.9%), high school (920 | 26.2%), and elementary school (601 | 17.1%).
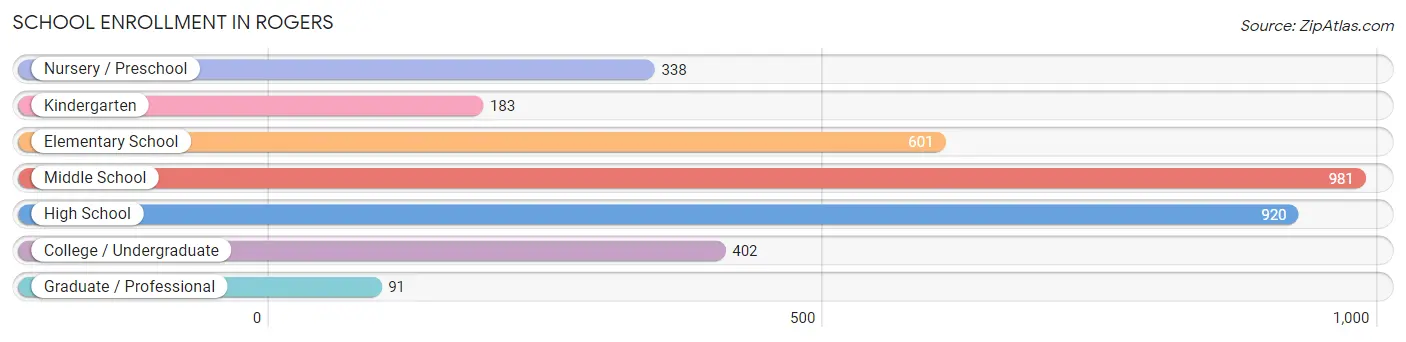
| School Level | # Students | % Students |
| Nursery / Preschool | 338 | 9.6% |
| Kindergarten | 183 | 5.2% |
| Elementary School | 601 | 17.1% |
| Middle School | 981 | 27.9% |
| High School | 920 | 26.2% |
| College / Undergraduate | 402 | 11.4% |
| Graduate / Professional | 91 | 2.6% |
| Total | 3,516 | 100.0% |
School Enrollment by Age by Funding Source in Rogers
Out of a total of 3,516 students who are enrolled in schools in Rogers, 861 (24.5%) attend a private institution, while the remaining 2,655 (75.5%) are enrolled in public schools. The age group of 3 to 4 year olds has the highest likelihood of being enrolled in private schools, with 103 (83.1% in the age bracket) enrolled. Conversely, the age group of 15 to 17 year olds has the lowest likelihood of being enrolled in a private school, with 745 (100.0% in the age bracket) attending a public institution.
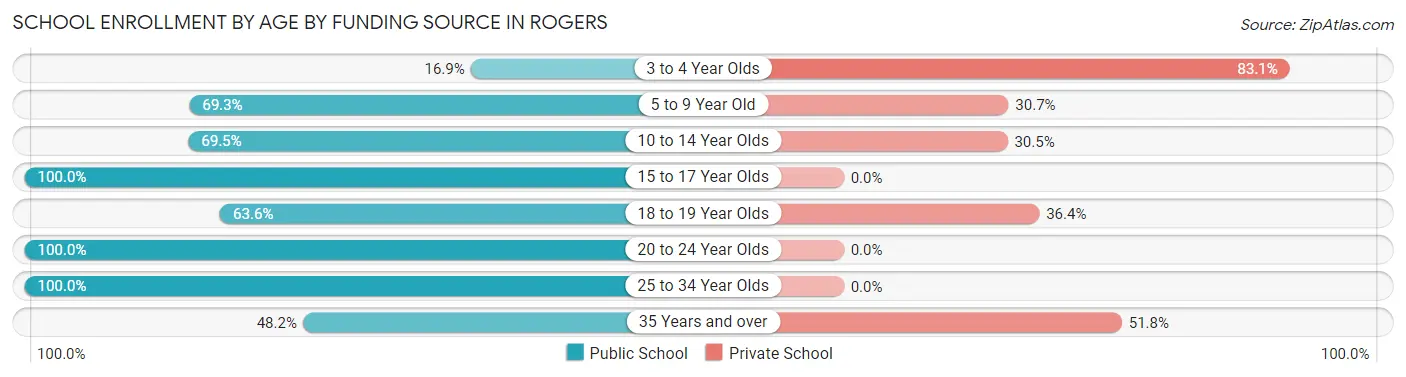
| Age Bracket | Public School | Private School |
| 3 to 4 Year Olds | 21 (16.9%) | 103 (83.1%) |
| 5 to 9 Year Old | 635 (69.3%) | 281 (30.7%) |
| 10 to 14 Year Olds | 772 (69.5%) | 339 (30.5%) |
| 15 to 17 Year Olds | 745 (100.0%) | 0 (0.0%) |
| 18 to 19 Year Olds | 164 (63.6%) | 94 (36.4%) |
| 20 to 24 Year Olds | 194 (100.0%) | 0 (0.0%) |
| 25 to 34 Year Olds | 85 (100.0%) | 0 (0.0%) |
| 35 Years and over | 40 (48.2%) | 43 (51.8%) |
| Total | 2,655 (75.5%) | 861 (24.5%) |
Educational Attainment by Field of Study in Rogers
Business (1,345 | 29.2%), science & technology (820 | 17.8%), education (414 | 9.0%), liberal arts & history (371 | 8.1%), and engineering (342 | 7.4%) are the most common fields of study among 4,606 individuals in Rogers who have obtained a bachelor's degree or higher.
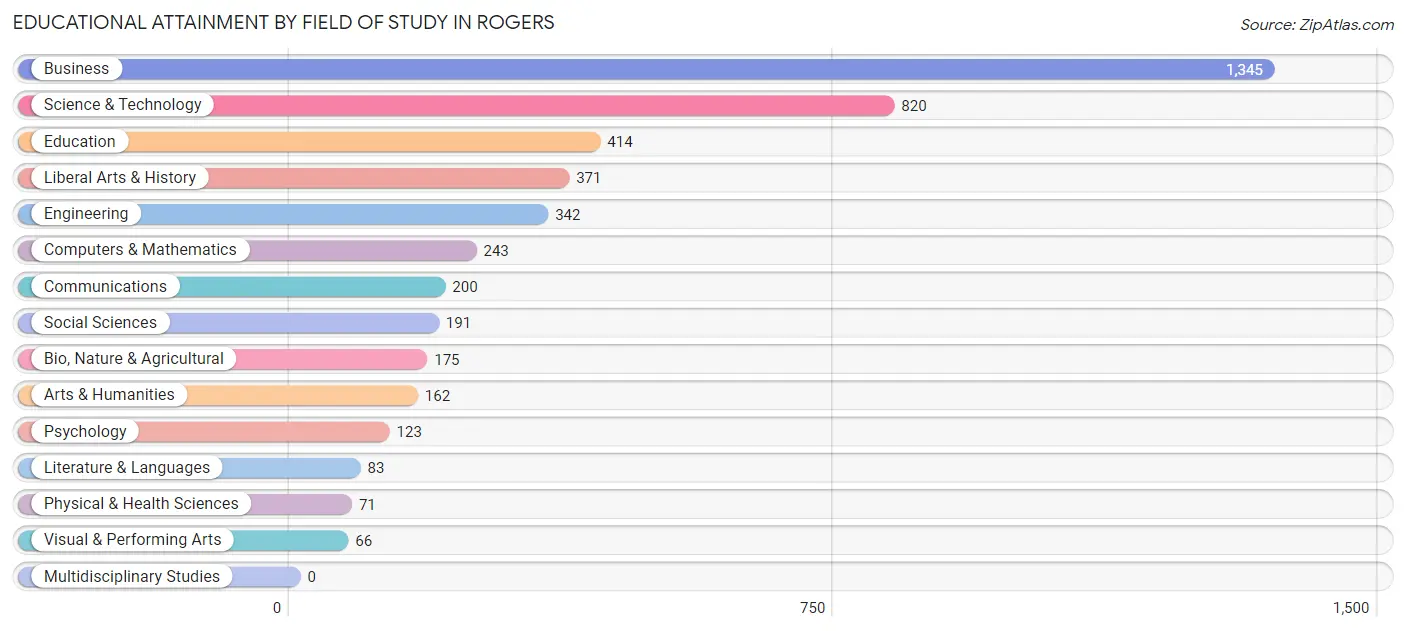
| Field of Study | # Graduates | % Graduates |
| Computers & Mathematics | 243 | 5.3% |
| Bio, Nature & Agricultural | 175 | 3.8% |
| Physical & Health Sciences | 71 | 1.5% |
| Psychology | 123 | 2.7% |
| Social Sciences | 191 | 4.2% |
| Engineering | 342 | 7.4% |
| Multidisciplinary Studies | 0 | 0.0% |
| Science & Technology | 820 | 17.8% |
| Business | 1,345 | 29.2% |
| Education | 414 | 9.0% |
| Literature & Languages | 83 | 1.8% |
| Liberal Arts & History | 371 | 8.1% |
| Visual & Performing Arts | 66 | 1.4% |
| Communications | 200 | 4.3% |
| Arts & Humanities | 162 | 3.5% |
| Total | 4,606 | 100.0% |
Transportation & Commute in Rogers
Vehicle Availability by Sex in Rogers
The most prevalent vehicle ownership categories in Rogers are males with 2 vehicles (1,619, accounting for 45.3%) and females with 2 vehicles (1,370, making up 54.8%).
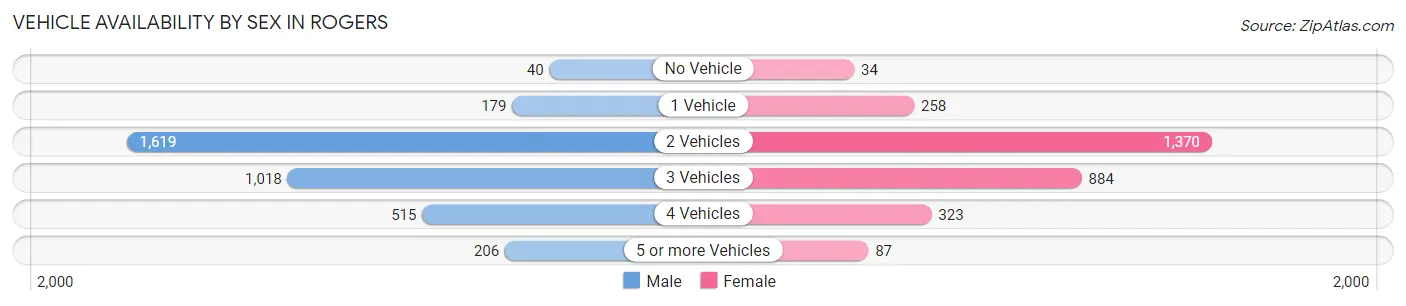
| Vehicles Available | Male | Female |
| No Vehicle | 40 (1.1%) | 34 (1.1%) |
| 1 Vehicle | 179 (5.0%) | 258 (8.7%) |
| 2 Vehicles | 1,619 (45.3%) | 1,370 (46.4%) |
| 3 Vehicles | 1,018 (28.5%) | 884 (29.9%) |
| 4 Vehicles | 515 (14.4%) | 323 (10.9%) |
| 5 or more Vehicles | 206 (5.8%) | 87 (2.9%) |
| Total | 3,577 (100.0%) | 2,956 (100.0%) |
Commute Time in Rogers
The most frequently occuring commute durations in Rogers are 45 to 59 minutes (1,015 commuters, 19.4%), 20 to 24 minutes (985 commuters, 18.8%), and 25 to 29 minutes (723 commuters, 13.8%).
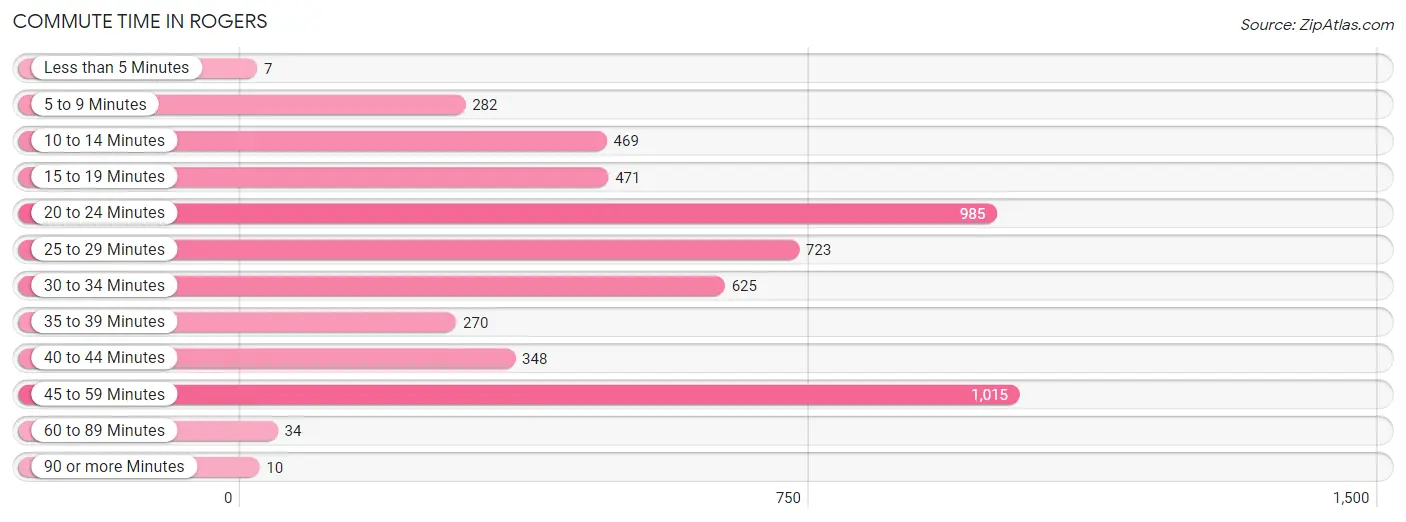
| Commute Time | # Commuters | % Commuters |
| Less than 5 Minutes | 7 | 0.1% |
| 5 to 9 Minutes | 282 | 5.4% |
| 10 to 14 Minutes | 469 | 8.9% |
| 15 to 19 Minutes | 471 | 9.0% |
| 20 to 24 Minutes | 985 | 18.8% |
| 25 to 29 Minutes | 723 | 13.8% |
| 30 to 34 Minutes | 625 | 11.9% |
| 35 to 39 Minutes | 270 | 5.1% |
| 40 to 44 Minutes | 348 | 6.6% |
| 45 to 59 Minutes | 1,015 | 19.4% |
| 60 to 89 Minutes | 34 | 0.6% |
| 90 or more Minutes | 10 | 0.2% |
Commute Time by Sex in Rogers
The most common commute times in Rogers are 20 to 24 minutes (648 commuters, 21.0%) for males and 30 to 34 minutes (406 commuters, 18.9%) for females.
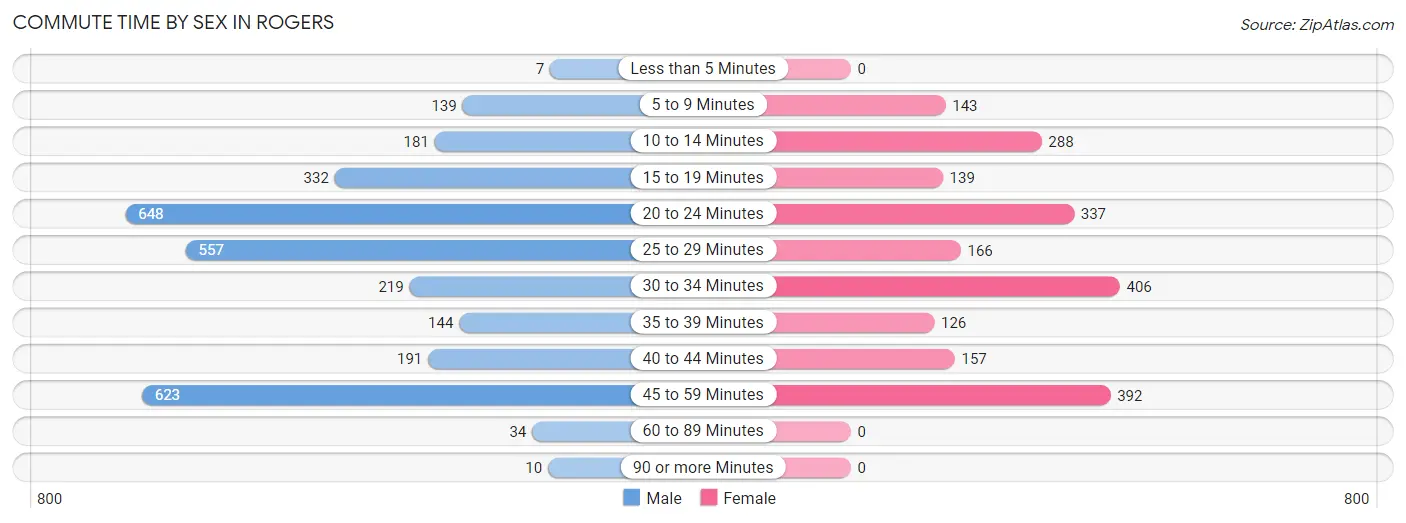
| Commute Time | Male | Female |
| Less than 5 Minutes | 7 (0.2%) | 0 (0.0%) |
| 5 to 9 Minutes | 139 (4.5%) | 143 (6.6%) |
| 10 to 14 Minutes | 181 (5.9%) | 288 (13.4%) |
| 15 to 19 Minutes | 332 (10.8%) | 139 (6.5%) |
| 20 to 24 Minutes | 648 (21.0%) | 337 (15.7%) |
| 25 to 29 Minutes | 557 (18.1%) | 166 (7.7%) |
| 30 to 34 Minutes | 219 (7.1%) | 406 (18.9%) |
| 35 to 39 Minutes | 144 (4.7%) | 126 (5.9%) |
| 40 to 44 Minutes | 191 (6.2%) | 157 (7.3%) |
| 45 to 59 Minutes | 623 (20.2%) | 392 (18.2%) |
| 60 to 89 Minutes | 34 (1.1%) | 0 (0.0%) |
| 90 or more Minutes | 10 (0.3%) | 0 (0.0%) |
Time of Departure to Work by Sex in Rogers
The most frequent times of departure to work in Rogers are 8:00 AM to 8:29 AM (502, 16.3%) for males and 7:30 AM to 7:59 AM (394, 18.3%) for females.
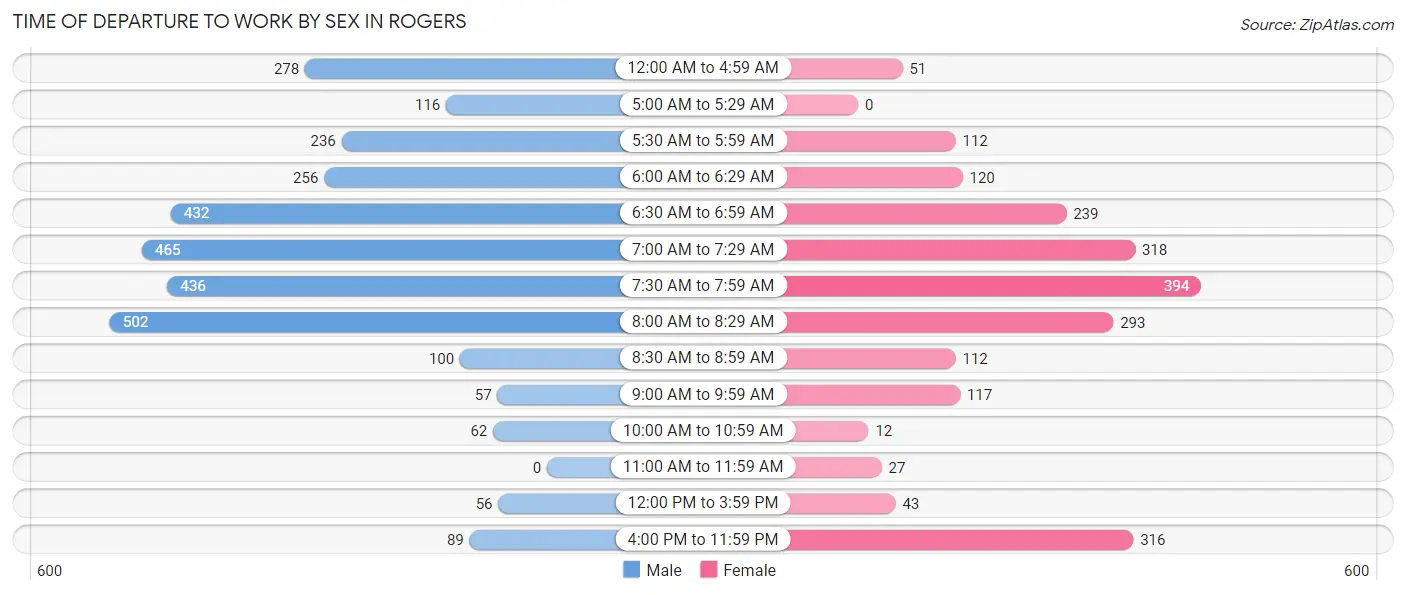
| Time of Departure | Male | Female |
| 12:00 AM to 4:59 AM | 278 (9.0%) | 51 (2.4%) |
| 5:00 AM to 5:29 AM | 116 (3.8%) | 0 (0.0%) |
| 5:30 AM to 5:59 AM | 236 (7.6%) | 112 (5.2%) |
| 6:00 AM to 6:29 AM | 256 (8.3%) | 120 (5.6%) |
| 6:30 AM to 6:59 AM | 432 (14.0%) | 239 (11.1%) |
| 7:00 AM to 7:29 AM | 465 (15.1%) | 318 (14.8%) |
| 7:30 AM to 7:59 AM | 436 (14.1%) | 394 (18.3%) |
| 8:00 AM to 8:29 AM | 502 (16.3%) | 293 (13.6%) |
| 8:30 AM to 8:59 AM | 100 (3.2%) | 112 (5.2%) |
| 9:00 AM to 9:59 AM | 57 (1.8%) | 117 (5.4%) |
| 10:00 AM to 10:59 AM | 62 (2.0%) | 12 (0.6%) |
| 11:00 AM to 11:59 AM | 0 (0.0%) | 27 (1.3%) |
| 12:00 PM to 3:59 PM | 56 (1.8%) | 43 (2.0%) |
| 4:00 PM to 11:59 PM | 89 (2.9%) | 316 (14.7%) |
| Total | 3,085 (100.0%) | 2,154 (100.0%) |
Housing Occupancy in Rogers
Occupancy by Ownership in Rogers
Of the total 4,406 dwellings in Rogers, owner-occupied units account for 3,889 (88.3%), while renter-occupied units make up 517 (11.7%).
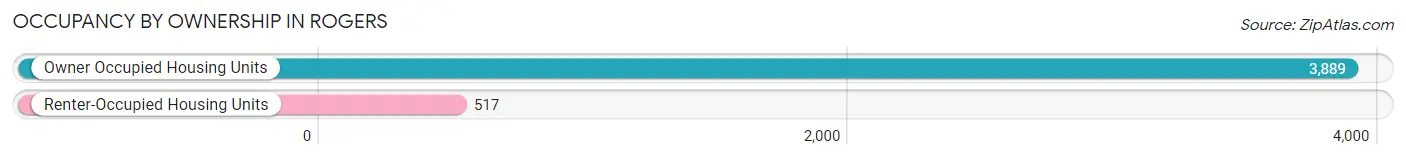
| Occupancy | # Housing Units | % Housing Units |
| Owner Occupied Housing Units | 3,889 | 88.3% |
| Renter-Occupied Housing Units | 517 | 11.7% |
| Total Occupied Housing Units | 4,406 | 100.0% |
Occupancy by Household Size in Rogers
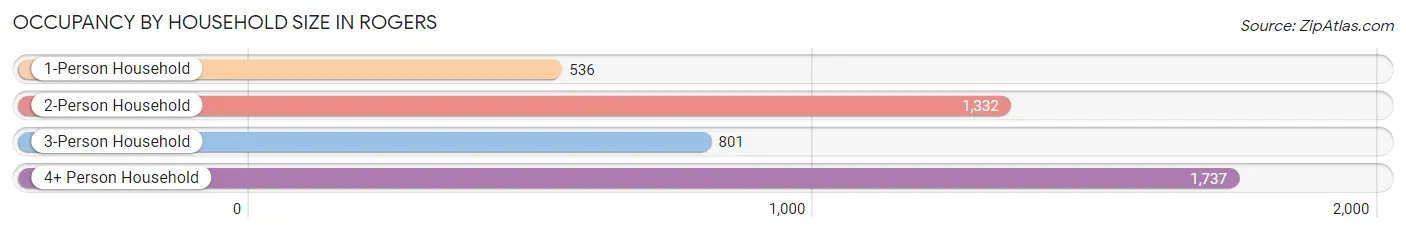
| Household Size | # Housing Units | % Housing Units |
| 1-Person Household | 536 | 12.2% |
| 2-Person Household | 1,332 | 30.2% |
| 3-Person Household | 801 | 18.2% |
| 4+ Person Household | 1,737 | 39.4% |
| Total Housing Units | 4,406 | 100.0% |
Occupancy by Ownership by Household Size in Rogers
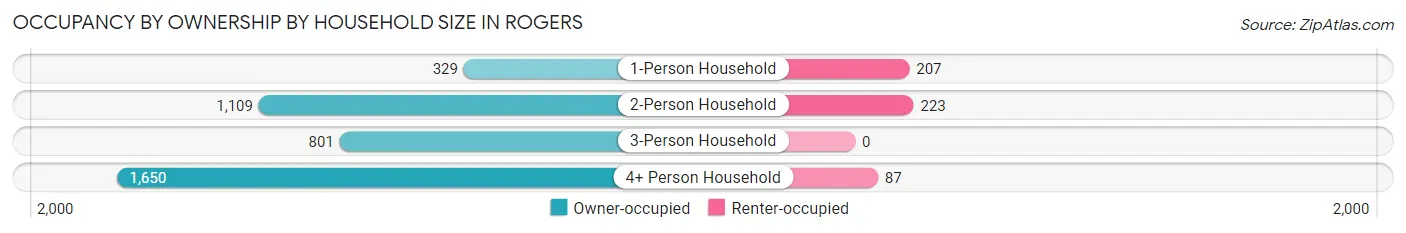
| Household Size | Owner-occupied | Renter-occupied |
| 1-Person Household | 329 (61.4%) | 207 (38.6%) |
| 2-Person Household | 1,109 (83.3%) | 223 (16.7%) |
| 3-Person Household | 801 (100.0%) | 0 (0.0%) |
| 4+ Person Household | 1,650 (95.0%) | 87 (5.0%) |
| Total Housing Units | 3,889 (88.3%) | 517 (11.7%) |
Occupancy by Educational Attainment in Rogers
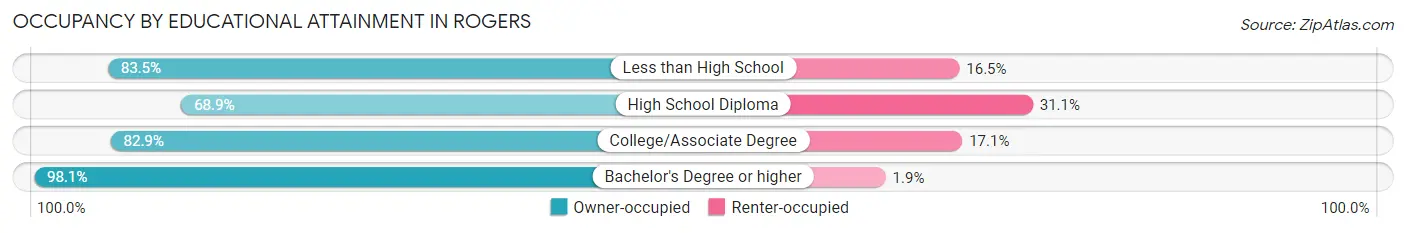
| Household Size | Owner-occupied | Renter-occupied |
| Less than High School | 86 (83.5%) | 17 (16.5%) |
| High School Diploma | 597 (68.9%) | 269 (31.1%) |
| College/Associate Degree | 909 (82.9%) | 187 (17.1%) |
| Bachelor's Degree or higher | 2,297 (98.1%) | 44 (1.9%) |
Occupancy by Age of Householder in Rogers
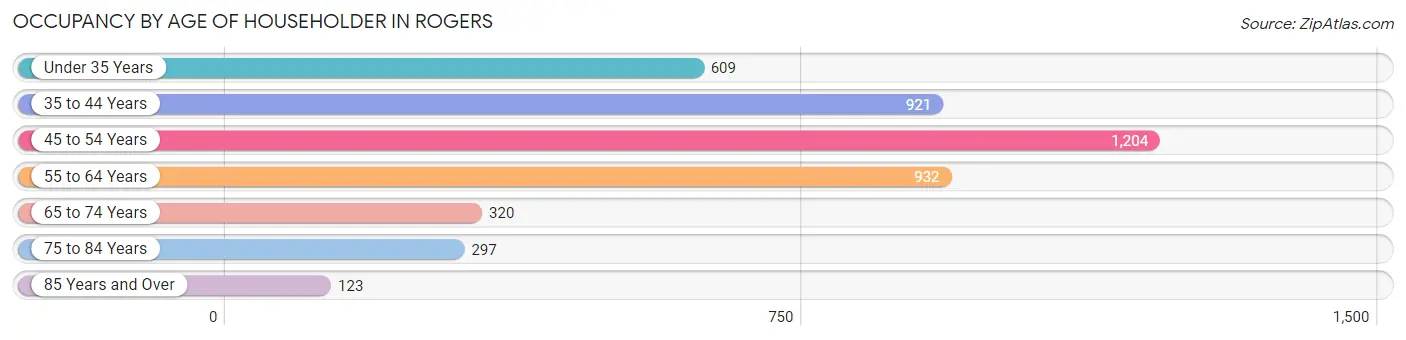
| Age Bracket | # Households | % Households |
| Under 35 Years | 609 | 13.8% |
| 35 to 44 Years | 921 | 20.9% |
| 45 to 54 Years | 1,204 | 27.3% |
| 55 to 64 Years | 932 | 21.1% |
| 65 to 74 Years | 320 | 7.3% |
| 75 to 84 Years | 297 | 6.7% |
| 85 Years and Over | 123 | 2.8% |
| Total | 4,406 | 100.0% |
Housing Finances in Rogers
Median Income by Occupancy in Rogers
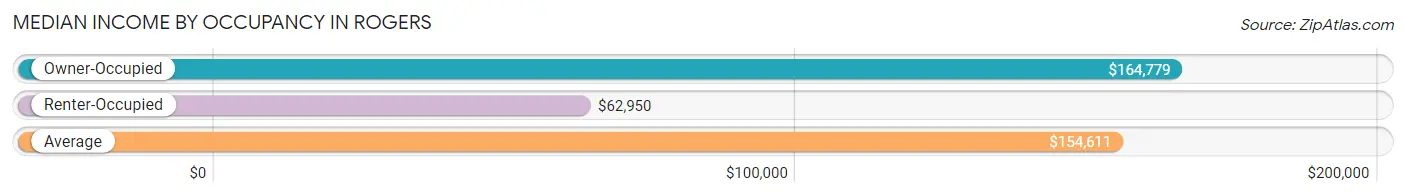
| Occupancy Type | # Households | Median Income |
| Owner-Occupied | 3,889 (88.3%) | $164,779 |
| Renter-Occupied | 517 (11.7%) | $62,950 |
| Average | 4,406 (100.0%) | $154,611 |
Occupancy by Householder Income Bracket in Rogers
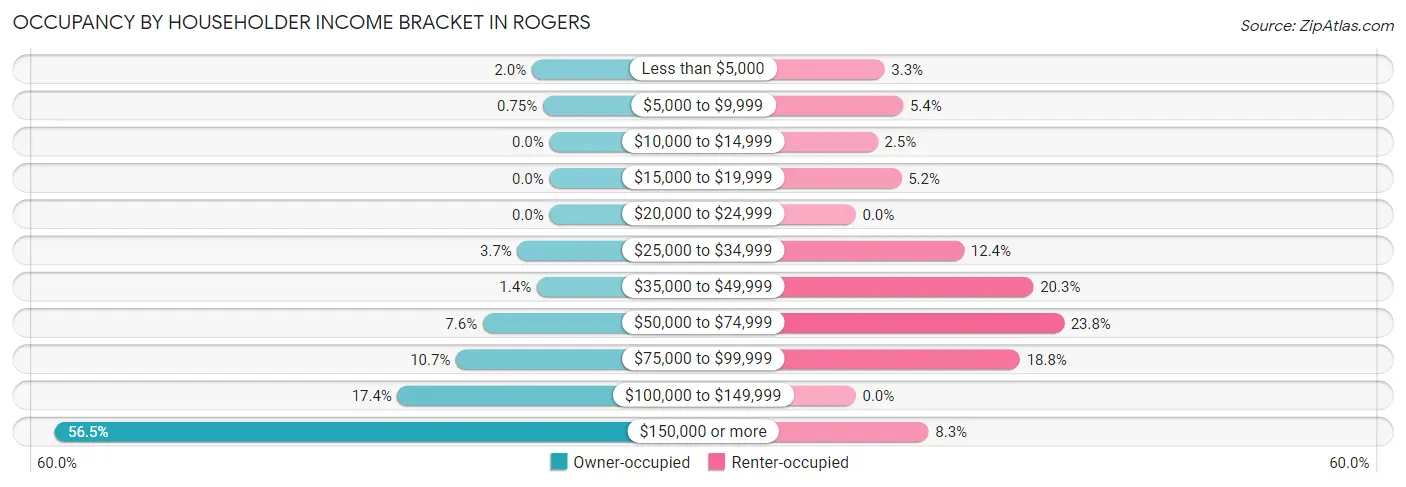
| Income Bracket | Owner-occupied | Renter-occupied |
| Less than $5,000 | 78 (2.0%) | 17 (3.3%) |
| $5,000 to $9,999 | 29 (0.7%) | 28 (5.4%) |
| $10,000 to $14,999 | 0 (0.0%) | 13 (2.5%) |
| $15,000 to $19,999 | 0 (0.0%) | 27 (5.2%) |
| $20,000 to $24,999 | 0 (0.0%) | 0 (0.0%) |
| $25,000 to $34,999 | 142 (3.6%) | 64 (12.4%) |
| $35,000 to $49,999 | 56 (1.4%) | 105 (20.3%) |
| $50,000 to $74,999 | 296 (7.6%) | 123 (23.8%) |
| $75,000 to $99,999 | 415 (10.7%) | 97 (18.8%) |
| $100,000 to $149,999 | 675 (17.4%) | 0 (0.0%) |
| $150,000 or more | 2,198 (56.5%) | 43 (8.3%) |
| Total | 3,889 (100.0%) | 517 (100.0%) |
Monthly Housing Cost Tiers in Rogers
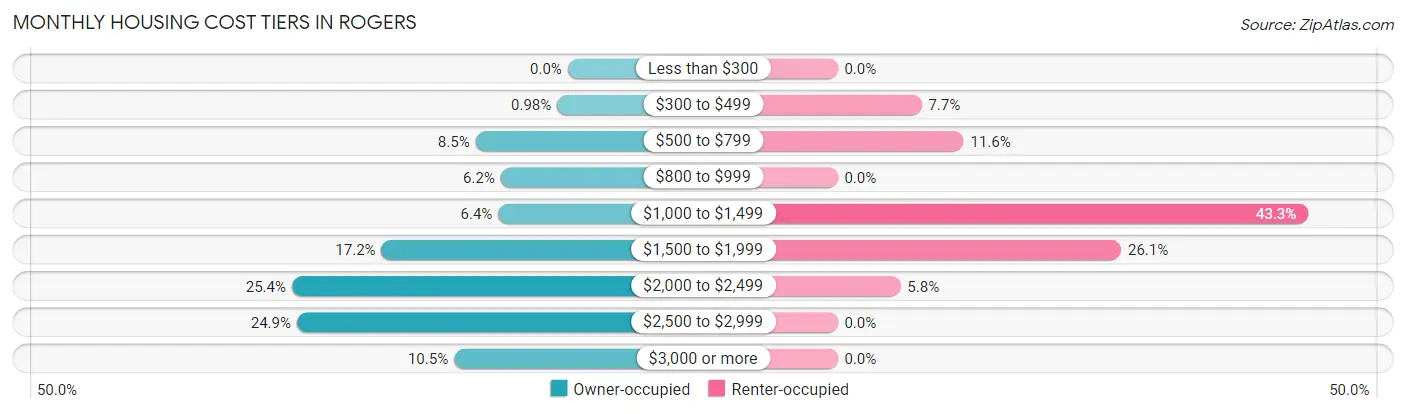
| Monthly Cost | Owner-occupied | Renter-occupied |
| Less than $300 | 0 (0.0%) | 0 (0.0%) |
| $300 to $499 | 38 (1.0%) | 40 (7.7%) |
| $500 to $799 | 330 (8.5%) | 60 (11.6%) |
| $800 to $999 | 240 (6.2%) | 0 (0.0%) |
| $1,000 to $1,499 | 249 (6.4%) | 224 (43.3%) |
| $1,500 to $1,999 | 667 (17.2%) | 135 (26.1%) |
| $2,000 to $2,499 | 988 (25.4%) | 30 (5.8%) |
| $2,500 to $2,999 | 970 (24.9%) | 0 (0.0%) |
| $3,000 or more | 407 (10.5%) | 0 (0.0%) |
| Total | 3,889 (100.0%) | 517 (100.0%) |
Physical Housing Characteristics in Rogers
Housing Structures in Rogers
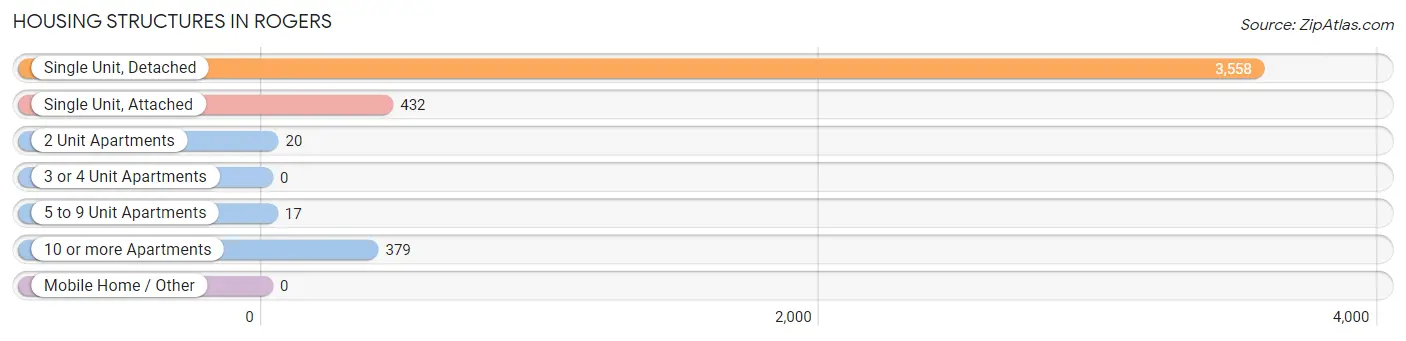
| Structure Type | # Housing Units | % Housing Units |
| Single Unit, Detached | 3,558 | 80.7% |
| Single Unit, Attached | 432 | 9.8% |
| 2 Unit Apartments | 20 | 0.4% |
| 3 or 4 Unit Apartments | 0 | 0.0% |
| 5 to 9 Unit Apartments | 17 | 0.4% |
| 10 or more Apartments | 379 | 8.6% |
| Mobile Home / Other | 0 | 0.0% |
| Total | 4,406 | 100.0% |
Housing Structures by Occupancy in Rogers
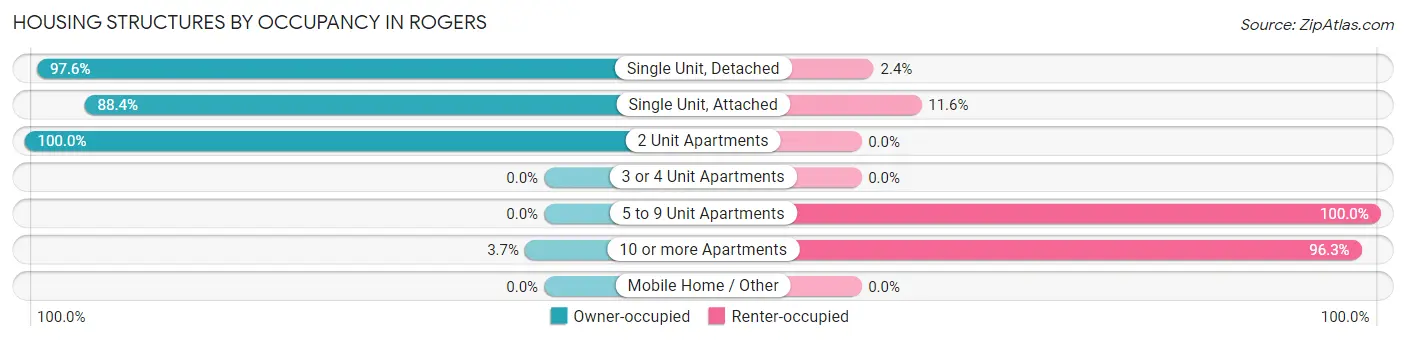
| Structure Type | Owner-occupied | Renter-occupied |
| Single Unit, Detached | 3,473 (97.6%) | 85 (2.4%) |
| Single Unit, Attached | 382 (88.4%) | 50 (11.6%) |
| 2 Unit Apartments | 20 (100.0%) | 0 (0.0%) |
| 3 or 4 Unit Apartments | 0 (0.0%) | 0 (0.0%) |
| 5 to 9 Unit Apartments | 0 (0.0%) | 17 (100.0%) |
| 10 or more Apartments | 14 (3.7%) | 365 (96.3%) |
| Mobile Home / Other | 0 (0.0%) | 0 (0.0%) |
| Total | 3,889 (88.3%) | 517 (11.7%) |
Housing Structures by Number of Rooms in Rogers
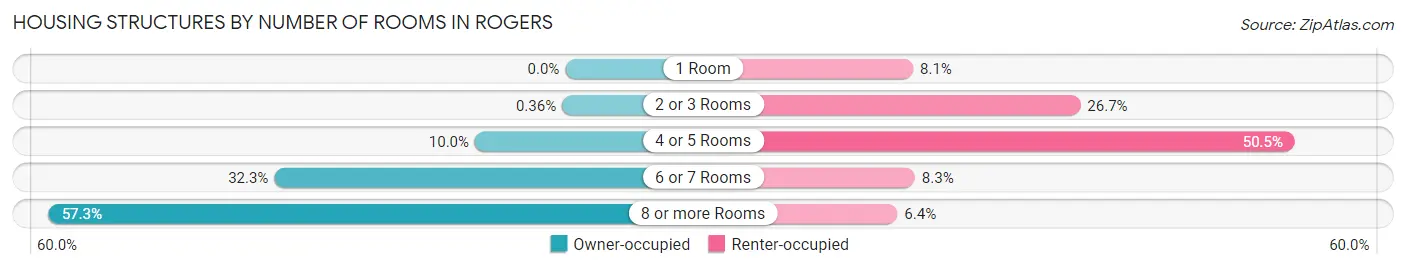
| Number of Rooms | Owner-occupied | Renter-occupied |
| 1 Room | 0 (0.0%) | 42 (8.1%) |
| 2 or 3 Rooms | 14 (0.4%) | 138 (26.7%) |
| 4 or 5 Rooms | 390 (10.0%) | 261 (50.5%) |
| 6 or 7 Rooms | 1,256 (32.3%) | 43 (8.3%) |
| 8 or more Rooms | 2,229 (57.3%) | 33 (6.4%) |
| Total | 3,889 (100.0%) | 517 (100.0%) |
Housing Structure by Heating Type in Rogers
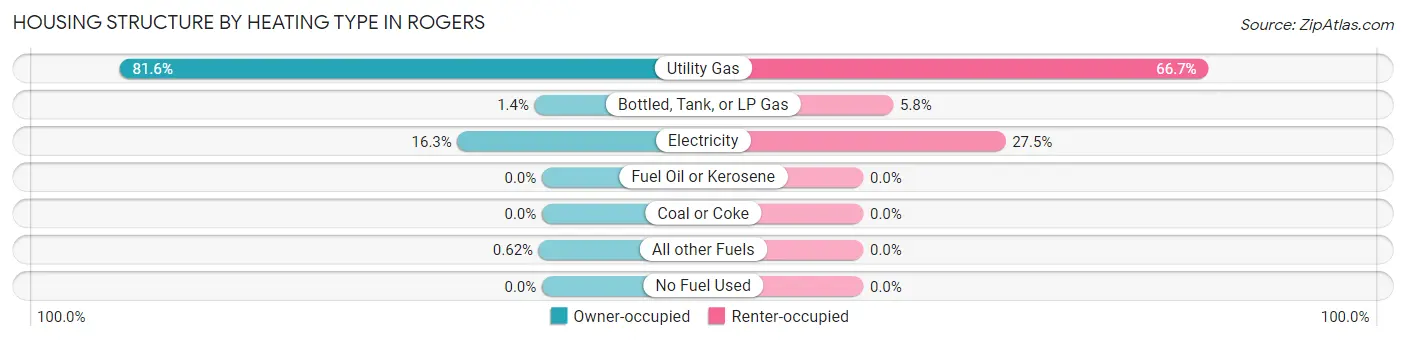
| Heating Type | Owner-occupied | Renter-occupied |
| Utility Gas | 3,175 (81.6%) | 345 (66.7%) |
| Bottled, Tank, or LP Gas | 55 (1.4%) | 30 (5.8%) |
| Electricity | 635 (16.3%) | 142 (27.5%) |
| Fuel Oil or Kerosene | 0 (0.0%) | 0 (0.0%) |
| Coal or Coke | 0 (0.0%) | 0 (0.0%) |
| All other Fuels | 24 (0.6%) | 0 (0.0%) |
| No Fuel Used | 0 (0.0%) | 0 (0.0%) |
| Total | 3,889 (100.0%) | 517 (100.0%) |
Household Vehicle Usage in Rogers
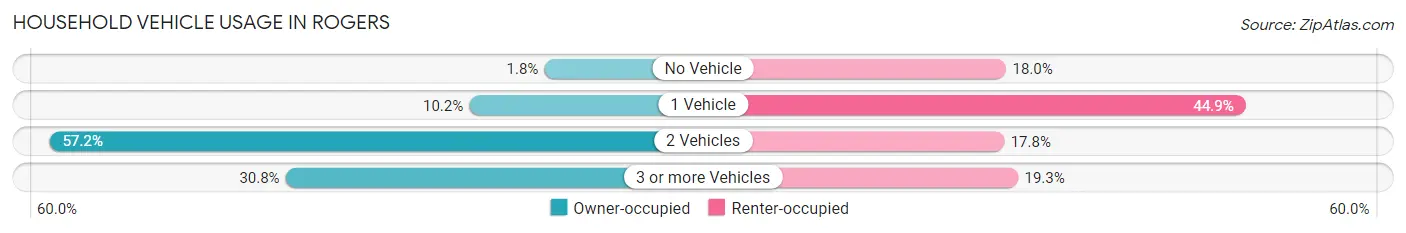
| Vehicles per Household | Owner-occupied | Renter-occupied |
| No Vehicle | 70 (1.8%) | 93 (18.0%) |
| 1 Vehicle | 397 (10.2%) | 232 (44.9%) |
| 2 Vehicles | 2,225 (57.2%) | 92 (17.8%) |
| 3 or more Vehicles | 1,197 (30.8%) | 100 (19.3%) |
| Total | 3,889 (100.0%) | 517 (100.0%) |
Real Estate & Mortgages in Rogers
Real Estate and Mortgage Overview in Rogers
| Characteristic | Without Mortgage | With Mortgage |
| Housing Units | 577 | 3,312 |
| Median Property Value | $374,900 | $416,800 |
| Median Household Income | $84,219 | $2,007 |
| Monthly Housing Costs | $755 | $407 |
| Real Estate Taxes | $3,836 | $21 |
Property Value by Mortgage Status in Rogers
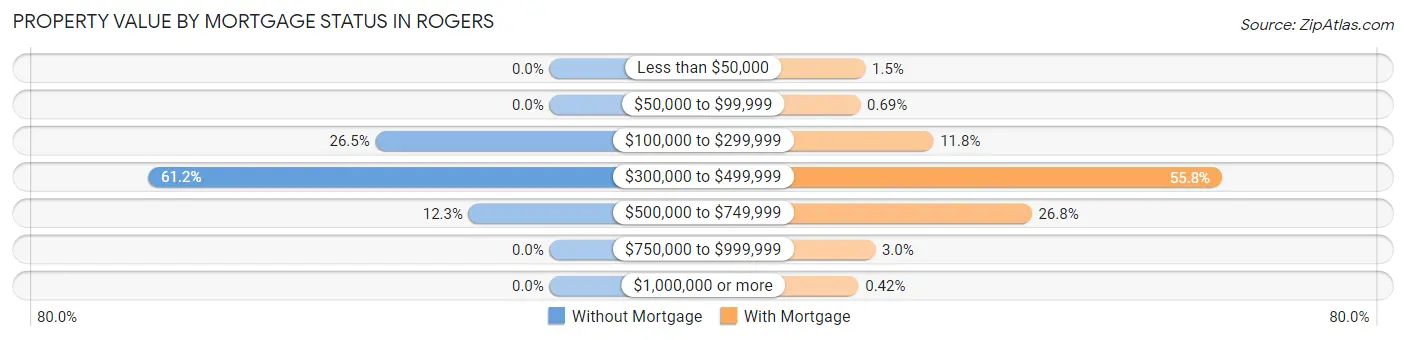
| Property Value | Without Mortgage | With Mortgage |
| Less than $50,000 | 0 (0.0%) | 48 (1.5%) |
| $50,000 to $99,999 | 0 (0.0%) | 23 (0.7%) |
| $100,000 to $299,999 | 153 (26.5%) | 392 (11.8%) |
| $300,000 to $499,999 | 353 (61.2%) | 1,849 (55.8%) |
| $500,000 to $749,999 | 71 (12.3%) | 888 (26.8%) |
| $750,000 to $999,999 | 0 (0.0%) | 98 (3.0%) |
| $1,000,000 or more | 0 (0.0%) | 14 (0.4%) |
| Total | 577 (100.0%) | 3,312 (100.0%) |
Household Income by Mortgage Status in Rogers
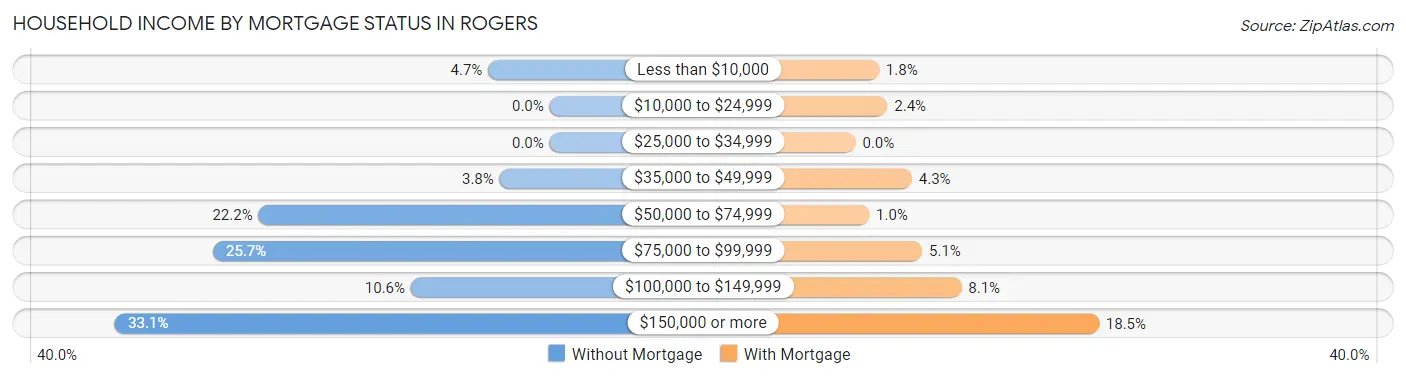
| Household Income | Without Mortgage | With Mortgage |
| Less than $10,000 | 27 (4.7%) | 59 (1.8%) |
| $10,000 to $24,999 | 0 (0.0%) | 80 (2.4%) |
| $25,000 to $34,999 | 0 (0.0%) | 0 (0.0%) |
| $35,000 to $49,999 | 22 (3.8%) | 142 (4.3%) |
| $50,000 to $74,999 | 128 (22.2%) | 34 (1.0%) |
| $75,000 to $99,999 | 148 (25.7%) | 168 (5.1%) |
| $100,000 to $149,999 | 61 (10.6%) | 267 (8.1%) |
| $150,000 or more | 191 (33.1%) | 614 (18.5%) |
| Total | 577 (100.0%) | 3,312 (100.0%) |
Property Value to Household Income Ratio in Rogers
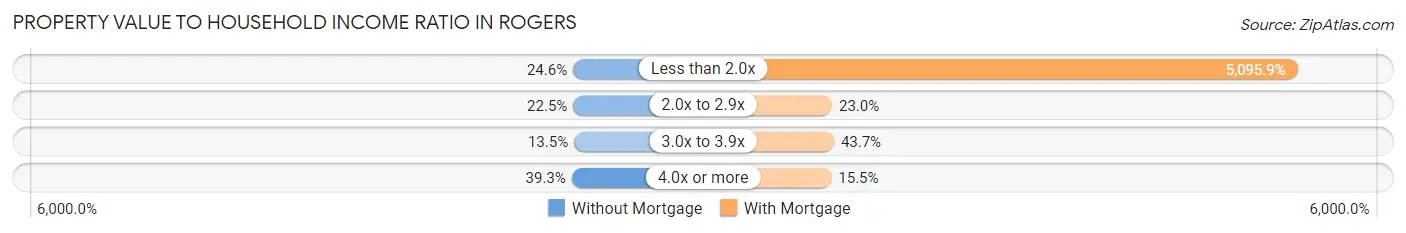
| Value-to-Income Ratio | Without Mortgage | With Mortgage |
| Less than 2.0x | 142 (24.6%) | 168,775 (5,095.9%) |
| 2.0x to 2.9x | 130 (22.5%) | 760 (23.0%) |
| 3.0x to 3.9x | 78 (13.5%) | 1,448 (43.7%) |
| 4.0x or more | 227 (39.3%) | 514 (15.5%) |
| Total | 577 (100.0%) | 3,312 (100.0%) |
Real Estate Taxes by Mortgage Status in Rogers
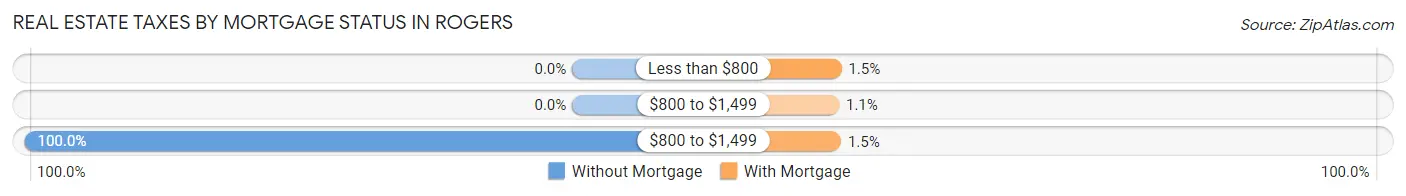
| Property Taxes | Without Mortgage | With Mortgage |
| Less than $800 | 0 (0.0%) | 51 (1.5%) |
| $800 to $1,499 | 0 (0.0%) | 36 (1.1%) |
| $800 to $1,499 | 577 (100.0%) | 48 (1.5%) |
| Total | 577 (100.0%) | 3,312 (100.0%) |
Health & Disability in Rogers
Health Insurance Coverage by Age in Rogers
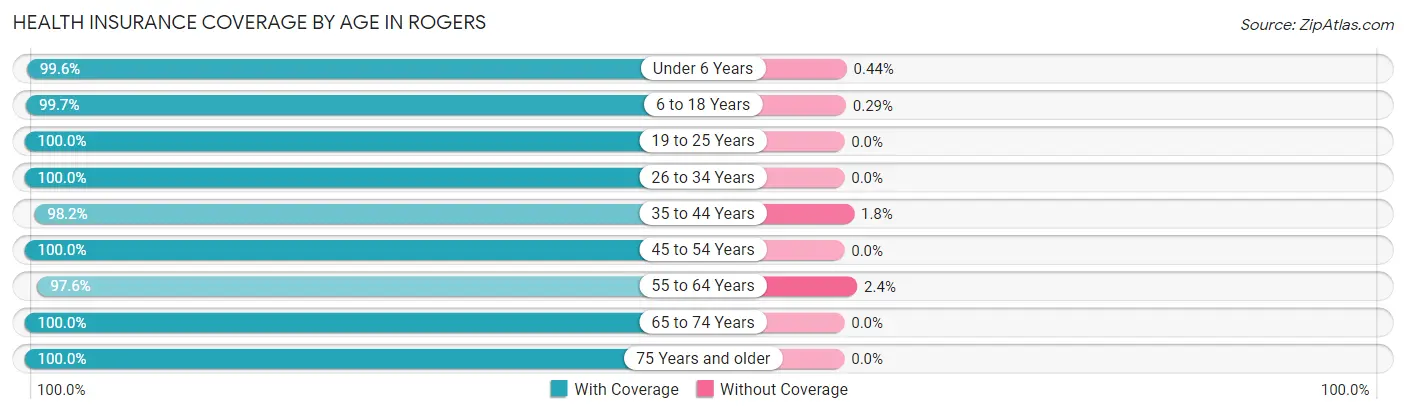
| Age Bracket | With Coverage | Without Coverage |
| Under 6 Years | 1,584 (99.6%) | 7 (0.4%) |
| 6 to 18 Years | 2,785 (99.7%) | 8 (0.3%) |
| 19 to 25 Years | 646 (100.0%) | 0 (0.0%) |
| 26 to 34 Years | 983 (100.0%) | 0 (0.0%) |
| 35 to 44 Years | 1,618 (98.2%) | 30 (1.8%) |
| 45 to 54 Years | 2,565 (100.0%) | 0 (0.0%) |
| 55 to 64 Years | 1,706 (97.6%) | 42 (2.4%) |
| 65 to 74 Years | 542 (100.0%) | 0 (0.0%) |
| 75 Years and older | 675 (100.0%) | 0 (0.0%) |
| Total | 13,104 (99.3%) | 87 (0.7%) |
Health Insurance Coverage by Citizenship Status in Rogers
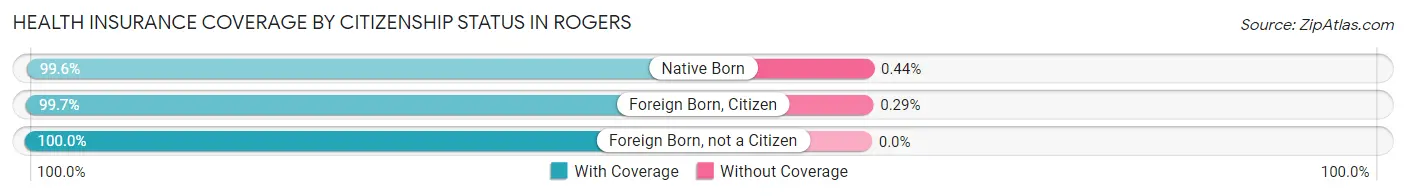
| Citizenship Status | With Coverage | Without Coverage |
| Native Born | 1,584 (99.6%) | 7 (0.4%) |
| Foreign Born, Citizen | 2,785 (99.7%) | 8 (0.3%) |
| Foreign Born, not a Citizen | 646 (100.0%) | 0 (0.0%) |
Health Insurance Coverage by Household Income in Rogers
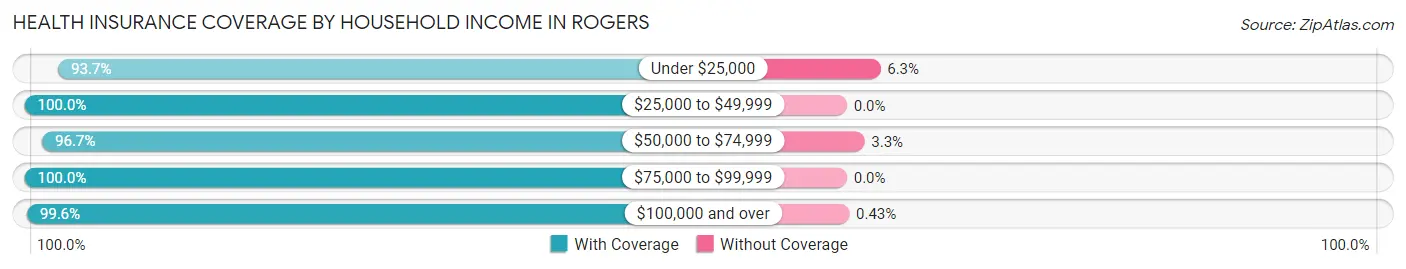
| Household Income | With Coverage | Without Coverage |
| Under $25,000 | 254 (93.7%) | 17 (6.3%) |
| $25,000 to $49,999 | 484 (100.0%) | 0 (0.0%) |
| $50,000 to $74,999 | 735 (96.7%) | 25 (3.3%) |
| $75,000 to $99,999 | 1,244 (100.0%) | 0 (0.0%) |
| $100,000 and over | 10,387 (99.6%) | 45 (0.4%) |
Public vs Private Health Insurance Coverage by Age in Rogers
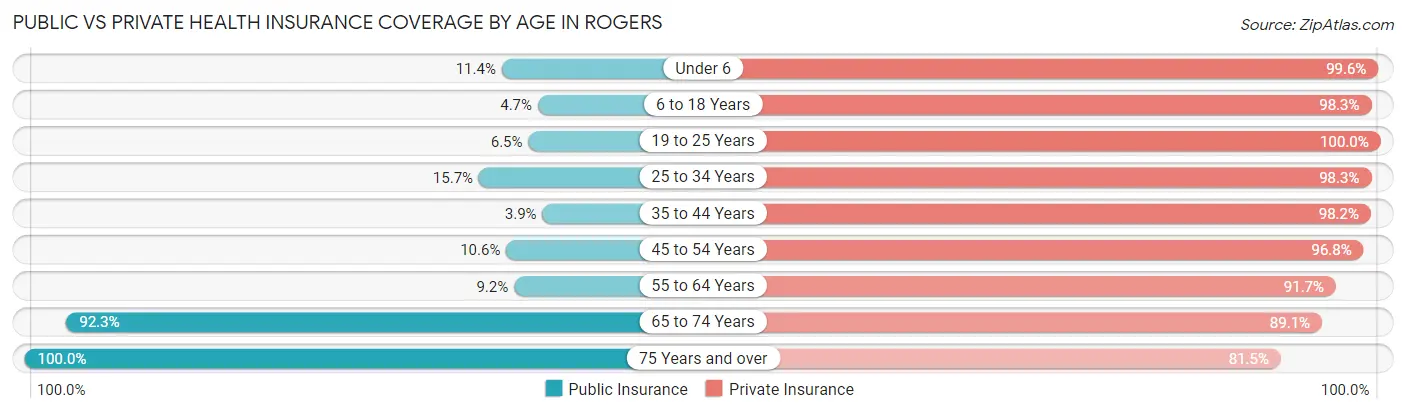
| Age Bracket | Public Insurance | Private Insurance |
| Under 6 | 182 (11.4%) | 1,584 (99.6%) |
| 6 to 18 Years | 132 (4.7%) | 2,745 (98.3%) |
| 19 to 25 Years | 42 (6.5%) | 646 (100.0%) |
| 25 to 34 Years | 154 (15.7%) | 966 (98.3%) |
| 35 to 44 Years | 64 (3.9%) | 1,618 (98.2%) |
| 45 to 54 Years | 272 (10.6%) | 2,484 (96.8%) |
| 55 to 64 Years | 160 (9.1%) | 1,603 (91.7%) |
| 65 to 74 Years | 500 (92.2%) | 483 (89.1%) |
| 75 Years and over | 675 (100.0%) | 550 (81.5%) |
| Total | 2,181 (16.5%) | 12,679 (96.1%) |
Disability Status by Sex by Age in Rogers
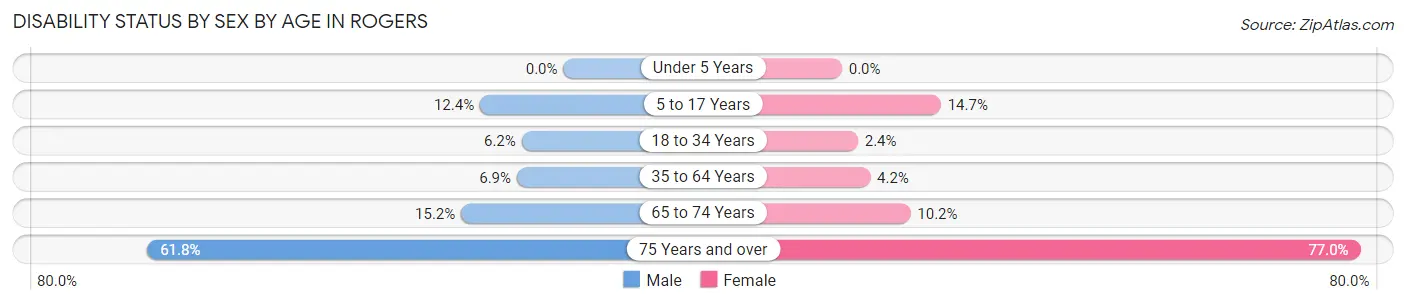
| Age Bracket | Male | Female |
| Under 5 Years | 0 (0.0%) | 0 (0.0%) |
| 5 to 17 Years | 200 (12.4%) | 198 (14.7%) |
| 18 to 34 Years | 65 (6.2%) | 18 (2.4%) |
| 35 to 64 Years | 201 (6.9%) | 128 (4.2%) |
| 65 to 74 Years | 39 (15.2%) | 29 (10.2%) |
| 75 Years and over | 186 (61.8%) | 288 (77.0%) |
Disability Class by Sex by Age in Rogers
Disability Class: Hearing Difficulty
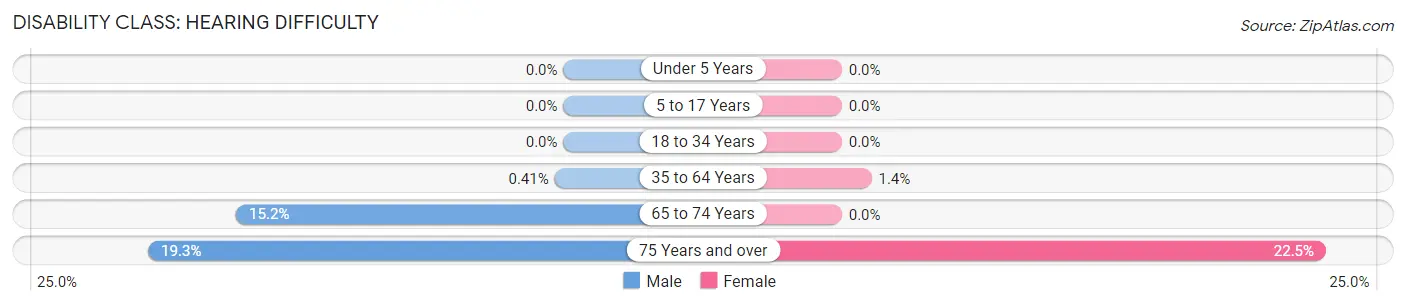
| Age Bracket | Male | Female |
| Under 5 Years | 0 (0.0%) | 0 (0.0%) |
| 5 to 17 Years | 0 (0.0%) | 0 (0.0%) |
| 18 to 34 Years | 0 (0.0%) | 0 (0.0%) |
| 35 to 64 Years | 12 (0.4%) | 42 (1.4%) |
| 65 to 74 Years | 39 (15.2%) | 0 (0.0%) |
| 75 Years and over | 58 (19.3%) | 84 (22.5%) |
Disability Class: Vision Difficulty
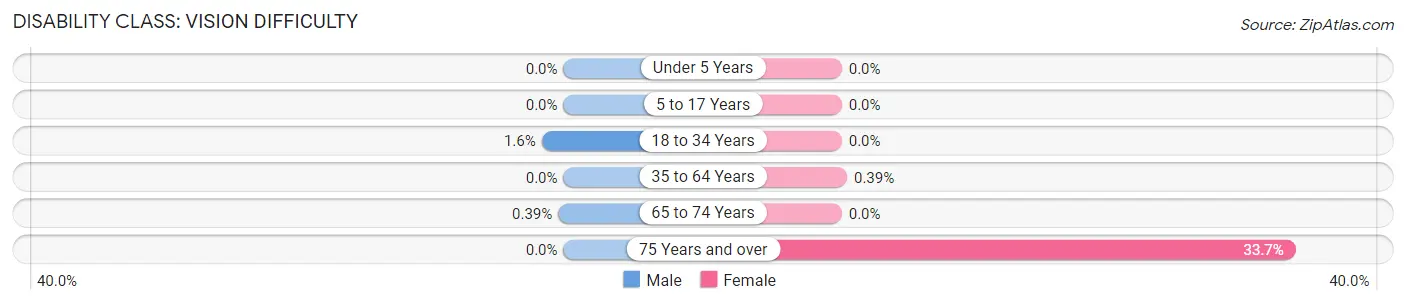
| Age Bracket | Male | Female |
| Under 5 Years | 0 (0.0%) | 0 (0.0%) |
| 5 to 17 Years | 0 (0.0%) | 0 (0.0%) |
| 18 to 34 Years | 17 (1.6%) | 0 (0.0%) |
| 35 to 64 Years | 0 (0.0%) | 12 (0.4%) |
| 65 to 74 Years | 1 (0.4%) | 0 (0.0%) |
| 75 Years and over | 0 (0.0%) | 126 (33.7%) |
Disability Class: Cognitive Difficulty
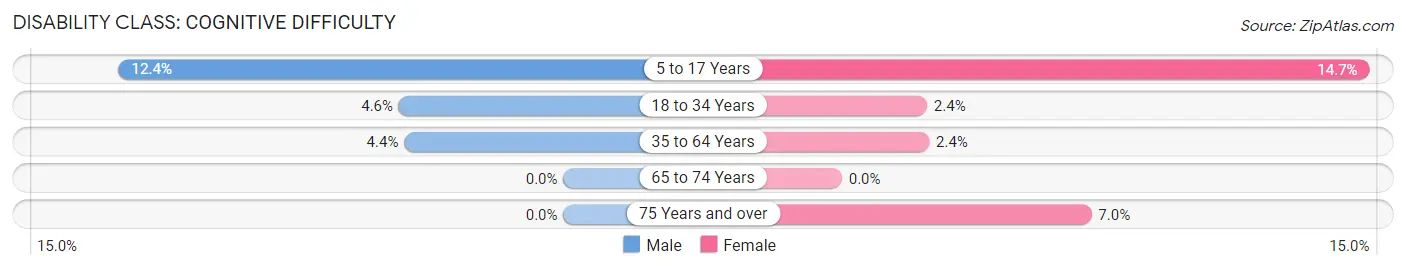
| Age Bracket | Male | Female |
| 5 to 17 Years | 200 (12.4%) | 198 (14.7%) |
| 18 to 34 Years | 48 (4.6%) | 18 (2.4%) |
| 35 to 64 Years | 129 (4.4%) | 74 (2.4%) |
| 65 to 74 Years | 0 (0.0%) | 0 (0.0%) |
| 75 Years and over | 0 (0.0%) | 26 (7.0%) |
Disability Class: Ambulatory Difficulty
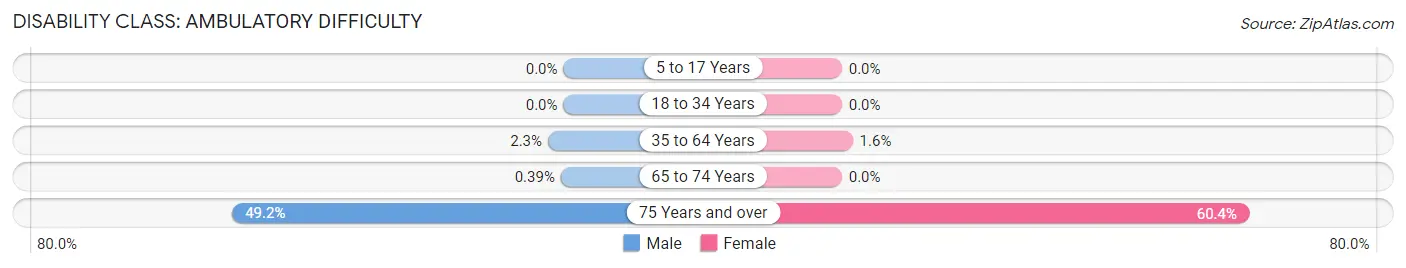
| Age Bracket | Male | Female |
| 5 to 17 Years | 0 (0.0%) | 0 (0.0%) |
| 18 to 34 Years | 0 (0.0%) | 0 (0.0%) |
| 35 to 64 Years | 67 (2.3%) | 49 (1.6%) |
| 65 to 74 Years | 1 (0.4%) | 0 (0.0%) |
| 75 Years and over | 148 (49.2%) | 226 (60.4%) |
Disability Class: Self-Care Difficulty
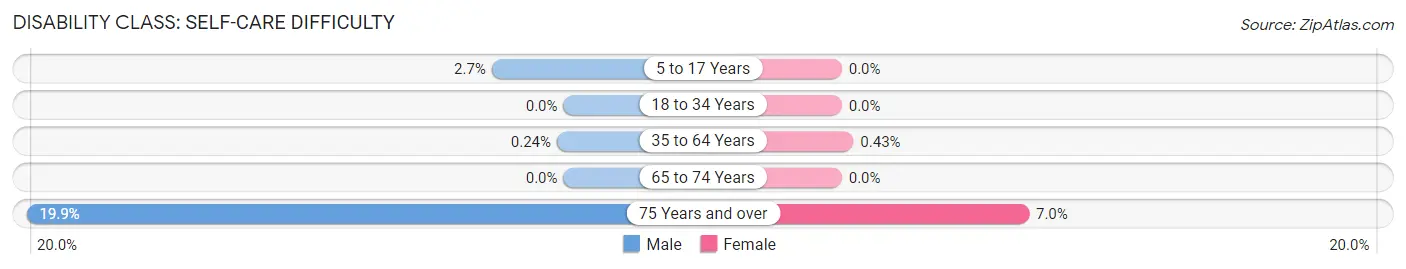
| Age Bracket | Male | Female |
| 5 to 17 Years | 43 (2.7%) | 0 (0.0%) |
| 18 to 34 Years | 0 (0.0%) | 0 (0.0%) |
| 35 to 64 Years | 7 (0.2%) | 13 (0.4%) |
| 65 to 74 Years | 0 (0.0%) | 0 (0.0%) |
| 75 Years and over | 60 (19.9%) | 26 (7.0%) |
Technology Access in Rogers
Computing Device Access in Rogers
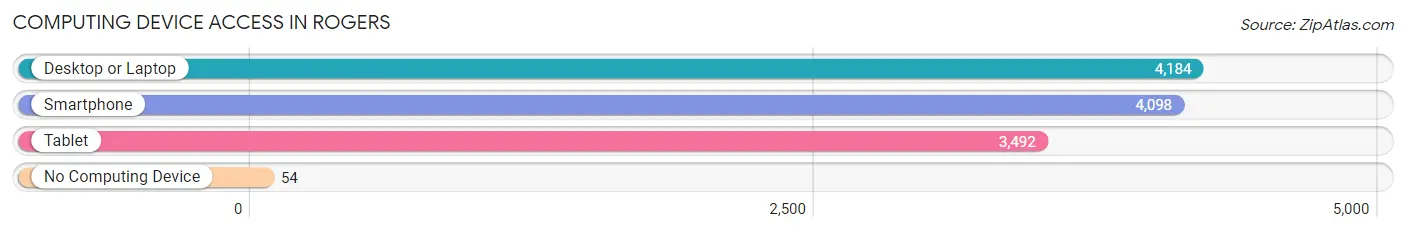
| Device Type | # Households | % Households |
| Desktop or Laptop | 4,184 | 95.0% |
| Smartphone | 4,098 | 93.0% |
| Tablet | 3,492 | 79.3% |
| No Computing Device | 54 | 1.2% |
| Total | 4,406 | 100.0% |
Internet Access in Rogers
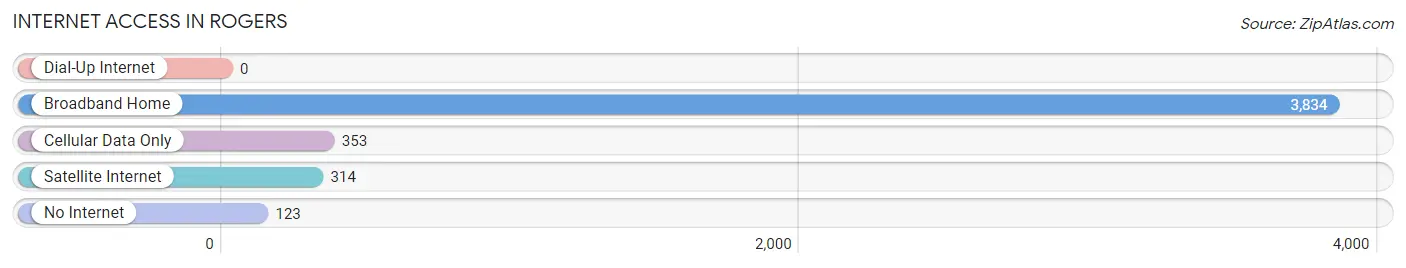
| Internet Type | # Households | % Households |
| Dial-Up Internet | 0 | 0.0% |
| Broadband Home | 3,834 | 87.0% |
| Cellular Data Only | 353 | 8.0% |
| Satellite Internet | 314 | 7.1% |
| No Internet | 123 | 2.8% |
| Total | 4,406 | 100.0% |
Rogers Summary
Rogers, Minnesota is a city located in Hennepin County, Minnesota, United States. The population was 8,597 at the 2010 census. The city is located on the north side of the Mississippi River, just north of Minneapolis.
History
The area that is now Rogers was first settled in 1855 by a group of settlers from New England. The settlers named the area after the Rogers family, who had settled in the area in 1854. The Rogers family was one of the first families to settle in the area, and the city was named after them.
The city of Rogers was officially incorporated in 1887. At the time, the city was a small farming community, with a population of just over 500 people. The city grew slowly over the next few decades, and by the 1950s, the population had grown to over 1,000 people.
In the 1960s, the city began to experience rapid growth, as the population increased to over 5,000 people. This growth was due to the city's proximity to Minneapolis, as well as the development of the Twin Cities Metropolitan Area.
Geography
Rogers is located in Hennepin County, Minnesota, United States. The city is located on the north side of the Mississippi River, just north of Minneapolis. The city is bordered by the cities of Maple Grove to the north, Osseo to the east, and Corcoran to the south.
The city has a total area of 8.2 square miles, of which 8.1 square miles is land and 0.1 square miles is water. The city is located in the Central Lakes region of Minnesota, and is part of the Twin Cities Metropolitan Area.
Economy
The economy of Rogers is largely based on the service industry. The city is home to several large employers, including Target Corporation, Best Buy, and the University of Minnesota. The city also has a number of small businesses, including restaurants, retail stores, and professional services.
The city is also home to several industrial parks, which are home to a variety of manufacturing and distribution companies. The city is also home to a number of technology companies, including Microsoft, Oracle, and IBM.
Demographics
As of the 2010 census, the population of Rogers was 8,597. The racial makeup of the city was 87.3% White, 5.2% African American, 0.5% Native American, 2.3% Asian, 0.1% Pacific Islander, 1.7% from other races, and 3.0% from two or more races. Hispanic or Latino of any race were 4.2% of the population.
The median income for a household in the city was $60,945, and the median income for a family was $71,945. The per capita income for the city was $27,945. About 4.2% of families and 5.7% of the population were below the poverty line, including 6.3% of those under age 18 and 4.2% of those age 65 or over.
Common Questions
What is Per Capita Income in Rogers?
Per Capita income in Rogers is $54,080.
What is the Median Family Income in Rogers?
Median Family Income in Rogers is $164,009.
What is the Median Household income in Rogers?
Median Household Income in Rogers is $154,611.
What is Income or Wage Gap in Rogers?
Income or Wage Gap in Rogers is 29.7%.
Women in Rogers earn 70.3 cents for every dollar earned by a man.
What is Inequality or Gini Index in Rogers?
Inequality or Gini Index in Rogers is 0.36.
What is the Total Population of Rogers?
Total Population of Rogers is 13,283.
What is the Total Male Population of Rogers?
Total Male Population of Rogers is 6,710.
What is the Total Female Population of Rogers?
Total Female Population of Rogers is 6,573.
What is the Ratio of Males per 100 Females in Rogers?
There are 102.08 Males per 100 Females in Rogers.
What is the Ratio of Females per 100 Males in Rogers?
There are 97.96 Females per 100 Males in Rogers.
What is the Median Population Age in Rogers?
Median Population Age in Rogers is 37.2 Years.
What is the Average Family Size in Rogers
Average Family Size in Rogers is 3.3 People.
What is the Average Household Size in Rogers
Average Household Size in Rogers is 3.0 People.
How Large is the Labor Force in Rogers?
There are 7,006 People in the Labor Forcein in Rogers.
What is the Percentage of People in the Labor Force in Rogers?
72.8% of People are in the Labor Force in Rogers.
What is the Unemployment Rate in Rogers?
Unemployment Rate in Rogers is 1.3%.