Rush City, MN Map & Demographics
Rush City Map
Rush City Overview
$24,742
PER CAPITA INCOME
$65,750
AVG FAMILY INCOME
$56,436
AVG HOUSEHOLD INCOME
38.0%
WAGE / INCOME GAP [ % ]
62.0¢/ $1
WAGE / INCOME GAP [ $ ]
0.41
INEQUALITY / GINI INDEX
3,239
TOTAL POPULATION
2,067
MALE POPULATION
1,172
FEMALE POPULATION
176.37
MALES / 100 FEMALES
56.70
FEMALES / 100 MALES
35.9
MEDIAN AGE
2.9
AVG FAMILY SIZE
2.3
AVG HOUSEHOLD SIZE
1,370
LABOR FORCE [ PEOPLE ]
49.4%
PERCENT IN LABOR FORCE
5.6%
UNEMPLOYMENT RATE
Rush City Zip Codes
Rush City Area Codes
Income in Rush City
Income Overview in Rush City
Per Capita Income in Rush City is $24,742, while median incomes of families and households are $65,750 and $56,436 respectively.
| Characteristic | Number | Measure |
| Per Capita Income | 3,239 | $24,742 |
| Median Family Income | 613 | $65,750 |
| Mean Family Income | 613 | $85,947 |
| Median Household Income | 1,011 | $56,436 |
| Mean Household Income | 1,011 | $72,699 |
| Income Deficit | 613 | $0 |
| Wage / Income Gap (%) | 3,239 | 38.00% |
| Wage / Income Gap ($) | 3,239 | 62.00¢ per $1 |
| Gini / Inequality Index | 3,239 | 0.41 |
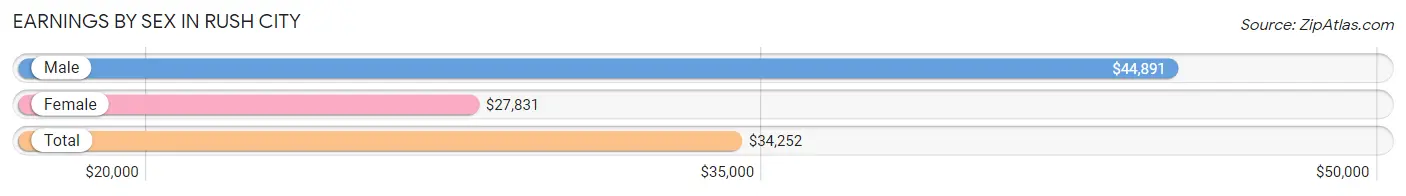
Earnings by Sex in Rush City
Average Earnings in Rush City are $34,252, $44,891 for men and $27,831 for women, a difference of 38.0%.
| Sex | Number | Average Earnings |
| Male | 948 (56.3%) | $44,891 |
| Female | 735 (43.7%) | $27,831 |
| Total | 1,683 (100.0%) | $34,252 |
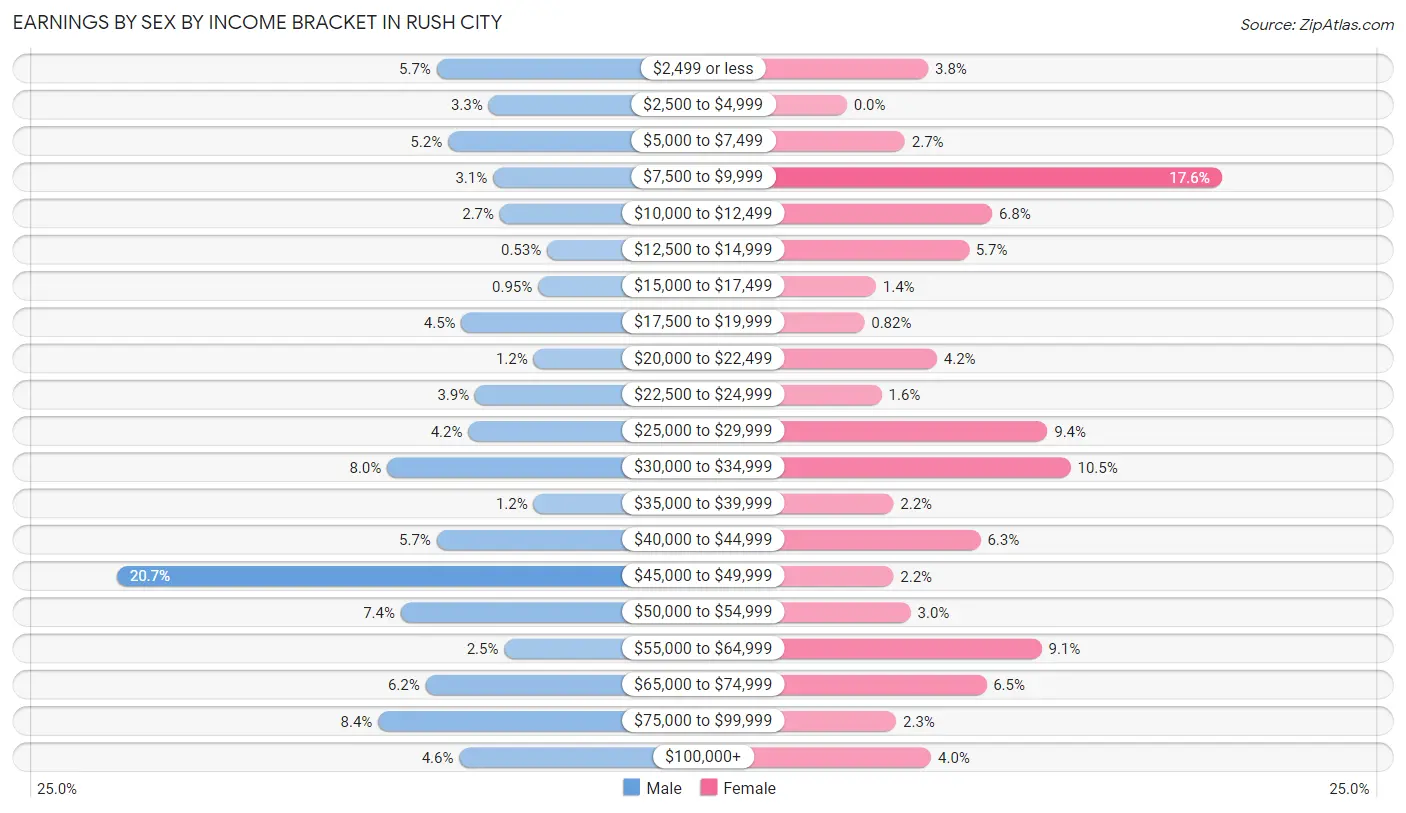
Earnings by Sex by Income Bracket in Rush City
The most common earnings brackets in Rush City are $45,000 to $49,999 for men (196 | 20.7%) and $7,500 to $9,999 for women (129 | 17.5%).
| Income | Male | Female |
| $2,499 or less | 54 (5.7%) | 28 (3.8%) |
| $2,500 to $4,999 | 31 (3.3%) | 0 (0.0%) |
| $5,000 to $7,499 | 49 (5.2%) | 20 (2.7%) |
| $7,500 to $9,999 | 29 (3.1%) | 129 (17.5%) |
| $10,000 to $12,499 | 26 (2.7%) | 50 (6.8%) |
| $12,500 to $14,999 | 5 (0.5%) | 42 (5.7%) |
| $15,000 to $17,499 | 9 (0.9%) | 10 (1.4%) |
| $17,500 to $19,999 | 43 (4.5%) | 6 (0.8%) |
| $20,000 to $22,499 | 11 (1.2%) | 31 (4.2%) |
| $22,500 to $24,999 | 37 (3.9%) | 12 (1.6%) |
| $25,000 to $29,999 | 40 (4.2%) | 69 (9.4%) |
| $30,000 to $34,999 | 76 (8.0%) | 77 (10.5%) |
| $35,000 to $39,999 | 11 (1.2%) | 16 (2.2%) |
| $40,000 to $44,999 | 54 (5.7%) | 46 (6.3%) |
| $45,000 to $49,999 | 196 (20.7%) | 16 (2.2%) |
| $50,000 to $54,999 | 70 (7.4%) | 22 (3.0%) |
| $55,000 to $64,999 | 24 (2.5%) | 67 (9.1%) |
| $65,000 to $74,999 | 59 (6.2%) | 48 (6.5%) |
| $75,000 to $99,999 | 80 (8.4%) | 17 (2.3%) |
| $100,000+ | 44 (4.6%) | 29 (4.0%) |
| Total | 948 (100.0%) | 735 (100.0%) |
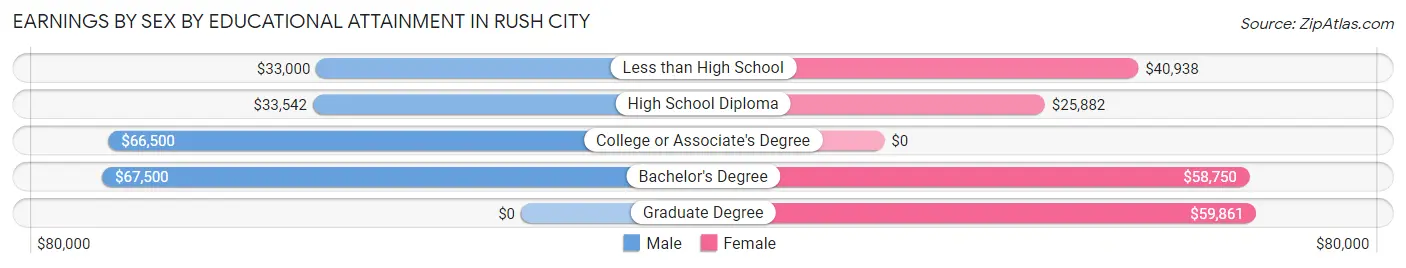
Earnings by Sex by Educational Attainment in Rush City
Average earnings in Rush City are $45,000 for men and $29,044 for women, a difference of 35.5%. Men with an educational attainment of bachelor's degree enjoy the highest average annual earnings of $67,500, while those with less than high school education earn the least with $33,000. Women with an educational attainment of graduate degree earn the most with the average annual earnings of $59,861, while those with high school diploma education have the smallest earnings of $25,882.
| Educational Attainment | Male Income | Female Income |
| Less than High School | $33,000 | $40,938 |
| High School Diploma | $33,542 | $25,882 |
| College or Associate's Degree | $66,500 | $0 |
| Bachelor's Degree | $67,500 | $58,750 |
| Graduate Degree | - | - |
| Total | $45,000 | $29,044 |
Family Income in Rush City
Family Income Brackets in Rush City
According to the Rush City family income data, there are 204 families falling into the $50,000 to $74,999 income range, which is the most common income bracket and makes up 33.3% of all families. Conversely, the $10,000 to $14,999 income bracket is the least frequent group with only 4 families (0.6%) belonging to this category.
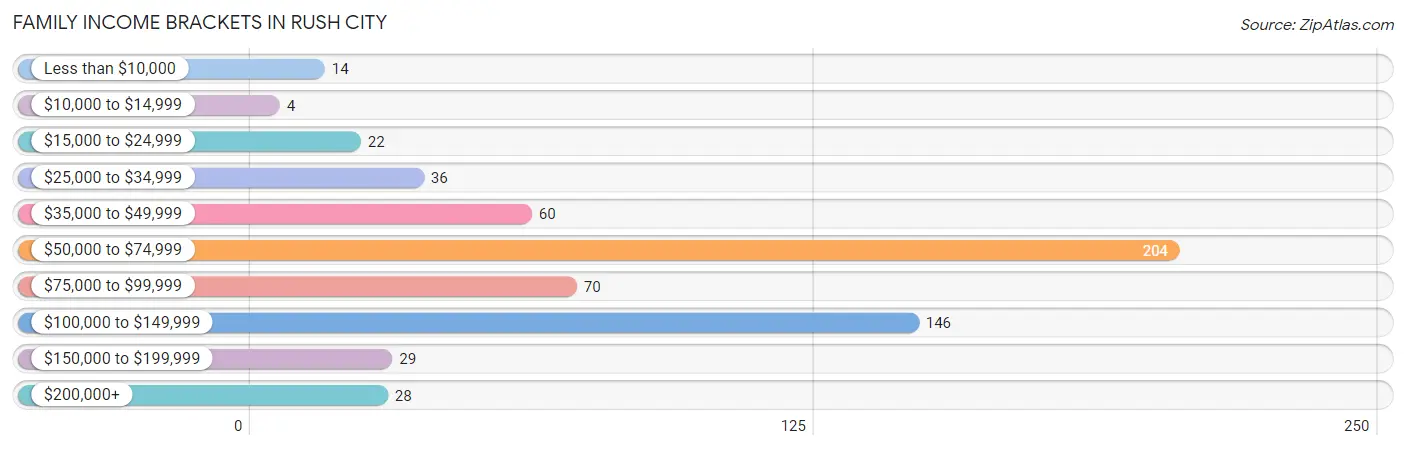
| Income Bracket | # Families | % Families |
| Less than $10,000 | 14 | 2.3% |
| $10,000 to $14,999 | 4 | 0.7% |
| $15,000 to $24,999 | 22 | 3.6% |
| $25,000 to $34,999 | 36 | 5.9% |
| $35,000 to $49,999 | 60 | 9.8% |
| $50,000 to $74,999 | 204 | 33.3% |
| $75,000 to $99,999 | 70 | 11.4% |
| $100,000 to $149,999 | 146 | 23.8% |
| $150,000 to $199,999 | 29 | 4.7% |
| $200,000+ | 28 | 4.6% |
Family Income by Famaliy Size in Rush City
6-person families (36 | 5.9%) account for the highest median family income in Rush City with $116,324 per family, while 3-person families (112 | 18.3%) have the highest median income of $30,417 per family member.
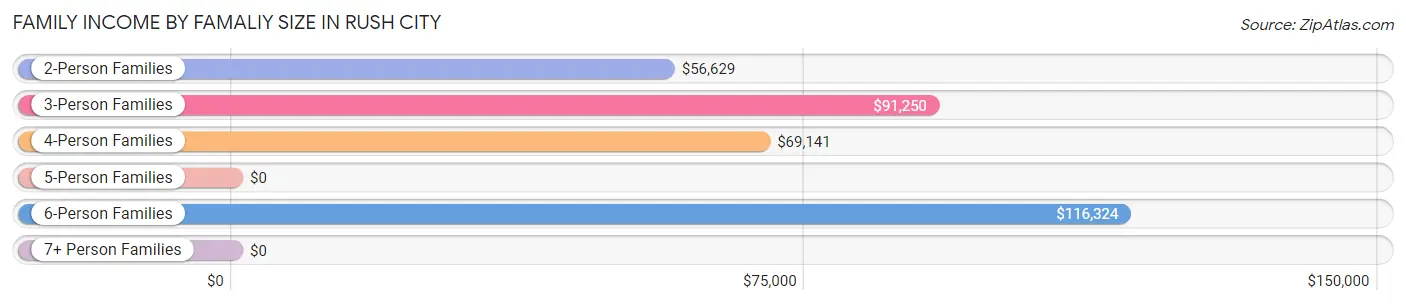
| Income Bracket | # Families | Median Income |
| 2-Person Families | 341 (55.6%) | $56,629 |
| 3-Person Families | 112 (18.3%) | $91,250 |
| 4-Person Families | 99 (16.2%) | $69,141 |
| 5-Person Families | 8 (1.3%) | $0 |
| 6-Person Families | 36 (5.9%) | $116,324 |
| 7+ Person Families | 17 (2.8%) | $0 |
| Total | 613 (100.0%) | $65,750 |
Family Income by Number of Earners in Rush City
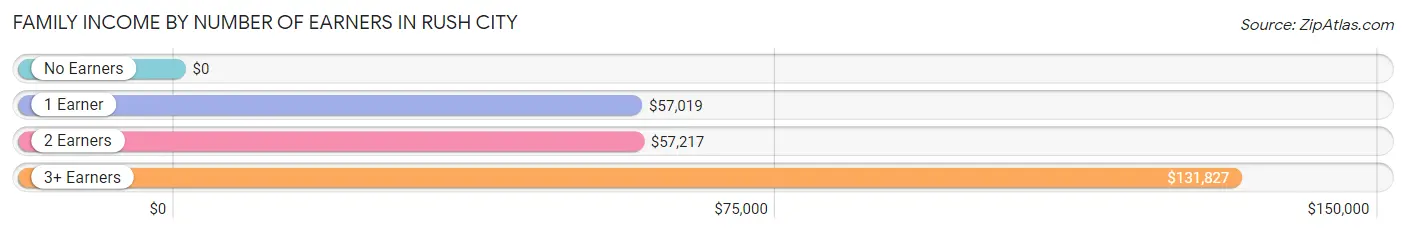
| Number of Earners | # Families | Median Income |
| No Earners | 39 (6.4%) | $0 |
| 1 Earner | 201 (32.8%) | $57,019 |
| 2 Earners | 306 (49.9%) | $57,217 |
| 3+ Earners | 67 (10.9%) | $131,827 |
| Total | 613 (100.0%) | $65,750 |
Household Income in Rush City
Household Income Brackets in Rush City
With 220 households falling in the category, the $50,000 to $74,999 income range is the most frequent in Rush City, accounting for 21.8% of all households. In contrast, only 26 households (2.6%) fall into the $15,000 to $24,999 income bracket, making it the least populous group.
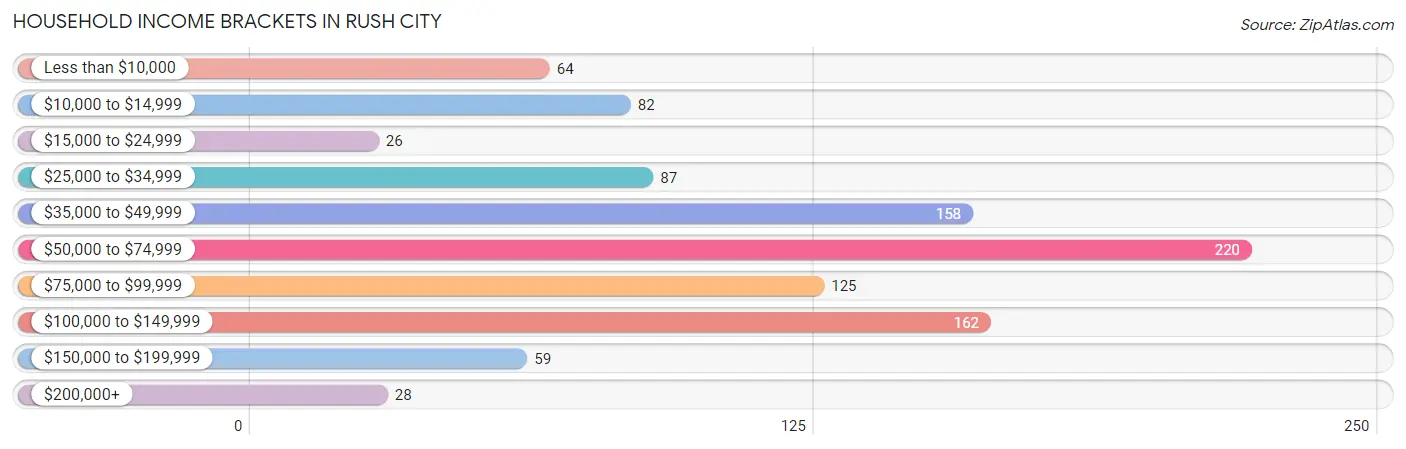
| Income Bracket | # Households | % Households |
| Less than $10,000 | 64 | 6.3% |
| $10,000 to $14,999 | 82 | 8.1% |
| $15,000 to $24,999 | 26 | 2.6% |
| $25,000 to $34,999 | 87 | 8.6% |
| $35,000 to $49,999 | 158 | 15.6% |
| $50,000 to $74,999 | 220 | 21.8% |
| $75,000 to $99,999 | 125 | 12.4% |
| $100,000 to $149,999 | 162 | 16.0% |
| $150,000 to $199,999 | 59 | 5.8% |
| $200,000+ | 28 | 2.8% |
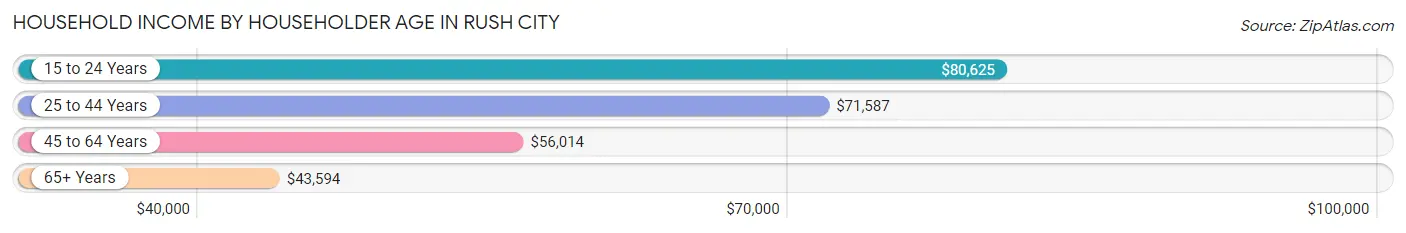
Household Income by Householder Age in Rush City
The median household income in Rush City is $56,436, with the highest median household income of $80,625 found in the 15 to 24 years age bracket for the primary householder. A total of 68 households (6.7%) fall into this category. Meanwhile, the 65+ years age bracket for the primary householder has the lowest median household income of $43,594, with 150 households (14.8%) in this group.
| Income Bracket | # Households | Median Income |
| 15 to 24 Years | 68 (6.7%) | $80,625 |
| 25 to 44 Years | 273 (27.0%) | $71,587 |
| 45 to 64 Years | 520 (51.4%) | $56,014 |
| 65+ Years | 150 (14.8%) | $43,594 |
| Total | 1,011 (100.0%) | $56,436 |
Poverty in Rush City
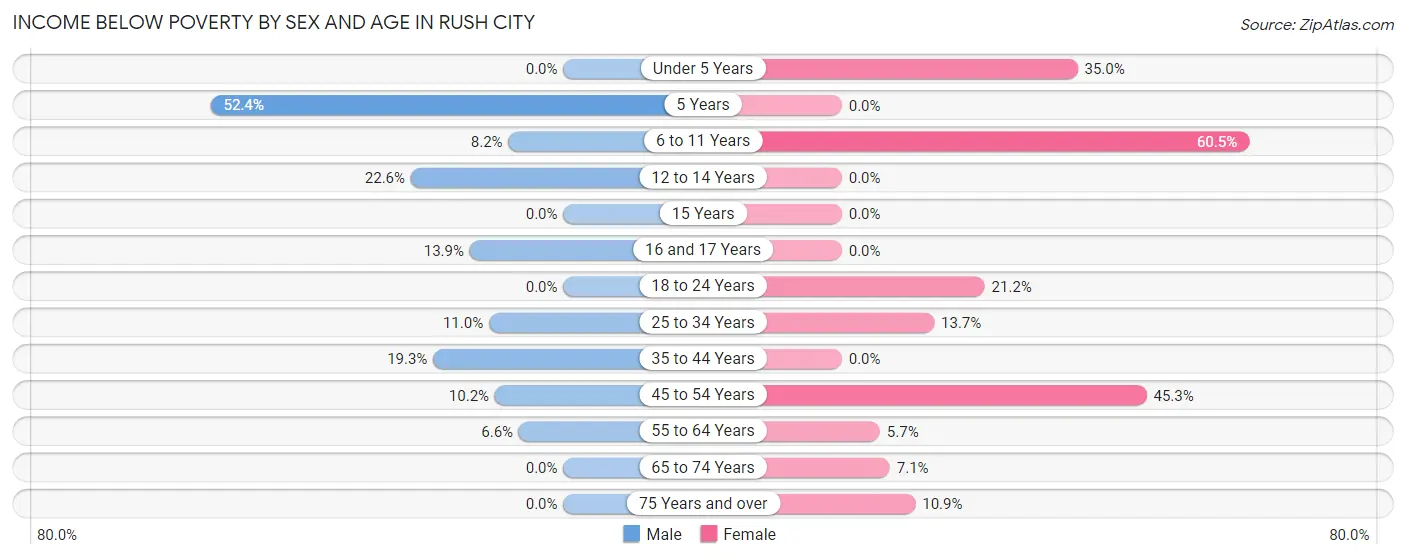
Income Below Poverty by Sex and Age in Rush City
With 9.3% poverty level for males and 20.0% for females among the residents of Rush City, 5 year old males and 6 to 11 year old females are the most vulnerable to poverty, with 11 males (52.4%) and 52 females (60.5%) in their respective age groups living below the poverty level.
| Age Bracket | Male | Female |
| Under 5 Years | 0 (0.0%) | 14 (35.0%) |
| 5 Years | 11 (52.4%) | 0 (0.0%) |
| 6 to 11 Years | 11 (8.2%) | 52 (60.5%) |
| 12 to 14 Years | 12 (22.6%) | 0 (0.0%) |
| 15 Years | 0 (0.0%) | 0 (0.0%) |
| 16 and 17 Years | 5 (13.9%) | 0 (0.0%) |
| 18 to 24 Years | 0 (0.0%) | 14 (21.2%) |
| 25 to 34 Years | 18 (11.0%) | 27 (13.7%) |
| 35 to 44 Years | 23 (19.3%) | 0 (0.0%) |
| 45 to 54 Years | 13 (10.2%) | 100 (45.3%) |
| 55 to 64 Years | 14 (6.6%) | 12 (5.7%) |
| 65 to 74 Years | 0 (0.0%) | 5 (7.1%) |
| 75 Years and over | 0 (0.0%) | 6 (10.9%) |
| Total | 107 (9.3%) | 230 (20.0%) |
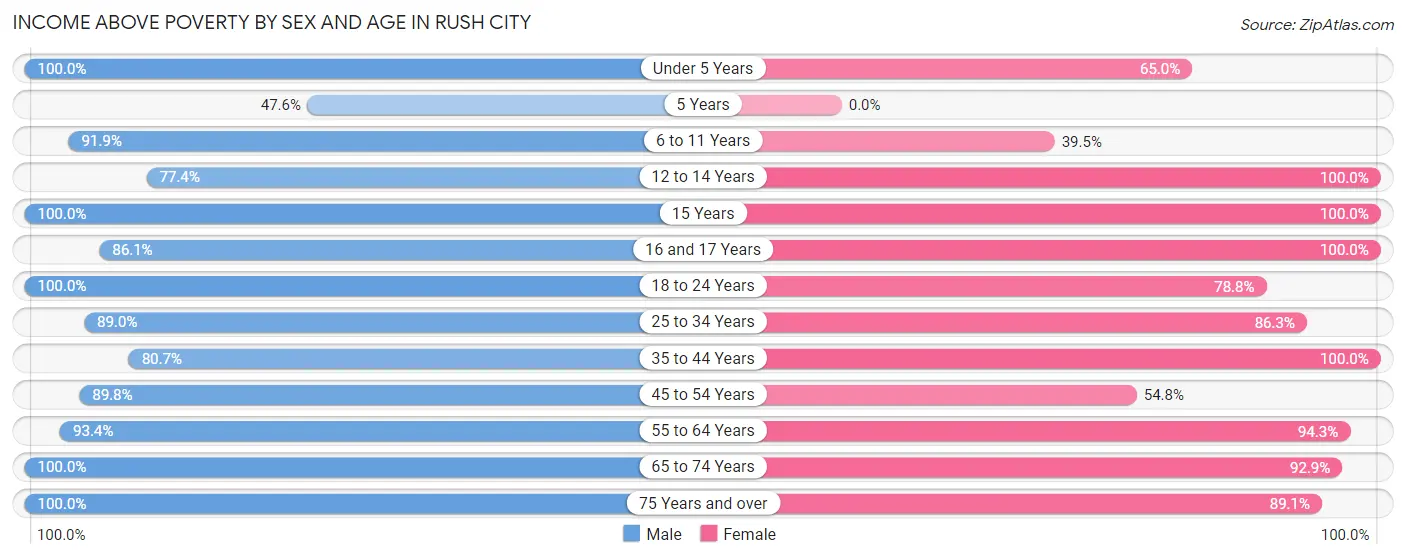
Income Above Poverty by Sex and Age in Rush City
According to the poverty statistics in Rush City, males aged under 5 years and females aged 12 to 14 years are the age groups that are most secure financially, with 100.0% of males and 100.0% of females in these age groups living above the poverty line.
| Age Bracket | Male | Female |
| Under 5 Years | 69 (100.0%) | 26 (65.0%) |
| 5 Years | 10 (47.6%) | 0 (0.0%) |
| 6 to 11 Years | 124 (91.8%) | 34 (39.5%) |
| 12 to 14 Years | 41 (77.4%) | 31 (100.0%) |
| 15 Years | 3 (100.0%) | 14 (100.0%) |
| 16 and 17 Years | 31 (86.1%) | 31 (100.0%) |
| 18 to 24 Years | 102 (100.0%) | 52 (78.8%) |
| 25 to 34 Years | 145 (89.0%) | 170 (86.3%) |
| 35 to 44 Years | 96 (80.7%) | 128 (100.0%) |
| 45 to 54 Years | 115 (89.8%) | 121 (54.7%) |
| 55 to 64 Years | 198 (93.4%) | 200 (94.3%) |
| 65 to 74 Years | 64 (100.0%) | 65 (92.9%) |
| 75 Years and over | 46 (100.0%) | 49 (89.1%) |
| Total | 1,044 (90.7%) | 921 (80.0%) |
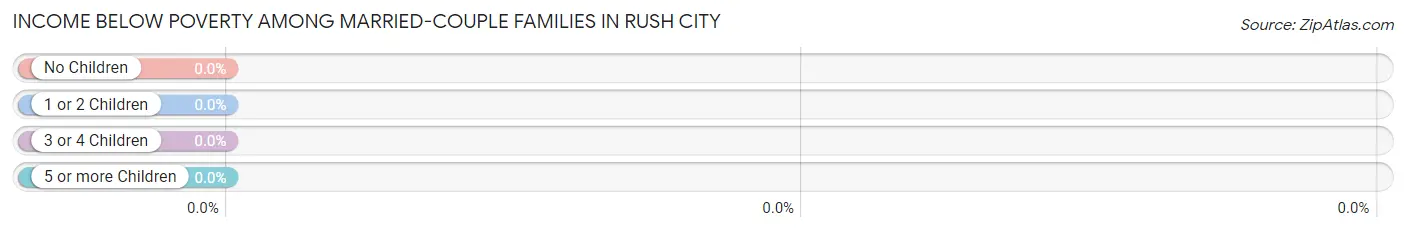
Income Below Poverty Among Married-Couple Families in Rush City
| Children | Above Poverty | Below Poverty |
| No Children | 265 (100.0%) | 0 (0.0%) |
| 1 or 2 Children | 110 (100.0%) | 0 (0.0%) |
| 3 or 4 Children | 26 (100.0%) | 0 (0.0%) |
| 5 or more Children | 0 (0.0%) | 0 (0.0%) |
| Total | 401 (100.0%) | 0 (0.0%) |
Income Below Poverty Among Single-Parent Households in Rush City
According to the poverty data in Rush City, 8.5% or 6 single-father households and 33.3% or 47 single-mother households are living below the poverty line. Among single-father households, those with 1 or 2 children have the highest poverty rate, with 6 households (11.5%) experiencing poverty. Likewise, among single-mother households, those with 3 or 4 children have the highest poverty rate, with 29 households (100.0%) falling below the poverty line.
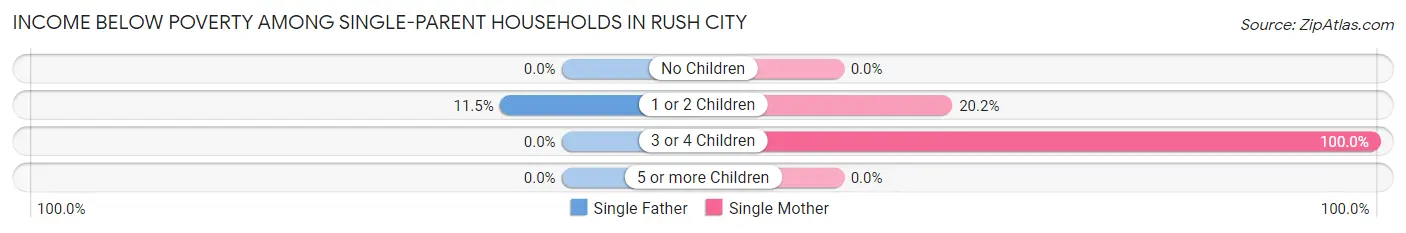
| Children | Single Father | Single Mother |
| No Children | 0 (0.0%) | 0 (0.0%) |
| 1 or 2 Children | 6 (11.5%) | 18 (20.2%) |
| 3 or 4 Children | 0 (0.0%) | 29 (100.0%) |
| 5 or more Children | 0 (0.0%) | 0 (0.0%) |
| Total | 6 (8.5%) | 47 (33.3%) |
Income Below Poverty Among Married-Couple vs Single-Parent Households in Rush City
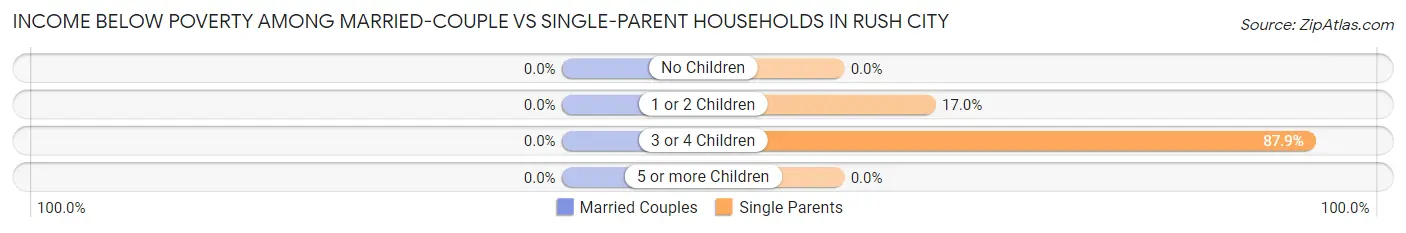
| Children | Married-Couple Families | Single-Parent Households |
| No Children | 0 (0.0%) | 0 (0.0%) |
| 1 or 2 Children | 0 (0.0%) | 24 (17.0%) |
| 3 or 4 Children | 0 (0.0%) | 29 (87.9%) |
| 5 or more Children | 0 (0.0%) | 0 (0.0%) |
| Total | 0 (0.0%) | 53 (25.0%) |
Race in Rush City
The most populous races in Rush City are White / Caucasian (2,548 | 78.7%), Black / African American (458 | 14.1%), and Two or more Races (113 | 3.5%).
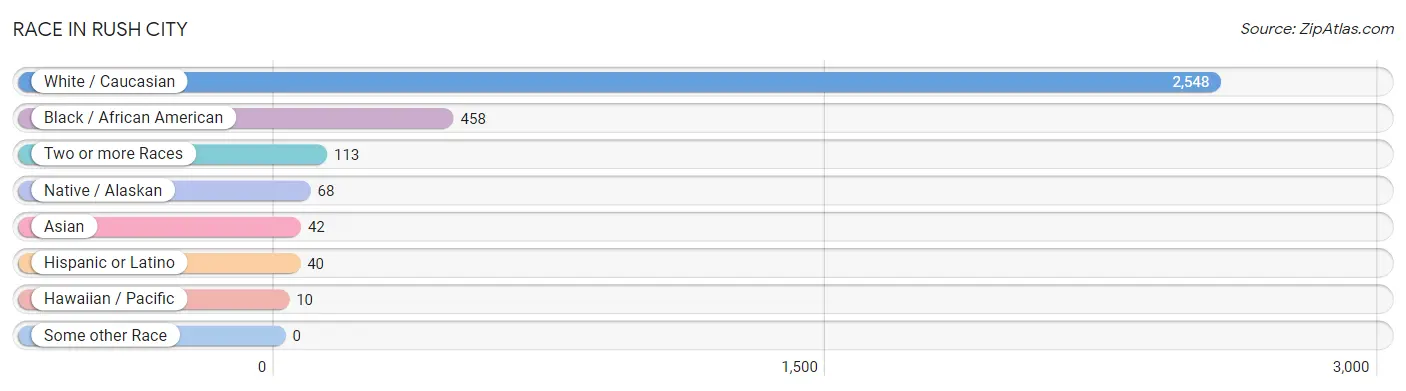
| Race | # Population | % Population |
| Asian | 42 | 1.3% |
| Black / African American | 458 | 14.1% |
| Hawaiian / Pacific | 10 | 0.3% |
| Hispanic or Latino | 40 | 1.2% |
| Native / Alaskan | 68 | 2.1% |
| White / Caucasian | 2,548 | 78.7% |
| Two or more Races | 113 | 3.5% |
| Some other Race | 0 | 0.0% |
| Total | 3,239 | 100.0% |
Ancestry in Rush City
The most populous ancestries reported in Rush City are German (878 | 27.1%), Swedish (434 | 13.4%), English (226 | 7.0%), Norwegian (226 | 7.0%), and Irish (209 | 6.5%), together accounting for 60.9% of all Rush City residents.
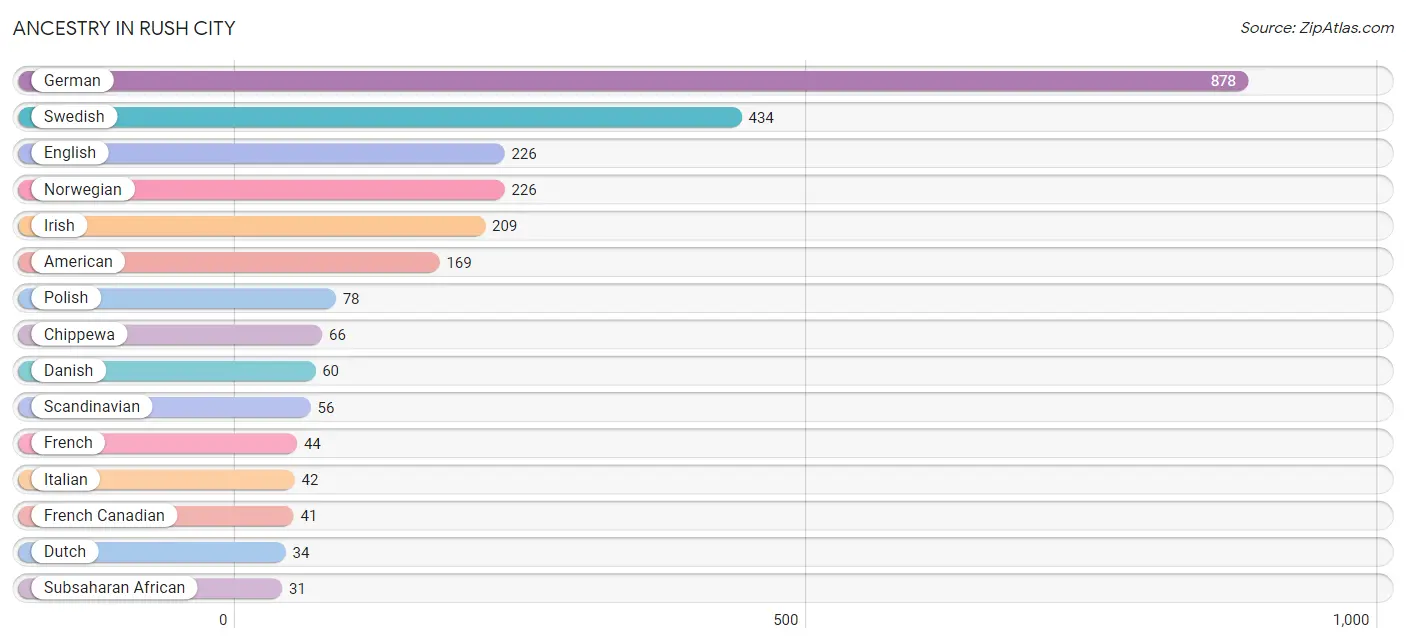
| Ancestry | # Population | % Population |
| American | 169 | 5.2% |
| Arab | 23 | 0.7% |
| Austrian | 4 | 0.1% |
| Chippewa | 66 | 2.0% |
| Czech | 12 | 0.4% |
| Danish | 60 | 1.8% |
| Dutch | 34 | 1.1% |
| Eastern European | 12 | 0.4% |
| English | 226 | 7.0% |
| Estonian | 10 | 0.3% |
| European | 10 | 0.3% |
| Finnish | 30 | 0.9% |
| French | 44 | 1.4% |
| French Canadian | 41 | 1.3% |
| German | 878 | 27.1% |
| Hungarian | 12 | 0.4% |
| Irish | 209 | 6.5% |
| Italian | 42 | 1.3% |
| Kenyan | 9 | 0.3% |
| Korean | 20 | 0.6% |
| Lebanese | 23 | 0.7% |
| Liberian | 10 | 0.3% |
| Malaysian | 17 | 0.5% |
| Mexican | 28 | 0.9% |
| Native Hawaiian | 10 | 0.3% |
| Norwegian | 226 | 7.0% |
| Pakistani | 5 | 0.2% |
| Polish | 78 | 2.4% |
| Puerto Rican | 6 | 0.2% |
| Scandinavian | 56 | 1.7% |
| Scotch-Irish | 12 | 0.4% |
| Scottish | 9 | 0.3% |
| Somali | 12 | 0.4% |
| Sri Lankan | 13 | 0.4% |
| Subsaharan African | 31 | 1.0% |
| Swedish | 434 | 13.4% | View All 36 Rows |
Immigrants in Rush City
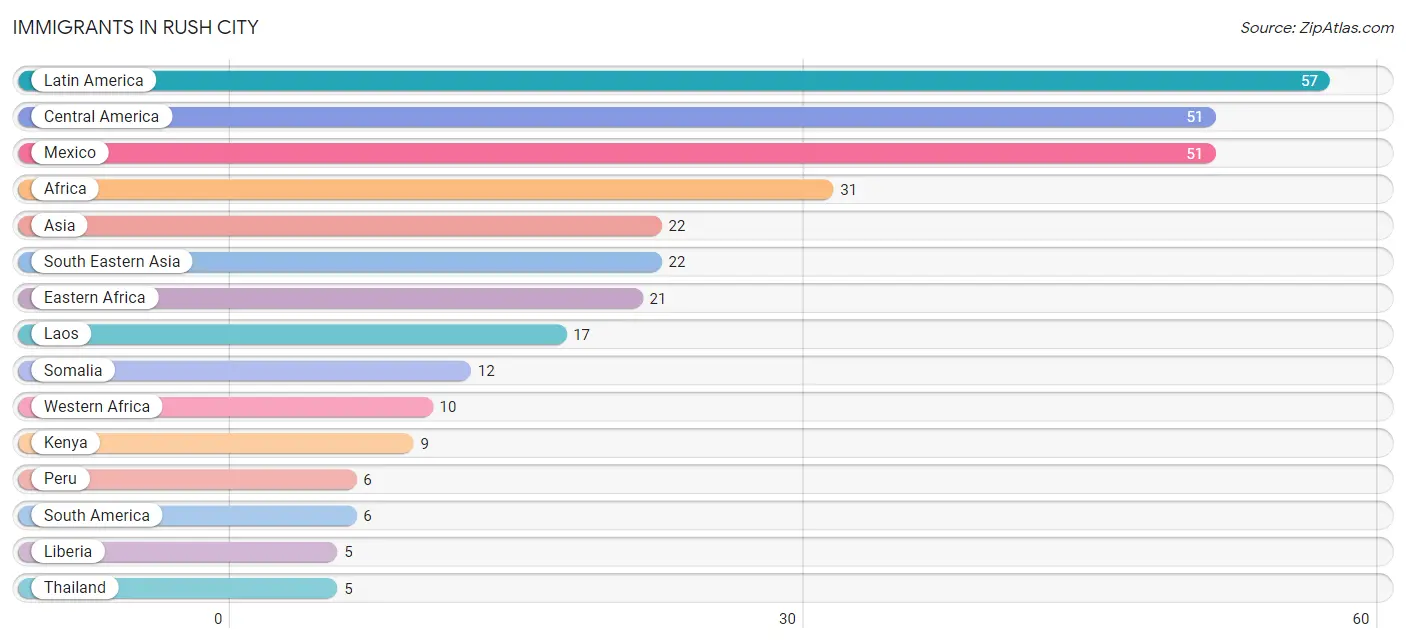
The most numerous immigrant groups reported in Rush City came from Latin America (57 | 1.8%), Central America (51 | 1.6%), Mexico (51 | 1.6%), Africa (31 | 1.0%), and Asia (22 | 0.7%), together accounting for 6.5% of all Rush City residents.
| Immigration Origin | # Population | % Population |
| Africa | 31 | 1.0% |
| Asia | 22 | 0.7% |
| Central America | 51 | 1.6% |
| Eastern Africa | 21 | 0.6% |
| Kenya | 9 | 0.3% |
| Laos | 17 | 0.5% |
| Latin America | 57 | 1.8% |
| Liberia | 5 | 0.2% |
| Mexico | 51 | 1.6% |
| Peru | 6 | 0.2% |
| Somalia | 12 | 0.4% |
| South America | 6 | 0.2% |
| South Eastern Asia | 22 | 0.7% |
| Thailand | 5 | 0.2% |
| Western Africa | 10 | 0.3% | View All 15 Rows |
Sex and Age in Rush City
Sex and Age in Rush City
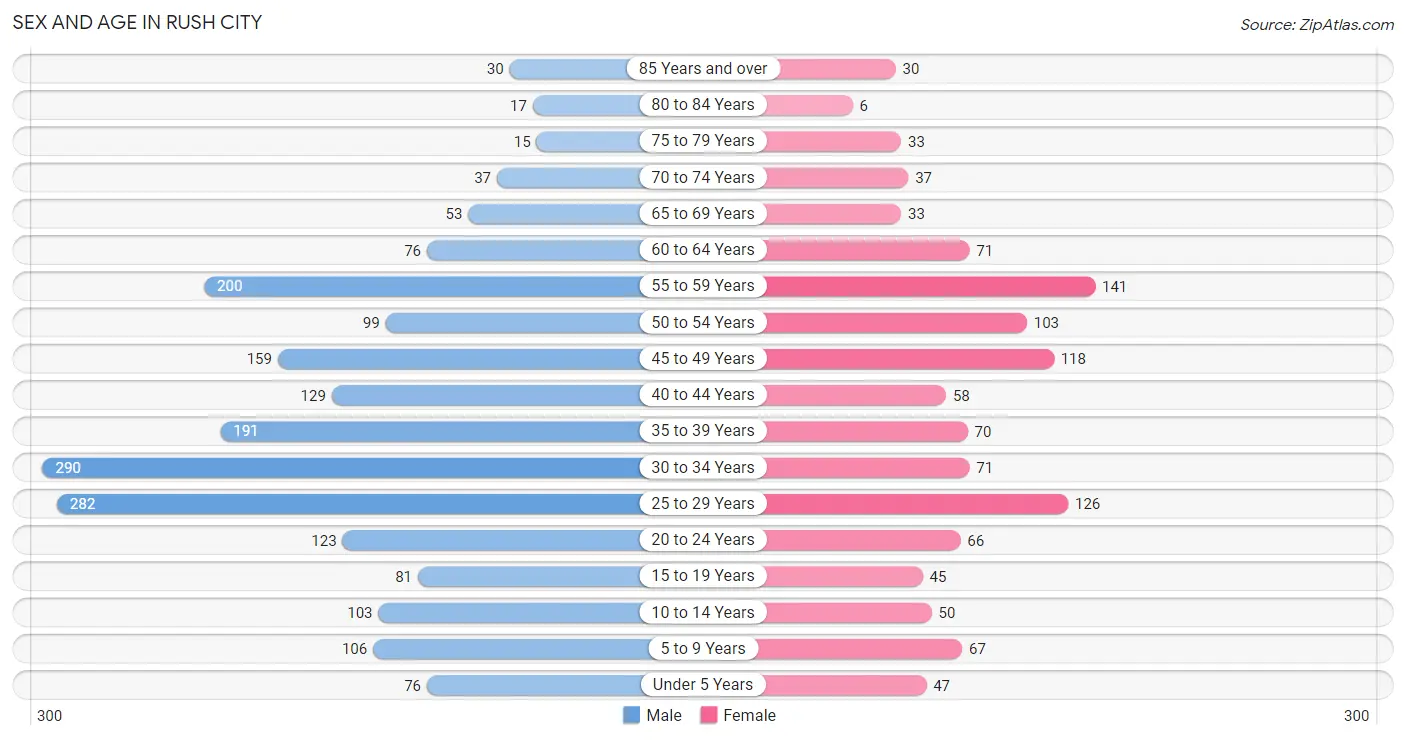
The most populous age groups in Rush City are 30 to 34 Years (290 | 14.0%) for men and 55 to 59 Years (141 | 12.0%) for women.
| Age Bracket | Male | Female |
| Under 5 Years | 76 (3.7%) | 47 (4.0%) |
| 5 to 9 Years | 106 (5.1%) | 67 (5.7%) |
| 10 to 14 Years | 103 (5.0%) | 50 (4.3%) |
| 15 to 19 Years | 81 (3.9%) | 45 (3.8%) |
| 20 to 24 Years | 123 (5.9%) | 66 (5.6%) |
| 25 to 29 Years | 282 (13.6%) | 126 (10.7%) |
| 30 to 34 Years | 290 (14.0%) | 71 (6.1%) |
| 35 to 39 Years | 191 (9.2%) | 70 (6.0%) |
| 40 to 44 Years | 129 (6.2%) | 58 (5.0%) |
| 45 to 49 Years | 159 (7.7%) | 118 (10.1%) |
| 50 to 54 Years | 99 (4.8%) | 103 (8.8%) |
| 55 to 59 Years | 200 (9.7%) | 141 (12.0%) |
| 60 to 64 Years | 76 (3.7%) | 71 (6.1%) |
| 65 to 69 Years | 53 (2.6%) | 33 (2.8%) |
| 70 to 74 Years | 37 (1.8%) | 37 (3.2%) |
| 75 to 79 Years | 15 (0.7%) | 33 (2.8%) |
| 80 to 84 Years | 17 (0.8%) | 6 (0.5%) |
| 85 Years and over | 30 (1.5%) | 30 (2.6%) |
| Total | 2,067 (100.0%) | 1,172 (100.0%) |
Families and Households in Rush City
Median Family Size in Rush City
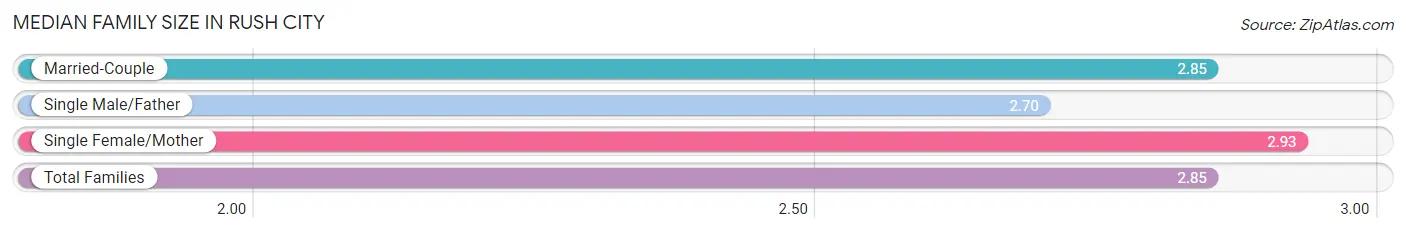
The median family size in Rush City is 2.85 persons per family, with single female/mother families (141 | 23.0%) accounting for the largest median family size of 2.93 persons per family. On the other hand, single male/father families (71 | 11.6%) represent the smallest median family size with 2.70 persons per family.
| Family Type | # Families | Family Size |
| Married-Couple | 401 (65.4%) | 2.85 |
| Single Male/Father | 71 (11.6%) | 2.70 |
| Single Female/Mother | 141 (23.0%) | 2.93 |
| Total Families | 613 (100.0%) | 2.85 |
Median Household Size in Rush City
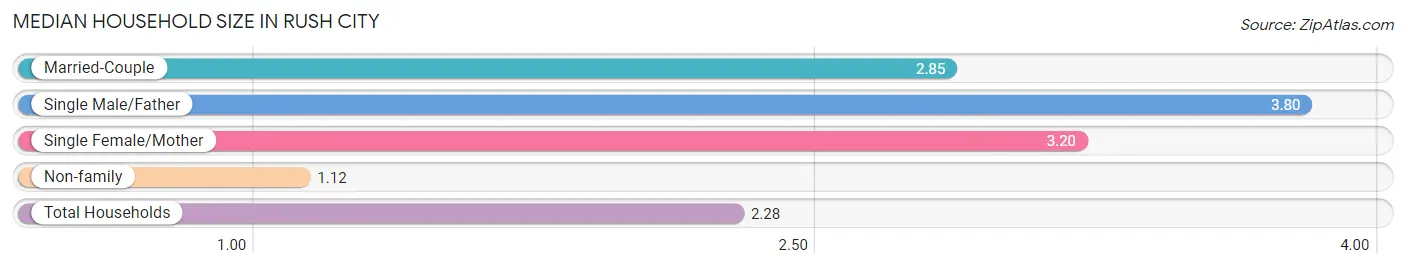
The median household size in Rush City is 2.28 persons per household, with single male/father households (71 | 7.0%) accounting for the largest median household size of 3.8 persons per household. non-family households (398 | 39.4%) represent the smallest median household size with 1.12 persons per household.
| Household Type | # Households | Household Size |
| Married-Couple | 401 (39.7%) | 2.85 |
| Single Male/Father | 71 (7.0%) | 3.80 |
| Single Female/Mother | 141 (14.0%) | 3.20 |
| Non-family | 398 (39.4%) | 1.12 |
| Total Households | 1,011 (100.0%) | 2.28 |
Household Size by Marriage Status in Rush City
Out of a total of 1,011 households in Rush City, 613 (60.6%) are family households, while 398 (39.4%) are nonfamily households. The most numerous type of family households are 2-person households, comprising 276, and the most common type of nonfamily households are 1-person households, comprising 356.
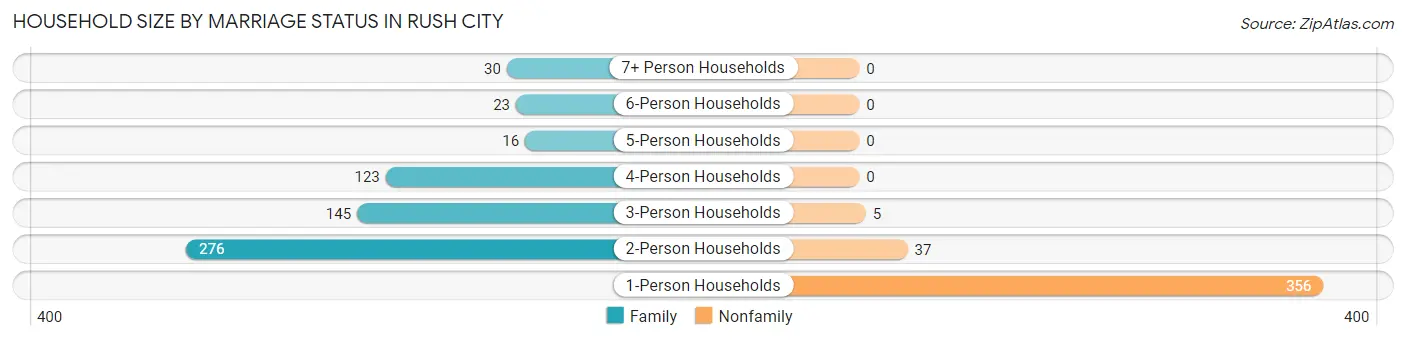
| Household Size | Family Households | Nonfamily Households |
| 1-Person Households | - | 356 (35.2%) |
| 2-Person Households | 276 (27.3%) | 37 (3.7%) |
| 3-Person Households | 145 (14.3%) | 5 (0.5%) |
| 4-Person Households | 123 (12.2%) | 0 (0.0%) |
| 5-Person Households | 16 (1.6%) | 0 (0.0%) |
| 6-Person Households | 23 (2.3%) | 0 (0.0%) |
| 7+ Person Households | 30 (3.0%) | 0 (0.0%) |
| Total | 613 (60.6%) | 398 (39.4%) |
Female Fertility in Rush City
Fertility by Age in Rush City
Average fertility rate in Rush City is 75.0 births per 1,000 women. Women in the age bracket of 20 to 34 years have the highest fertility rate with 99.0 births per 1,000 women. Women in the age bracket of 20 to 34 years acount for 61.9% of all women with births.
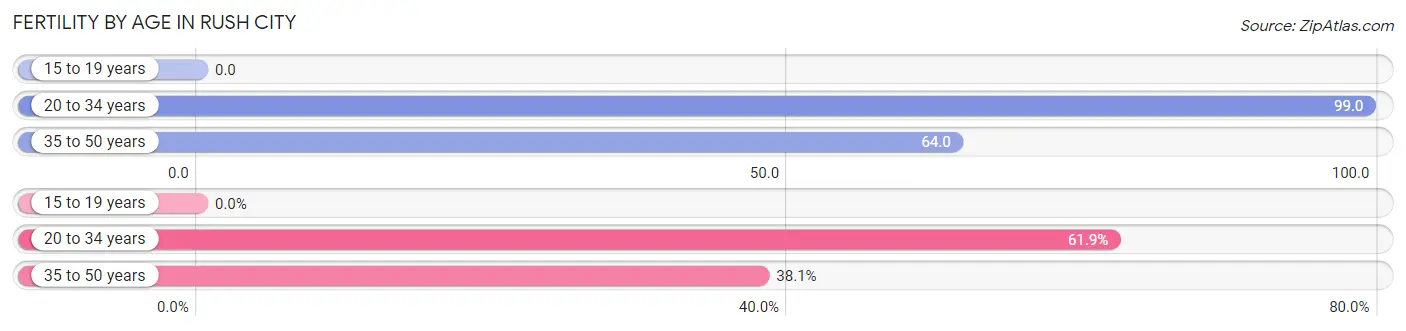
| Age Bracket | Women with Births | Births / 1,000 Women |
| 15 to 19 years | 0 (0.0%) | 0.0 |
| 20 to 34 years | 26 (61.9%) | 99.0 |
| 35 to 50 years | 16 (38.1%) | 64.0 |
| Total | 42 (100.0%) | 75.0 |
Fertility by Age by Marriage Status in Rush City
71.4% of women with births (42) in Rush City are married. The highest percentage of unmarried women with births falls into 20 to 34 years age bracket with 46.2% of them unmarried at the time of birth, while the lowest percentage of unmarried women with births belong to 35 to 50 years age bracket with 0.0% of them unmarried.
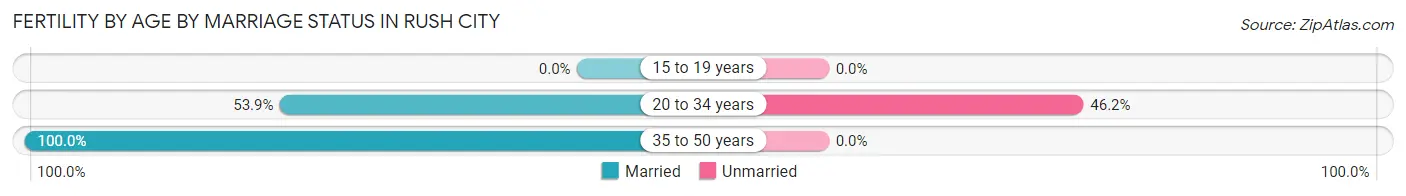
| Age Bracket | Married | Unmarried |
| 15 to 19 years | 0 (0.0%) | 0 (0.0%) |
| 20 to 34 years | 14 (53.8%) | 12 (46.2%) |
| 35 to 50 years | 16 (100.0%) | 0 (0.0%) |
| Total | 30 (71.4%) | 12 (28.6%) |
Fertility by Education in Rush City
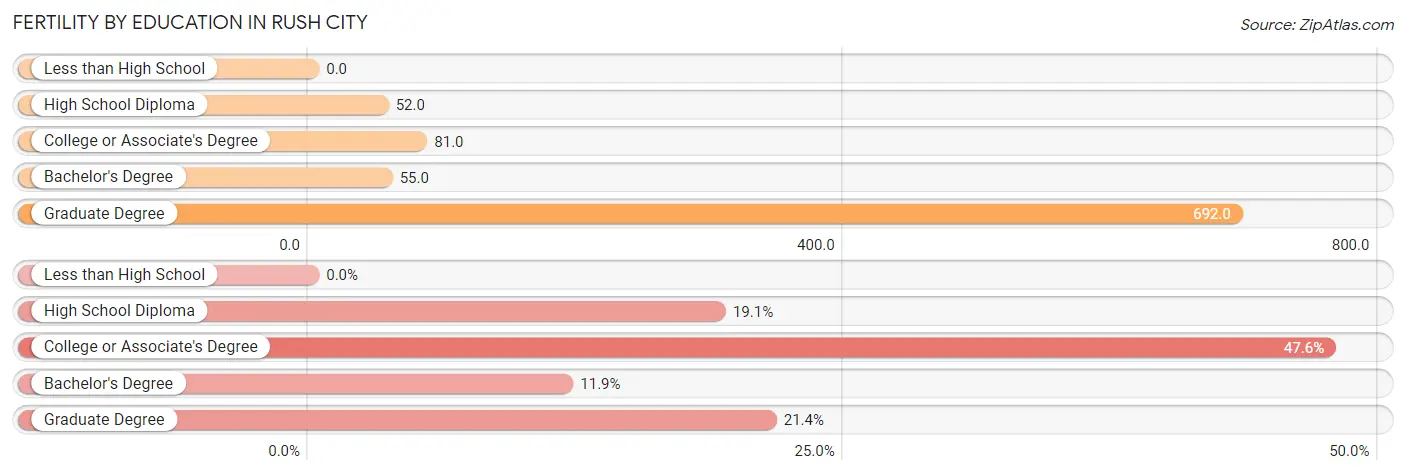
| Educational Attainment | Women with Births | Births / 1,000 Women |
| Less than High School | 0 (0.0%) | 0.0 |
| High School Diploma | 8 (19.1%) | 52.0 |
| College or Associate's Degree | 20 (47.6%) | 81.0 |
| Bachelor's Degree | 5 (11.9%) | 55.0 |
| Graduate Degree | 9 (21.4%) | 692.0 |
| Total | 42 (100.0%) | 75.0 |
Fertility by Education by Marriage Status in Rush City
28.6% of women with births in Rush City are unmarried. Women with the educational attainment of bachelor's degree are most likely to be married with 100.0% of them married at childbirth, while women with the educational attainment of high school diploma are least likely to be married with 100.0% of them unmarried at childbirth.
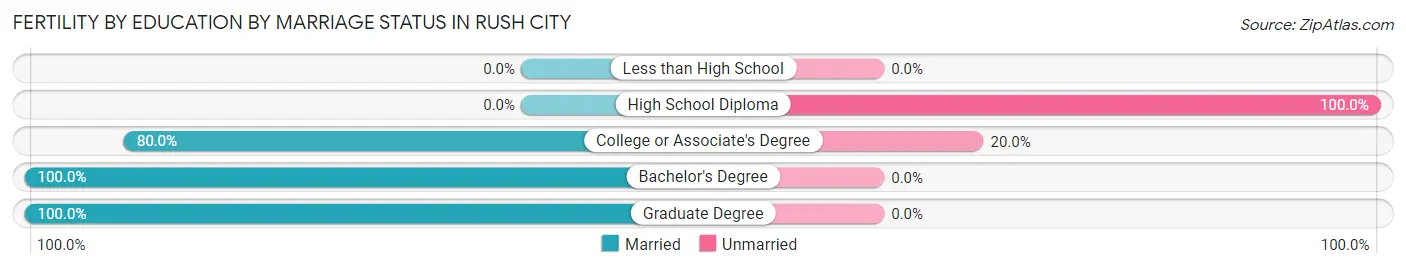
| Educational Attainment | Married | Unmarried |
| Less than High School | 0 (0.0%) | 0 (0.0%) |
| High School Diploma | 0 (0.0%) | 8 (100.0%) |
| College or Associate's Degree | 16 (80.0%) | 4 (20.0%) |
| Bachelor's Degree | 5 (100.0%) | 0 (0.0%) |
| Graduate Degree | 9 (100.0%) | 0 (0.0%) |
| Total | 30 (71.4%) | 12 (28.6%) |
Employment Characteristics in Rush City
Employment by Class of Employer in Rush City
Among the 1,275 employed individuals in Rush City, private company employees (942 | 73.9%), not-for-profit organizations (131 | 10.3%), and self-employed (not incorporated) (53 | 4.2%) make up the most common classes of employment.
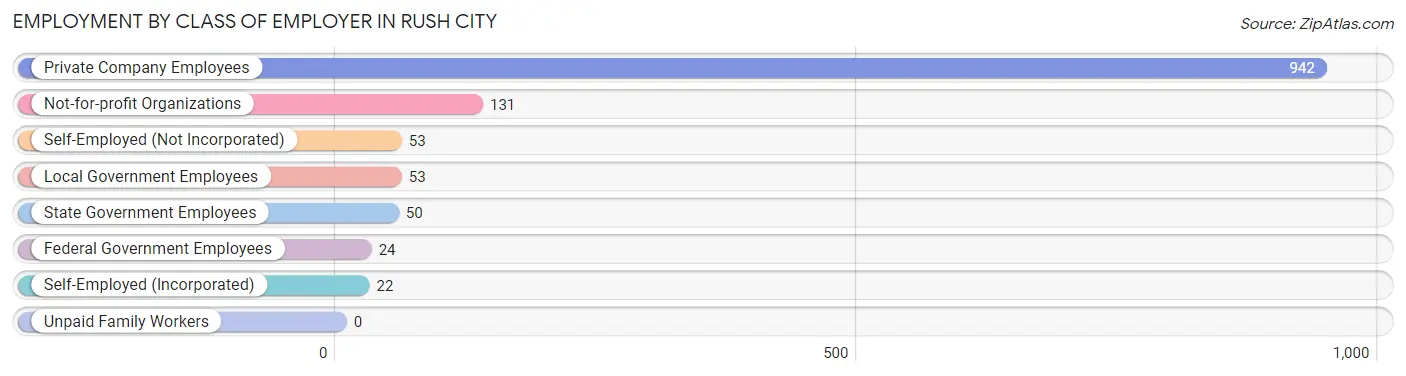
| Employer Class | # Employees | % Employees |
| Private Company Employees | 942 | 73.9% |
| Self-Employed (Incorporated) | 22 | 1.7% |
| Self-Employed (Not Incorporated) | 53 | 4.2% |
| Not-for-profit Organizations | 131 | 10.3% |
| Local Government Employees | 53 | 4.2% |
| State Government Employees | 50 | 3.9% |
| Federal Government Employees | 24 | 1.9% |
| Unpaid Family Workers | 0 | 0.0% |
| Total | 1,275 | 100.0% |
Employment Status by Age in Rush City
According to the labor force statistics for Rush City, out of the total population over 16 years of age (2,773), 49.4% or 1,370 individuals are in the labor force, with 5.6% or 77 of them unemployed. The age group with the highest labor force participation rate is 55 to 59 years, with 84.2% or 287 individuals in the labor force. Within the labor force, the 45 to 54 years age range has the highest percentage of unemployed individuals, with 14.0% or 31 of them being unemployed.
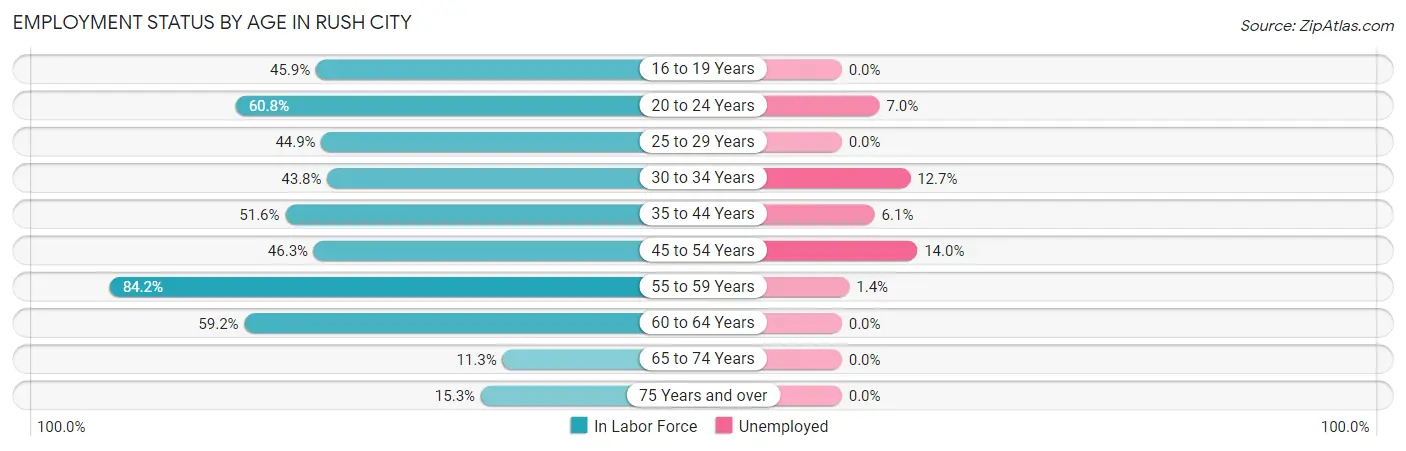
| Age Bracket | In Labor Force | Unemployed |
| 16 to 19 Years | 50 (45.9%) | 0 (0.0%) |
| 20 to 24 Years | 115 (60.8%) | 8 (7.0%) |
| 25 to 29 Years | 183 (44.9%) | 0 (0.0%) |
| 30 to 34 Years | 158 (43.8%) | 20 (12.7%) |
| 35 to 44 Years | 231 (51.6%) | 14 (6.1%) |
| 45 to 54 Years | 222 (46.3%) | 31 (14.0%) |
| 55 to 59 Years | 287 (84.2%) | 4 (1.4%) |
| 60 to 64 Years | 87 (59.2%) | 0 (0.0%) |
| 65 to 74 Years | 18 (11.3%) | 0 (0.0%) |
| 75 Years and over | 20 (15.3%) | 0 (0.0%) |
| Total | 1,370 (49.4%) | 77 (5.6%) |
Employment Status by Educational Attainment in Rush City
According to labor force statistics for Rush City, 53.5% of individuals (1,168) out of the total population between 25 and 64 years of age (2,184) are in the labor force, with 5.9% or 69 of them being unemployed. The group with the highest labor force participation rate are those with the educational attainment of bachelor's degree or higher, with 94.9% or 169 individuals in the labor force. Within the labor force, individuals with less than high school education have the highest percentage of unemployment, with 15.3% or 9 of them being unemployed.
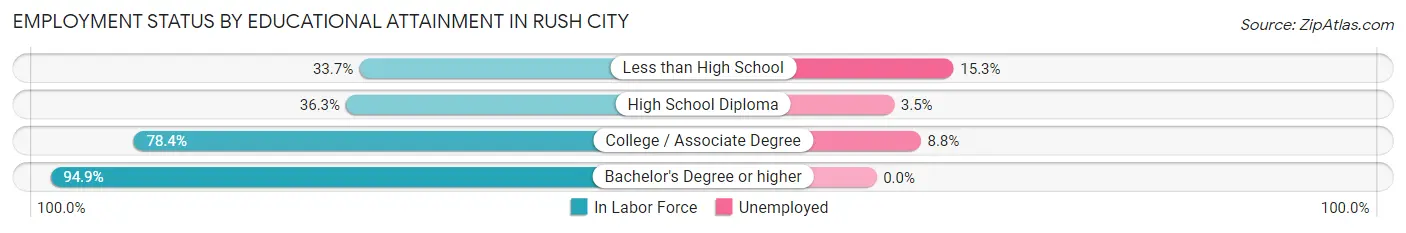
| Educational Attainment | In Labor Force | Unemployed |
| Less than High School | 59 (33.7%) | 27 (15.3%) |
| High School Diploma | 427 (36.3%) | 41 (3.5%) |
| College / Associate Degree | 514 (78.4%) | 58 (8.8%) |
| Bachelor's Degree or higher | 169 (94.9%) | 0 (0.0%) |
| Total | 1,168 (53.5%) | 129 (5.9%) |
Employment Occupations by Sex in Rush City
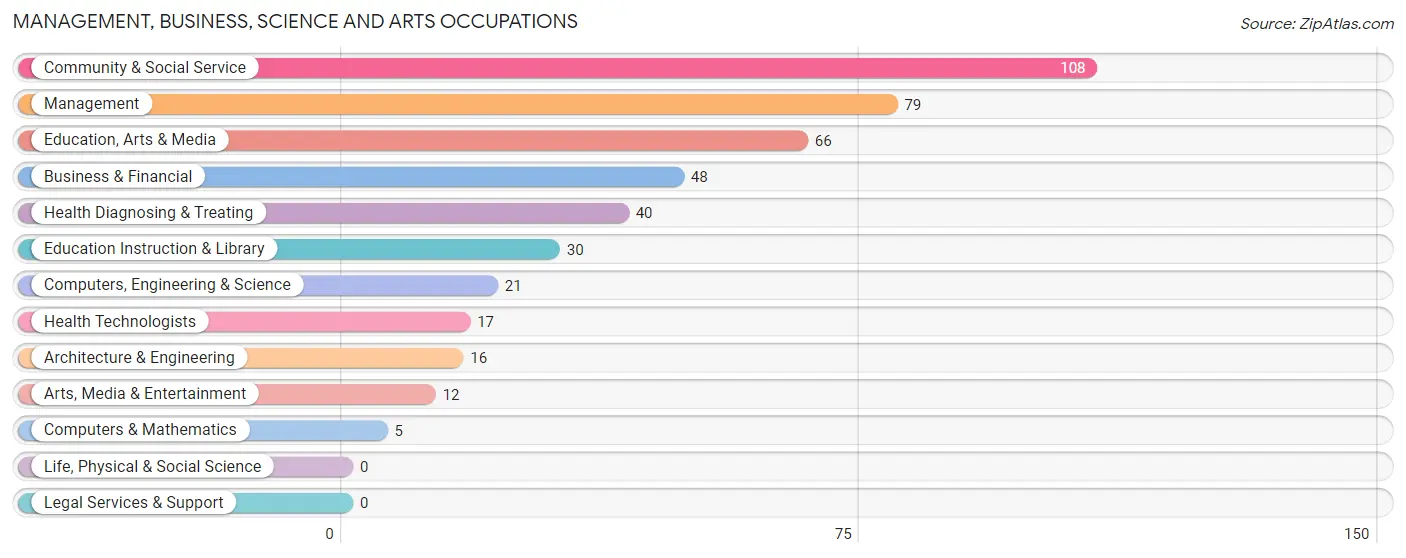
Management, Business, Science and Arts Occupations
The most common Management, Business, Science and Arts occupations in Rush City are Community & Social Service (108 | 8.4%), Management (79 | 6.1%), Education, Arts & Media (66 | 5.1%), Business & Financial (48 | 3.7%), and Health Diagnosing & Treating (40 | 3.1%).
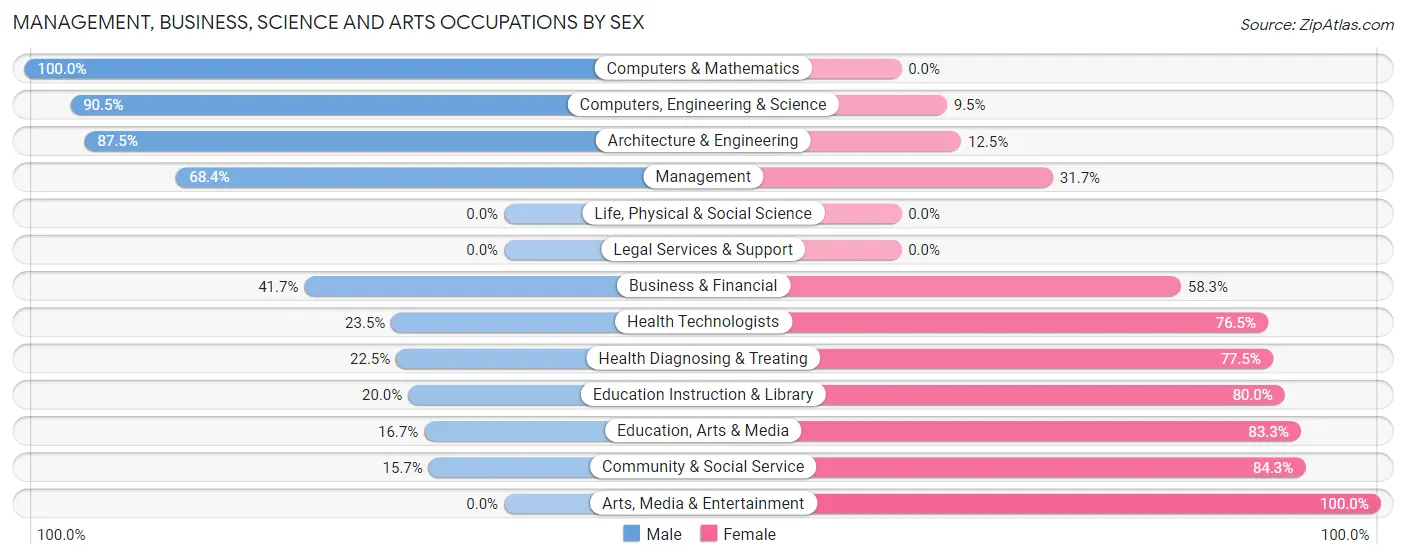
Management, Business, Science and Arts Occupations by Sex
Within the Management, Business, Science and Arts occupations in Rush City, the most male-oriented occupations are Computers & Mathematics (100.0%), Computers, Engineering & Science (90.5%), and Architecture & Engineering (87.5%), while the most female-oriented occupations are Arts, Media & Entertainment (100.0%), Community & Social Service (84.3%), and Education, Arts & Media (83.3%).
| Occupation | Male | Female |
| Management | 54 (68.3%) | 25 (31.7%) |
| Business & Financial | 20 (41.7%) | 28 (58.3%) |
| Computers, Engineering & Science | 19 (90.5%) | 2 (9.5%) |
| Computers & Mathematics | 5 (100.0%) | 0 (0.0%) |
| Architecture & Engineering | 14 (87.5%) | 2 (12.5%) |
| Life, Physical & Social Science | 0 (0.0%) | 0 (0.0%) |
| Community & Social Service | 17 (15.7%) | 91 (84.3%) |
| Education, Arts & Media | 11 (16.7%) | 55 (83.3%) |
| Legal Services & Support | 0 (0.0%) | 0 (0.0%) |
| Education Instruction & Library | 6 (20.0%) | 24 (80.0%) |
| Arts, Media & Entertainment | 0 (0.0%) | 12 (100.0%) |
| Health Diagnosing & Treating | 9 (22.5%) | 31 (77.5%) |
| Health Technologists | 4 (23.5%) | 13 (76.5%) |
| Total (Category) | 119 (40.2%) | 177 (59.8%) |
| Total (Overall) | 679 (52.5%) | 615 (47.5%) |
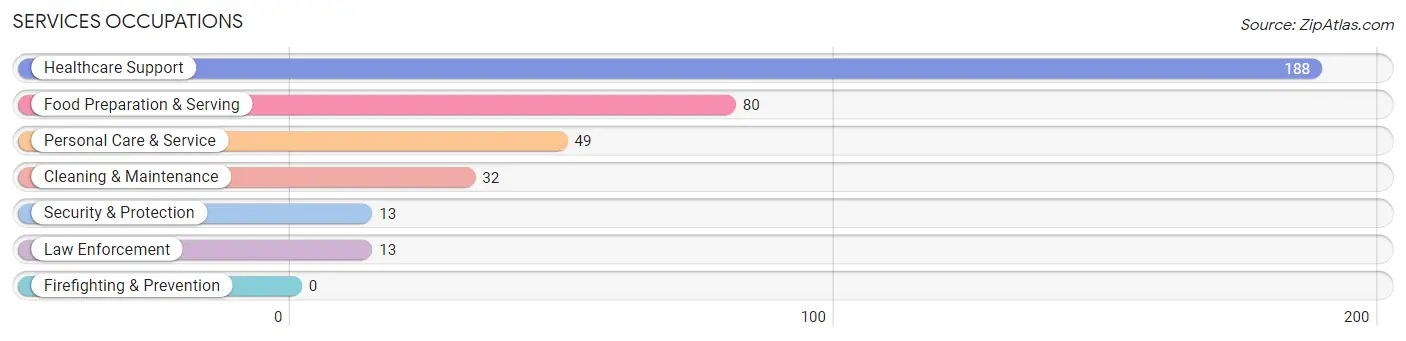
Services Occupations
The most common Services occupations in Rush City are Healthcare Support (188 | 14.5%), Food Preparation & Serving (80 | 6.2%), Personal Care & Service (49 | 3.8%), Cleaning & Maintenance (32 | 2.5%), and Security & Protection (13 | 1.0%).
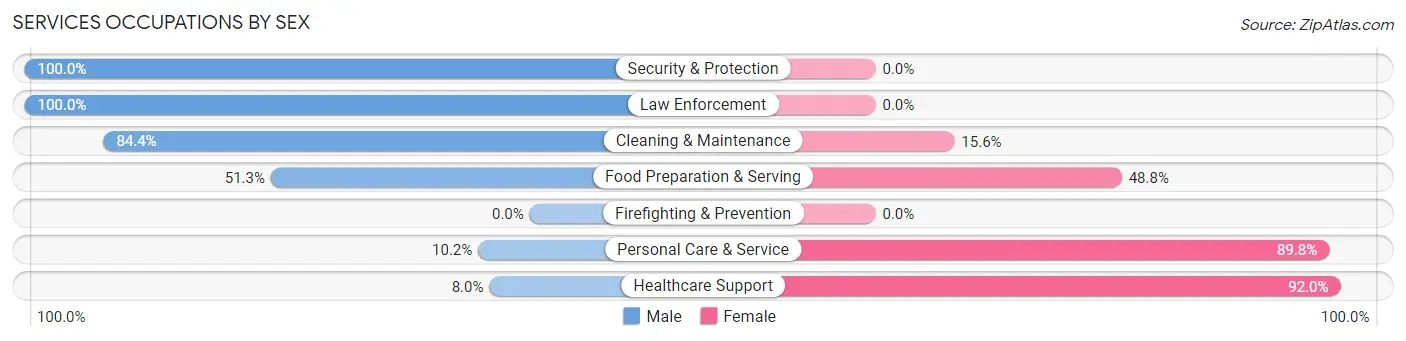
Services Occupations by Sex
Within the Services occupations in Rush City, the most male-oriented occupations are Security & Protection (100.0%), Law Enforcement (100.0%), and Cleaning & Maintenance (84.4%), while the most female-oriented occupations are Healthcare Support (92.0%), Personal Care & Service (89.8%), and Food Preparation & Serving (48.7%).
| Occupation | Male | Female |
| Healthcare Support | 15 (8.0%) | 173 (92.0%) |
| Security & Protection | 13 (100.0%) | 0 (0.0%) |
| Firefighting & Prevention | 0 (0.0%) | 0 (0.0%) |
| Law Enforcement | 13 (100.0%) | 0 (0.0%) |
| Food Preparation & Serving | 41 (51.2%) | 39 (48.7%) |
| Cleaning & Maintenance | 27 (84.4%) | 5 (15.6%) |
| Personal Care & Service | 5 (10.2%) | 44 (89.8%) |
| Total (Category) | 101 (27.9%) | 261 (72.1%) |
| Total (Overall) | 679 (52.5%) | 615 (47.5%) |
Sales and Office Occupations
The most common Sales and Office occupations in Rush City are Office & Administration (108 | 8.4%), and Sales & Related (104 | 8.0%).
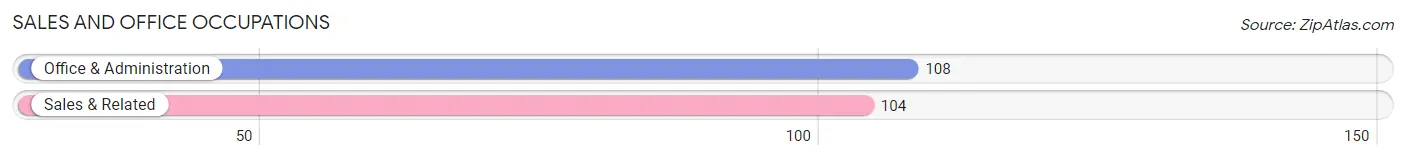
Sales and Office Occupations by Sex

| Occupation | Male | Female |
| Sales & Related | 53 (51.0%) | 51 (49.0%) |
| Office & Administration | 21 (19.4%) | 87 (80.6%) |
| Total (Category) | 74 (34.9%) | 138 (65.1%) |
| Total (Overall) | 679 (52.5%) | 615 (47.5%) |
Natural Resources, Construction and Maintenance Occupations
The most common Natural Resources, Construction and Maintenance occupations in Rush City are Construction & Extraction (162 | 12.5%), Installation, Maintenance & Repair (30 | 2.3%), and Farming, Fishing & Forestry (7 | 0.5%).
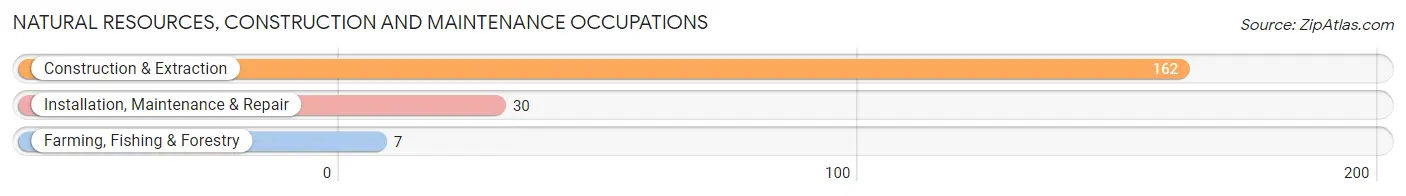
Natural Resources, Construction and Maintenance Occupations by Sex
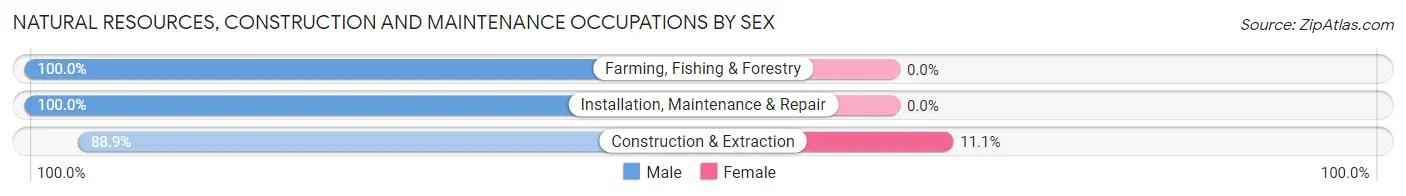
| Occupation | Male | Female |
| Farming, Fishing & Forestry | 7 (100.0%) | 0 (0.0%) |
| Construction & Extraction | 144 (88.9%) | 18 (11.1%) |
| Installation, Maintenance & Repair | 30 (100.0%) | 0 (0.0%) |
| Total (Category) | 181 (90.9%) | 18 (9.0%) |
| Total (Overall) | 679 (52.5%) | 615 (47.5%) |
Production, Transportation and Moving Occupations
The most common Production, Transportation and Moving occupations in Rush City are Material Moving (109 | 8.4%), Production (88 | 6.8%), and Transportation (28 | 2.2%).
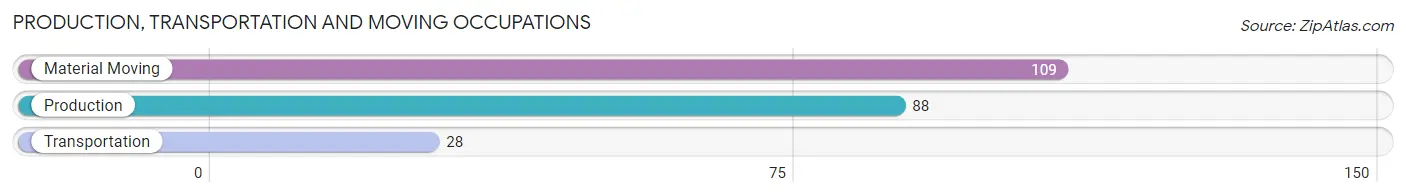
Production, Transportation and Moving Occupations by Sex
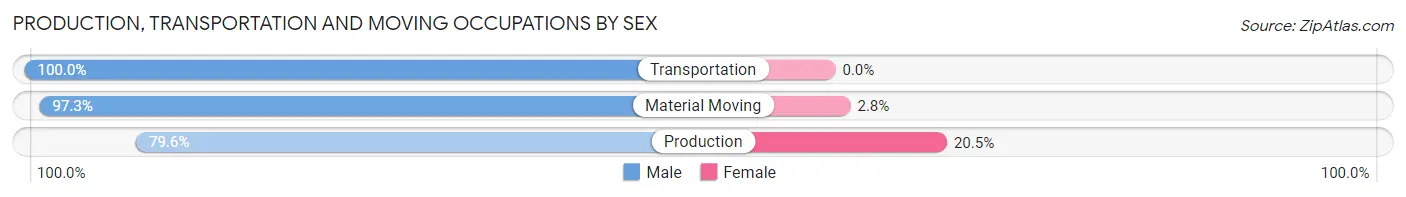
| Occupation | Male | Female |
| Production | 70 (79.5%) | 18 (20.4%) |
| Transportation | 28 (100.0%) | 0 (0.0%) |
| Material Moving | 106 (97.3%) | 3 (2.8%) |
| Total (Category) | 204 (90.7%) | 21 (9.3%) |
| Total (Overall) | 679 (52.5%) | 615 (47.5%) |
Employment Industries by Sex in Rush City
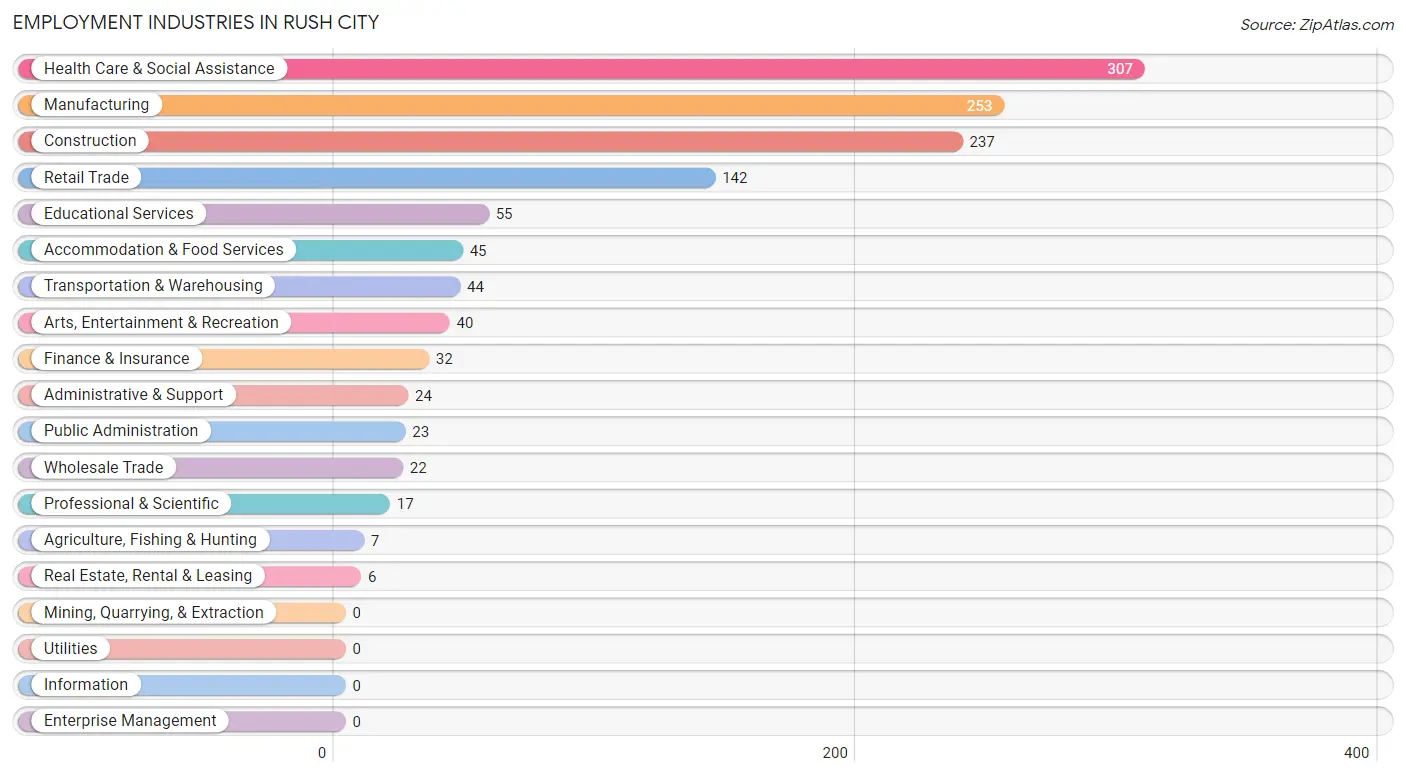
Employment Industries in Rush City
The major employment industries in Rush City include Health Care & Social Assistance (307 | 23.7%), Manufacturing (253 | 19.6%), Construction (237 | 18.3%), Retail Trade (142 | 11.0%), and Educational Services (55 | 4.3%).
Employment Industries by Sex in Rush City
The Rush City industries that see more men than women are Agriculture, Fishing & Hunting (100.0%), Real Estate, Rental & Leasing (100.0%), and Transportation & Warehousing (86.4%), whereas the industries that tend to have a higher number of women are Health Care & Social Assistance (89.9%), Educational Services (78.2%), and Finance & Insurance (75.0%).
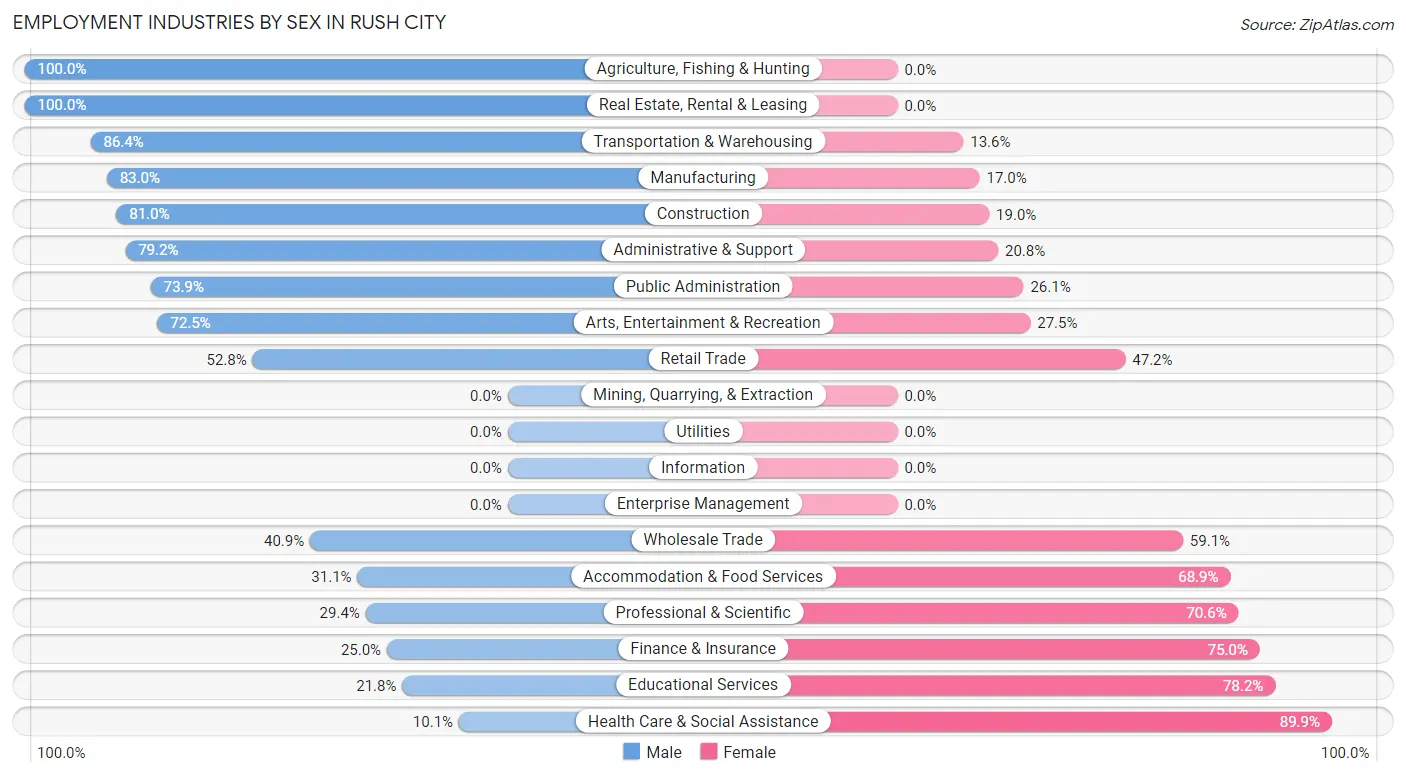
| Industry | Male | Female |
| Agriculture, Fishing & Hunting | 7 (100.0%) | 0 (0.0%) |
| Mining, Quarrying, & Extraction | 0 (0.0%) | 0 (0.0%) |
| Construction | 192 (81.0%) | 45 (19.0%) |
| Manufacturing | 210 (83.0%) | 43 (17.0%) |
| Wholesale Trade | 9 (40.9%) | 13 (59.1%) |
| Retail Trade | 75 (52.8%) | 67 (47.2%) |
| Transportation & Warehousing | 38 (86.4%) | 6 (13.6%) |
| Utilities | 0 (0.0%) | 0 (0.0%) |
| Information | 0 (0.0%) | 0 (0.0%) |
| Finance & Insurance | 8 (25.0%) | 24 (75.0%) |
| Real Estate, Rental & Leasing | 6 (100.0%) | 0 (0.0%) |
| Professional & Scientific | 5 (29.4%) | 12 (70.6%) |
| Enterprise Management | 0 (0.0%) | 0 (0.0%) |
| Administrative & Support | 19 (79.2%) | 5 (20.8%) |
| Educational Services | 12 (21.8%) | 43 (78.2%) |
| Health Care & Social Assistance | 31 (10.1%) | 276 (89.9%) |
| Arts, Entertainment & Recreation | 29 (72.5%) | 11 (27.5%) |
| Accommodation & Food Services | 14 (31.1%) | 31 (68.9%) |
| Public Administration | 17 (73.9%) | 6 (26.1%) |
| Total | 679 (52.5%) | 615 (47.5%) |
Education in Rush City
School Enrollment in Rush City
The most common levels of schooling among the 528 students in Rush City are elementary school (135 | 25.6%), high school (132 | 25.0%), and middle school (120 | 22.7%).
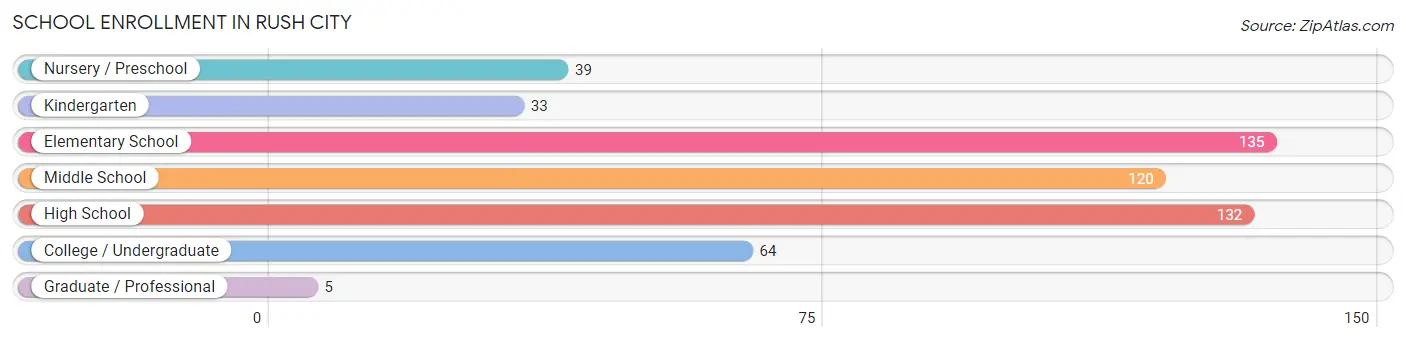
| School Level | # Students | % Students |
| Nursery / Preschool | 39 | 7.4% |
| Kindergarten | 33 | 6.2% |
| Elementary School | 135 | 25.6% |
| Middle School | 120 | 22.7% |
| High School | 132 | 25.0% |
| College / Undergraduate | 64 | 12.1% |
| Graduate / Professional | 5 | 0.9% |
| Total | 528 | 100.0% |
School Enrollment by Age by Funding Source in Rush City
Out of a total of 528 students who are enrolled in schools in Rush City, 46 (8.7%) attend a private institution, while the remaining 482 (91.3%) are enrolled in public schools. The age group of 10 to 14 year olds has the highest likelihood of being enrolled in private schools, with 24 (16.7% in the age bracket) enrolled. Conversely, the age group of 3 to 4 year olds has the lowest likelihood of being enrolled in a private school, with 29 (100.0% in the age bracket) attending a public institution.
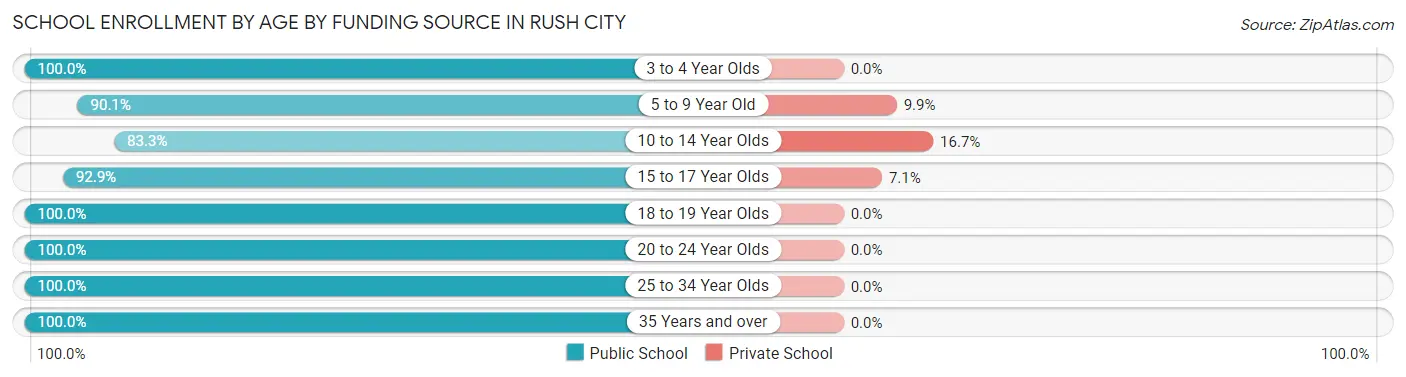
| Age Bracket | Public School | Private School |
| 3 to 4 Year Olds | 29 (100.0%) | 0 (0.0%) |
| 5 to 9 Year Old | 146 (90.1%) | 16 (9.9%) |
| 10 to 14 Year Olds | 120 (83.3%) | 24 (16.7%) |
| 15 to 17 Year Olds | 78 (92.9%) | 6 (7.1%) |
| 18 to 19 Year Olds | 4 (100.0%) | 0 (0.0%) |
| 20 to 24 Year Olds | 20 (100.0%) | 0 (0.0%) |
| 25 to 34 Year Olds | 43 (100.0%) | 0 (0.0%) |
| 35 Years and over | 42 (100.0%) | 0 (0.0%) |
| Total | 482 (91.3%) | 46 (8.7%) |
Educational Attainment by Field of Study in Rush City
Education (73 | 34.6%), business (67 | 31.8%), communications (20 | 9.5%), arts & humanities (19 | 9.0%), and science & technology (9 | 4.3%) are the most common fields of study among 211 individuals in Rush City who have obtained a bachelor's degree or higher.
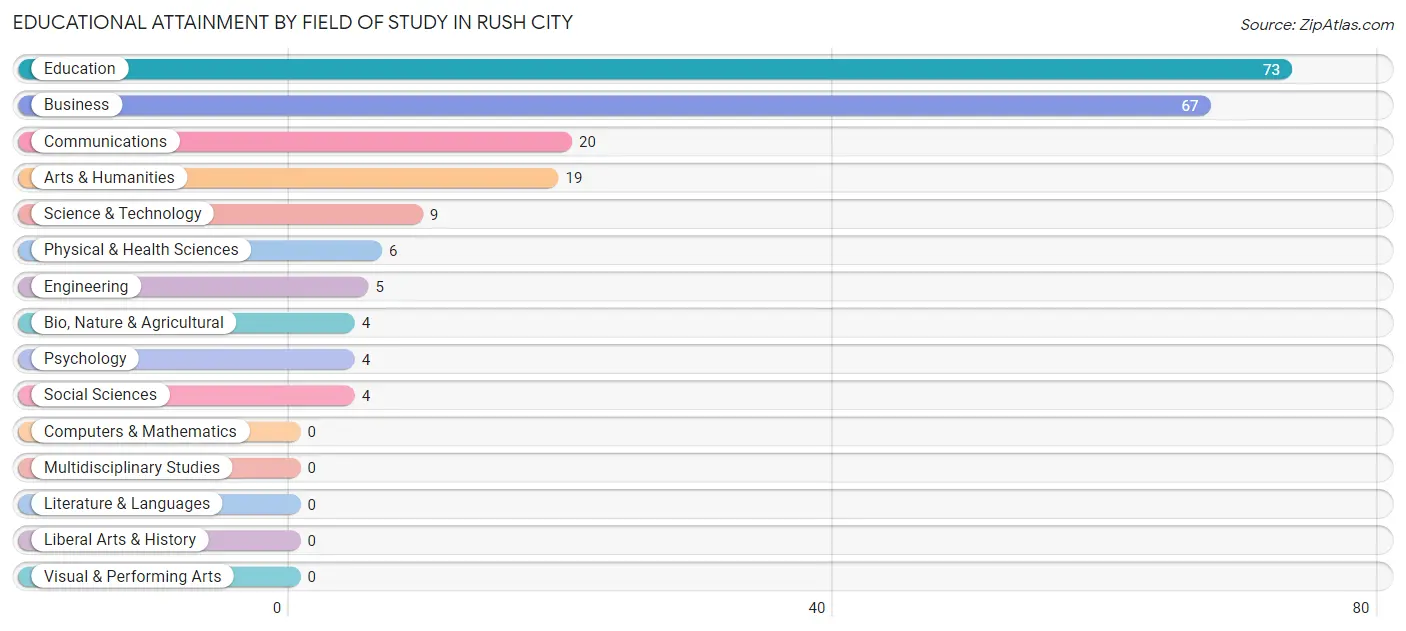
| Field of Study | # Graduates | % Graduates |
| Computers & Mathematics | 0 | 0.0% |
| Bio, Nature & Agricultural | 4 | 1.9% |
| Physical & Health Sciences | 6 | 2.8% |
| Psychology | 4 | 1.9% |
| Social Sciences | 4 | 1.9% |
| Engineering | 5 | 2.4% |
| Multidisciplinary Studies | 0 | 0.0% |
| Science & Technology | 9 | 4.3% |
| Business | 67 | 31.8% |
| Education | 73 | 34.6% |
| Literature & Languages | 0 | 0.0% |
| Liberal Arts & History | 0 | 0.0% |
| Visual & Performing Arts | 0 | 0.0% |
| Communications | 20 | 9.5% |
| Arts & Humanities | 19 | 9.0% |
| Total | 211 | 100.0% |
Transportation & Commute in Rush City
Vehicle Availability by Sex in Rush City
The most prevalent vehicle ownership categories in Rush City are males with 3 vehicles (216, accounting for 32.0%) and females with 3 vehicles (225, making up 36.2%).
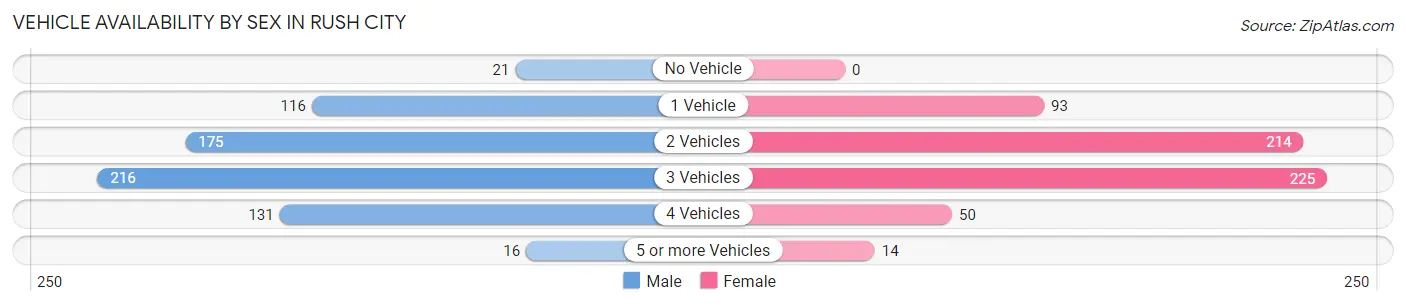
| Vehicles Available | Male | Female |
| No Vehicle | 21 (3.1%) | 0 (0.0%) |
| 1 Vehicle | 116 (17.2%) | 93 (15.6%) |
| 2 Vehicles | 175 (25.9%) | 214 (35.9%) |
| 3 Vehicles | 216 (32.0%) | 225 (37.8%) |
| 4 Vehicles | 131 (19.4%) | 50 (8.4%) |
| 5 or more Vehicles | 16 (2.4%) | 14 (2.4%) |
| Total | 675 (100.0%) | 596 (100.0%) |
Commute Time in Rush City
The most frequently occuring commute durations in Rush City are 30 to 34 minutes (316 commuters, 26.2%), 60 to 89 minutes (151 commuters, 12.5%), and 15 to 19 minutes (135 commuters, 11.2%).
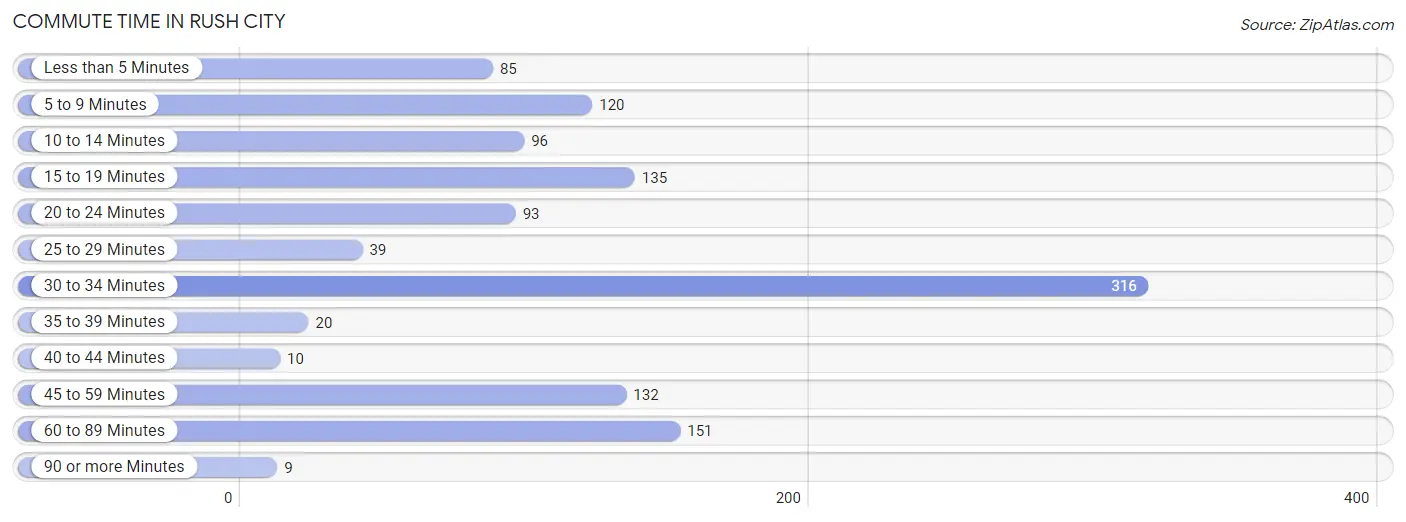
| Commute Time | # Commuters | % Commuters |
| Less than 5 Minutes | 85 | 7.0% |
| 5 to 9 Minutes | 120 | 10.0% |
| 10 to 14 Minutes | 96 | 8.0% |
| 15 to 19 Minutes | 135 | 11.2% |
| 20 to 24 Minutes | 93 | 7.7% |
| 25 to 29 Minutes | 39 | 3.2% |
| 30 to 34 Minutes | 316 | 26.2% |
| 35 to 39 Minutes | 20 | 1.7% |
| 40 to 44 Minutes | 10 | 0.8% |
| 45 to 59 Minutes | 132 | 11.0% |
| 60 to 89 Minutes | 151 | 12.5% |
| 90 or more Minutes | 9 | 0.7% |
Commute Time by Sex in Rush City
The most common commute times in Rush City are 30 to 34 minutes (155 commuters, 23.8%) for males and 30 to 34 minutes (161 commuters, 29.0%) for females.
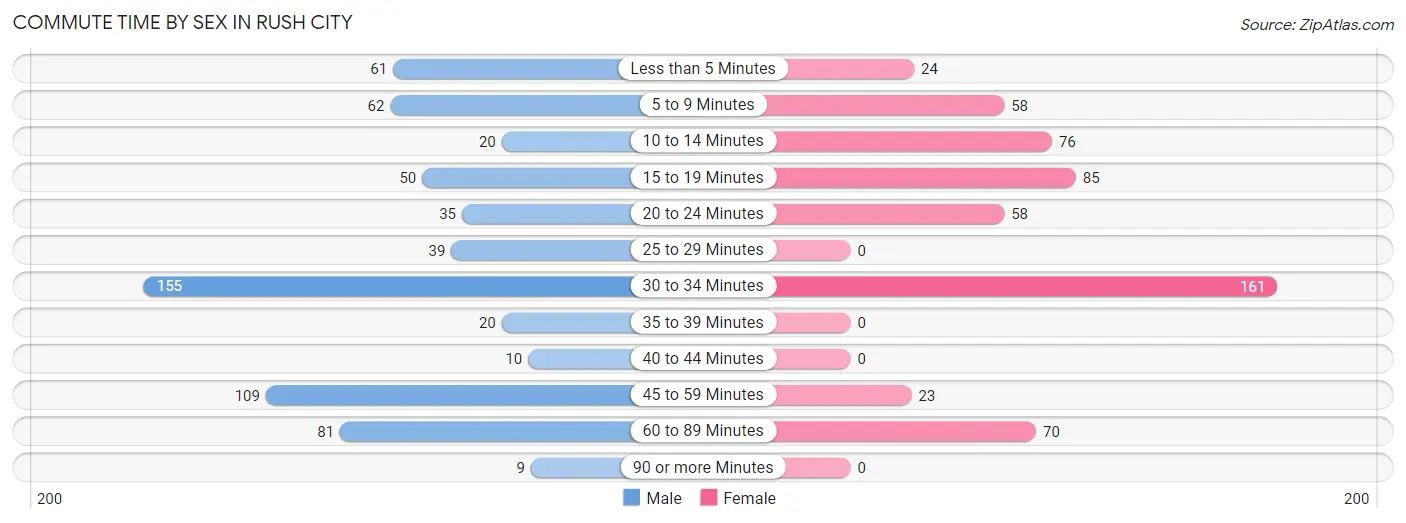
| Commute Time | Male | Female |
| Less than 5 Minutes | 61 (9.4%) | 24 (4.3%) |
| 5 to 9 Minutes | 62 (9.5%) | 58 (10.4%) |
| 10 to 14 Minutes | 20 (3.1%) | 76 (13.7%) |
| 15 to 19 Minutes | 50 (7.7%) | 85 (15.3%) |
| 20 to 24 Minutes | 35 (5.4%) | 58 (10.4%) |
| 25 to 29 Minutes | 39 (6.0%) | 0 (0.0%) |
| 30 to 34 Minutes | 155 (23.8%) | 161 (29.0%) |
| 35 to 39 Minutes | 20 (3.1%) | 0 (0.0%) |
| 40 to 44 Minutes | 10 (1.5%) | 0 (0.0%) |
| 45 to 59 Minutes | 109 (16.7%) | 23 (4.1%) |
| 60 to 89 Minutes | 81 (12.4%) | 70 (12.6%) |
| 90 or more Minutes | 9 (1.4%) | 0 (0.0%) |
Time of Departure to Work by Sex in Rush City
The most frequent times of departure to work in Rush City are 5:30 AM to 5:59 AM (106, 16.3%) for males and 6:30 AM to 6:59 AM (149, 26.9%) for females.
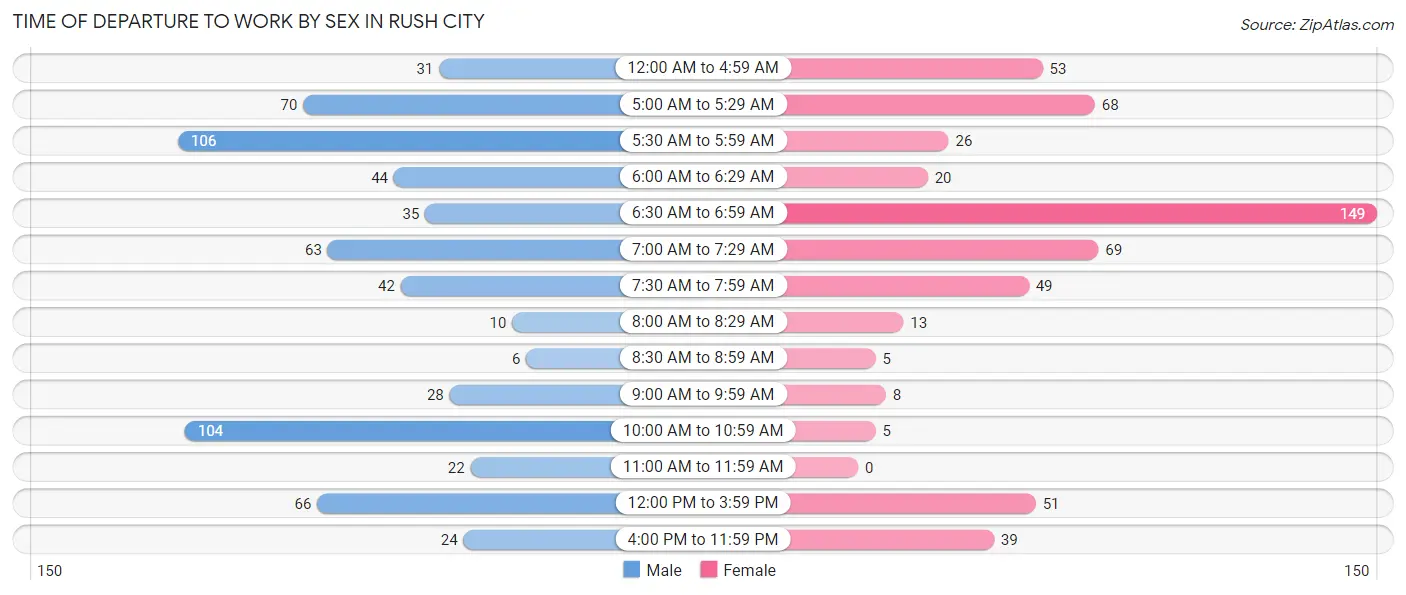
| Time of Departure | Male | Female |
| 12:00 AM to 4:59 AM | 31 (4.8%) | 53 (9.6%) |
| 5:00 AM to 5:29 AM | 70 (10.7%) | 68 (12.2%) |
| 5:30 AM to 5:59 AM | 106 (16.3%) | 26 (4.7%) |
| 6:00 AM to 6:29 AM | 44 (6.8%) | 20 (3.6%) |
| 6:30 AM to 6:59 AM | 35 (5.4%) | 149 (26.9%) |
| 7:00 AM to 7:29 AM | 63 (9.7%) | 69 (12.4%) |
| 7:30 AM to 7:59 AM | 42 (6.5%) | 49 (8.8%) |
| 8:00 AM to 8:29 AM | 10 (1.5%) | 13 (2.3%) |
| 8:30 AM to 8:59 AM | 6 (0.9%) | 5 (0.9%) |
| 9:00 AM to 9:59 AM | 28 (4.3%) | 8 (1.4%) |
| 10:00 AM to 10:59 AM | 104 (16.0%) | 5 (0.9%) |
| 11:00 AM to 11:59 AM | 22 (3.4%) | 0 (0.0%) |
| 12:00 PM to 3:59 PM | 66 (10.1%) | 51 (9.2%) |
| 4:00 PM to 11:59 PM | 24 (3.7%) | 39 (7.0%) |
| Total | 651 (100.0%) | 555 (100.0%) |
Housing Occupancy in Rush City
Occupancy by Ownership in Rush City
Of the total 1,011 dwellings in Rush City, owner-occupied units account for 612 (60.5%), while renter-occupied units make up 399 (39.5%).
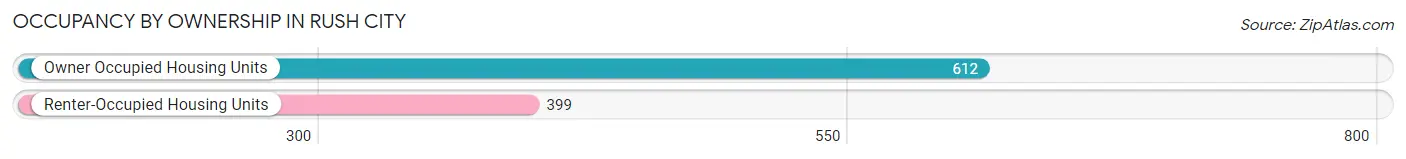
| Occupancy | # Housing Units | % Housing Units |
| Owner Occupied Housing Units | 612 | 60.5% |
| Renter-Occupied Housing Units | 399 | 39.5% |
| Total Occupied Housing Units | 1,011 | 100.0% |
Occupancy by Household Size in Rush City
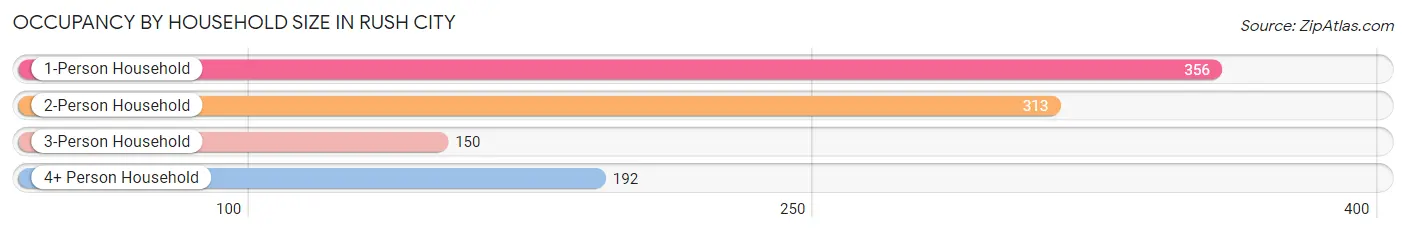
| Household Size | # Housing Units | % Housing Units |
| 1-Person Household | 356 | 35.2% |
| 2-Person Household | 313 | 31.0% |
| 3-Person Household | 150 | 14.8% |
| 4+ Person Household | 192 | 19.0% |
| Total Housing Units | 1,011 | 100.0% |
Occupancy by Ownership by Household Size in Rush City
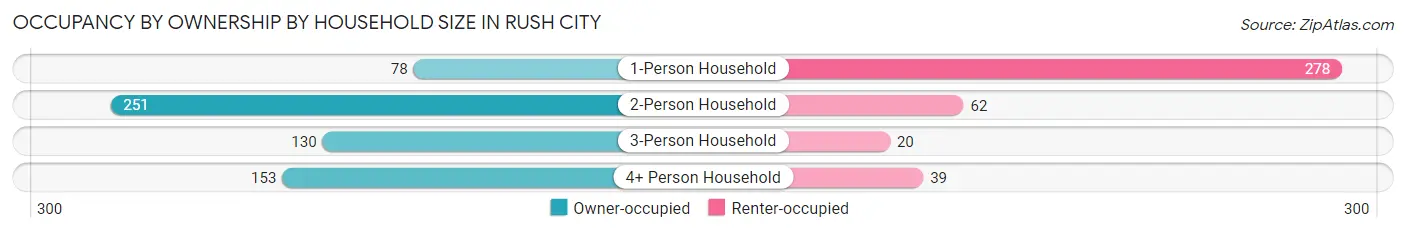
| Household Size | Owner-occupied | Renter-occupied |
| 1-Person Household | 78 (21.9%) | 278 (78.1%) |
| 2-Person Household | 251 (80.2%) | 62 (19.8%) |
| 3-Person Household | 130 (86.7%) | 20 (13.3%) |
| 4+ Person Household | 153 (79.7%) | 39 (20.3%) |
| Total Housing Units | 612 (60.5%) | 399 (39.5%) |
Occupancy by Educational Attainment in Rush City
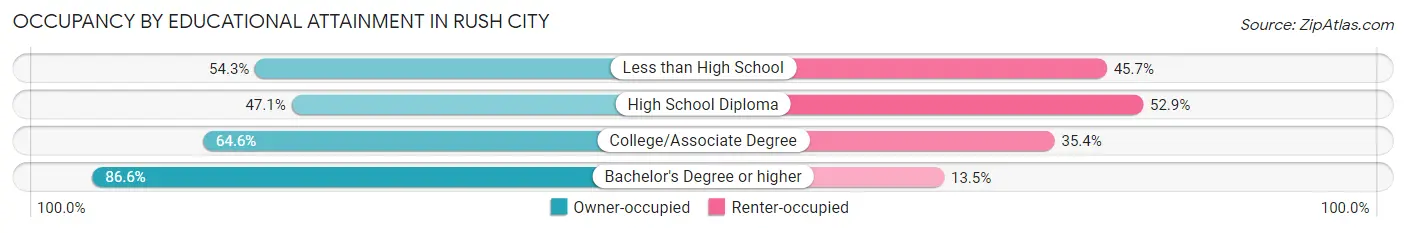
| Household Size | Owner-occupied | Renter-occupied |
| Less than High School | 38 (54.3%) | 32 (45.7%) |
| High School Diploma | 162 (47.1%) | 182 (52.9%) |
| College/Associate Degree | 309 (64.6%) | 169 (35.4%) |
| Bachelor's Degree or higher | 103 (86.6%) | 16 (13.5%) |
Occupancy by Age of Householder in Rush City
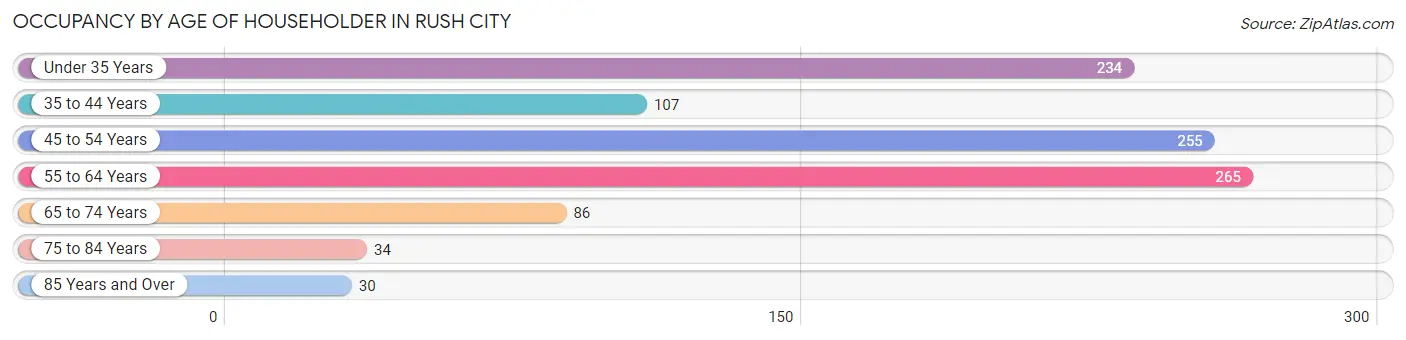
| Age Bracket | # Households | % Households |
| Under 35 Years | 234 | 23.2% |
| 35 to 44 Years | 107 | 10.6% |
| 45 to 54 Years | 255 | 25.2% |
| 55 to 64 Years | 265 | 26.2% |
| 65 to 74 Years | 86 | 8.5% |
| 75 to 84 Years | 34 | 3.4% |
| 85 Years and Over | 30 | 3.0% |
| Total | 1,011 | 100.0% |
Housing Finances in Rush City
Median Income by Occupancy in Rush City
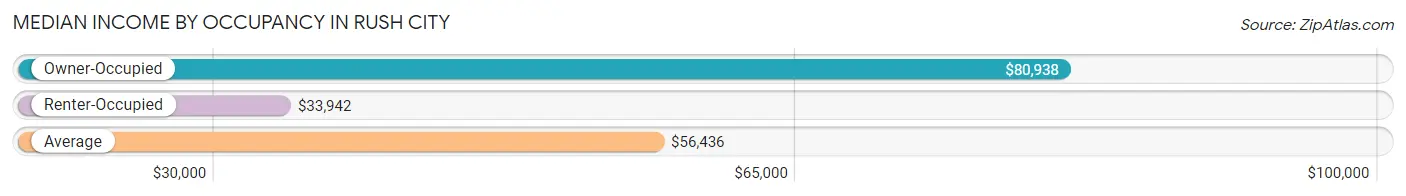
| Occupancy Type | # Households | Median Income |
| Owner-Occupied | 612 (60.5%) | $80,938 |
| Renter-Occupied | 399 (39.5%) | $33,942 |
| Average | 1,011 (100.0%) | $56,436 |
Occupancy by Householder Income Bracket in Rush City
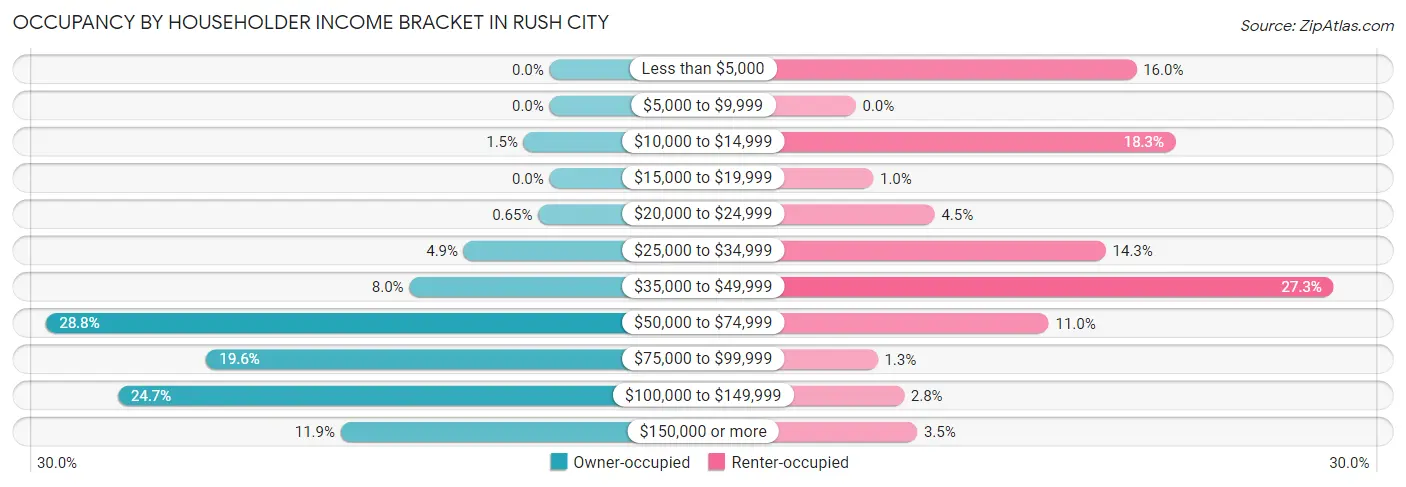
| Income Bracket | Owner-occupied | Renter-occupied |
| Less than $5,000 | 0 (0.0%) | 64 (16.0%) |
| $5,000 to $9,999 | 0 (0.0%) | 0 (0.0%) |
| $10,000 to $14,999 | 9 (1.5%) | 73 (18.3%) |
| $15,000 to $19,999 | 0 (0.0%) | 4 (1.0%) |
| $20,000 to $24,999 | 4 (0.6%) | 18 (4.5%) |
| $25,000 to $34,999 | 30 (4.9%) | 57 (14.3%) |
| $35,000 to $49,999 | 49 (8.0%) | 109 (27.3%) |
| $50,000 to $74,999 | 176 (28.8%) | 44 (11.0%) |
| $75,000 to $99,999 | 120 (19.6%) | 5 (1.3%) |
| $100,000 to $149,999 | 151 (24.7%) | 11 (2.8%) |
| $150,000 or more | 73 (11.9%) | 14 (3.5%) |
| Total | 612 (100.0%) | 399 (100.0%) |
Monthly Housing Cost Tiers in Rush City
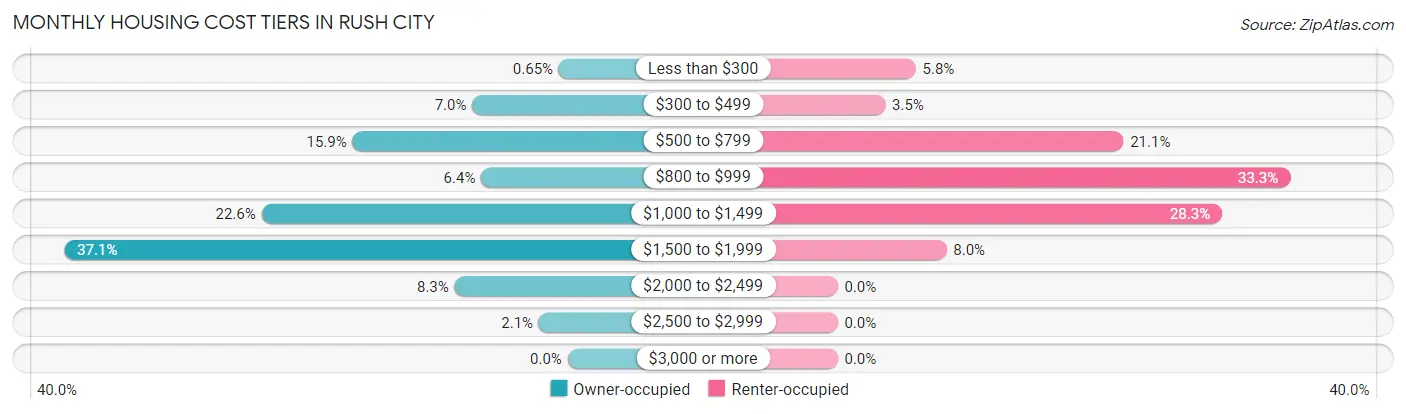
| Monthly Cost | Owner-occupied | Renter-occupied |
| Less than $300 | 4 (0.6%) | 23 (5.8%) |
| $300 to $499 | 43 (7.0%) | 14 (3.5%) |
| $500 to $799 | 97 (15.9%) | 84 (21.0%) |
| $800 to $999 | 39 (6.4%) | 133 (33.3%) |
| $1,000 to $1,499 | 138 (22.6%) | 113 (28.3%) |
| $1,500 to $1,999 | 227 (37.1%) | 32 (8.0%) |
| $2,000 to $2,499 | 51 (8.3%) | 0 (0.0%) |
| $2,500 to $2,999 | 13 (2.1%) | 0 (0.0%) |
| $3,000 or more | 0 (0.0%) | 0 (0.0%) |
| Total | 612 (100.0%) | 399 (100.0%) |
Physical Housing Characteristics in Rush City
Housing Structures in Rush City
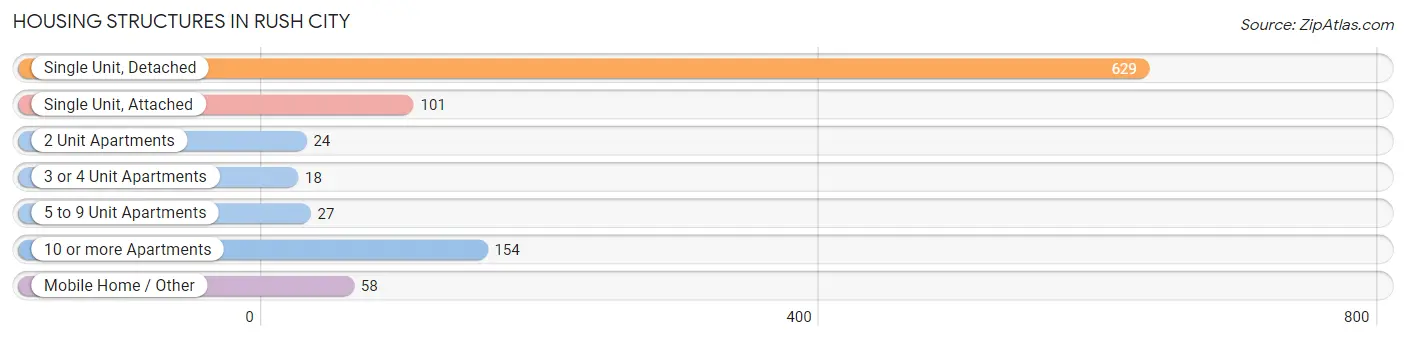
| Structure Type | # Housing Units | % Housing Units |
| Single Unit, Detached | 629 | 62.2% |
| Single Unit, Attached | 101 | 10.0% |
| 2 Unit Apartments | 24 | 2.4% |
| 3 or 4 Unit Apartments | 18 | 1.8% |
| 5 to 9 Unit Apartments | 27 | 2.7% |
| 10 or more Apartments | 154 | 15.2% |
| Mobile Home / Other | 58 | 5.7% |
| Total | 1,011 | 100.0% |
Housing Structures by Occupancy in Rush City
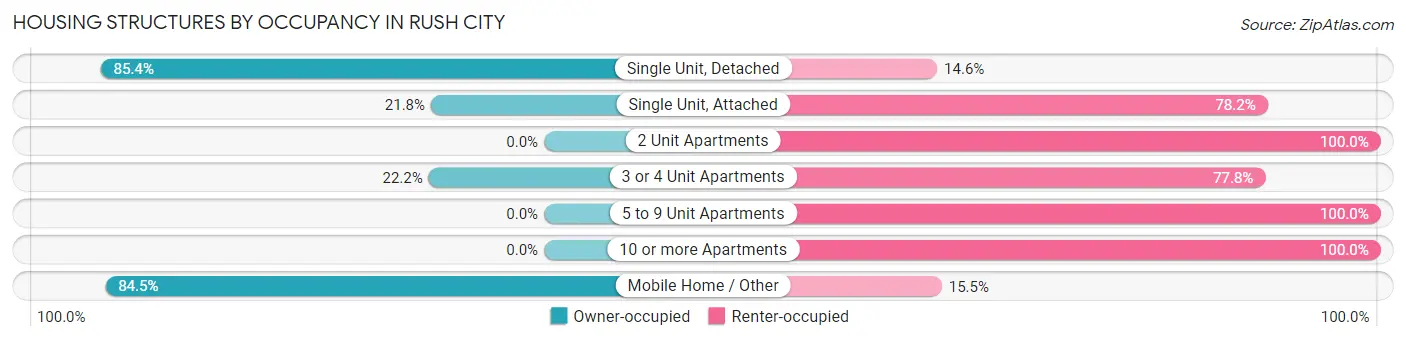
| Structure Type | Owner-occupied | Renter-occupied |
| Single Unit, Detached | 537 (85.4%) | 92 (14.6%) |
| Single Unit, Attached | 22 (21.8%) | 79 (78.2%) |
| 2 Unit Apartments | 0 (0.0%) | 24 (100.0%) |
| 3 or 4 Unit Apartments | 4 (22.2%) | 14 (77.8%) |
| 5 to 9 Unit Apartments | 0 (0.0%) | 27 (100.0%) |
| 10 or more Apartments | 0 (0.0%) | 154 (100.0%) |
| Mobile Home / Other | 49 (84.5%) | 9 (15.5%) |
| Total | 612 (60.5%) | 399 (39.5%) |
Housing Structures by Number of Rooms in Rush City
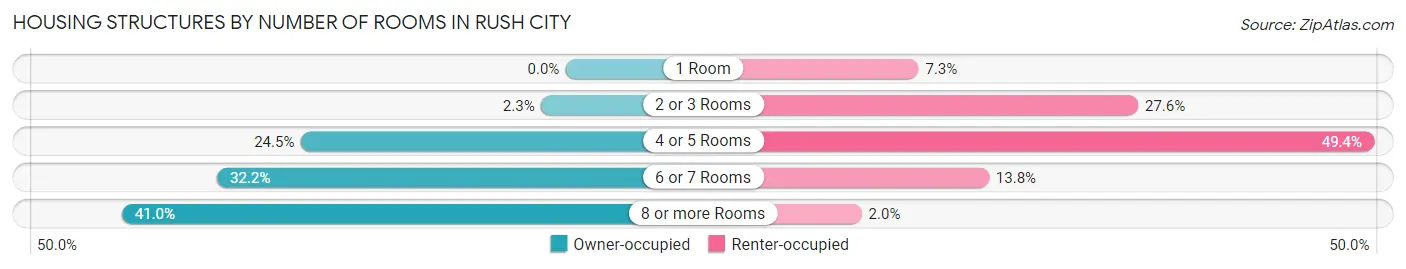
| Number of Rooms | Owner-occupied | Renter-occupied |
| 1 Room | 0 (0.0%) | 29 (7.3%) |
| 2 or 3 Rooms | 14 (2.3%) | 110 (27.6%) |
| 4 or 5 Rooms | 150 (24.5%) | 197 (49.4%) |
| 6 or 7 Rooms | 197 (32.2%) | 55 (13.8%) |
| 8 or more Rooms | 251 (41.0%) | 8 (2.0%) |
| Total | 612 (100.0%) | 399 (100.0%) |
Housing Structure by Heating Type in Rush City
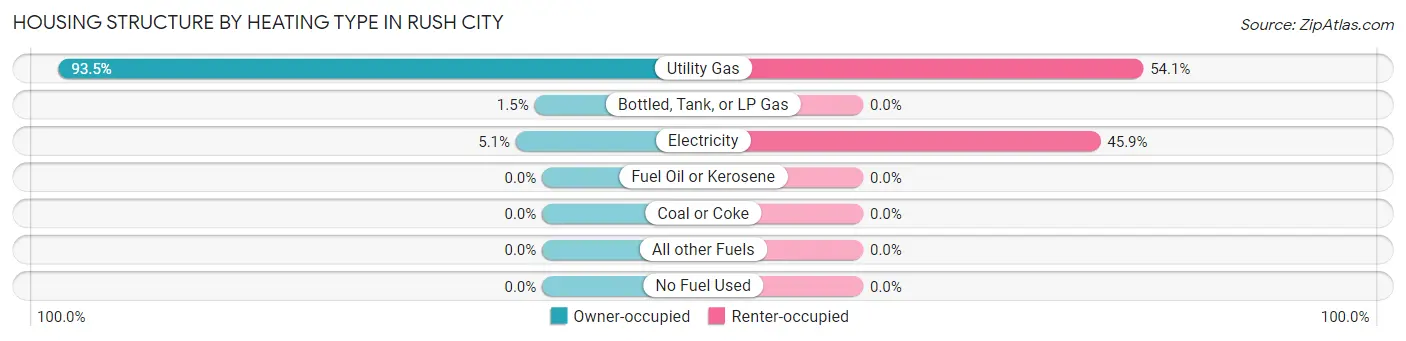
| Heating Type | Owner-occupied | Renter-occupied |
| Utility Gas | 572 (93.5%) | 216 (54.1%) |
| Bottled, Tank, or LP Gas | 9 (1.5%) | 0 (0.0%) |
| Electricity | 31 (5.1%) | 183 (45.9%) |
| Fuel Oil or Kerosene | 0 (0.0%) | 0 (0.0%) |
| Coal or Coke | 0 (0.0%) | 0 (0.0%) |
| All other Fuels | 0 (0.0%) | 0 (0.0%) |
| No Fuel Used | 0 (0.0%) | 0 (0.0%) |
| Total | 612 (100.0%) | 399 (100.0%) |
Household Vehicle Usage in Rush City
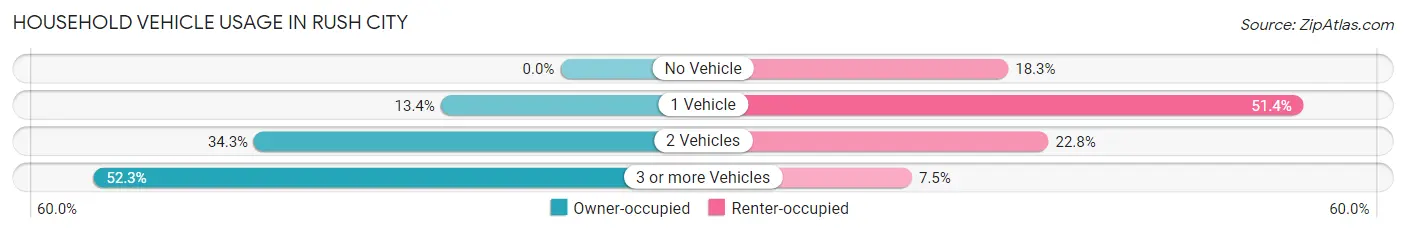
| Vehicles per Household | Owner-occupied | Renter-occupied |
| No Vehicle | 0 (0.0%) | 73 (18.3%) |
| 1 Vehicle | 82 (13.4%) | 205 (51.4%) |
| 2 Vehicles | 210 (34.3%) | 91 (22.8%) |
| 3 or more Vehicles | 320 (52.3%) | 30 (7.5%) |
| Total | 612 (100.0%) | 399 (100.0%) |
Real Estate & Mortgages in Rush City
Real Estate and Mortgage Overview in Rush City
| Characteristic | Without Mortgage | With Mortgage |
| Housing Units | 118 | 494 |
| Median Property Value | $169,000 | $190,600 |
| Median Household Income | $68,500 | $73 |
| Monthly Housing Costs | $559 | $0 |
| Real Estate Taxes | $2,159 | $9 |
Property Value by Mortgage Status in Rush City
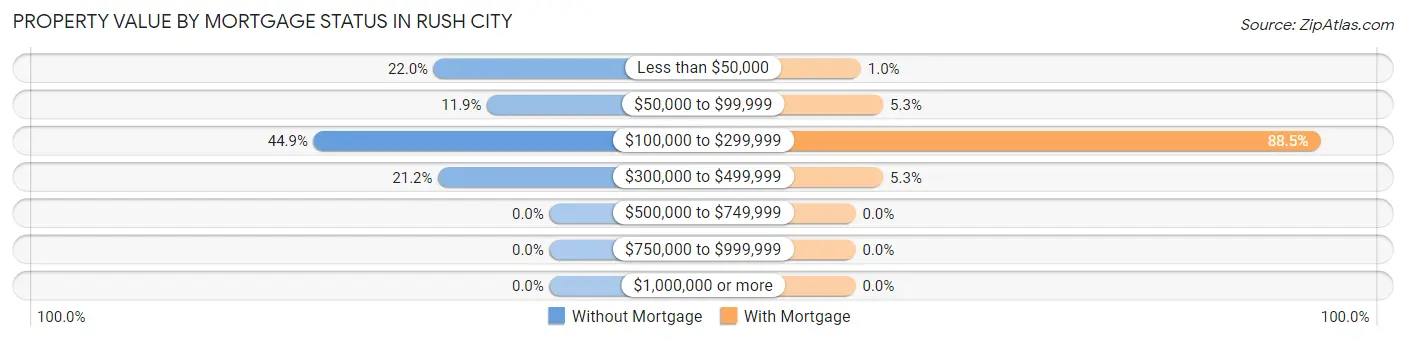
| Property Value | Without Mortgage | With Mortgage |
| Less than $50,000 | 26 (22.0%) | 5 (1.0%) |
| $50,000 to $99,999 | 14 (11.9%) | 26 (5.3%) |
| $100,000 to $299,999 | 53 (44.9%) | 437 (88.5%) |
| $300,000 to $499,999 | 25 (21.2%) | 26 (5.3%) |
| $500,000 to $749,999 | 0 (0.0%) | 0 (0.0%) |
| $750,000 to $999,999 | 0 (0.0%) | 0 (0.0%) |
| $1,000,000 or more | 0 (0.0%) | 0 (0.0%) |
| Total | 118 (100.0%) | 494 (100.0%) |
Household Income by Mortgage Status in Rush City
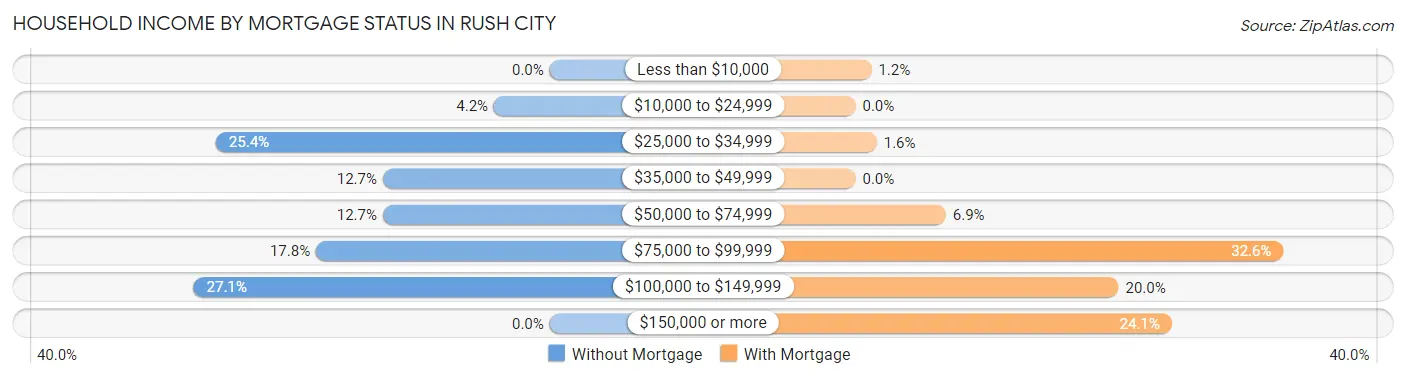
| Household Income | Without Mortgage | With Mortgage |
| Less than $10,000 | 0 (0.0%) | 6 (1.2%) |
| $10,000 to $24,999 | 5 (4.2%) | 0 (0.0%) |
| $25,000 to $34,999 | 30 (25.4%) | 8 (1.6%) |
| $35,000 to $49,999 | 15 (12.7%) | 0 (0.0%) |
| $50,000 to $74,999 | 15 (12.7%) | 34 (6.9%) |
| $75,000 to $99,999 | 21 (17.8%) | 161 (32.6%) |
| $100,000 to $149,999 | 32 (27.1%) | 99 (20.0%) |
| $150,000 or more | 0 (0.0%) | 119 (24.1%) |
| Total | 118 (100.0%) | 494 (100.0%) |
Property Value to Household Income Ratio in Rush City
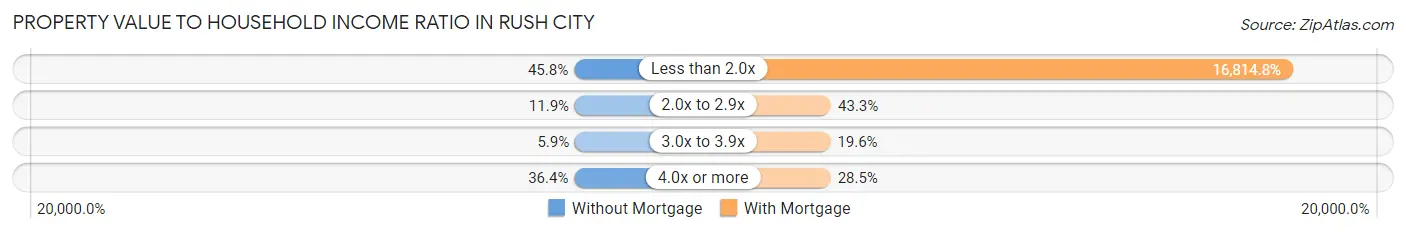
| Value-to-Income Ratio | Without Mortgage | With Mortgage |
| Less than 2.0x | 54 (45.8%) | 83,065 (16,814.8%) |
| 2.0x to 2.9x | 14 (11.9%) | 214 (43.3%) |
| 3.0x to 3.9x | 7 (5.9%) | 97 (19.6%) |
| 4.0x or more | 43 (36.4%) | 141 (28.5%) |
| Total | 118 (100.0%) | 494 (100.0%) |
Real Estate Taxes by Mortgage Status in Rush City
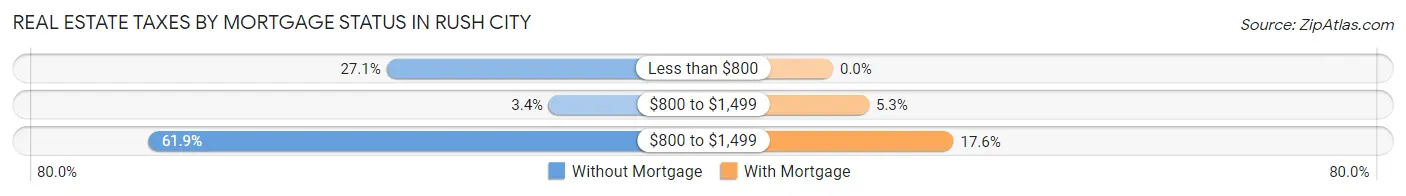
| Property Taxes | Without Mortgage | With Mortgage |
| Less than $800 | 32 (27.1%) | 0 (0.0%) |
| $800 to $1,499 | 4 (3.4%) | 26 (5.3%) |
| $800 to $1,499 | 73 (61.9%) | 87 (17.6%) |
| Total | 118 (100.0%) | 494 (100.0%) |
Health & Disability in Rush City
Health Insurance Coverage by Age in Rush City
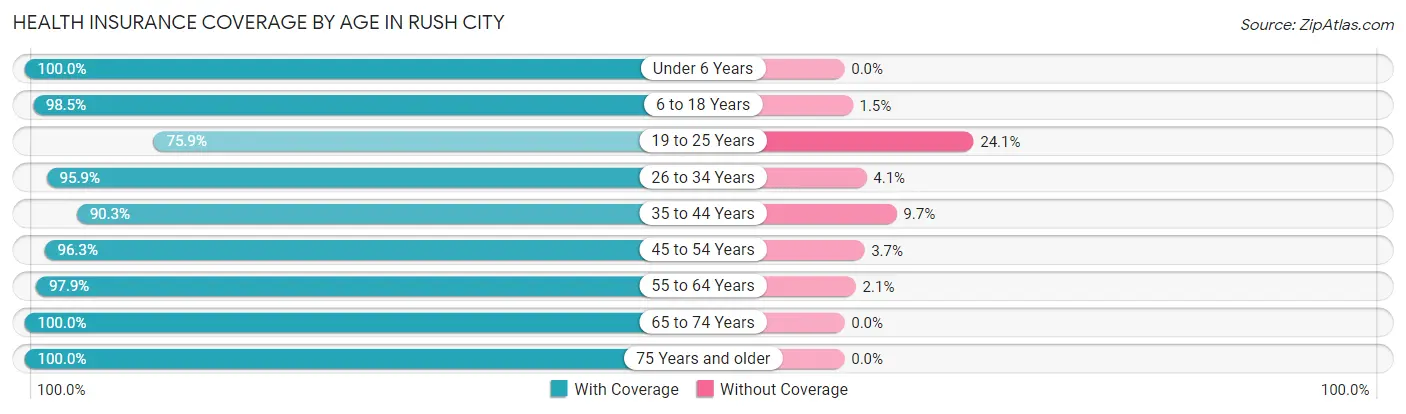
| Age Bracket | With Coverage | Without Coverage |
| Under 6 Years | 144 (100.0%) | 0 (0.0%) |
| 6 to 18 Years | 383 (98.5%) | 6 (1.5%) |
| 19 to 25 Years | 142 (75.9%) | 45 (24.1%) |
| 26 to 34 Years | 327 (95.9%) | 14 (4.1%) |
| 35 to 44 Years | 223 (90.3%) | 24 (9.7%) |
| 45 to 54 Years | 336 (96.3%) | 13 (3.7%) |
| 55 to 64 Years | 415 (97.9%) | 9 (2.1%) |
| 65 to 74 Years | 134 (100.0%) | 0 (0.0%) |
| 75 Years and older | 101 (100.0%) | 0 (0.0%) |
| Total | 2,205 (95.2%) | 111 (4.8%) |
Health Insurance Coverage by Citizenship Status in Rush City
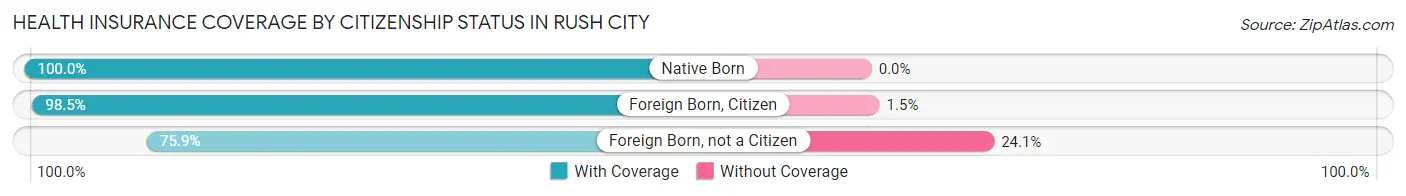
| Citizenship Status | With Coverage | Without Coverage |
| Native Born | 144 (100.0%) | 0 (0.0%) |
| Foreign Born, Citizen | 383 (98.5%) | 6 (1.5%) |
| Foreign Born, not a Citizen | 142 (75.9%) | 45 (24.1%) |
Health Insurance Coverage by Household Income in Rush City
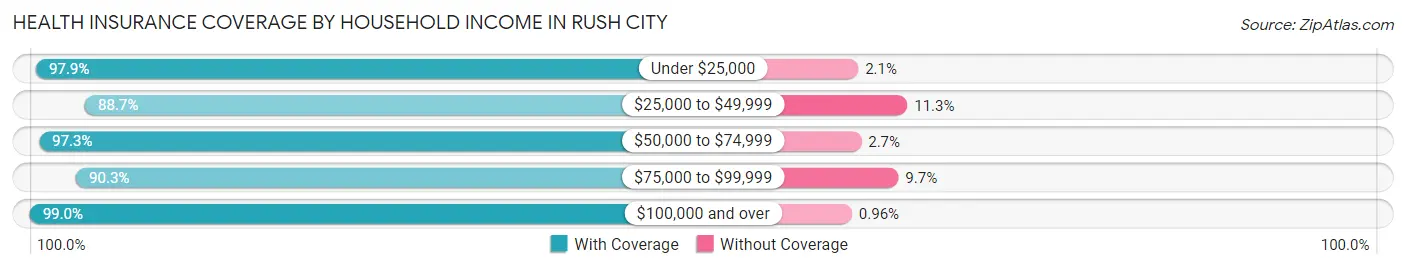
| Household Income | With Coverage | Without Coverage |
| Under $25,000 | 183 (97.9%) | 4 (2.1%) |
| $25,000 to $49,999 | 422 (88.7%) | 54 (11.3%) |
| $50,000 to $74,999 | 466 (97.3%) | 13 (2.7%) |
| $75,000 to $99,999 | 299 (90.3%) | 32 (9.7%) |
| $100,000 and over | 826 (99.0%) | 8 (1.0%) |
Public vs Private Health Insurance Coverage by Age in Rush City
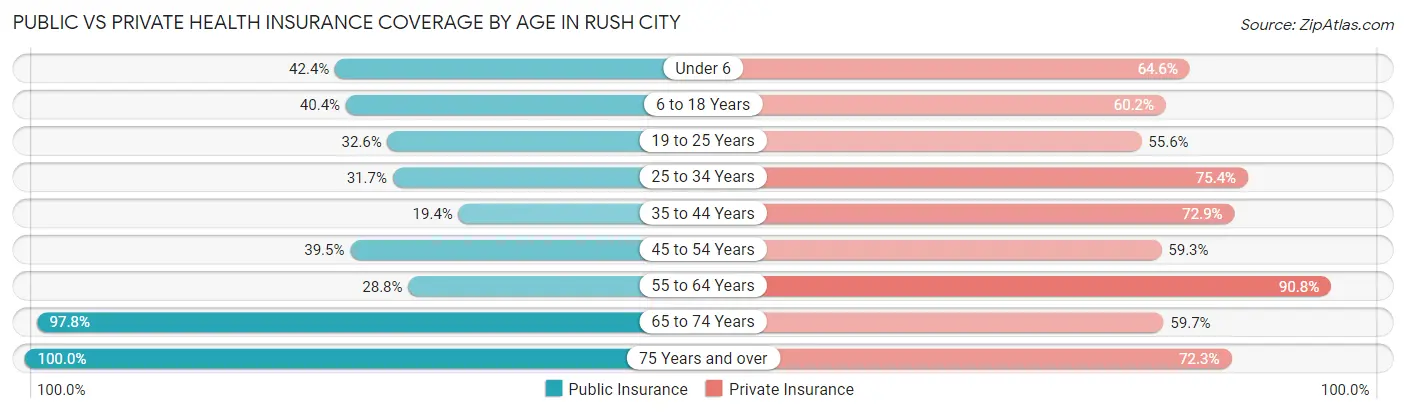
| Age Bracket | Public Insurance | Private Insurance |
| Under 6 | 61 (42.4%) | 93 (64.6%) |
| 6 to 18 Years | 157 (40.4%) | 234 (60.2%) |
| 19 to 25 Years | 61 (32.6%) | 104 (55.6%) |
| 25 to 34 Years | 108 (31.7%) | 257 (75.4%) |
| 35 to 44 Years | 48 (19.4%) | 180 (72.9%) |
| 45 to 54 Years | 138 (39.5%) | 207 (59.3%) |
| 55 to 64 Years | 122 (28.8%) | 385 (90.8%) |
| 65 to 74 Years | 131 (97.8%) | 80 (59.7%) |
| 75 Years and over | 101 (100.0%) | 73 (72.3%) |
| Total | 927 (40.0%) | 1,613 (69.7%) |
Disability Status by Sex by Age in Rush City
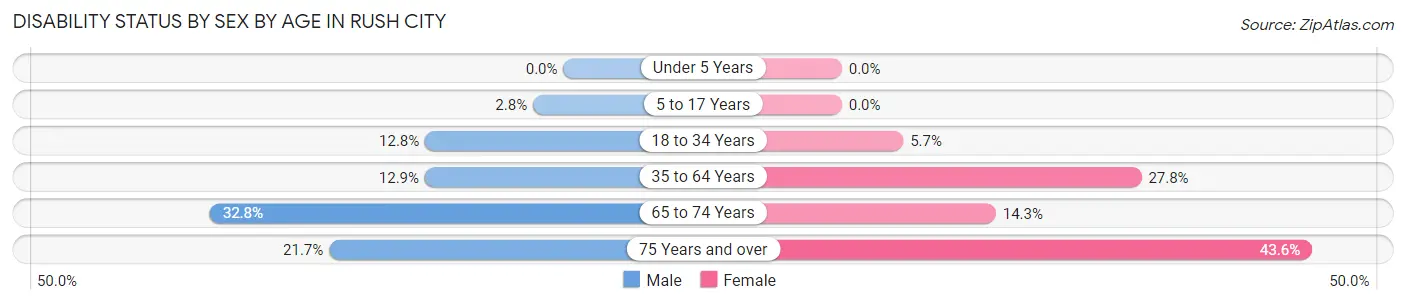
| Age Bracket | Male | Female |
| Under 5 Years | 0 (0.0%) | 0 (0.0%) |
| 5 to 17 Years | 7 (2.8%) | 0 (0.0%) |
| 18 to 34 Years | 34 (12.8%) | 15 (5.7%) |
| 35 to 64 Years | 59 (12.9%) | 156 (27.8%) |
| 65 to 74 Years | 21 (32.8%) | 10 (14.3%) |
| 75 Years and over | 10 (21.7%) | 24 (43.6%) |
Disability Class by Sex by Age in Rush City
Disability Class: Hearing Difficulty
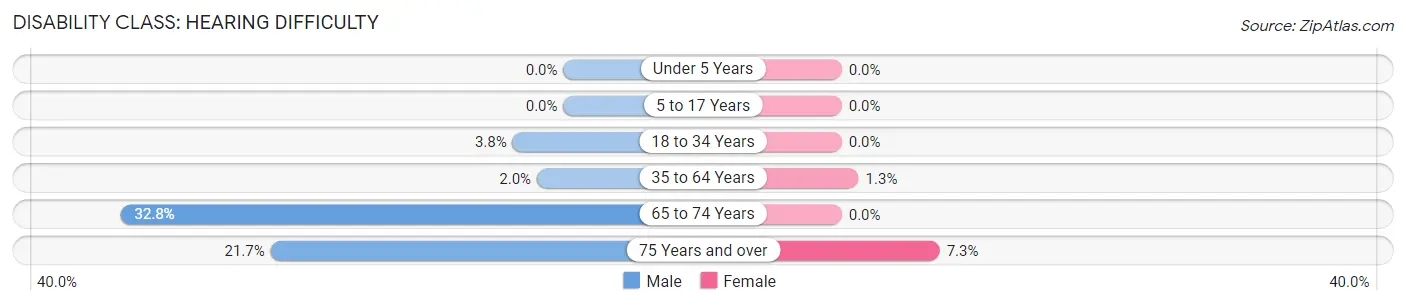
| Age Bracket | Male | Female |
| Under 5 Years | 0 (0.0%) | 0 (0.0%) |
| 5 to 17 Years | 0 (0.0%) | 0 (0.0%) |
| 18 to 34 Years | 10 (3.8%) | 0 (0.0%) |
| 35 to 64 Years | 9 (2.0%) | 7 (1.3%) |
| 65 to 74 Years | 21 (32.8%) | 0 (0.0%) |
| 75 Years and over | 10 (21.7%) | 4 (7.3%) |
Disability Class: Vision Difficulty
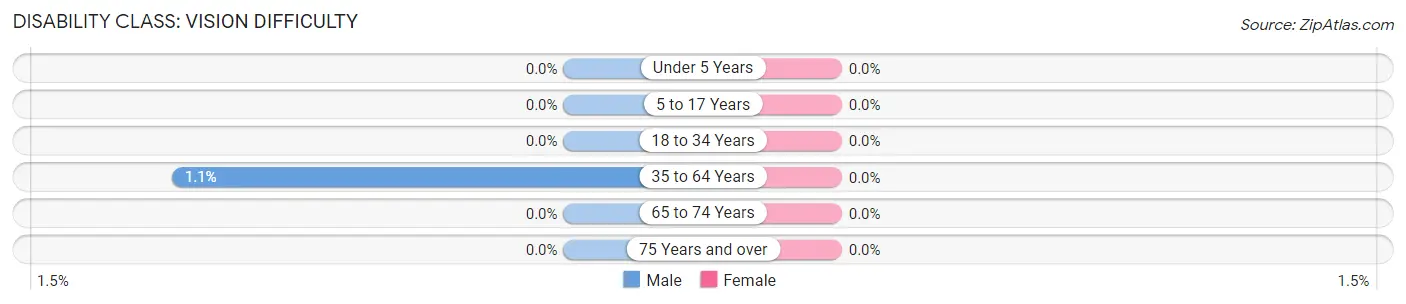
| Age Bracket | Male | Female |
| Under 5 Years | 0 (0.0%) | 0 (0.0%) |
| 5 to 17 Years | 0 (0.0%) | 0 (0.0%) |
| 18 to 34 Years | 0 (0.0%) | 0 (0.0%) |
| 35 to 64 Years | 5 (1.1%) | 0 (0.0%) |
| 65 to 74 Years | 0 (0.0%) | 0 (0.0%) |
| 75 Years and over | 0 (0.0%) | 0 (0.0%) |
Disability Class: Cognitive Difficulty
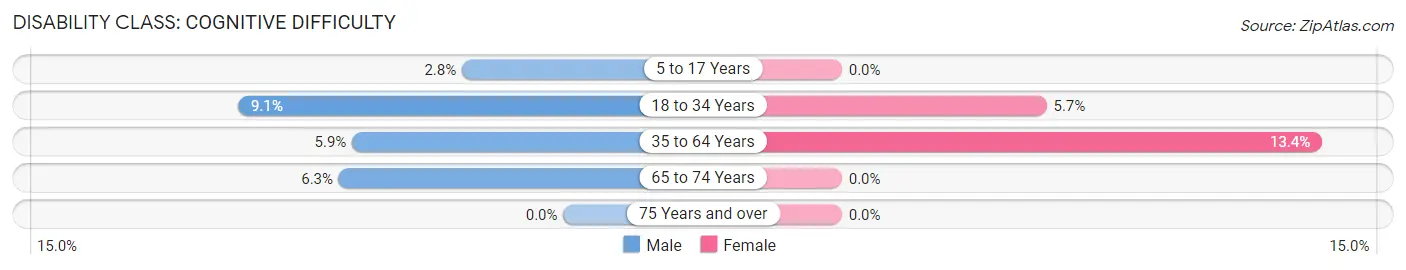
| Age Bracket | Male | Female |
| 5 to 17 Years | 7 (2.8%) | 0 (0.0%) |
| 18 to 34 Years | 24 (9.1%) | 15 (5.7%) |
| 35 to 64 Years | 27 (5.9%) | 75 (13.4%) |
| 65 to 74 Years | 4 (6.2%) | 0 (0.0%) |
| 75 Years and over | 0 (0.0%) | 0 (0.0%) |
Disability Class: Ambulatory Difficulty
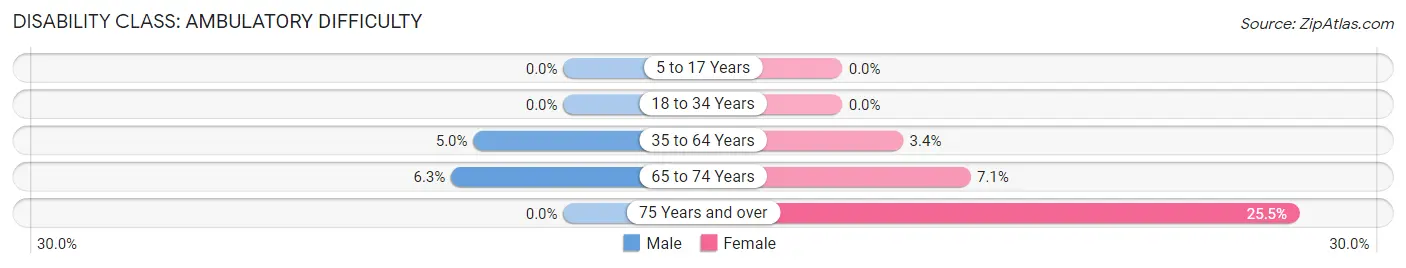
| Age Bracket | Male | Female |
| 5 to 17 Years | 0 (0.0%) | 0 (0.0%) |
| 18 to 34 Years | 0 (0.0%) | 0 (0.0%) |
| 35 to 64 Years | 23 (5.0%) | 19 (3.4%) |
| 65 to 74 Years | 4 (6.2%) | 5 (7.1%) |
| 75 Years and over | 0 (0.0%) | 14 (25.5%) |
Disability Class: Self-Care Difficulty
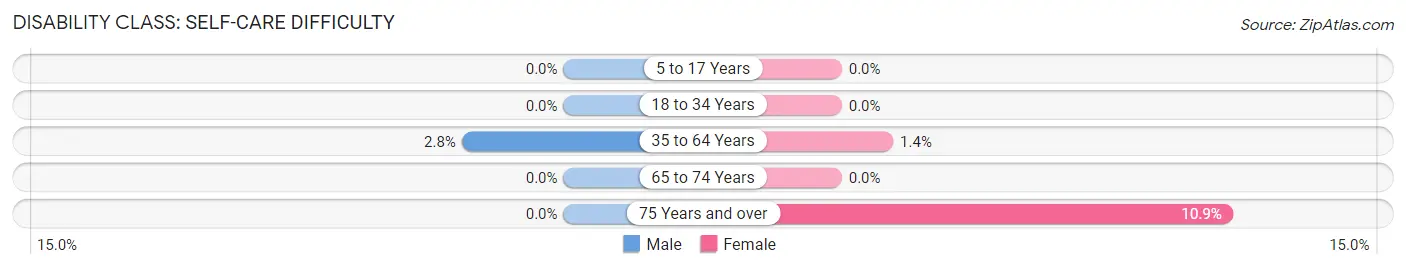
| Age Bracket | Male | Female |
| 5 to 17 Years | 0 (0.0%) | 0 (0.0%) |
| 18 to 34 Years | 0 (0.0%) | 0 (0.0%) |
| 35 to 64 Years | 13 (2.8%) | 8 (1.4%) |
| 65 to 74 Years | 0 (0.0%) | 0 (0.0%) |
| 75 Years and over | 0 (0.0%) | 6 (10.9%) |
Technology Access in Rush City
Computing Device Access in Rush City
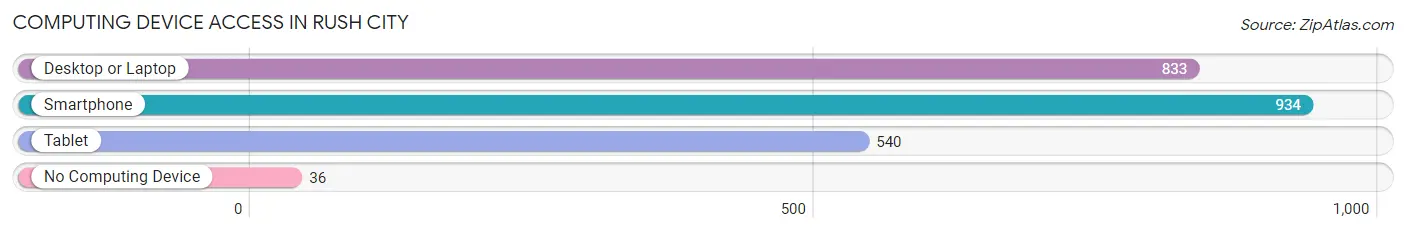
| Device Type | # Households | % Households |
| Desktop or Laptop | 833 | 82.4% |
| Smartphone | 934 | 92.4% |
| Tablet | 540 | 53.4% |
| No Computing Device | 36 | 3.6% |
| Total | 1,011 | 100.0% |
Internet Access in Rush City
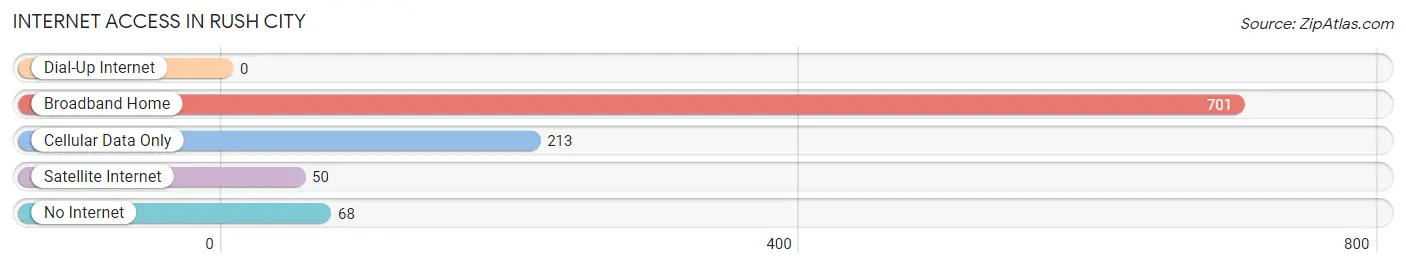
| Internet Type | # Households | % Households |
| Dial-Up Internet | 0 | 0.0% |
| Broadband Home | 701 | 69.3% |
| Cellular Data Only | 213 | 21.1% |
| Satellite Internet | 50 | 5.0% |
| No Internet | 68 | 6.7% |
| Total | 1,011 | 100.0% |
Rush City Summary
City of Rush City Minnesota
History
The city of Rush City, Minnesota is located in Chisago County, approximately 50 miles north of the Twin Cities. The city was founded in 1856 by a group of settlers from Sweden, who named the area after the nearby Rush River. The city was incorporated in 1887 and has since grown to a population of over 2,000 people.
The city was originally a farming community, with the main crops being wheat, oats, and barley. In the early 1900s, the city began to diversify its economy with the addition of a sawmill, a creamery, and a brickyard. The city also became a popular destination for tourists, as it was located near several lakes and rivers.
In the 1950s, the city began to experience a population boom, as many people moved to the area to take advantage of the growing economy. The city also began to attract new businesses, such as a furniture factory, a printing company, and a plastics plant.
Geography
Rush City is located in the northern part of Chisago County, approximately 50 miles north of the Twin Cities. The city is situated on the Rush River, which flows through the city and is a popular destination for fishing and boating. The city is surrounded by several lakes, including Rush Lake, Big Rush Lake, and Little Rush Lake.
The city is located in a region of rolling hills and forests, with the majority of the land being used for agricultural purposes. The city is located in a temperate climate, with hot summers and cold winters.
Economy
The economy of Rush City is largely based on agriculture, with the main crops being wheat, oats, and barley. The city also has several manufacturing businesses, including a furniture factory, a printing company, and a plastics plant.
The city is also home to several small businesses, such as restaurants, retail stores, and service providers. The city is also home to a number of tourist attractions, such as the Rush City Historical Museum and the Rush City Zoo.
Demographics
As of the 2010 census, the population of Rush City was 2,072. The population is predominantly white (96.2%), with the remaining population being made up of African Americans (1.2%), Asians (0.7%), and other races (1.9%).
The median household income in Rush City is $50,945, and the median home value is $150,000. The city has a poverty rate of 11.2%, which is slightly higher than the national average.
Conclusion
The city of Rush City, Minnesota is a small city located in Chisago County, approximately 50 miles north of the Twin Cities. The city was founded in 1856 by a group of Swedish settlers and has since grown to a population of over 2,000 people. The city is largely based on agriculture, with the main crops being wheat, oats, and barley. The city also has several manufacturing businesses, as well as a number of small businesses and tourist attractions. The population of Rush City is predominantly white, with the median household income being $50,945 and the median home value being $150,000.
Common Questions
What is Per Capita Income in Rush City?
Per Capita income in Rush City is $24,742.
What is the Median Family Income in Rush City?
Median Family Income in Rush City is $65,750.
What is the Median Household income in Rush City?
Median Household Income in Rush City is $56,436.
What is Income or Wage Gap in Rush City?
Income or Wage Gap in Rush City is 38.0%.
Women in Rush City earn 62.0 cents for every dollar earned by a man.
What is Inequality or Gini Index in Rush City?
Inequality or Gini Index in Rush City is 0.41.
What is the Total Population of Rush City?
Total Population of Rush City is 3,239.
What is the Total Male Population of Rush City?
Total Male Population of Rush City is 2,067.
What is the Total Female Population of Rush City?
Total Female Population of Rush City is 1,172.
What is the Ratio of Males per 100 Females in Rush City?
There are 176.37 Males per 100 Females in Rush City.
What is the Ratio of Females per 100 Males in Rush City?
There are 56.70 Females per 100 Males in Rush City.
What is the Median Population Age in Rush City?
Median Population Age in Rush City is 35.9 Years.
What is the Average Family Size in Rush City
Average Family Size in Rush City is 2.9 People.
What is the Average Household Size in Rush City
Average Household Size in Rush City is 2.3 People.
How Large is the Labor Force in Rush City?
There are 1,370 People in the Labor Forcein in Rush City.
What is the Percentage of People in the Labor Force in Rush City?
49.4% of People are in the Labor Force in Rush City.
What is the Unemployment Rate in Rush City?
Unemployment Rate in Rush City is 5.6%.