Zip Codes with the Highest Percentage of Population with a Degree in Liberal Arts and History in Sterling Heights, MI
RELATED REPORTS & OPTIONS
Liberal Arts and History
Sterling Heights
Compare Zip Codes
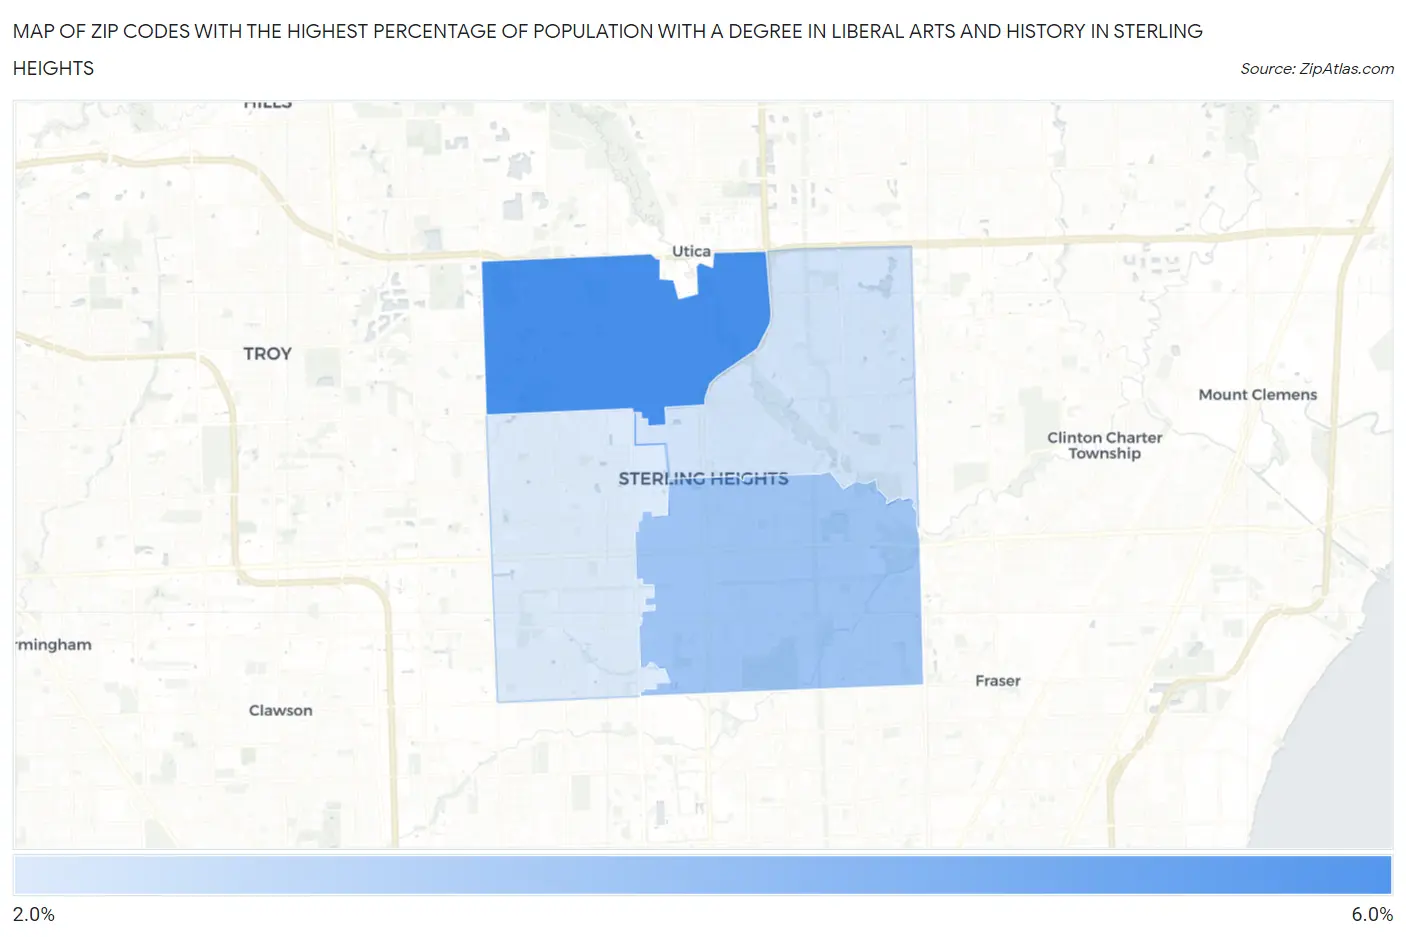
Map of Zip Codes with the Highest Percentage of Population with a Degree in Liberal Arts and History in Sterling Heights
2.5%
5.4%
Zip Codes with the Highest Percentage of Population with a Degree in Liberal Arts and History in Sterling Heights, MI
| Zip Code | % Graduates | vs State | vs National | |
| 1. | 48314 | 5.4% | 4.0%(+1.41)#249 | 4.9%(+0.525)#10,141 |
| 2. | 48312 | 3.7% | 4.0%(-0.293)#458 | 4.9%(-1.18)#15,951 |
| 3. | 48313 | 2.7% | 4.0%(-1.27)#625 | 4.9%(-2.16)#19,271 |
| 4. | 48310 | 2.5% | 4.0%(-1.48)#656 | 4.9%(-2.37)#19,957 |
1
Common Questions
What are the Top 3 Zip Codes with the Highest Percentage of Population with a Degree in Liberal Arts and History in Sterling Heights, MI?
Top 3 Zip Codes with the Highest Percentage of Population with a Degree in Liberal Arts and History in Sterling Heights, MI are:
What zip code has the Highest Percentage of Population with a Degree in Liberal Arts and History in Sterling Heights, MI?
48314 has the Highest Percentage of Population with a Degree in Liberal Arts and History in Sterling Heights, MI with 5.4%.
What is the Percentage of Population with a Degree in Liberal Arts and History in Sterling Heights, MI?
Percentage of Population with a Degree in Liberal Arts and History in Sterling Heights is 3.5%.
What is the Percentage of Population with a Degree in Liberal Arts and History in Michigan?
Percentage of Population with a Degree in Liberal Arts and History in Michigan is 4.0%.
What is the Percentage of Population with a Degree in Liberal Arts and History in the United States?
Percentage of Population with a Degree in Liberal Arts and History in the United States is 4.9%.