Zip Codes with the Highest Percentage of Population Employed in Security & Protection in Sterling Heights, MI
RELATED REPORTS & OPTIONS
Security & Protection
Sterling Heights
Compare Zip Codes
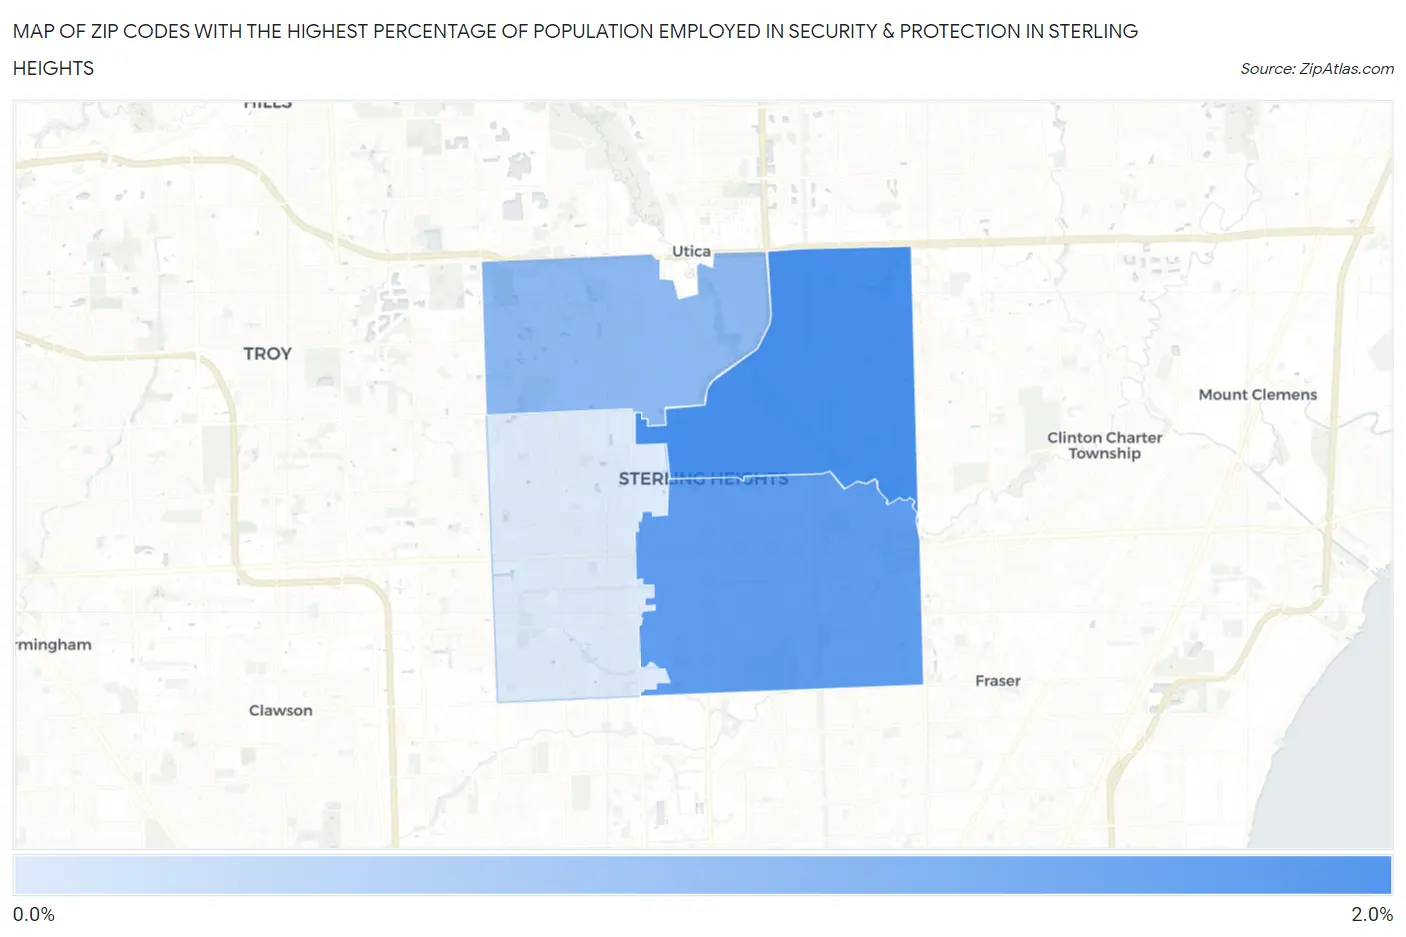
Map of Zip Codes with the Highest Percentage of Population Employed in Security & Protection in Sterling Heights
0.73%
1.7%
Zip Codes with the Highest Percentage of Population Employed in Security & Protection in Sterling Heights, MI
| Zip Code | % Employed | vs State | vs National | |
| 1. | 48313 | 1.7% | 1.6%(+0.022)#396 | 2.1%(-0.485)#14,955 |
| 2. | 48312 | 1.5% | 1.6%(-0.117)#444 | 2.1%(-0.624)#15,990 |
| 3. | 48314 | 1.2% | 1.6%(-0.407)#540 | 2.1%(-0.914)#18,243 |
| 4. | 48310 | 0.73% | 1.6%(-0.908)#702 | 2.1%(-1.41)#21,845 |
1
Common Questions
What are the Top 3 Zip Codes with the Highest Percentage of Population Employed in Security & Protection in Sterling Heights, MI?
Top 3 Zip Codes with the Highest Percentage of Population Employed in Security & Protection in Sterling Heights, MI are:
What zip code has the Highest Percentage of Population Employed in Security & Protection in Sterling Heights, MI?
48313 has the Highest Percentage of Population Employed in Security & Protection in Sterling Heights, MI with 1.7%.
What is the Percentage of Population Employed in Security & Protection in Sterling Heights, MI?
Percentage of Population Employed in Security & Protection in Sterling Heights is 1.3%.
What is the Percentage of Population Employed in Security & Protection in Michigan?
Percentage of Population Employed in Security & Protection in Michigan is 1.6%.
What is the Percentage of Population Employed in Security & Protection in the United States?
Percentage of Population Employed in Security & Protection in the United States is 2.1%.