Zip Codes with the Highest Percentage of Population Employed in Life, Physical & Social Science in Sterling Heights, MI
RELATED REPORTS & OPTIONS
Life, Physical & Social Science
Sterling Heights
Compare Zip Codes
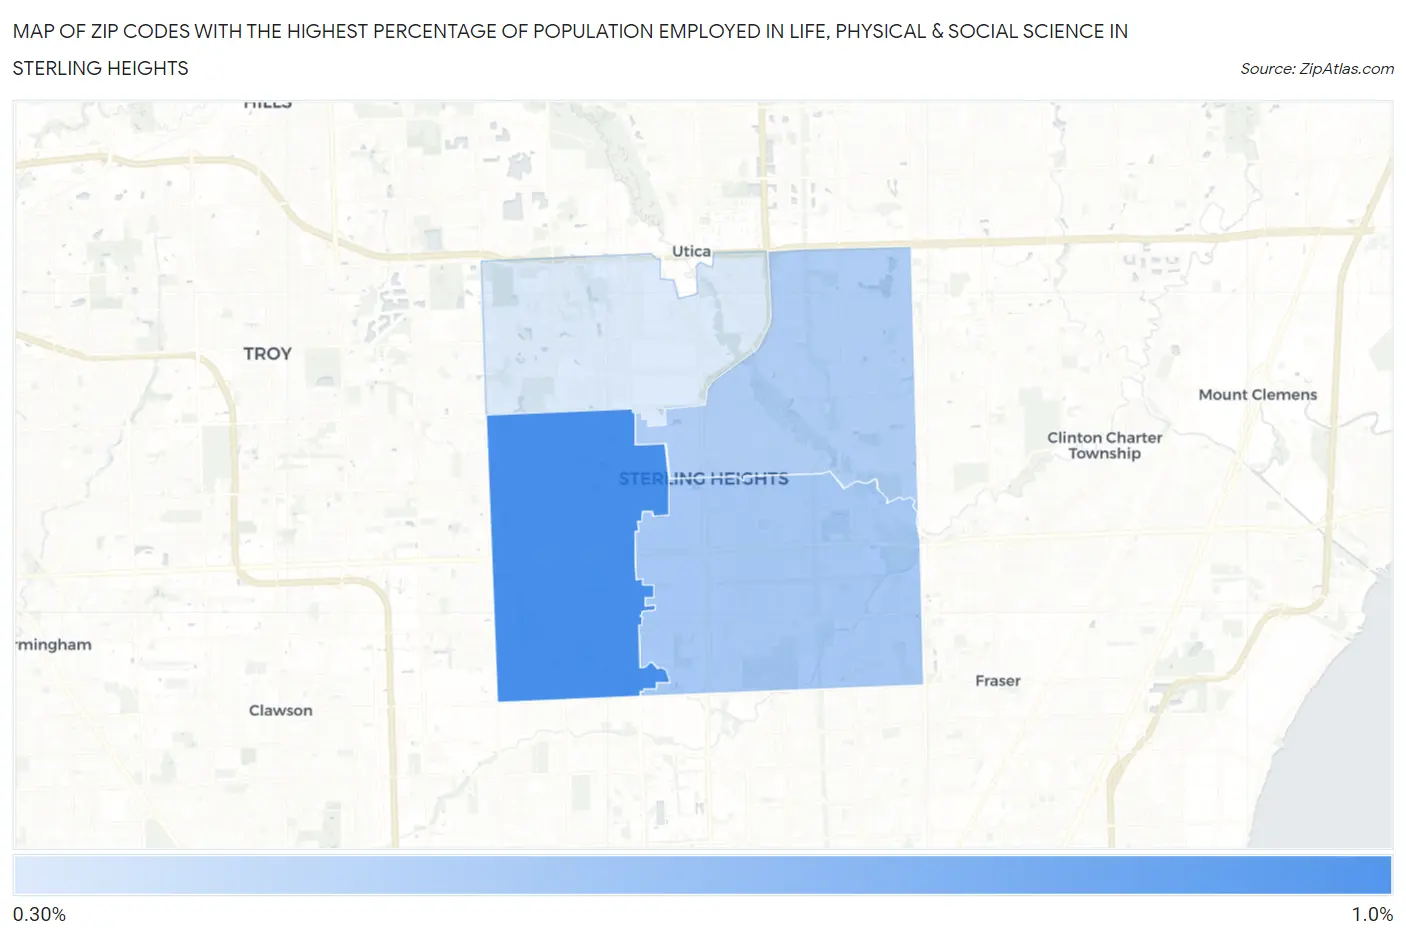
Map of Zip Codes with the Highest Percentage of Population Employed in Life, Physical & Social Science in Sterling Heights
0.35%
0.82%
Zip Codes with the Highest Percentage of Population Employed in Life, Physical & Social Science in Sterling Heights, MI
| Zip Code | % Employed | vs State | vs National | |
| 1. | 48310 | 0.82% | 0.88%(-0.060)#300 | 1.1%(-0.267)#10,743 |
| 2. | 48312 | 0.53% | 0.88%(-0.359)#441 | 1.1%(-0.566)#14,208 |
| 3. | 48313 | 0.50% | 0.88%(-0.388)#456 | 1.1%(-0.595)#14,554 |
| 4. | 48314 | 0.35% | 0.88%(-0.535)#554 | 1.1%(-0.742)#16,417 |
1
Common Questions
What are the Top 3 Zip Codes with the Highest Percentage of Population Employed in Life, Physical & Social Science in Sterling Heights, MI?
Top 3 Zip Codes with the Highest Percentage of Population Employed in Life, Physical & Social Science in Sterling Heights, MI are:
What zip code has the Highest Percentage of Population Employed in Life, Physical & Social Science in Sterling Heights, MI?
48310 has the Highest Percentage of Population Employed in Life, Physical & Social Science in Sterling Heights, MI with 0.82%.
What is the Percentage of Population Employed in Life, Physical & Social Science in Sterling Heights, MI?
Percentage of Population Employed in Life, Physical & Social Science in Sterling Heights is 0.58%.
What is the Percentage of Population Employed in Life, Physical & Social Science in Michigan?
Percentage of Population Employed in Life, Physical & Social Science in Michigan is 0.88%.
What is the Percentage of Population Employed in Life, Physical & Social Science in the United States?
Percentage of Population Employed in Life, Physical & Social Science in the United States is 1.1%.