Zip Codes with the Highest Percentage of Population Employed in Architecture & Engineering in Sterling Heights, MI
RELATED REPORTS & OPTIONS
Architecture & Engineering
Sterling Heights
Compare Zip Codes
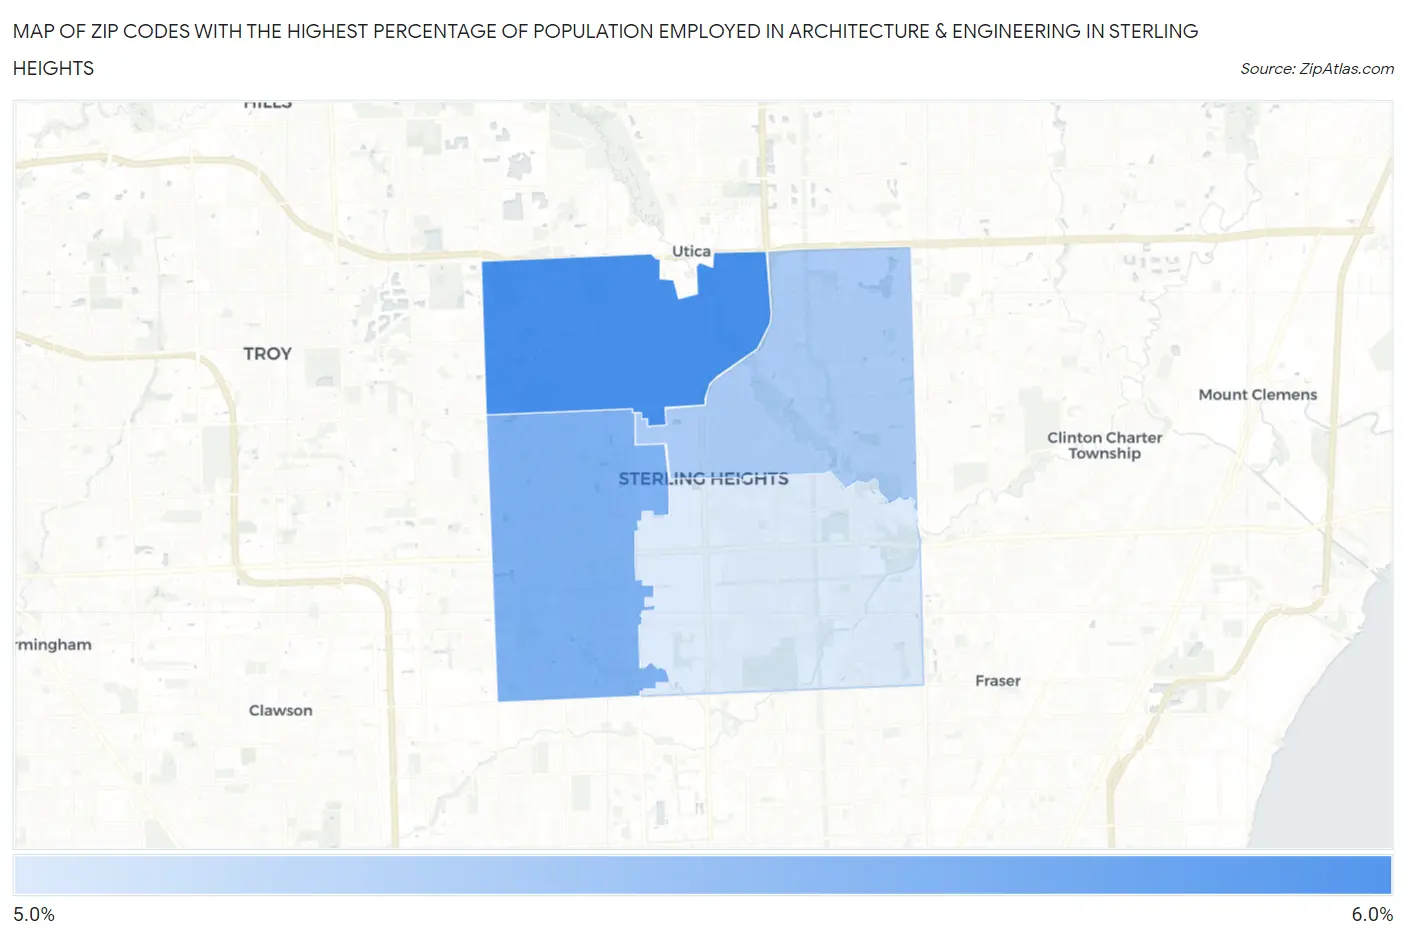
Map of Zip Codes with the Highest Percentage of Population Employed in Architecture & Engineering in Sterling Heights
5.3%
5.7%
Zip Codes with the Highest Percentage of Population Employed in Architecture & Engineering in Sterling Heights, MI
| Zip Code | % Employed | vs State | vs National | |
| 1. | 48314 | 5.7% | 3.4%(+2.30)#87 | 2.1%(+3.51)#1,237 |
| 2. | 48310 | 5.5% | 3.4%(+2.16)#96 | 2.1%(+3.38)#1,314 |
| 3. | 48313 | 5.4% | 3.4%(+2.05)#99 | 2.1%(+3.26)#1,380 |
| 4. | 48312 | 5.3% | 3.4%(+1.92)#104 | 2.1%(+3.14)#1,457 |
1
Common Questions
What are the Top 3 Zip Codes with the Highest Percentage of Population Employed in Architecture & Engineering in Sterling Heights, MI?
Top 3 Zip Codes with the Highest Percentage of Population Employed in Architecture & Engineering in Sterling Heights, MI are:
What zip code has the Highest Percentage of Population Employed in Architecture & Engineering in Sterling Heights, MI?
48314 has the Highest Percentage of Population Employed in Architecture & Engineering in Sterling Heights, MI with 5.7%.
What is the Percentage of Population Employed in Architecture & Engineering in Sterling Heights, MI?
Percentage of Population Employed in Architecture & Engineering in Sterling Heights is 5.5%.
What is the Percentage of Population Employed in Architecture & Engineering in Michigan?
Percentage of Population Employed in Architecture & Engineering in Michigan is 3.4%.
What is the Percentage of Population Employed in Architecture & Engineering in the United States?
Percentage of Population Employed in Architecture & Engineering in the United States is 2.1%.