Zip Codes with the Highest Percentage of Population Employed in Accommodation & Food Services in Sterling Heights, MI
RELATED REPORTS & OPTIONS
Accommodation & Food Services
Sterling Heights
Compare Zip Codes
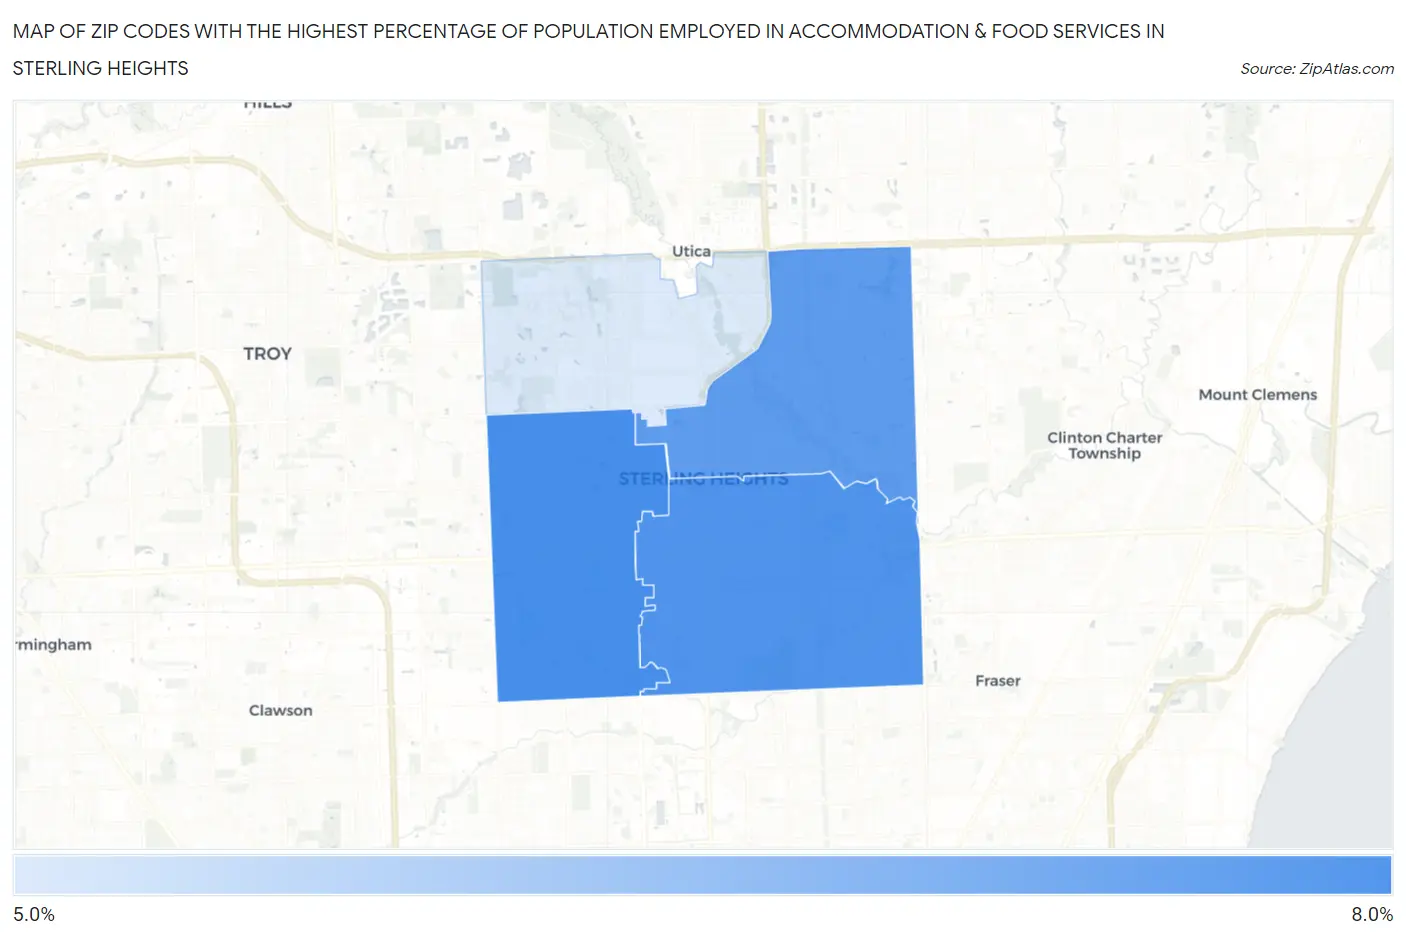
Map of Zip Codes with the Highest Percentage of Population Employed in Accommodation & Food Services in Sterling Heights
5.9%
7.3%
Zip Codes with the Highest Percentage of Population Employed in Accommodation & Food Services in Sterling Heights, MI
| Zip Code | % Employed | vs State | vs National | |
| 1. | 48310 | 7.3% | 7.1%(+0.220)#359 | 6.9%(+0.423)#9,501 |
| 2. | 48312 | 7.2% | 7.1%(+0.140)#370 | 6.9%(+0.343)#9,742 |
| 3. | 48313 | 7.1% | 7.1%(-0.012)#386 | 6.9%(+0.190)#10,124 |
| 4. | 48314 | 5.9% | 7.1%(-1.23)#550 | 6.9%(-1.03)#13,941 |
1
Common Questions
What are the Top 3 Zip Codes with the Highest Percentage of Population Employed in Accommodation & Food Services in Sterling Heights, MI?
Top 3 Zip Codes with the Highest Percentage of Population Employed in Accommodation & Food Services in Sterling Heights, MI are:
What zip code has the Highest Percentage of Population Employed in Accommodation & Food Services in Sterling Heights, MI?
48310 has the Highest Percentage of Population Employed in Accommodation & Food Services in Sterling Heights, MI with 7.3%.
What is the Percentage of Population Employed in Accommodation & Food Services in Sterling Heights, MI?
Percentage of Population Employed in Accommodation & Food Services in Sterling Heights is 7.0%.
What is the Percentage of Population Employed in Accommodation & Food Services in Michigan?
Percentage of Population Employed in Accommodation & Food Services in Michigan is 7.1%.
What is the Percentage of Population Employed in Accommodation & Food Services in the United States?
Percentage of Population Employed in Accommodation & Food Services in the United States is 6.9%.