Zip Codes with the Highest Percentage of Population Employed in Sales & Related in Sterling Heights, MI
RELATED REPORTS & OPTIONS
Sales & Related
Sterling Heights
Compare Zip Codes
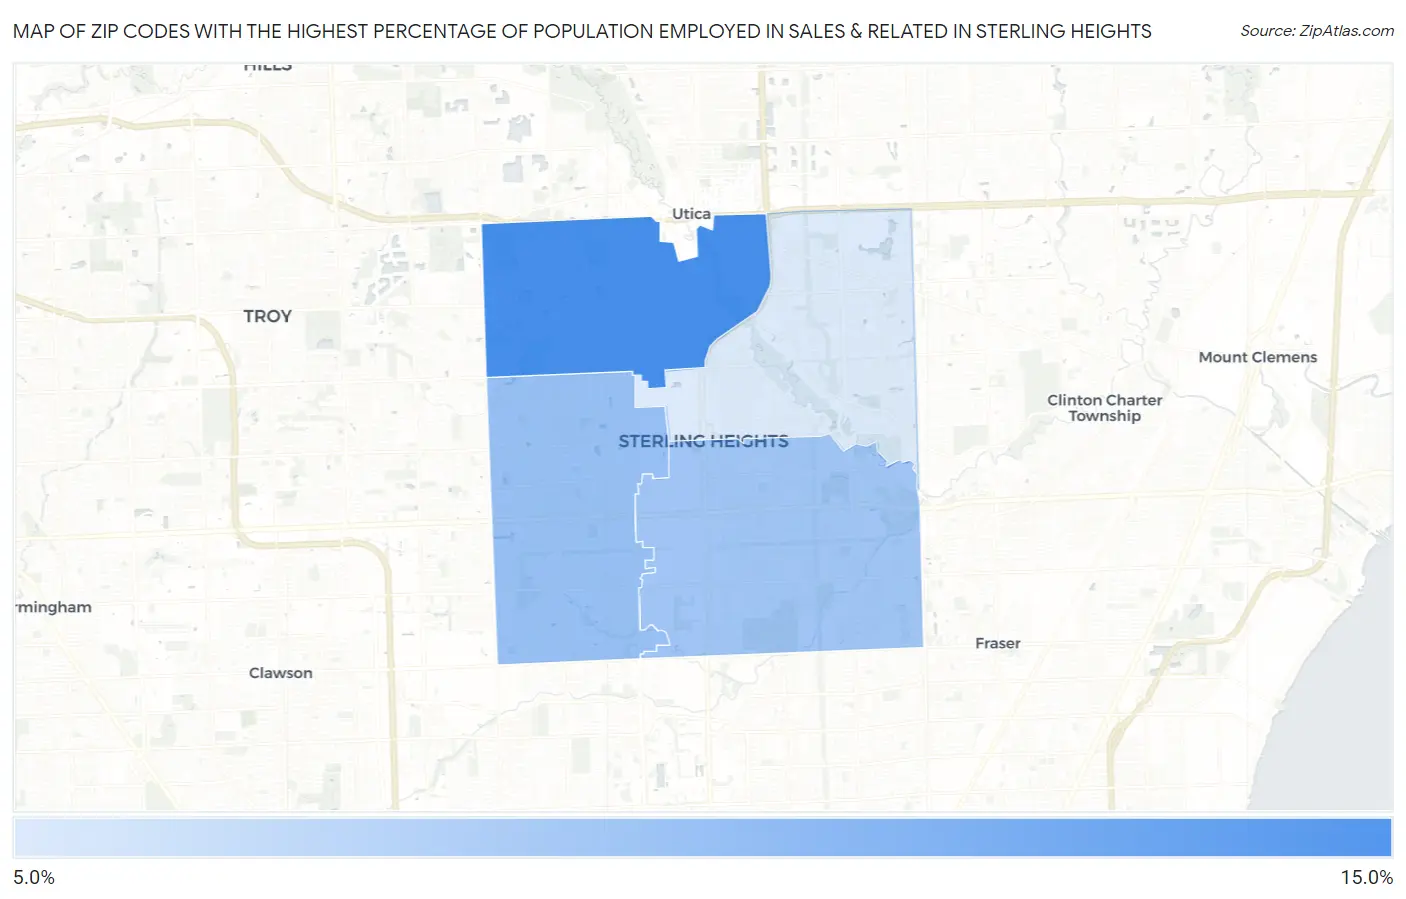
Map of Zip Codes with the Highest Percentage of Population Employed in Sales & Related in Sterling Heights
8.1%
14.5%
Zip Codes with the Highest Percentage of Population Employed in Sales & Related in Sterling Heights, MI
| Zip Code | % Employed | vs State | vs National | |
| 1. | 48314 | 14.5% | 9.1%(+5.36)#64 | 9.6%(+4.90)#3,088 |
| 2. | 48310 | 11.0% | 9.1%(+1.87)#207 | 9.6%(+1.41)#8,178 |
| 3. | 48312 | 10.7% | 9.1%(+1.52)#224 | 9.6%(+1.07)#9,096 |
| 4. | 48313 | 8.1% | 9.1%(-1.04)#544 | 9.6%(-1.50)#17,721 |
1
Common Questions
What are the Top 3 Zip Codes with the Highest Percentage of Population Employed in Sales & Related in Sterling Heights, MI?
Top 3 Zip Codes with the Highest Percentage of Population Employed in Sales & Related in Sterling Heights, MI are:
What zip code has the Highest Percentage of Population Employed in Sales & Related in Sterling Heights, MI?
48314 has the Highest Percentage of Population Employed in Sales & Related in Sterling Heights, MI with 14.5%.
What is the Percentage of Population Employed in Sales & Related in Sterling Heights, MI?
Percentage of Population Employed in Sales & Related in Sterling Heights is 10.7%.
What is the Percentage of Population Employed in Sales & Related in Michigan?
Percentage of Population Employed in Sales & Related in Michigan is 9.1%.
What is the Percentage of Population Employed in Sales & Related in the United States?
Percentage of Population Employed in Sales & Related in the United States is 9.6%.