Zip Codes with the Highest Percentage of Population Employed in Computer, Engineering & Science in Sterling Heights, MI
RELATED REPORTS & OPTIONS
Computer, Engineering & Science
Sterling Heights
Compare Zip Codes
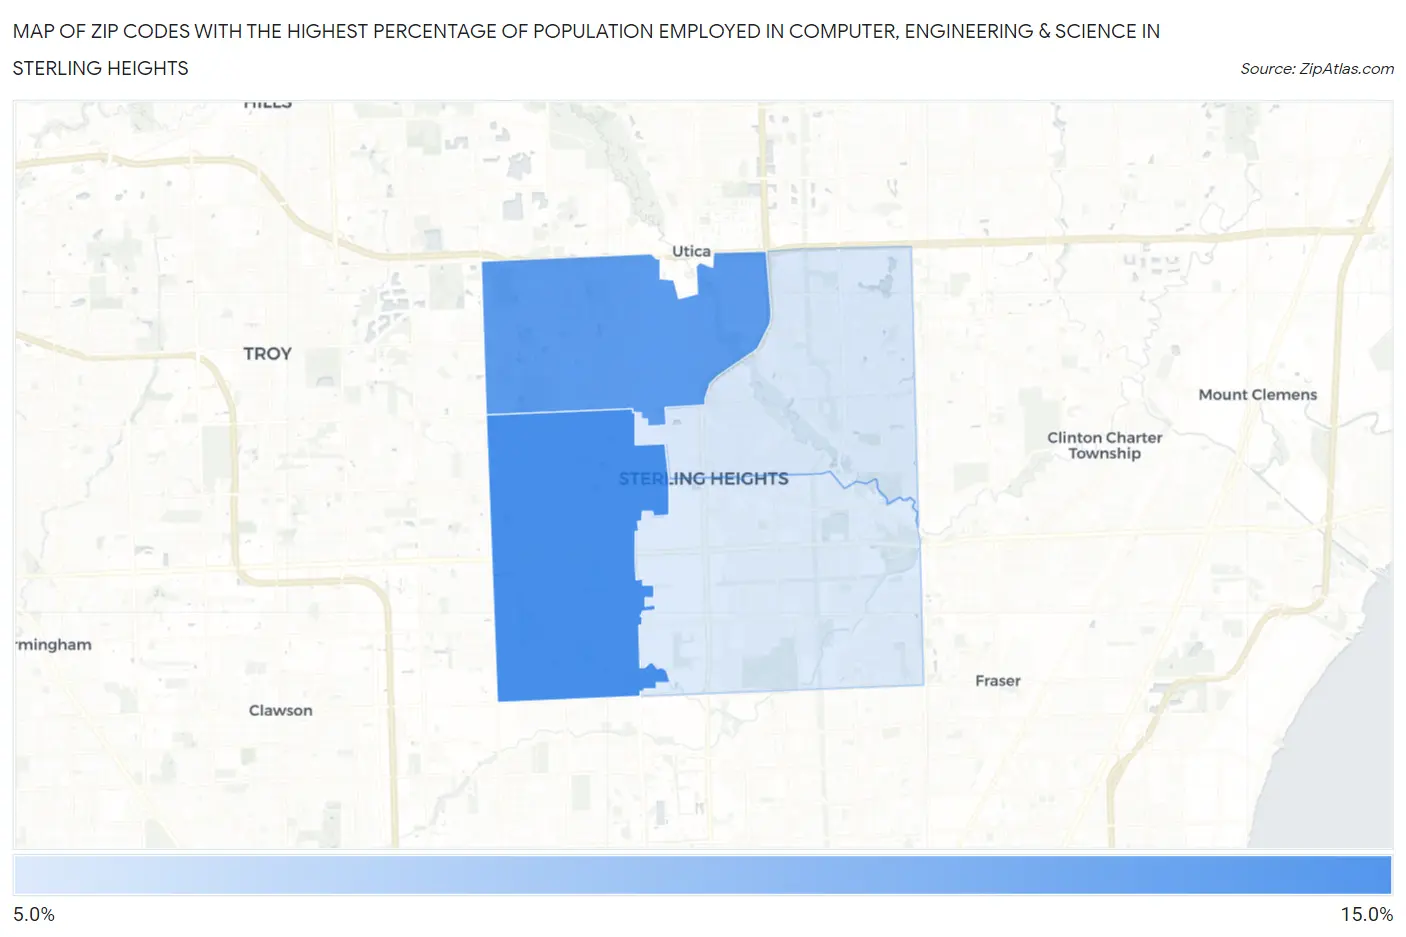
Map of Zip Codes with the Highest Percentage of Population Employed in Computer, Engineering & Science in Sterling Heights
9.3%
11.1%
Zip Codes with the Highest Percentage of Population Employed in Computer, Engineering & Science in Sterling Heights, MI
| Zip Code | % Employed | vs State | vs National | |
| 1. | 48310 | 11.1% | 7.2%(+3.91)#76 | 6.8%(+4.32)#2,521 |
| 2. | 48314 | 10.9% | 7.2%(+3.69)#80 | 6.8%(+4.10)#2,645 |
| 3. | 48313 | 9.4% | 7.2%(+2.17)#115 | 6.8%(+2.59)#3,736 |
| 4. | 48312 | 9.3% | 7.2%(+2.13)#117 | 6.8%(+2.54)#3,774 |
1
Common Questions
What are the Top 3 Zip Codes with the Highest Percentage of Population Employed in Computer, Engineering & Science in Sterling Heights, MI?
Top 3 Zip Codes with the Highest Percentage of Population Employed in Computer, Engineering & Science in Sterling Heights, MI are:
What zip code has the Highest Percentage of Population Employed in Computer, Engineering & Science in Sterling Heights, MI?
48310 has the Highest Percentage of Population Employed in Computer, Engineering & Science in Sterling Heights, MI with 11.1%.
What is the Percentage of Population Employed in Computer, Engineering & Science in Sterling Heights, MI?
Percentage of Population Employed in Computer, Engineering & Science in Sterling Heights is 10.1%.
What is the Percentage of Population Employed in Computer, Engineering & Science in Michigan?
Percentage of Population Employed in Computer, Engineering & Science in Michigan is 7.2%.
What is the Percentage of Population Employed in Computer, Engineering & Science in the United States?
Percentage of Population Employed in Computer, Engineering & Science in the United States is 6.8%.