Zip Codes with the Highest Percentage of Households with Income Below $10,000 in Dearborn, MI
RELATED REPORTS & OPTIONS
Household Income | $0-10k
Dearborn
Compare Zip Codes
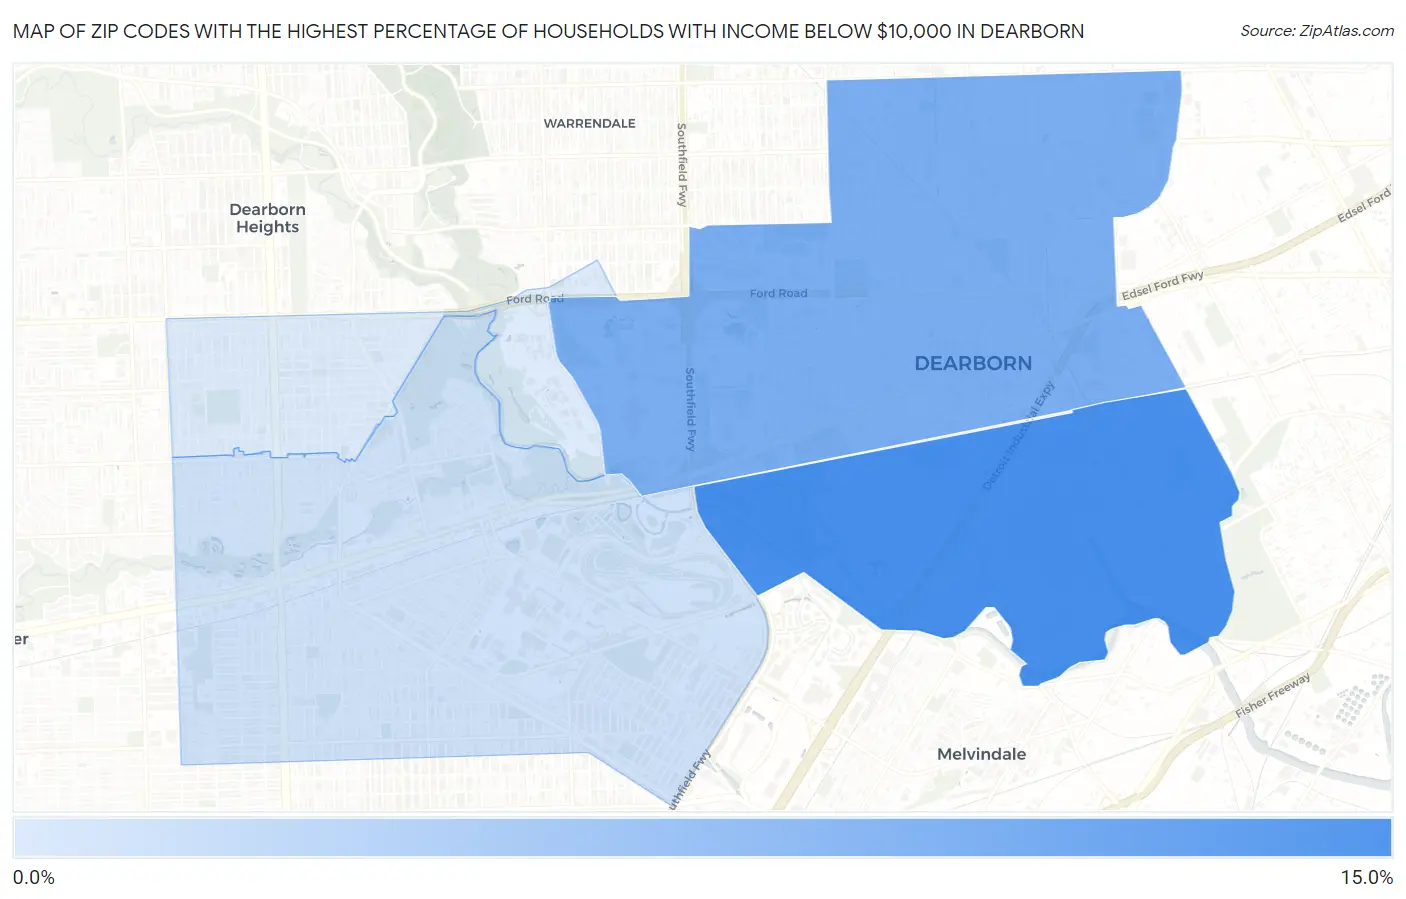
Map of Zip Codes with the Highest Percentage of Households with Income Below $10,000 in Dearborn
4.4%
12.1%
Zip Codes with the Highest Percentage of Households with Income Below $10,000 in Dearborn, MI
| Zip Code | Households with Income < $10k | vs State | vs National | |
| 1. | 48120 | 12.1% | 5.0%(+7.10)#45 | 4.9%(+7.20)#2,413 |
| 2. | 48126 | 9.4% | 5.0%(+4.40)#77 | 4.9%(+4.50)#4,026 |
| 3. | 48124 | 5.1% | 5.0%(+0.100)#277 | 4.9%(+0.200)#11,355 |
| 4. | 48128 | 4.4% | 5.0%(-0.600)#387 | 4.9%(-0.500)#13,781 |
1
Common Questions
What are the Top 3 Zip Codes with the Highest Percentage of Households with Income Below $10,000 in Dearborn, MI?
Top 3 Zip Codes with the Highest Percentage of Households with Income Below $10,000 in Dearborn, MI are:
What zip code has the Highest Percentage of Households with Income Below $10,000 in Dearborn, MI?
48120 has the Highest Percentage of Households with Income Below $10,000 in Dearborn, MI with 12.1%.
What is the Percentage of Households with Income Below $10,000 in Dearborn, MI?
Percentage of Households with Income Below $10,000 in Dearborn is 7.4%.
What is the Percentage of Households with Income Below $10,000 in Michigan?
Percentage of Households with Income Below $10,000 in Michigan is 5.0%.
What is the Percentage of Households with Income Below $10,000 in the United States?
Percentage of Households with Income Below $10,000 in the United States is 4.9%.