Zip Codes with the Highest Percentage of Population Employed in Food Preparation & Serving in Dearborn, MI
RELATED REPORTS & OPTIONS
Food Preparation & Serving
Dearborn
Compare Zip Codes
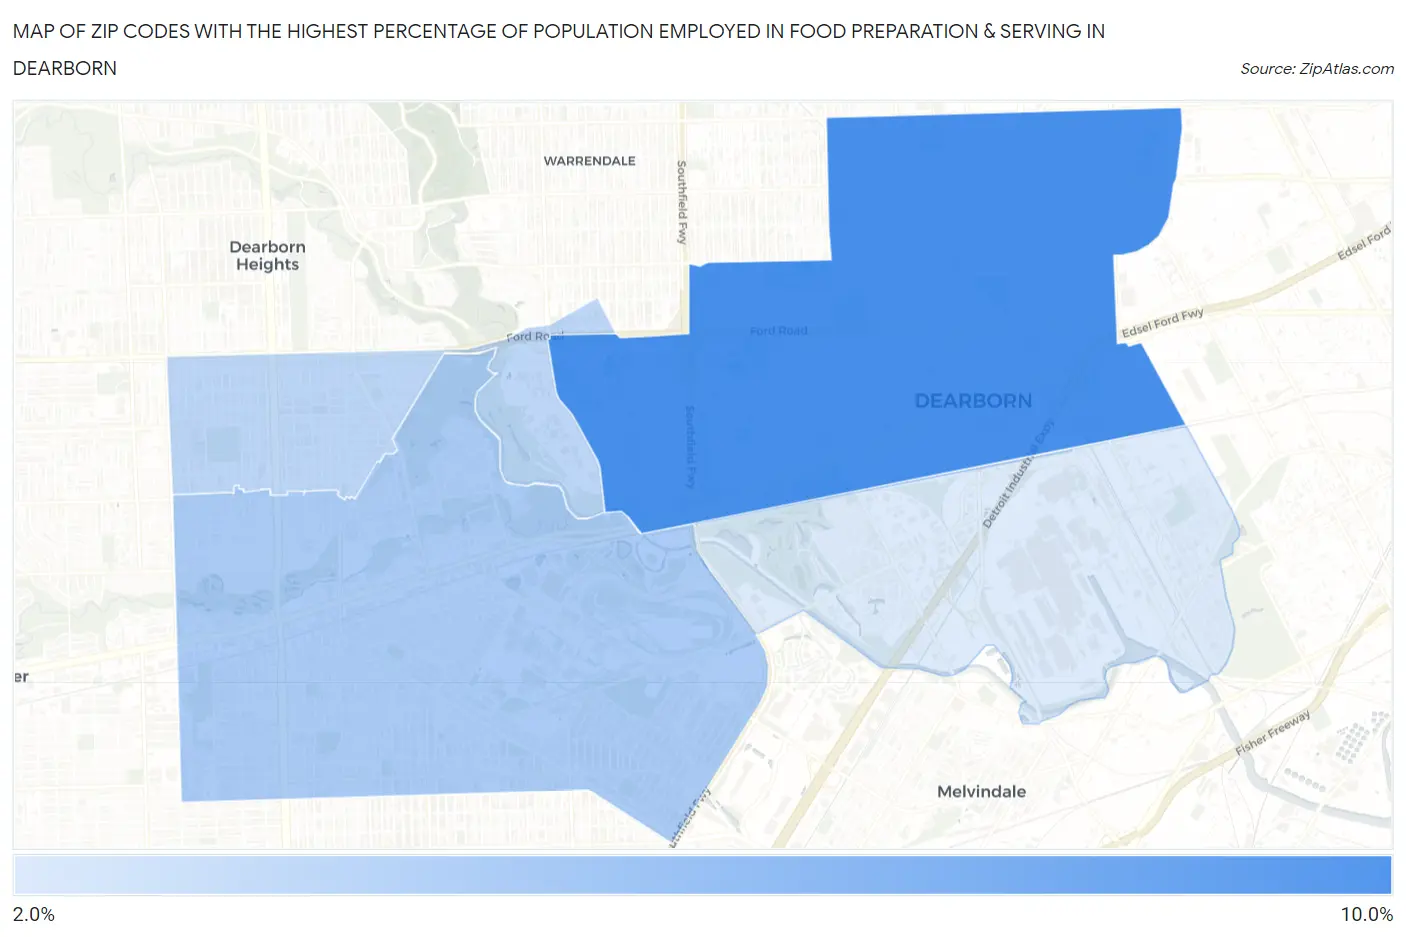
Map of Zip Codes with the Highest Percentage of Population Employed in Food Preparation & Serving in Dearborn
2.4%
10.0%
Zip Codes with the Highest Percentage of Population Employed in Food Preparation & Serving in Dearborn, MI
| Zip Code | % Employed | vs State | vs National | |
| 1. | 48126 | 10.0% | 5.7%(+4.31)#69 | 5.3%(+4.69)#2,650 |
| 2. | 48124 | 4.9% | 5.7%(-0.746)#507 | 5.3%(-0.360)#13,241 |
| 3. | 48128 | 4.0% | 5.7%(-1.67)#658 | 5.3%(-1.28)#17,115 |
| 4. | 48120 | 2.4% | 5.7%(-3.25)#843 | 5.3%(-2.87)#23,406 |
1
Common Questions
What are the Top 3 Zip Codes with the Highest Percentage of Population Employed in Food Preparation & Serving in Dearborn, MI?
Top 3 Zip Codes with the Highest Percentage of Population Employed in Food Preparation & Serving in Dearborn, MI are:
What zip code has the Highest Percentage of Population Employed in Food Preparation & Serving in Dearborn, MI?
48126 has the Highest Percentage of Population Employed in Food Preparation & Serving in Dearborn, MI with 10.0%.
What is the Percentage of Population Employed in Food Preparation & Serving in Dearborn, MI?
Percentage of Population Employed in Food Preparation & Serving in Dearborn is 6.7%.
What is the Percentage of Population Employed in Food Preparation & Serving in Michigan?
Percentage of Population Employed in Food Preparation & Serving in Michigan is 5.7%.
What is the Percentage of Population Employed in Food Preparation & Serving in the United States?
Percentage of Population Employed in Food Preparation & Serving in the United States is 5.3%.