Zip Codes with the Highest Percentage of Population Employed in Office & Administration in Dearborn, MI
RELATED REPORTS & OPTIONS
Office & Administration
Dearborn
Compare Zip Codes
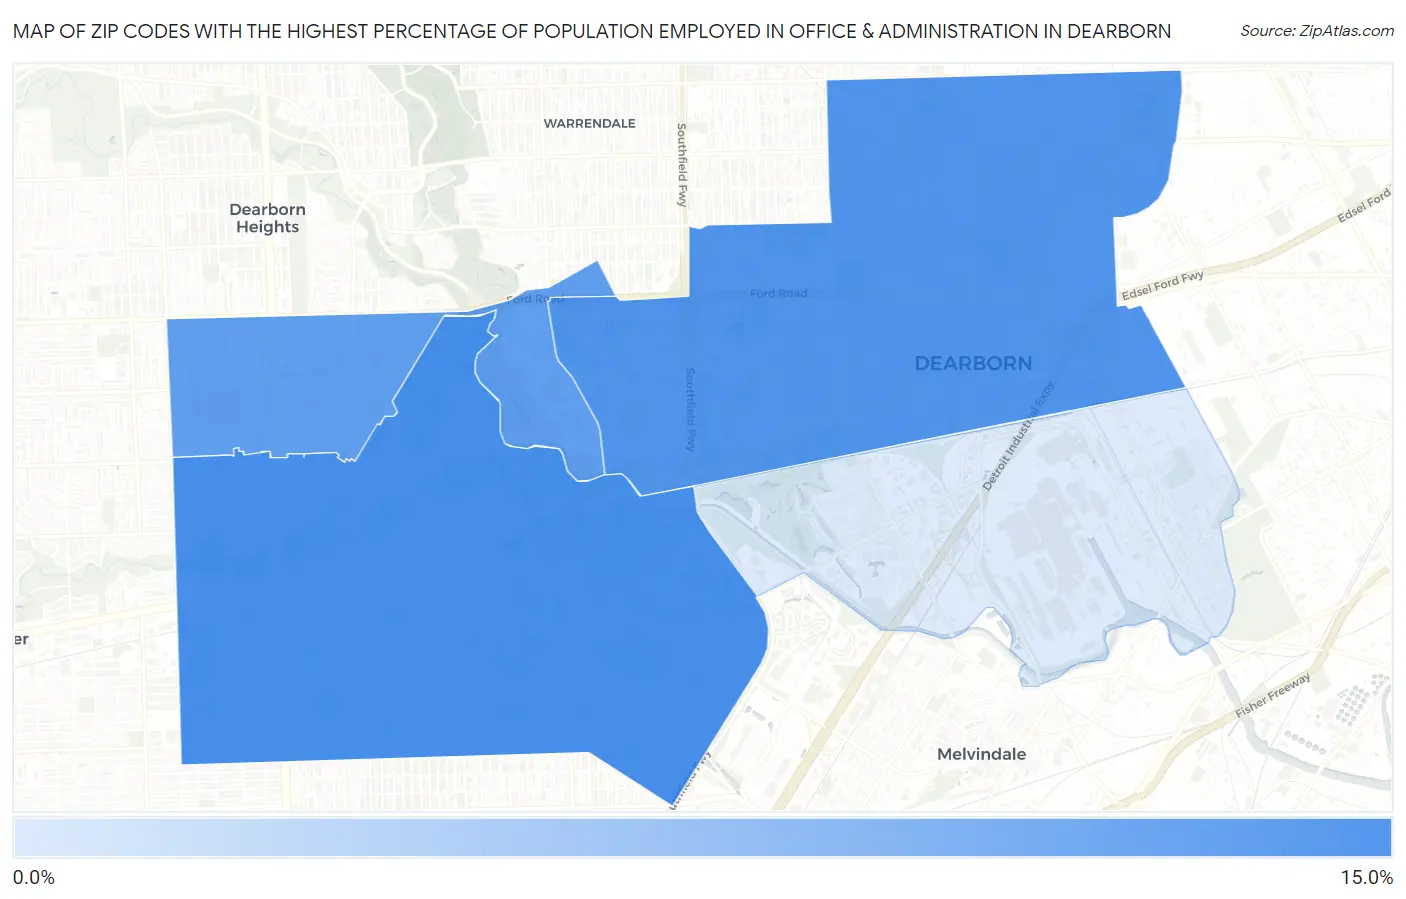
Map of Zip Codes with the Highest Percentage of Population Employed in Office & Administration in Dearborn
4.0%
11.0%
Zip Codes with the Highest Percentage of Population Employed in Office & Administration in Dearborn, MI
| Zip Code | % Employed | vs State | vs National | |
| 1. | 48124 | 11.0% | 10.8%(+0.143)#422 | 10.9%(+0.094)#13,995 |
| 2. | 48126 | 10.5% | 10.8%(-0.295)#473 | 10.9%(-0.344)#15,433 |
| 3. | 48128 | 9.7% | 10.8%(-1.07)#572 | 10.9%(-1.12)#17,950 |
| 4. | 48120 | 4.0% | 10.8%(-6.86)#929 | 10.9%(-6.90)#29,040 |
1
Common Questions
What are the Top 3 Zip Codes with the Highest Percentage of Population Employed in Office & Administration in Dearborn, MI?
Top 3 Zip Codes with the Highest Percentage of Population Employed in Office & Administration in Dearborn, MI are:
What zip code has the Highest Percentage of Population Employed in Office & Administration in Dearborn, MI?
48124 has the Highest Percentage of Population Employed in Office & Administration in Dearborn, MI with 11.0%.
What is the Percentage of Population Employed in Office & Administration in Dearborn, MI?
Percentage of Population Employed in Office & Administration in Dearborn is 10.1%.
What is the Percentage of Population Employed in Office & Administration in Michigan?
Percentage of Population Employed in Office & Administration in Michigan is 10.8%.
What is the Percentage of Population Employed in Office & Administration in the United States?
Percentage of Population Employed in Office & Administration in the United States is 10.9%.