Zip Codes with the Highest Percentage of Households with Income Below $10,000 in Grand Rapids, MI

RELATED REPORTS & OPTIONS

Household Income | $0-10k
Population
Families and Households
Female Fertility
Female Fertility (Unmarried)
Race (Community Size)
Race (Percentage)
Ancestry (Community Size)
AfricanAlbanianAmericanApacheArabArgentineanArmenianAustralianAustrianBangladeshiBelgianBhutaneseBlackfeetBrazilianBritishBulgarianBurmeseCanadianCelticCentral AmericanCentral American IndianCherokeeChileanChippewaChoctawColombianCreekCroatianCubanCzechCzechoslovakianDanishDominicanDutchEastern EuropeanEcuadorianEgyptianEnglishEthiopianEuropeanFinnishFrenchFrench American IndianFrench CanadianGermanGerman RussianGhanaianGreekGuamanian / ChamorroGuatemalanGuyaneseHaitianHonduranHungarianIndian (Asian)IndonesianIranianIraqiIrishIroquoisIsraeliItalianJamaicanJapaneseJordanianKenyanKoreanLaotianLatvianLebaneseLiberianLithuanianLuxembourgerMacedonianMalaysianMalteseMexicanMexican American IndianMoroccanNative HawaiianNavajoNicaraguanNigerianNorthern EuropeanNorwegianOttawaPakistaniPalestinianPanamanianPennsylvania GermanPeruvianPolishPortuguesePotawatomiPuebloPuerto RicanRomanianRussianSalvadoranSamoanScandinavianScotch-IrishScottishSerbianSiouxSlavicSlovakSloveneSomaliSouth AfricanSouth AmericanSouth American IndianSpaniardSpanishSri LankanSubsaharan AfricanSudaneseSwedishSwissSyrianThaiTlingit-HaidaTrinidadian and TobagonianTurkishUkrainianUruguayanVenezuelanVietnameseWelshWest IndianYugoslavian
Ancestry (Percentage)
AfricanAlbanianAmericanApacheArabArgentineanArmenianAustralianAustrianBangladeshiBelgianBhutaneseBlackfeetBrazilianBritishBulgarianBurmeseCanadianCelticCentral AmericanCentral American IndianCherokeeChileanChippewaChoctawColombianCreekCroatianCubanCzechCzechoslovakianDanishDominicanDutchEastern EuropeanEcuadorianEgyptianEnglishEthiopianEuropeanFinnishFrenchFrench American IndianFrench CanadianGermanGerman RussianGhanaianGreekGuamanian / ChamorroGuatemalanGuyaneseHaitianHonduranHungarianIndian (Asian)IndonesianIranianIraqiIrishIroquoisIsraeliItalianJamaicanJapaneseJordanianKenyanKoreanLaotianLatvianLebaneseLiberianLithuanianLuxembourgerMacedonianMalaysianMalteseMexicanMexican American IndianMoroccanNative HawaiianNavajoNicaraguanNigerianNorthern EuropeanNorwegianOttawaPakistaniPalestinianPanamanianPennsylvania GermanPeruvianPolishPortuguesePotawatomiPuebloPuerto RicanRomanianRussianSalvadoranSamoanScandinavianScotch-IrishScottishSerbianSiouxSlavicSlovakSloveneSomaliSouth AfricanSouth AmericanSouth American IndianSpaniardSpanishSri LankanSubsaharan AfricanSudaneseSwedishSwissSyrianThaiTlingit-HaidaTrinidadian and TobagonianTurkishUkrainianUruguayanVenezuelanVietnameseWelshWest IndianYugoslavian
Immigrant Origin (Total)
AfricaAlbaniaAsiaAustraliaAustriaBangladeshBelarusBosnia and HerzegovinaBrazilBulgariaBurma / MyanmarCambodiaCameroonCanadaCaribbeanCentral AmericaChileChinaColombiaCongoCroatiaCubaDenmarkDominican RepublicEastern AfricaEastern AsiaEastern EuropeEcuadorEgyptEl SalvadorEnglandEritreaEthiopiaEuropeFranceGermanyGhanaGreeceGuatemalaHaitiHondurasHong KongIndiaIndonesiaIraqIrelandIsraelItalyJamaicaJapanJordanKazakhstanKenyaKoreaKuwaitLatin AmericaLatviaLebanonLiberiaMexicoMiddle AfricaMoroccoNepalNetherlandsNigeriaNorthern AfricaNorthern EuropeOceaniaPakistanPanamaPeruPhilippinesPolandRomaniaRussiaScotlandSomaliaSouth AfricaSouth AmericaSouth Central AsiaSouth Eastern AsiaSouthern EuropeSpainSudanSwitzerlandSyriaThailandUgandaUkraineVenezuelaVietnamWestern AfricaWestern AsiaWestern EuropeZaireZimbabwe
Immigrant Origin (Percentage)
AfricaAlbaniaAsiaAustraliaAustriaBangladeshBelarusBosnia and HerzegovinaBrazilBulgariaBurma / MyanmarCambodiaCameroonCanadaCaribbeanCentral AmericaChileChinaColombiaCongoCroatiaCubaDenmarkDominican RepublicEastern AfricaEastern AsiaEastern EuropeEcuadorEgyptEl SalvadorEnglandEritreaEthiopiaEuropeFranceGermanyGhanaGreeceGuatemalaHaitiHondurasHong KongIndiaIndonesiaIraqIrelandIsraelItalyJamaicaJapanJordanKazakhstanKenyaKoreaKuwaitLatin AmericaLatviaLebanonLiberiaMexicoMiddle AfricaMoroccoNepalNetherlandsNigeriaNorthern AfricaNorthern EuropeOceaniaPakistanPanamaPeruPhilippinesPolandRomaniaRussiaScotlandSomaliaSouth AfricaSouth AmericaSouth Central AsiaSouth Eastern AsiaSouthern EuropeSpainSudanSwitzerlandSyriaThailandUgandaUkraineVenezuelaVietnamWestern AfricaWestern AsiaWestern EuropeZaireZimbabwe
Income
Income (Families)
Income (Households)
Poverty
Poverty (Families)
Unemployment
Employment Occupations
Employment Industries
Employer Class
Commute Time
Commute Means
School Enrollment
Education by Degree Field
Occupancy
Finances
Physical Characteristics
Grand Rapids
Compare Zip Codes
Comparison Subject

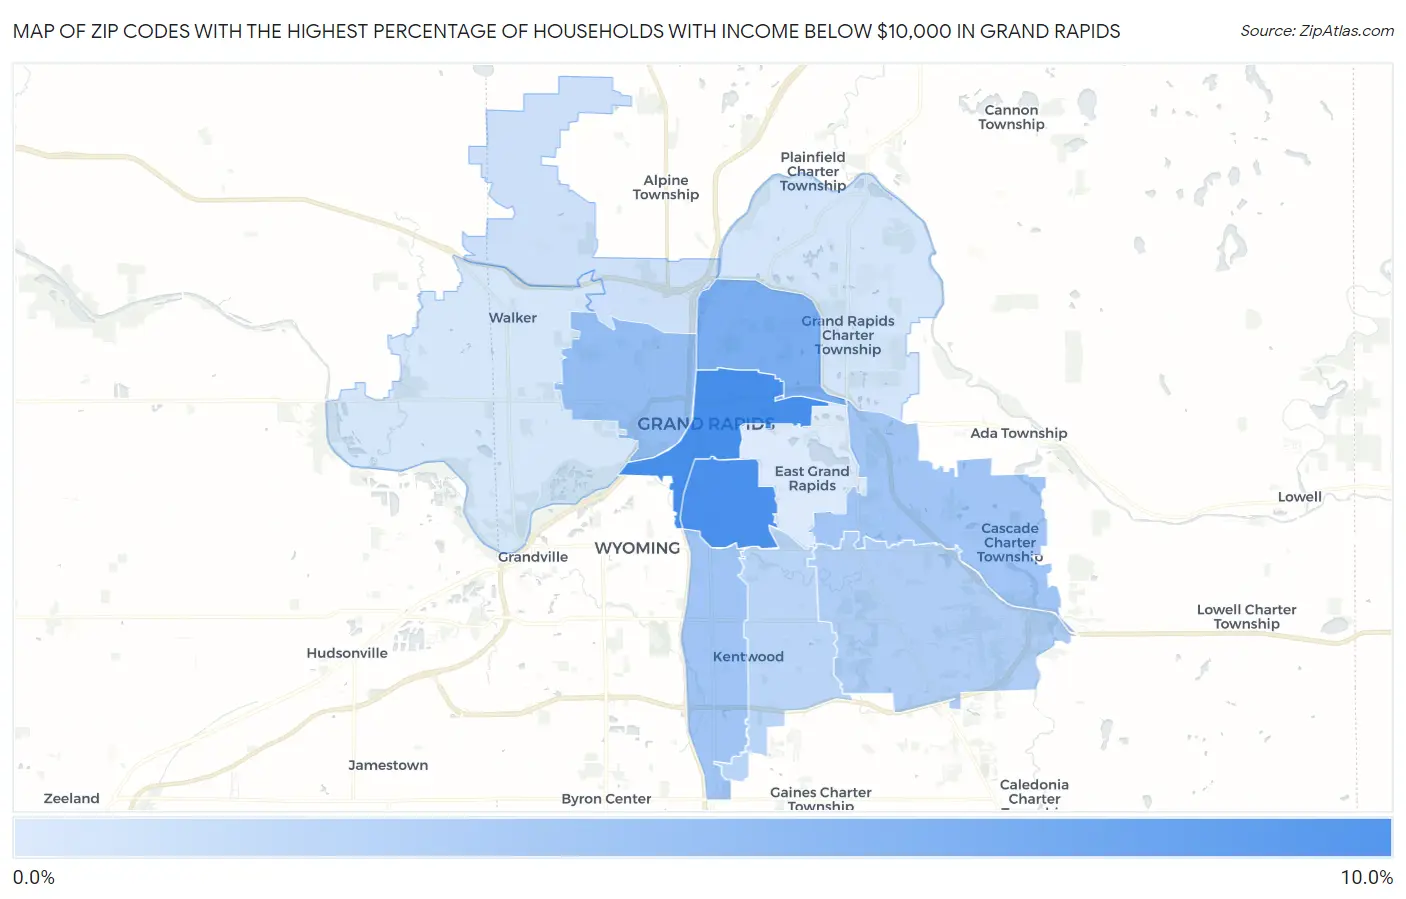
Map of Zip Codes with the Highest Percentage of Households with Income Below $10,000 in Grand Rapids

0.0%
10.0%
Zip Codes with the Highest Percentage of Households with Income Below $10,000 in Grand Rapids Map

Zip Codes with the Highest Percentage of Households with Income Below $10,000 in Grand Rapids, MI

Zip Code Households with Income < $10k vs State vs National
1.495038.2%5.0%(+3.20)#1074.9%(+3.30)#5,289
2.495078.1%5.0%(+3.10)#1104.9%(+3.20)#5,411
3.495056.0%5.0%(+1.000)#2024.9%(+1.10)#8,984
4.495044.8%5.0%(-0.200)#3204.9%(-0.100)#12,293
5.495484.3%5.0%(-0.700)#3984.9%(-0.600)#14,070
6.495464.3%5.0%(-0.700)#3994.9%(-0.600)#14,071
7.495123.7%5.0%(-1.30)#4924.9%(-1.20)#16,473
8.495083.2%5.0%(-1.80)#5644.9%(-1.70)#18,469
9.495442.4%5.0%(-2.60)#7234.9%(-2.50)#22,131
10.495252.1%5.0%(-2.90)#7654.9%(-2.80)#23,241
11.495342.0%5.0%(-3.00)#7754.9%(-2.90)#23,638
12.495061.7%5.0%(-3.30)#8084.9%(-3.20)#24,703

Common Questions

What are the Top 10 Zip Codes with the Highest Percentage of Households with Income Below $10,000 in Grand Rapids, MI?
Top 10 Zip Codes with the Highest Percentage of Households with Income Below $10,000 in Grand Rapids, MI are:
#1
8.2%
#2
8.1%
#3
6.0%
#4
4.8%
#5
4.3%
#6
4.3%
#7
3.7%
#8
3.2%
#9
2.4%
#10
2.1%
What zip code has the Highest Percentage of Households with Income Below $10,000 in Grand Rapids, MI?
49503 has the Highest Percentage of Households with Income Below $10,000 in Grand Rapids, MI with 8.2%.
What is the Percentage of Households with Income Below $10,000 in Grand Rapids, MI?
Percentage of Households with Income Below $10,000 in Grand Rapids is 5.8%.
What is the Percentage of Households with Income Below $10,000 in Michigan?
Percentage of Households with Income Below $10,000 in Michigan is 5.0%.
What is the Percentage of Households with Income Below $10,000 in the United States?
Percentage of Households with Income Below $10,000 in the United States is 4.9%.