Zip Codes with the Highest Percentage of Population Employed in Accommodation & Food Services in Dearborn, MI
RELATED REPORTS & OPTIONS
Accommodation & Food Services
Dearborn
Compare Zip Codes
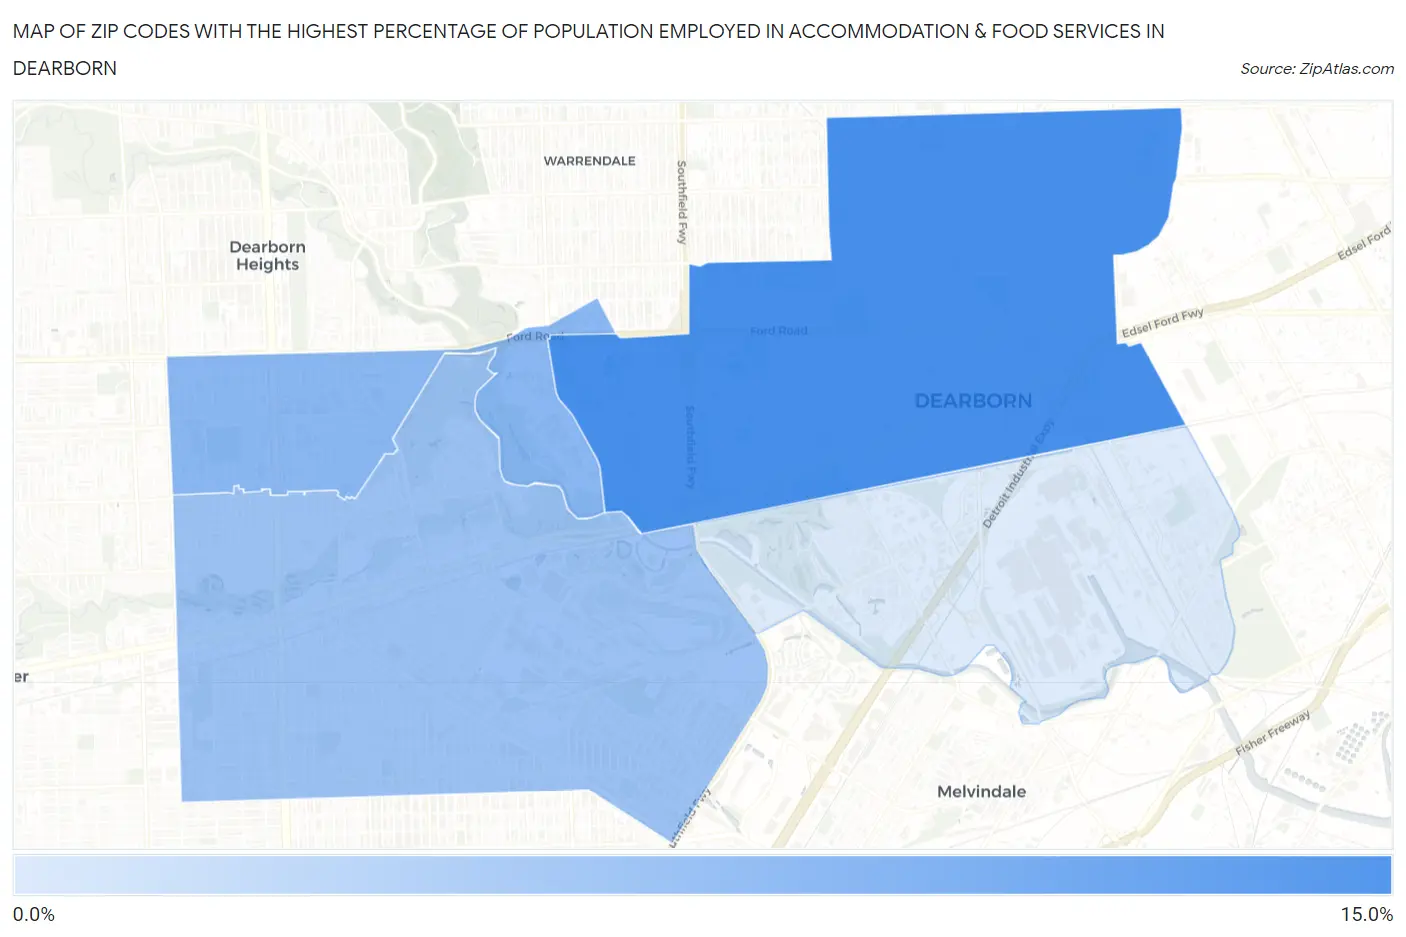
Map of Zip Codes with the Highest Percentage of Population Employed in Accommodation & Food Services in Dearborn
2.5%
12.1%
Zip Codes with the Highest Percentage of Population Employed in Accommodation & Food Services in Dearborn, MI
| Zip Code | % Employed | vs State | vs National | |
| 1. | 48126 | 12.1% | 7.1%(+4.97)#76 | 6.9%(+5.17)#2,802 |
| 2. | 48128 | 7.6% | 7.1%(+0.510)#318 | 6.9%(+0.713)#8,762 |
| 3. | 48124 | 6.6% | 7.1%(-0.498)#444 | 6.9%(-0.295)#11,566 |
| 4. | 48120 | 2.5% | 7.1%(-4.63)#881 | 6.9%(-4.43)#24,602 |
1
Common Questions
What are the Top 3 Zip Codes with the Highest Percentage of Population Employed in Accommodation & Food Services in Dearborn, MI?
Top 3 Zip Codes with the Highest Percentage of Population Employed in Accommodation & Food Services in Dearborn, MI are:
What zip code has the Highest Percentage of Population Employed in Accommodation & Food Services in Dearborn, MI?
48126 has the Highest Percentage of Population Employed in Accommodation & Food Services in Dearborn, MI with 12.1%.
What is the Percentage of Population Employed in Accommodation & Food Services in Dearborn, MI?
Percentage of Population Employed in Accommodation & Food Services in Dearborn is 8.7%.
What is the Percentage of Population Employed in Accommodation & Food Services in Michigan?
Percentage of Population Employed in Accommodation & Food Services in Michigan is 7.1%.
What is the Percentage of Population Employed in Accommodation & Food Services in the United States?
Percentage of Population Employed in Accommodation & Food Services in the United States is 6.9%.