Zip Codes with the Highest Percentage of Families with Income Below $10,000 in Dearborn, MI
RELATED REPORTS & OPTIONS
Family Income | $0-10k
Dearborn
Compare Zip Codes
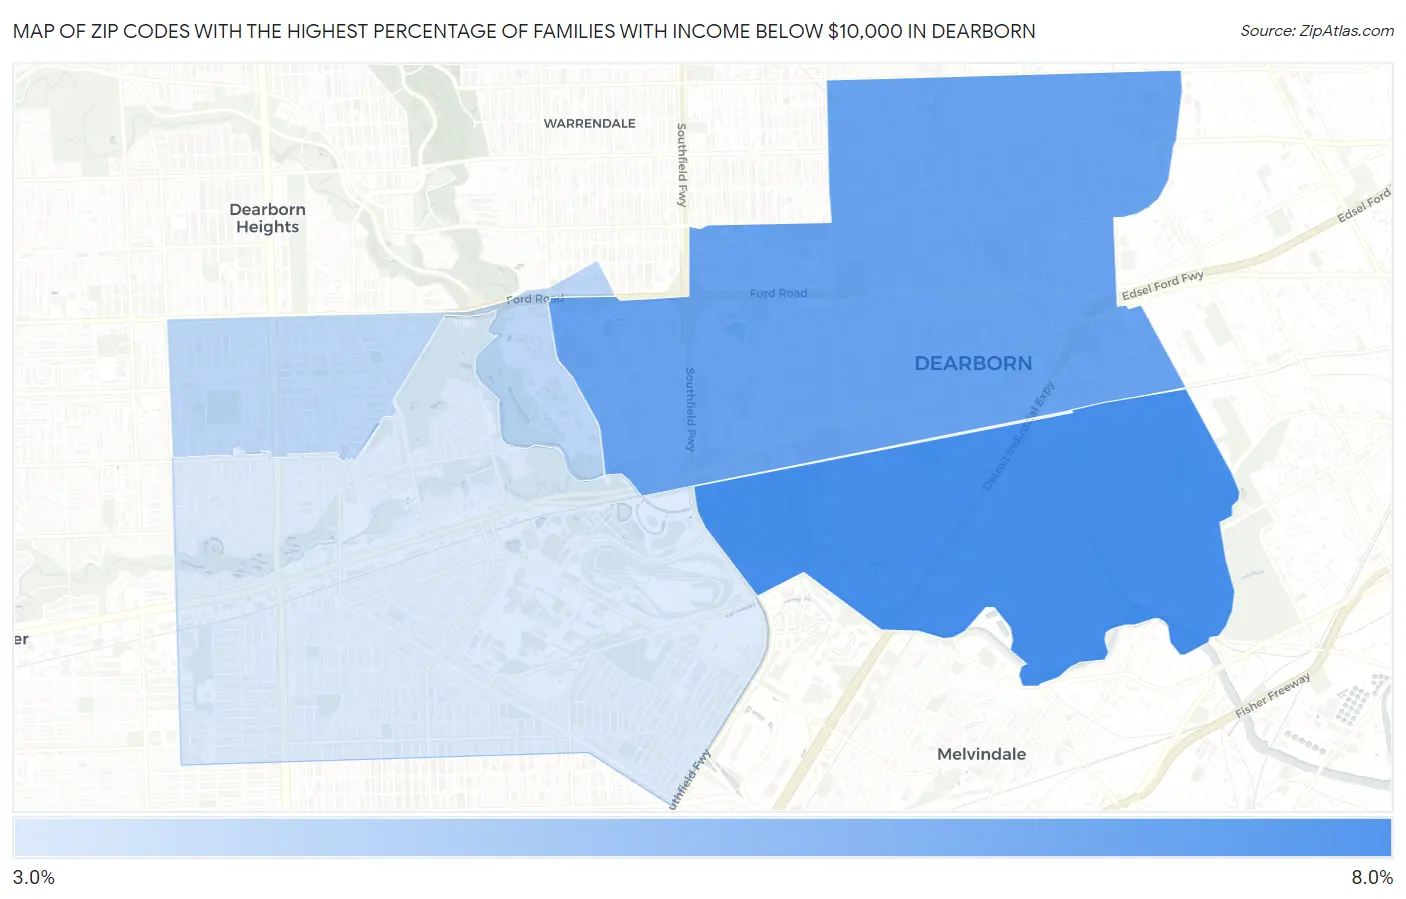
Map of Zip Codes with the Highest Percentage of Families with Income Below $10,000 in Dearborn
3.0%
7.9%
Zip Codes with the Highest Percentage of Families with Income Below $10,000 in Dearborn, MI
| Zip Code | Families with Income < $10k | vs State | vs National | |
| 1. | 48120 | 7.9% | 3.0%(+4.90)#55 | 3.1%(+4.80)#3,037 |
| 2. | 48126 | 6.8% | 3.0%(+3.80)#82 | 3.1%(+3.70)#3,793 |
| 3. | 48128 | 4.0% | 3.0%(+1.00)#218 | 3.1%(+0.900)#8,212 |
| 4. | 48124 | 3.0% | 3.0%(=0.000)#320 | 3.1%(-0.100)#11,119 |
1
Common Questions
What are the Top 3 Zip Codes with the Highest Percentage of Families with Income Below $10,000 in Dearborn, MI?
Top 3 Zip Codes with the Highest Percentage of Families with Income Below $10,000 in Dearborn, MI are:
What zip code has the Highest Percentage of Families with Income Below $10,000 in Dearborn, MI?
48120 has the Highest Percentage of Families with Income Below $10,000 in Dearborn, MI with 7.9%.
What is the Percentage of Families with Income Below $10,000 in Dearborn, MI?
Percentage of Families with Income Below $10,000 in Dearborn is 5.2%.
What is the Percentage of Families with Income Below $10,000 in Michigan?
Percentage of Families with Income Below $10,000 in Michigan is 3.0%.
What is the Percentage of Families with Income Below $10,000 in the United States?
Percentage of Families with Income Below $10,000 in the United States is 3.1%.