Zip Codes with the Highest Percentage of Households with Income Below $10,000 in Battle Creek, MI
RELATED REPORTS & OPTIONS
Household Income | $0-10k
Battle Creek
Compare Zip Codes
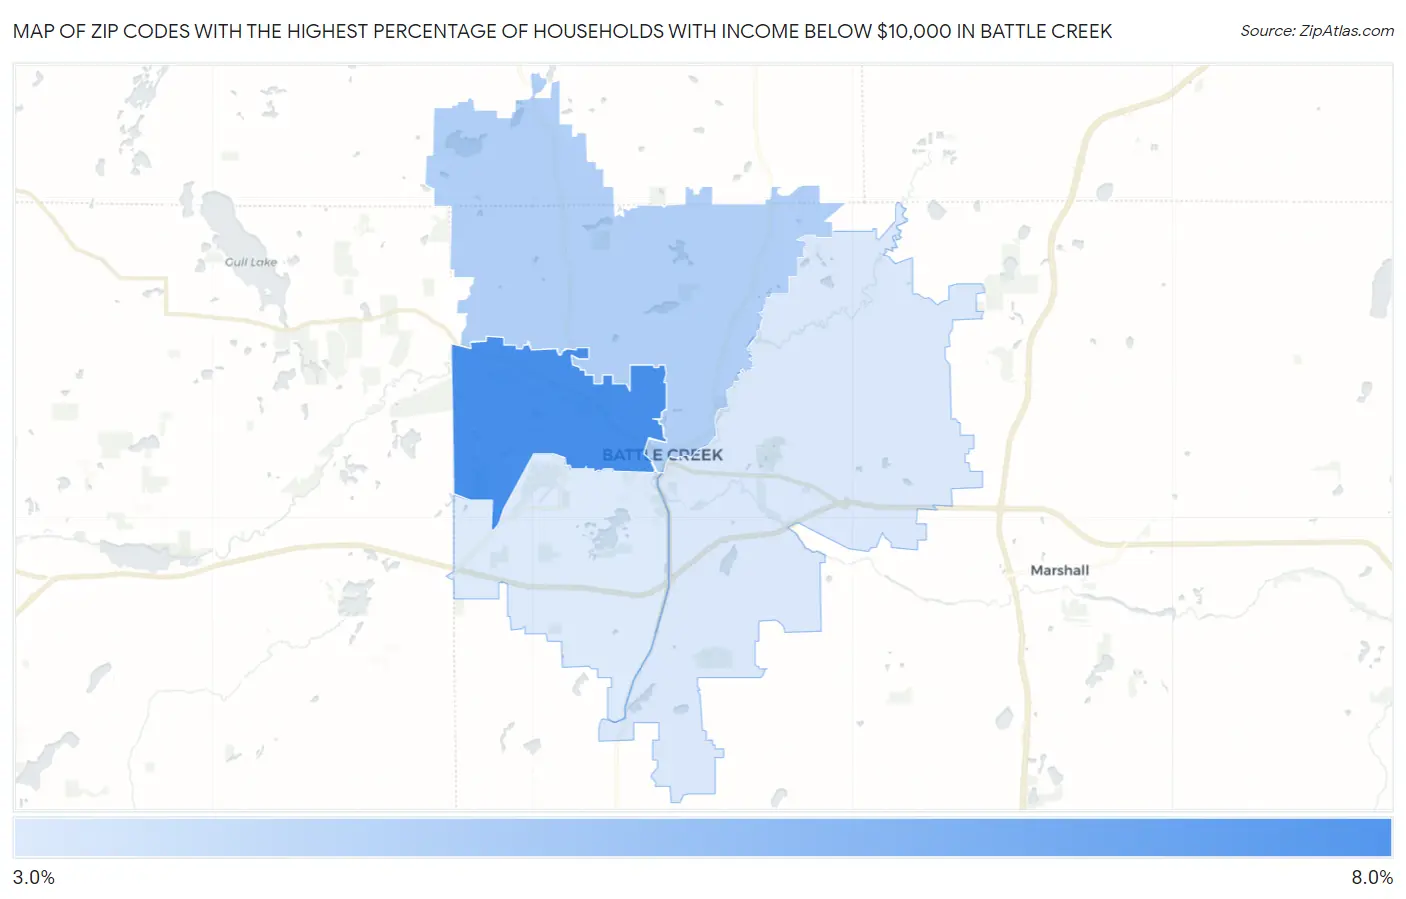
Map of Zip Codes with the Highest Percentage of Households with Income Below $10,000 in Battle Creek
3.4%
7.9%
Zip Codes with the Highest Percentage of Households with Income Below $10,000 in Battle Creek, MI
| Zip Code | Households with Income < $10k | vs State | vs National | |
| 1. | 49037 | 7.9% | 5.0%(+2.90)#115 | 4.9%(+3.00)#5,690 |
| 2. | 49017 | 4.7% | 5.0%(-0.300)#340 | 4.9%(-0.200)#12,696 |
| 3. | 49014 | 3.5% | 5.0%(-1.50)#521 | 4.9%(-1.40)#17,293 |
| 4. | 49015 | 3.4% | 5.0%(-1.60)#534 | 4.9%(-1.50)#17,668 |
1
Common Questions
What are the Top 3 Zip Codes with the Highest Percentage of Households with Income Below $10,000 in Battle Creek, MI?
Top 3 Zip Codes with the Highest Percentage of Households with Income Below $10,000 in Battle Creek, MI are:
What zip code has the Highest Percentage of Households with Income Below $10,000 in Battle Creek, MI?
49037 has the Highest Percentage of Households with Income Below $10,000 in Battle Creek, MI with 7.9%.
What is the Percentage of Households with Income Below $10,000 in Battle Creek, MI?
Percentage of Households with Income Below $10,000 in Battle Creek is 6.0%.
What is the Percentage of Households with Income Below $10,000 in Michigan?
Percentage of Households with Income Below $10,000 in Michigan is 5.0%.
What is the Percentage of Households with Income Below $10,000 in the United States?
Percentage of Households with Income Below $10,000 in the United States is 4.9%.