Zip Codes with the Highest Percentage of Population Employed in Architecture & Engineering in Dearborn, MI
RELATED REPORTS & OPTIONS
Architecture & Engineering
Dearborn
Compare Zip Codes
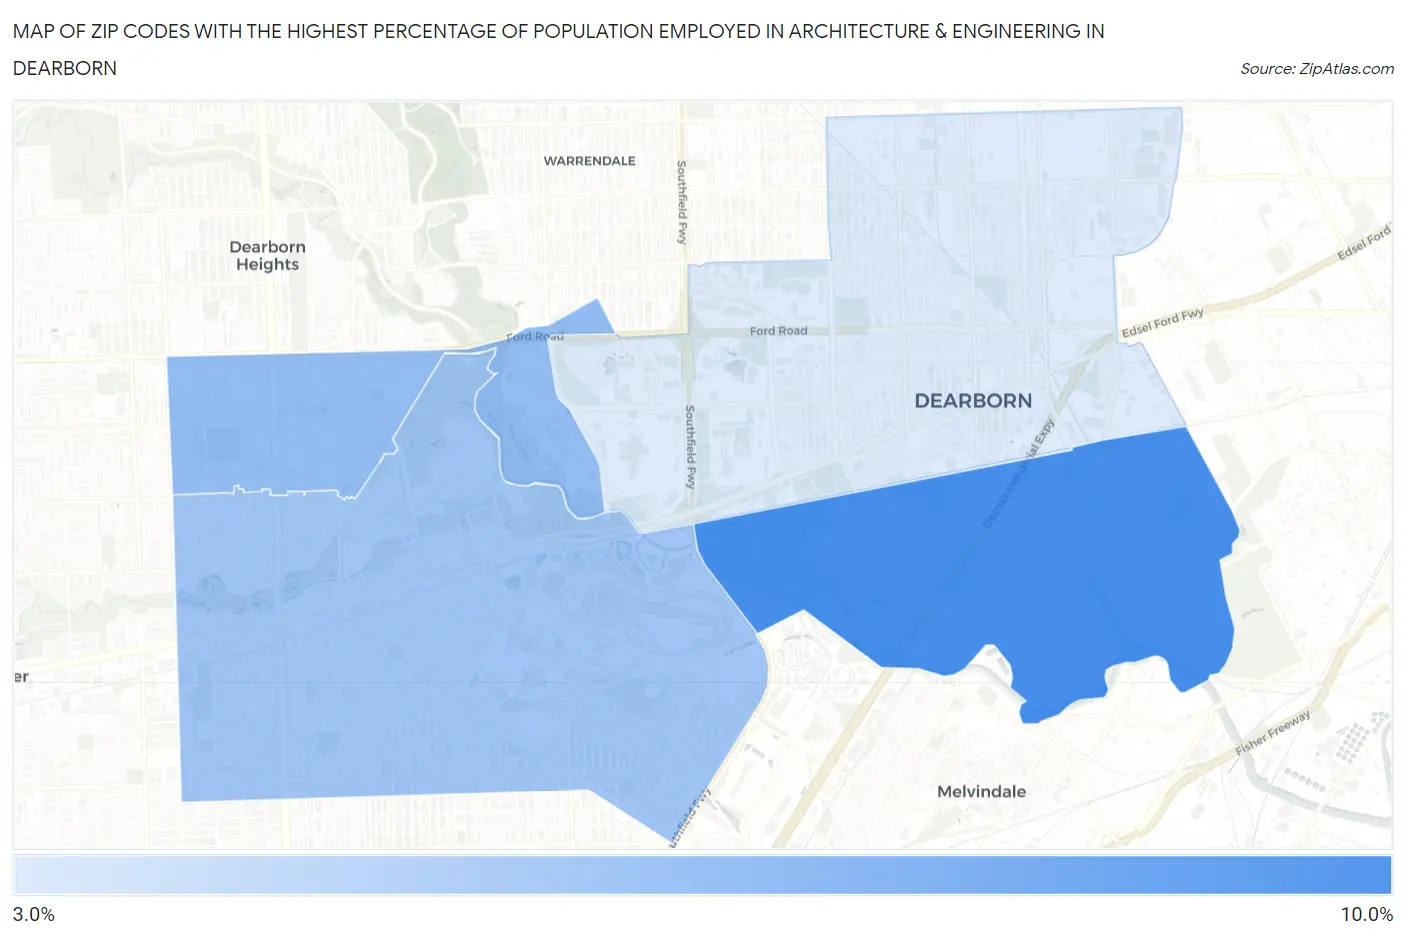
Map of Zip Codes with the Highest Percentage of Population Employed in Architecture & Engineering in Dearborn
3.2%
9.3%
Zip Codes with the Highest Percentage of Population Employed in Architecture & Engineering in Dearborn, MI
| Zip Code | % Employed | vs State | vs National | |
| 1. | 48120 | 9.3% | 3.4%(+5.92)#23 | 2.1%(+7.13)#389 |
| 2. | 48128 | 6.2% | 3.4%(+2.81)#67 | 2.1%(+4.03)#1,012 |
| 3. | 48124 | 5.6% | 3.4%(+2.22)#93 | 2.1%(+3.44)#1,289 |
| 4. | 48126 | 3.2% | 3.4%(-0.186)#255 | 2.1%(+1.03)#4,512 |
1
Common Questions
What are the Top 3 Zip Codes with the Highest Percentage of Population Employed in Architecture & Engineering in Dearborn, MI?
Top 3 Zip Codes with the Highest Percentage of Population Employed in Architecture & Engineering in Dearborn, MI are:
What zip code has the Highest Percentage of Population Employed in Architecture & Engineering in Dearborn, MI?
48120 has the Highest Percentage of Population Employed in Architecture & Engineering in Dearborn, MI with 9.3%.
What is the Percentage of Population Employed in Architecture & Engineering in Dearborn, MI?
Percentage of Population Employed in Architecture & Engineering in Dearborn is 5.0%.
What is the Percentage of Population Employed in Architecture & Engineering in Michigan?
Percentage of Population Employed in Architecture & Engineering in Michigan is 3.4%.
What is the Percentage of Population Employed in Architecture & Engineering in the United States?
Percentage of Population Employed in Architecture & Engineering in the United States is 2.1%.