Zip Codes with the Highest Percentage of Households with Income Below $10,000 in Muskegon, MI
RELATED REPORTS & OPTIONS
Household Income | $0-10k
Muskegon
Compare Zip Codes
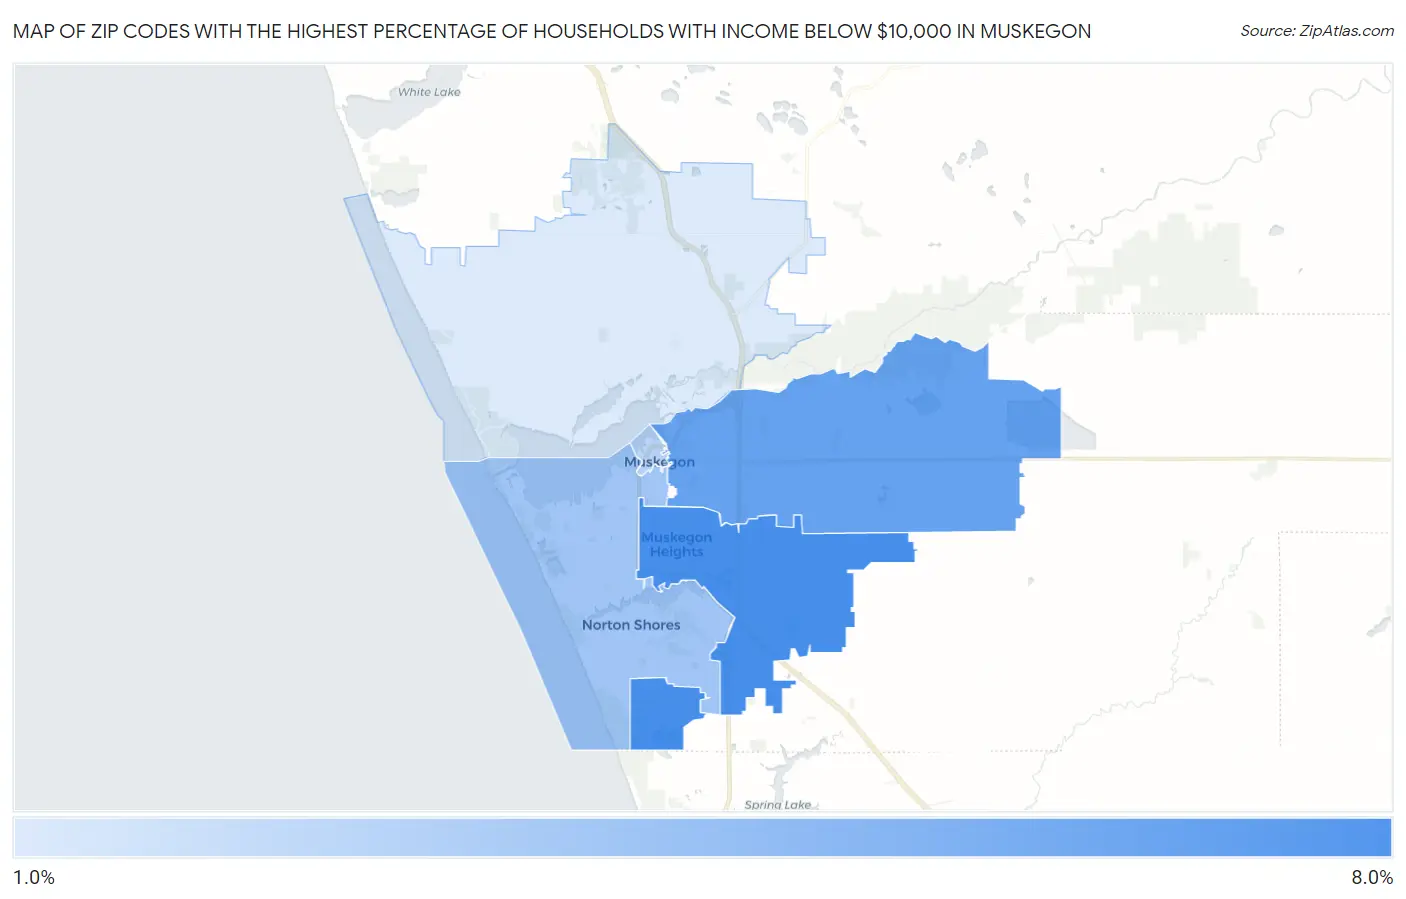
Map of Zip Codes with the Highest Percentage of Households with Income Below $10,000 in Muskegon
1.7%
7.0%
Zip Codes with the Highest Percentage of Households with Income Below $10,000 in Muskegon, MI
| Zip Code | Households with Income < $10k | vs State | vs National | |
| 1. | 49444 | 7.0% | 5.0%(+2.00)#139 | 4.9%(+2.10)#6,960 |
| 2. | 49442 | 5.9% | 5.0%(+0.900)#213 | 4.9%(+1.00)#9,201 |
| 3. | 49441 | 3.8% | 5.0%(-1.20)#480 | 4.9%(-1.10)#15,997 |
| 4. | 49440 | 3.0% | 5.0%(-2.00)#611 | 4.9%(-1.90)#19,657 |
| 5. | 49445 | 1.7% | 5.0%(-3.30)#810 | 4.9%(-3.20)#24,736 |
1
Common Questions
What are the Top 3 Zip Codes with the Highest Percentage of Households with Income Below $10,000 in Muskegon, MI?
Top 3 Zip Codes with the Highest Percentage of Households with Income Below $10,000 in Muskegon, MI are:
What zip code has the Highest Percentage of Households with Income Below $10,000 in Muskegon, MI?
49444 has the Highest Percentage of Households with Income Below $10,000 in Muskegon, MI with 7.0%.
What is the Percentage of Households with Income Below $10,000 in Muskegon, MI?
Percentage of Households with Income Below $10,000 in Muskegon is 7.6%.
What is the Percentage of Households with Income Below $10,000 in Michigan?
Percentage of Households with Income Below $10,000 in Michigan is 5.0%.
What is the Percentage of Households with Income Below $10,000 in the United States?
Percentage of Households with Income Below $10,000 in the United States is 4.9%.