Zip Codes with the Highest Percentage of Households with Income Below $10,000 in Pontiac, MI
RELATED REPORTS & OPTIONS
Household Income | $0-10k
Pontiac
Compare Zip Codes
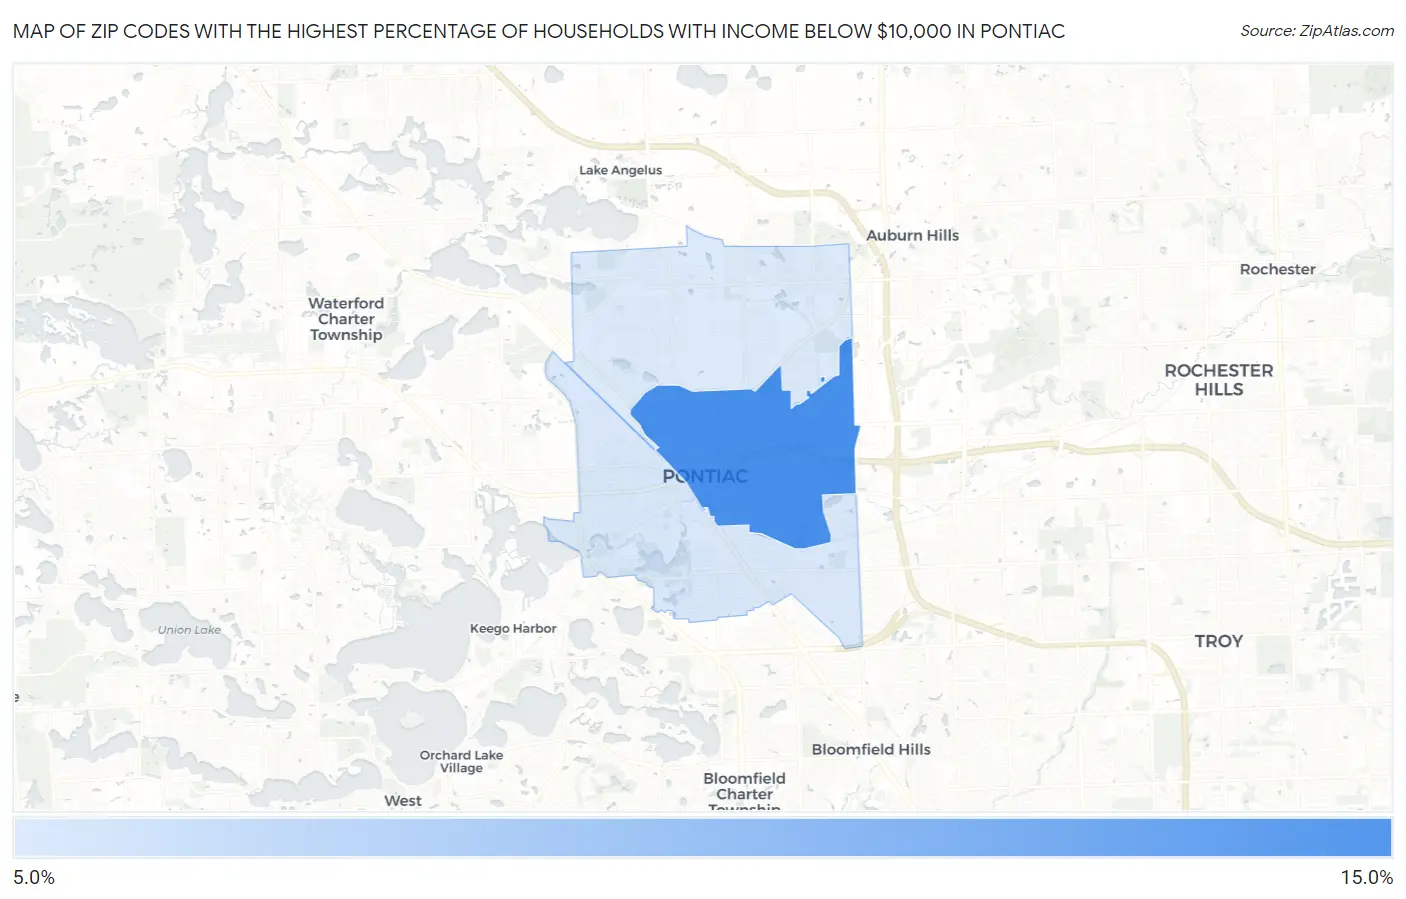
Map of Zip Codes with the Highest Percentage of Households with Income Below $10,000 in Pontiac
10.0%
13.2%
Zip Codes with the Highest Percentage of Households with Income Below $10,000 in Pontiac, MI
| Zip Code | Households with Income < $10k | vs State | vs National | |
| 1. | 48342 | 13.2% | 5.0%(+8.20)#34 | 4.9%(+8.30)#1,999 |
| 2. | 48341 | 10.1% | 5.0%(+5.10)#64 | 4.9%(+5.20)#3,501 |
| 3. | 48340 | 10.0% | 5.0%(+5.00)#66 | 4.9%(+5.10)#3,571 |
1
Common Questions
What are the Top Zip Codes with the Highest Percentage of Households with Income Below $10,000 in Pontiac, MI?
Top Zip Codes with the Highest Percentage of Households with Income Below $10,000 in Pontiac, MI are:
What zip code has the Highest Percentage of Households with Income Below $10,000 in Pontiac, MI?
48342 has the Highest Percentage of Households with Income Below $10,000 in Pontiac, MI with 13.2%.
What is the Percentage of Households with Income Below $10,000 in Pontiac, MI?
Percentage of Households with Income Below $10,000 in Pontiac is 10.9%.
What is the Percentage of Households with Income Below $10,000 in Michigan?
Percentage of Households with Income Below $10,000 in Michigan is 5.0%.
What is the Percentage of Households with Income Below $10,000 in the United States?
Percentage of Households with Income Below $10,000 in the United States is 4.9%.