Zip Codes with the Highest Percentage of Households with Income Below $10,000 in Southfield, MI
RELATED REPORTS & OPTIONS
Household Income | $0-10k
Southfield
Compare Zip Codes
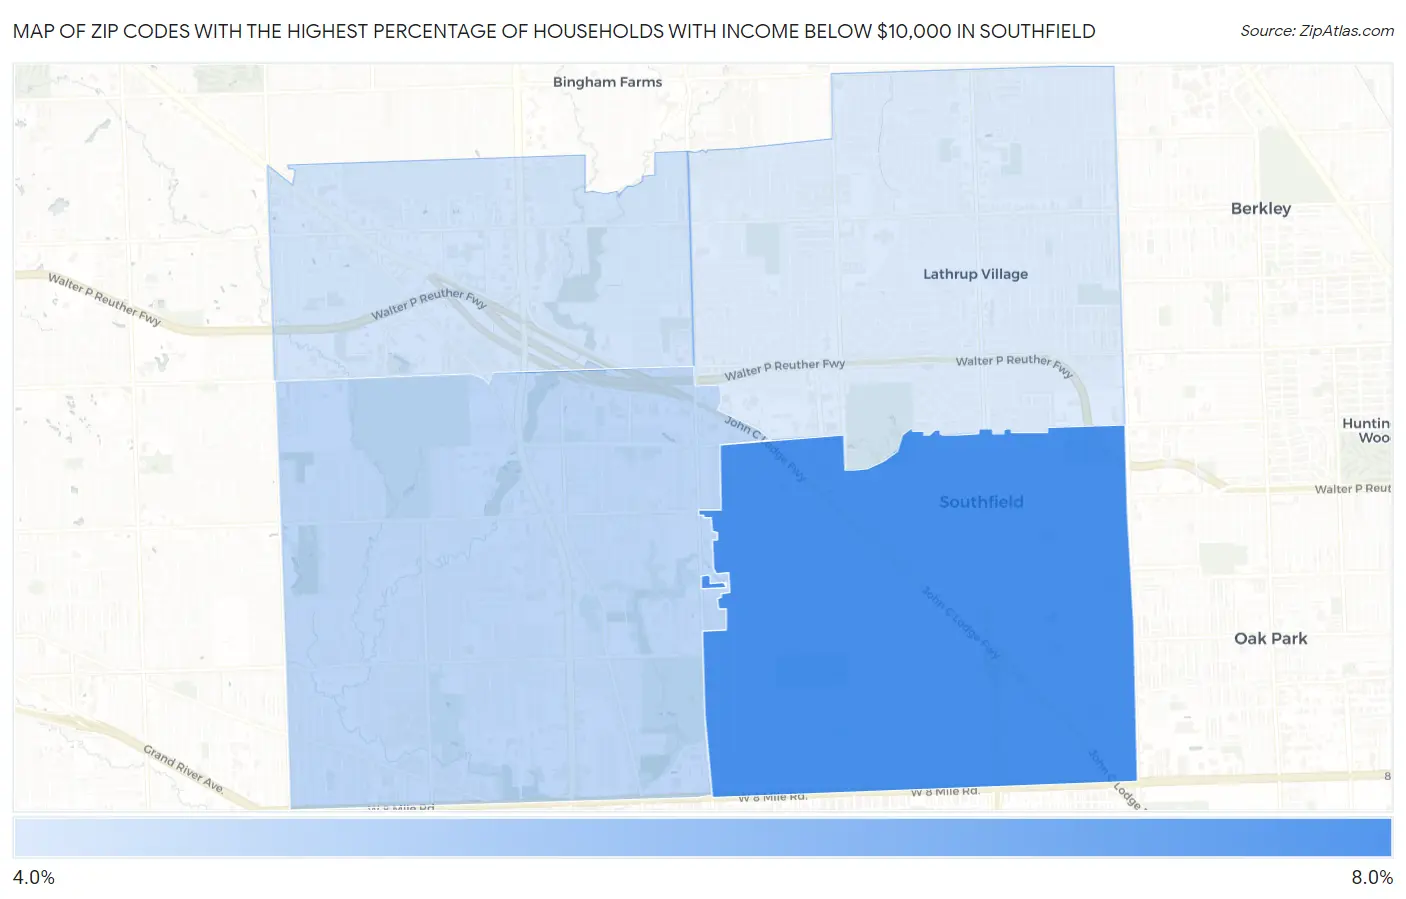
Map of Zip Codes with the Highest Percentage of Households with Income Below $10,000 in Southfield
4.5%
7.4%
Zip Codes with the Highest Percentage of Households with Income Below $10,000 in Southfield, MI
| Zip Code | Households with Income < $10k | vs State | vs National | |
| 1. | 48075 | 7.4% | 5.0%(+2.40)#130 | 4.9%(+2.50)#6,359 |
| 2. | 48033 | 5.1% | 5.0%(+0.100)#282 | 4.9%(+0.200)#11,409 |
| 3. | 48034 | 4.7% | 5.0%(-0.300)#343 | 4.9%(-0.200)#12,721 |
| 4. | 48076 | 4.5% | 5.0%(-0.500)#370 | 4.9%(-0.400)#13,385 |
1
Common Questions
What are the Top 3 Zip Codes with the Highest Percentage of Households with Income Below $10,000 in Southfield, MI?
Top 3 Zip Codes with the Highest Percentage of Households with Income Below $10,000 in Southfield, MI are:
What zip code has the Highest Percentage of Households with Income Below $10,000 in Southfield, MI?
48075 has the Highest Percentage of Households with Income Below $10,000 in Southfield, MI with 7.4%.
What is the Percentage of Households with Income Below $10,000 in Southfield, MI?
Percentage of Households with Income Below $10,000 in Southfield is 5.7%.
What is the Percentage of Households with Income Below $10,000 in Michigan?
Percentage of Households with Income Below $10,000 in Michigan is 5.0%.
What is the Percentage of Households with Income Below $10,000 in the United States?
Percentage of Households with Income Below $10,000 in the United States is 4.9%.