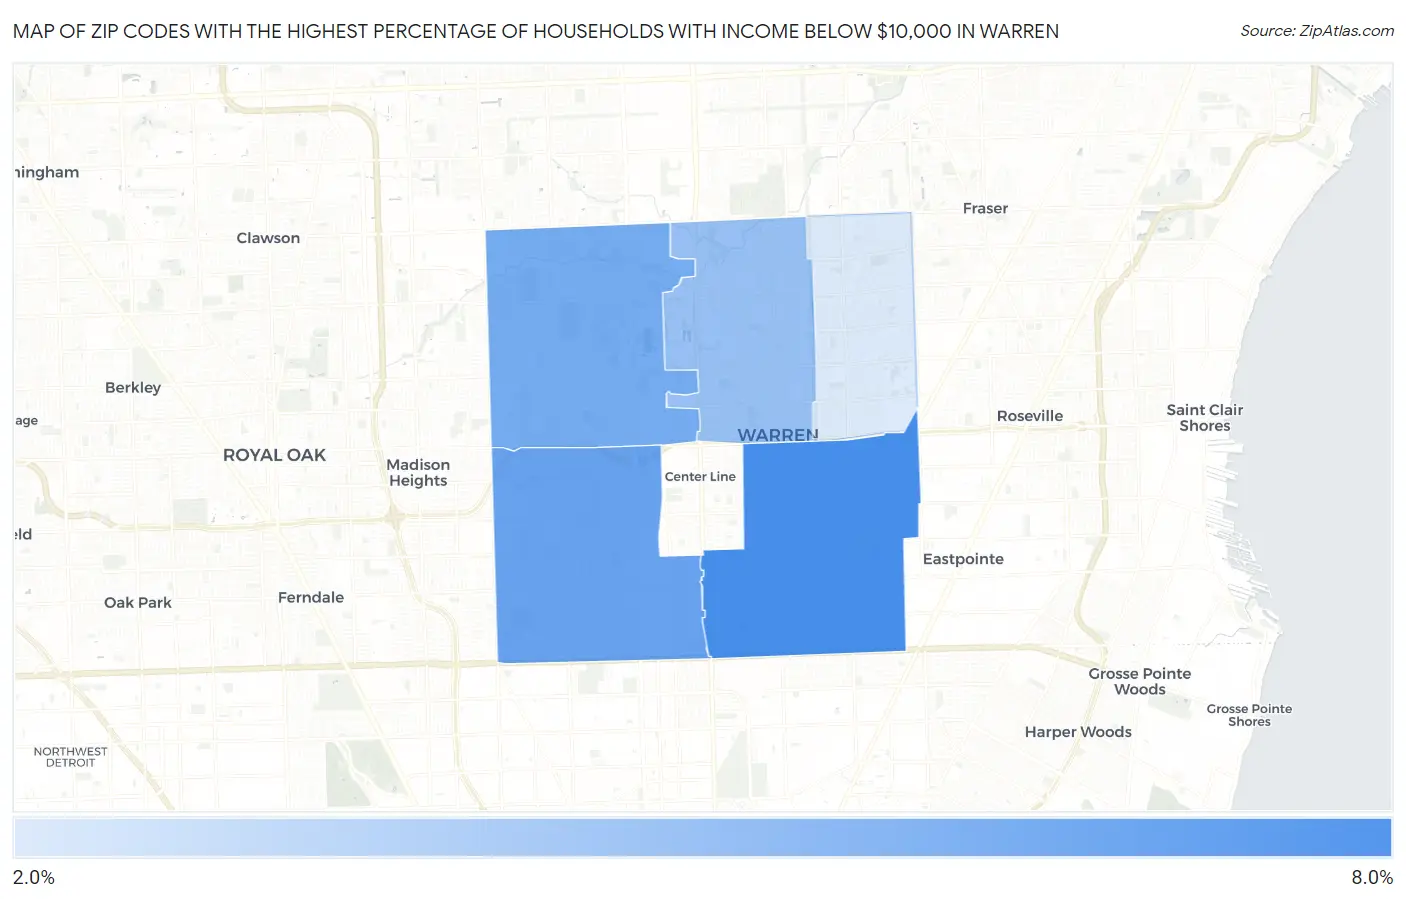
Zip Codes with the Highest Percentage of Households with Income Below $10,000 in Warren, MI
RELATED REPORTS & OPTIONS
Household Income | $0-10k
Warren
Compare Zip Codes
Map of Zip Codes with the Highest Percentage of Households with Income Below $10,000 in Warren
2.2%
7.1%
Zip Codes with the Highest Percentage of Households with Income Below $10,000 in Warren, MI
| Zip Code | Households with Income < $10k | vs State | vs National | |
| 1. | 48089 | 7.1% | 5.0%(+2.10)#135 | 4.9%(+2.20)#6,781 |
| 2. | 48091 | 6.0% | 5.0%(+1.000)#203 | 4.9%(+1.10)#8,991 |
| 3. | 48092 | 5.6% | 5.0%(+0.600)#236 | 4.9%(+0.700)#9,980 |
| 4. | 48093 | 4.4% | 5.0%(-0.600)#384 | 4.9%(-0.500)#13,729 |
| 5. | 48088 | 2.2% | 5.0%(-2.80)#748 | 4.9%(-2.70)#22,887 |
1
Common Questions
What are the Top 3 Zip Codes with the Highest Percentage of Households with Income Below $10,000 in Warren, MI?
Top 3 Zip Codes with the Highest Percentage of Households with Income Below $10,000 in Warren, MI are:
What zip code has the Highest Percentage of Households with Income Below $10,000 in Warren, MI?
48089 has the Highest Percentage of Households with Income Below $10,000 in Warren, MI with 7.1%.
What is the Percentage of Households with Income Below $10,000 in Warren, MI?
Percentage of Households with Income Below $10,000 in Warren is 5.2%.
What is the Percentage of Households with Income Below $10,000 in Michigan?
Percentage of Households with Income Below $10,000 in Michigan is 5.0%.
What is the Percentage of Households with Income Below $10,000 in the United States?
Percentage of Households with Income Below $10,000 in the United States is 4.9%.