Zip Codes with the Highest Percentage of Households with Income Below $10,000 in Bay City, MI
RELATED REPORTS & OPTIONS
Household Income | $0-10k
Bay City
Compare Zip Codes
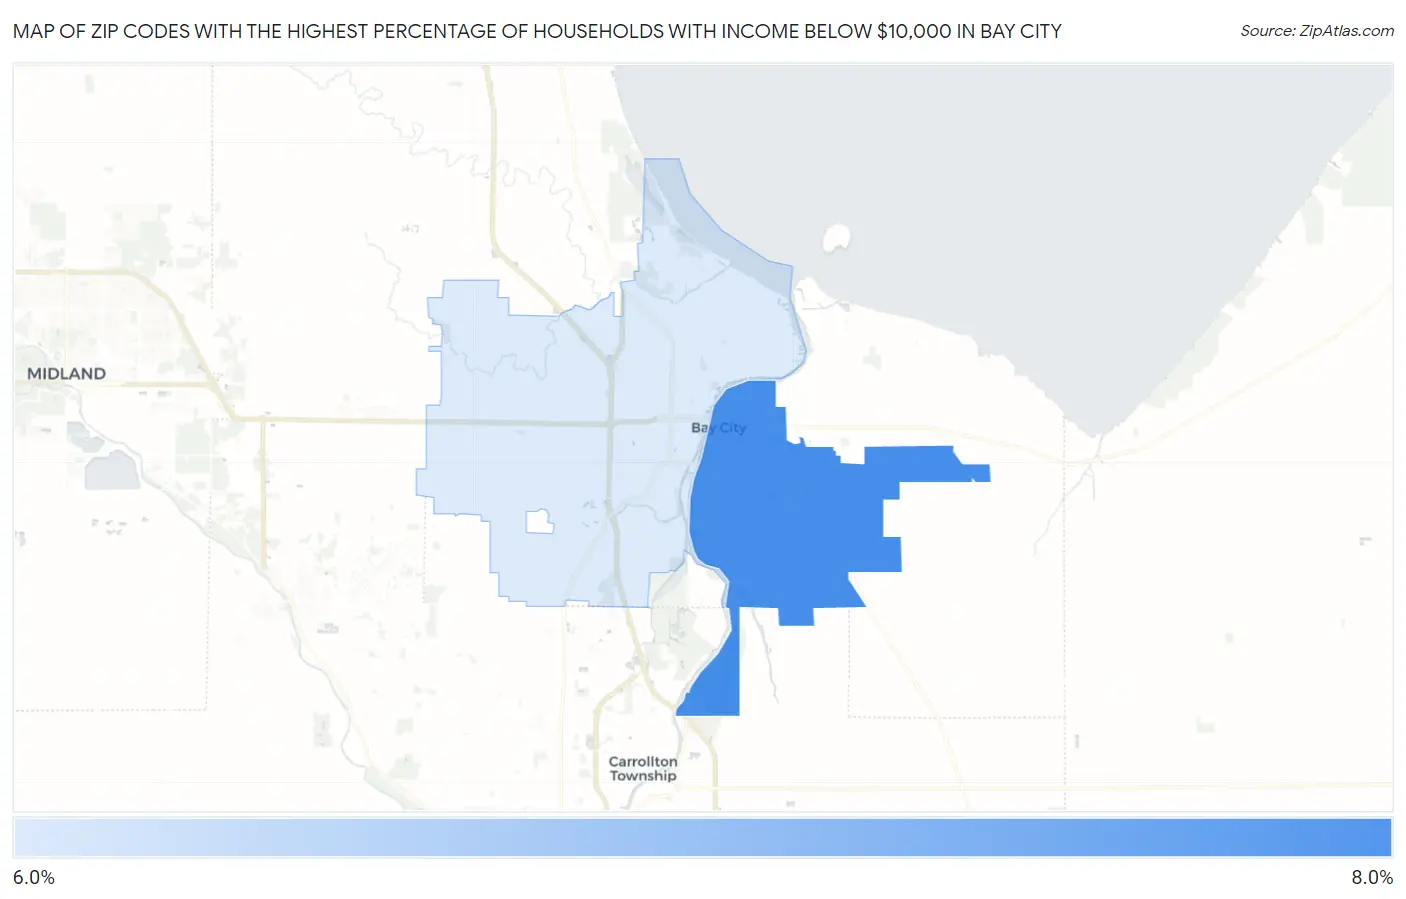
Map of Zip Codes with the Highest Percentage of Households with Income Below $10,000 in Bay City
6.2%
7.0%
Zip Codes with the Highest Percentage of Households with Income Below $10,000 in Bay City, MI
| Zip Code | Households with Income < $10k | vs State | vs National | |
| 1. | 48708 | 7.0% | 5.0%(+2.00)#140 | 4.9%(+2.10)#6,963 |
| 2. | 48706 | 6.2% | 5.0%(+1.20)#182 | 4.9%(+1.30)#8,520 |
1
Common Questions
What are the Top Zip Codes with the Highest Percentage of Households with Income Below $10,000 in Bay City, MI?
Top Zip Codes with the Highest Percentage of Households with Income Below $10,000 in Bay City, MI are:
What zip code has the Highest Percentage of Households with Income Below $10,000 in Bay City, MI?
48708 has the Highest Percentage of Households with Income Below $10,000 in Bay City, MI with 7.0%.
What is the Percentage of Households with Income Below $10,000 in Bay City, MI?
Percentage of Households with Income Below $10,000 in Bay City is 7.1%.
What is the Percentage of Households with Income Below $10,000 in Michigan?
Percentage of Households with Income Below $10,000 in Michigan is 5.0%.
What is the Percentage of Households with Income Below $10,000 in the United States?
Percentage of Households with Income Below $10,000 in the United States is 4.9%.